Proceeding Paper

Warming Projections of Eastern Mediterranean in CMIP6 Simulations According to SSP2-4.5 and SSP5-8.5 Scenarios †

by
Ioannis Logothetis
1,2,*,
Kleareti Tourpali
1 and
Dimitrios Melas
1
1
Laboratory of Atmospheric Physics, Department of Physics, Faculty of Sciences, Aristotle University of Thessaloniki, 54124 Thessaloniki, Greece
2
Centre for Research and Technology Hellas, Chemical Process and Energy Resources Institute, 57001 Thessaloniki, Greece
*
Author to whom correspondence should be addressed.
Presented at the 7th International Electronic Conference on Atmospheric Sciences (ECAS-7), 4–6 June 2025; Available online: https://sciforum.net/event/ECAS2025.
Environ. Earth Sci. Proc. 2025, 34(1), 12; https://doi.org/10.3390/eesp2025034012
Published: 23 September 2025

Abstract

This study investigates the future temperature changes in the climate-vulnerable region of the Eastern Mediterranean. The results from seventeen (17) CMIP6 (6th Phase of Coupled Model Intercomparison Project) model simulations are analyzed. The analysis is focused on the SSP2-4.5 and SSP5-8.5 scenarios. The ERA5 reanalysis is used as a reference dataset to investigate the performance of CMIP6 simulations to accurately reproduce the mean temperature in the Eastern Mediterranean region. The results show that CMIP6 model simulations vary regarding their efficiency for capturing the mean temperature. Future projections show that significant warming is shown during the last period of the 21st century. The continental Balkan and Turkish regions are recognized as the most affected areas regarding future warming. The increase in temperature spatially ranges (in local scale) from 1.5 °C to 4.5 °C for the SSP2-4.5 scenario and from 3.0 °C to 8.0 °C for the SSP5-8.5 scenario. Finally, the seasonal analysis indicates that summer (JJA) shows the maximum temperature increase compared with the other seasons.

1. Introduction

The Mediterranean region is located in the mid-latitudes and characterized by temperate climate conditions. Additionally, it is at a climatic crossroad where the humid and mild European climate as well as the hot and arid African climate affect the Mediterranean climate [1]. This sensitive area shows warming 20% faster than the global average [2,3,4]. Furthermore, during the last decades the warming has seemed to accelerate [3,5]. Future global climate model (GCM) projections (CMIP5 and CMIP6 simulations) show that drying and warming rates will be increased over the Mediterranean region in comparison to other areas [1]. The maximum changes are shown during the summer period. Additionally, the projections show that the future mean temperature, summer extremes and the frequency of heatwaves will increase [6]. The warming in combination with the decline of precipitation over the Mediterranean area will be some of the dominant factors that increase the climate and socioeconomic risks for this area [1].
GCMs are state-of-the-art tools for climate science. The sixth phase of the Coupled Model Intercomparison Project (CMIP6) involves the latest generation of GCMs that runs in numerous institutes and research centres globally. The main questions that CMIP6 is expected to give an answer to are (a) the impact of climate forcing on the Earth’s climate, (b) the better understanding of model simulation biases, (c) the alternation of future climate (climate variability, predictability, etc.) [7]. The fifth generation reanalysis dataset of ECMWF (ERA5) combines observations with modelling techniques to provide numerous meteorological and climatological parameters during the period from 1940 to the present. The ERA5 dataset contributes significantly to climate and environmental investigations [8].
This work studies (a) the ability of seventeen (17) CMIP6 model simulations to reproduce the temporal and distributional features of mean temperature averaged over the Eastern Mediterranean using data from ERA5 as the reference, (b) whether the simulations provide warming projections for various model simulations of CMIP6 over one high-interest area regarding its climate vulnerability. In general, the findings from CMIP6 project show stronger warming compared with the previous CMIP phase [1]. This study investigates the future changes in the Eastern Mediterranean (EMed) temperature for two SSPs (SSP2-4.5 and SSP5-8.5; period from 2015 to 2100) with reference to a historical period from 1970 to 2005 (considered as the basis period). Finally, the calculation of the temperature differences between the future and basis period over annual, monthly and seasonal scales indicates the season that shows the maximum temperature changes.
This work is organized as follows: In Section 2 (“Materials and Methods”) the data and methodology that are used in this study are presented. In Section 3 (“Results”) the findings of the analyses and a short discussion are presented. Finally the main results are concluded in Section 4 “Conclusions”.

2. Materials and Methods

2.1. Data and Region of Study

The monthly mean near-surface temperature (tas) of seventeen (17) new-generation model simulations available in the sixth phase of the Coupled Model Intercomparison Project (CMIP6) which underpins the sixth Assessment Report of the IPCC [9] are studied here. Table 1 provides elements regarding the simulations that are used in this study. In particular, the temperature results from the CMIP6 model simulations, under two Shared Socioeconomic Pathways scenarios (SSPs), are studied during the future period. SSPs are scenarios that consider alternative socioeconomic and demographic development. They are used by the climate change research community to investigate possible future climate change [10]. Generally, SSP2-4.5 is the “middle of the road” (moderate) scenario where the radiative forcing rises to 4.5 W/m2 till 2070 and then drops. The SSP5-8.5 scenario is the extreme scenario where the radiative forcing rises to 8.5 W/m2 till the end of the 21st century. All the SSPs involve the socioeconomic axes of urbanization, education, population and economic development as drivers for the evolution of future climate [11].
ERA5 monthly mean temperature data over the region of the Eastern Mediterranean, which are freely available in Copernicus Climate Change Service Climate Data Store (https://cds.climate.copernicus.eu/ accessed on 16 September 2024), are retrieved and analyzed. These data are used as the reference dataset. The analysis focuses on a geographical window that includes the region of the southeastern Mediterranean (15° to 40° E, 30° to 45° N, hereafter EMed; Figure 1).

2.2. The Performance of CMIP6 Models to Simulate the Annual Mean Temperature Averaged over EMed

The Kling–Gupta Combined Statistical Index (KGE) is calculated for each one of Global Climate Models (GCMs) using the temperature data from ERA5 as the reference dataset for the historical period from 1970 to 2005 (basis period) [12]. In general, KGE is considered as an appropriate index to investigate the accuracy of GCMs regarding their efficiency to reproduce climatic variables such as temperature [13], reflecting both the temporal and distributional features. For the calculation of KGE the following Equation (1) is used:
K G E = 1 r 1 2 + σ s σ 0 1 2 + μ s μ 0 1 2
where r is the Pearson’s correlation coefficient between CMIP6 model simulations and ERA5, σ s and σ 0 are the standard deviations of CMIP6 model simulations and ERA5 and the μ s and μ 0 are the averages of CMIP6 model simulations and ERA5. The KGE values range from −∞ to 1. The values that are closer to 1 correspond to a better model performance [14].

2.3. Temperature Projections and Trend Analysis over EMed: The Last Period of 21st Century

The time series of annual mean temperature averaged over the EMed regions is calculated in order to investigate the temperature evolution over EMed according to the SSP2-4.5 and SSP5-8.5 scenarios. Furthermore, the differences between the last period of the 21st century and the historical basis period are calculated for each of the model simulations. For the calculation of the statistical significance of the differences, the two-tailed t-test at 99% is used. For the future period from 2070 to 2100, where the maximum temperature changes are identified, the temperature trend for each of the model simulations is calculated. For the statistical significance of the calculated temperature trends (°C/decade), the Mann–Kendall statistical significance test is revealed at the 99% level. In order to illustrate the results of these analyses, related maps are constructed. Finally, a boxplot of seasonal (DJF, MAM, JJA and SON) and annual (Ann.) as well as monthly mean temperature anomalies between the last period of the 21st century (for SSP2-4.5 and SSP5-8.5) and the basis historical period is constructed in order to investigate the temperature changes over the seasons.

3. Results

3.1. Accuracy of CMIP6 Simulations to Capture and Reproduce the Annual Mean EMed Temperature

The calculation of the temperature bias of the CMIP6 annual mean EMed temperature relative to ERA5 data ranges from −3.9 °C to 2.7 °C. Nine out of seventeen (9/17) simulations show a temperature bias lower than 1.5 σ 0 (Figure 2). Additionally, the calculation of the KGE index shows that the ACCESS-ESM1-5, CMCC-CM2-SR5, INM-CM5-0, IPSL-CM6A-LR and MIROC6 present moderate KGE values (0.4 ≤ KGE < 0.47). These GCMs provide a better performance than the other CMIP6 simulations in capturing the temporal and distributional features of annual mean EMed temperature. In particular, the MIROC-ES2L and GFDL-ESM4 show KGE values between 0.3 and 0.4 (0.3 ≤ KGE < 0.4). The other GCMs present a positive but lower than 0.3 KGE (KGE < 0.3). Note that CanESM5, GISS-E2-1-G and HadGEM3-GC31-LL show negative KGE values (KGE < 0). The analysis by Zareian et al. [13] has shown that for the western Turkey area the KGE (as a measure for CMIP6 spatial temperature performance) ranges from −0.2 to 0.4 and the majority of model simulations have shown that the KGE values fluctuates between 0.2 and 0.4 [13].

3.2. Future Temperature Changes over EMed

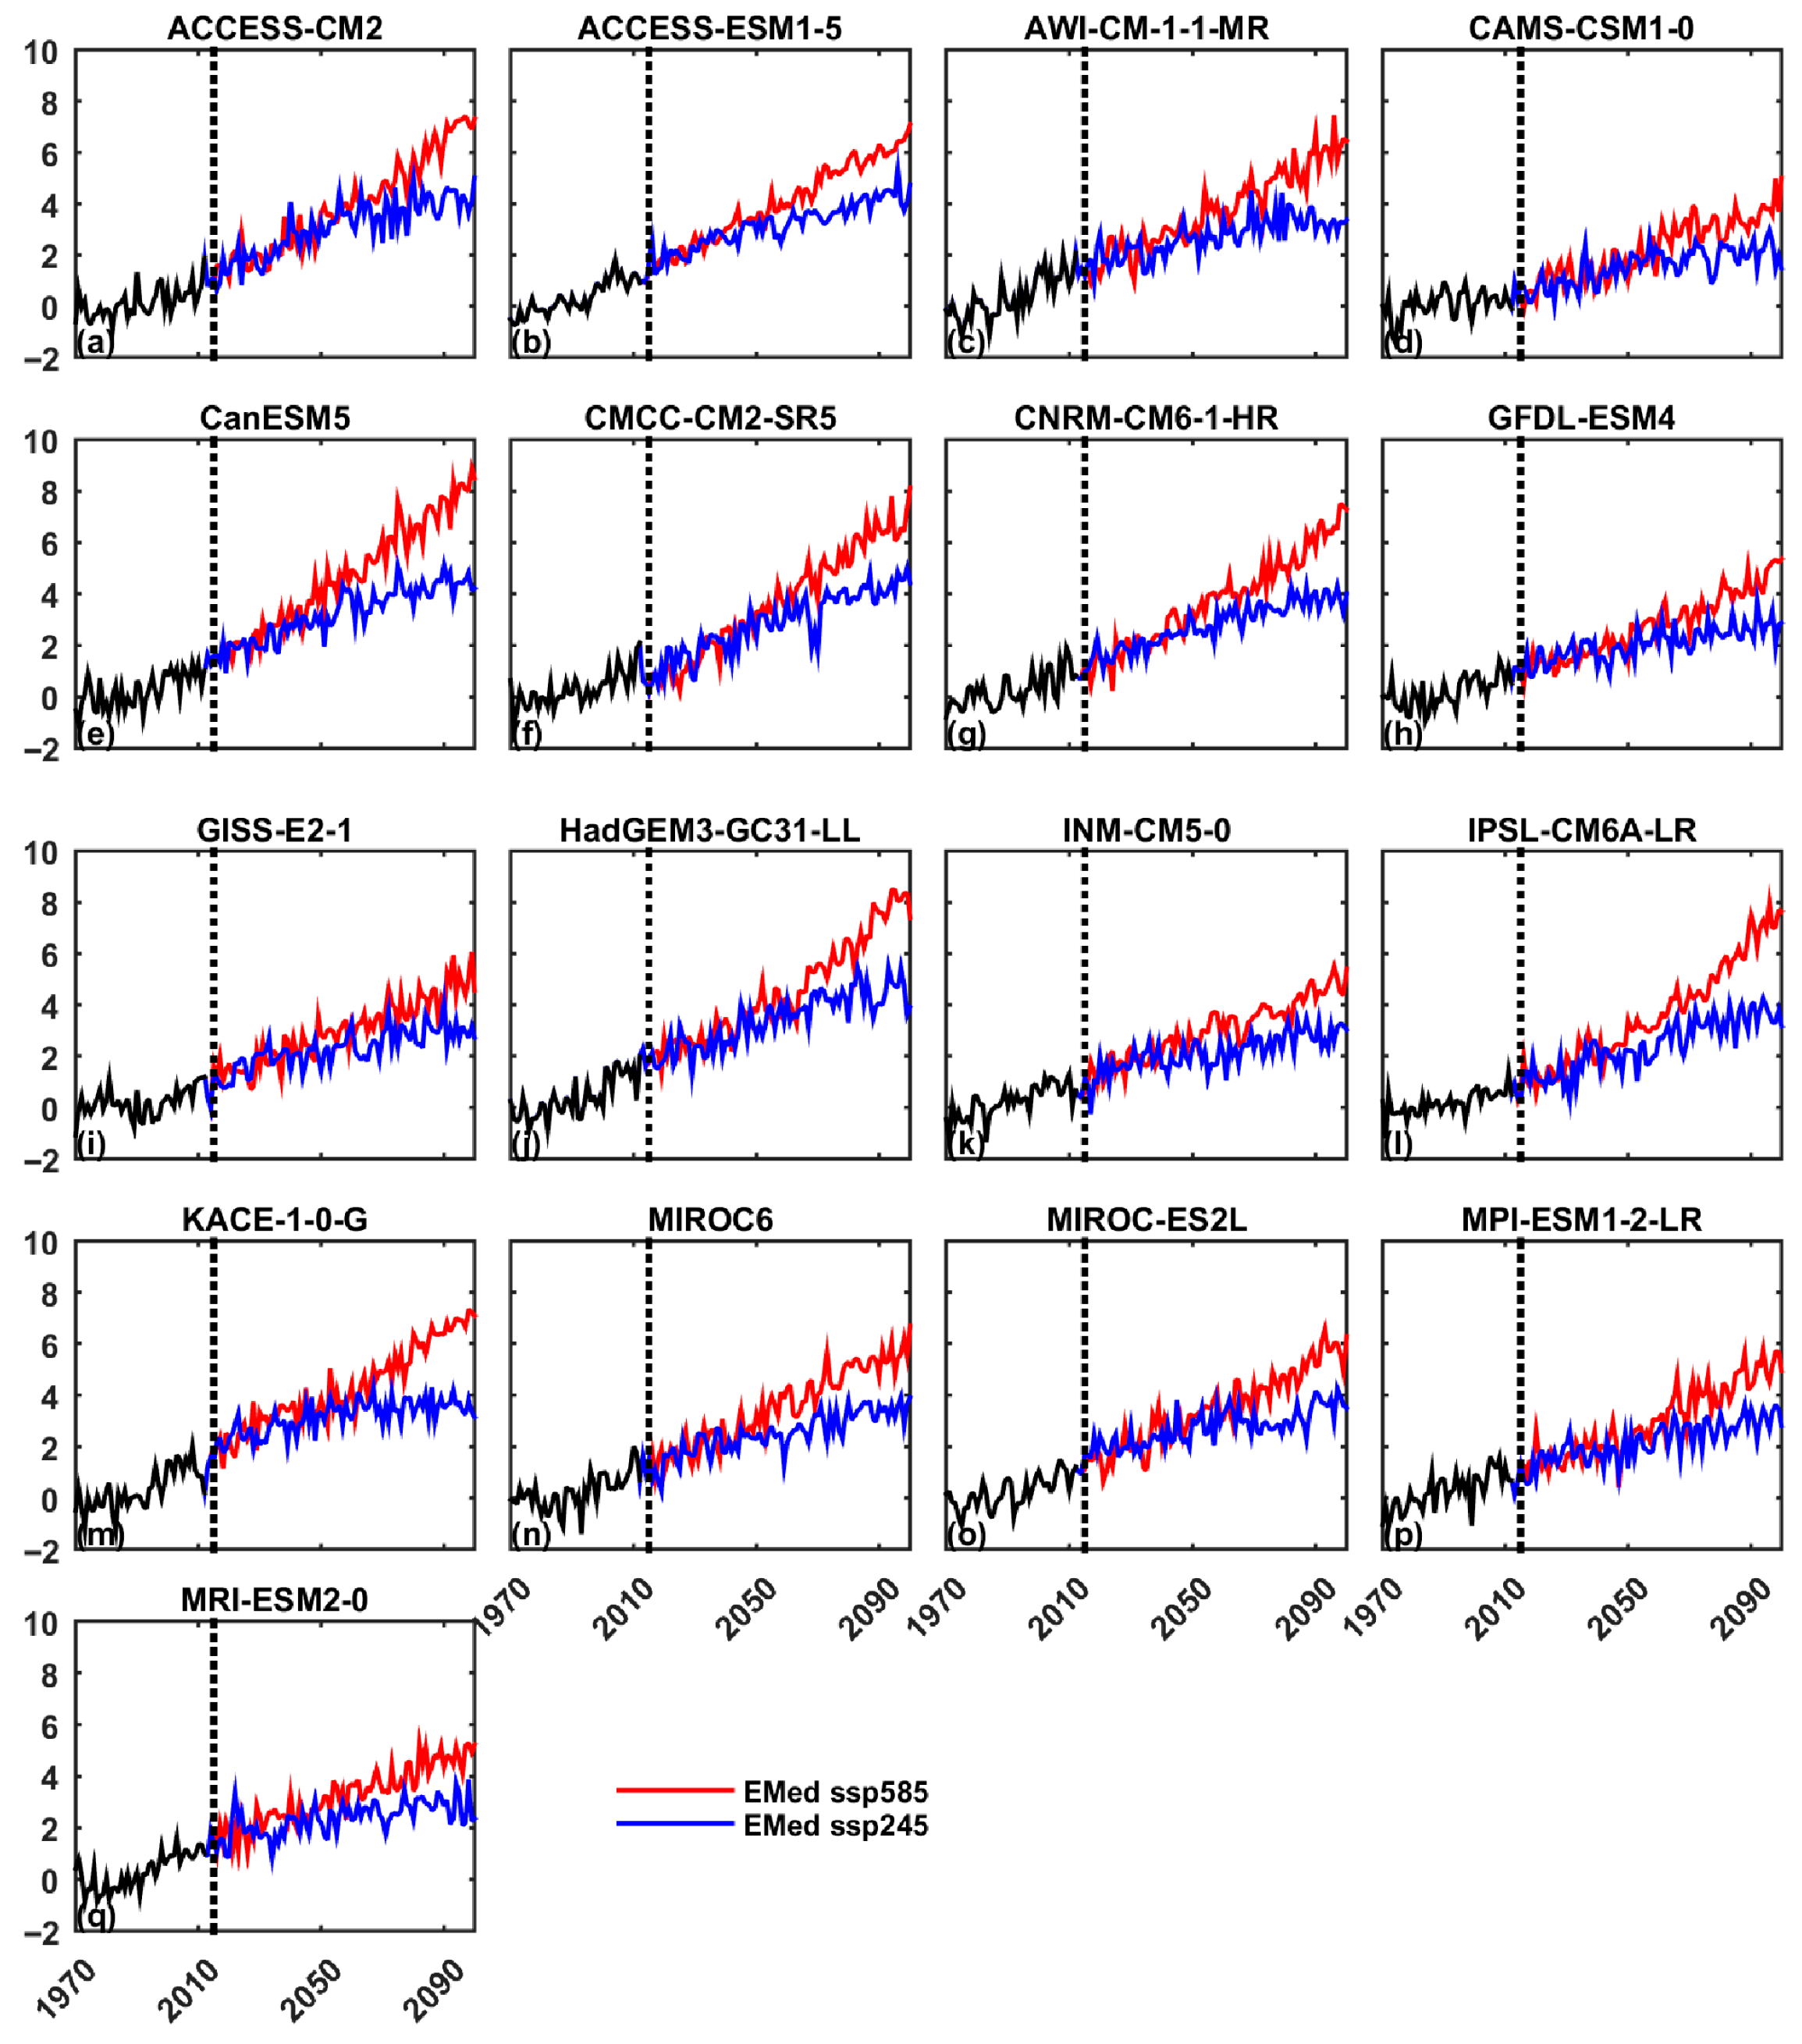
The analyses of CMIP6 model simulations show that all GCMs present an increase in the averaged, annual mean EMed temperature until the end of the 21st century. Figure 3 shows the anomalies of mean EMed temperature (with respect to basis period; 1970–2005) for the historical and future periods both for the SSP2-4.5 and SSP5-8.5 scenarios. The maximum changes are shown according to SSP5-8.5 scenario, where the EMed warming ranges from 4 °C to 8 °C at the end of 21st century. For the SSP2-4.5 scenario, EMed warming ranges from 2 °C to 4 °C. The majority of GCMs show that after the middle 21st century the CMIP6 simulations show an increased temperature trend in the SSP8.5 scenario compared with the SSP2-4.5 scenario (Figure 3). Tebaldi et al. [15] have shown that the global mean temperature increases at the end of 21st century by about 4.5 °C (according to the SSP5-8.5 scenario) and about 2 °C (according to the SSP2-4.5 scenario) with respect to the period from 1995 to 2014. The synergy between the decline of aerosols (changing the radiative forcing) and the reduction in near-surface soil moisture possibly explains this warming trend [3].
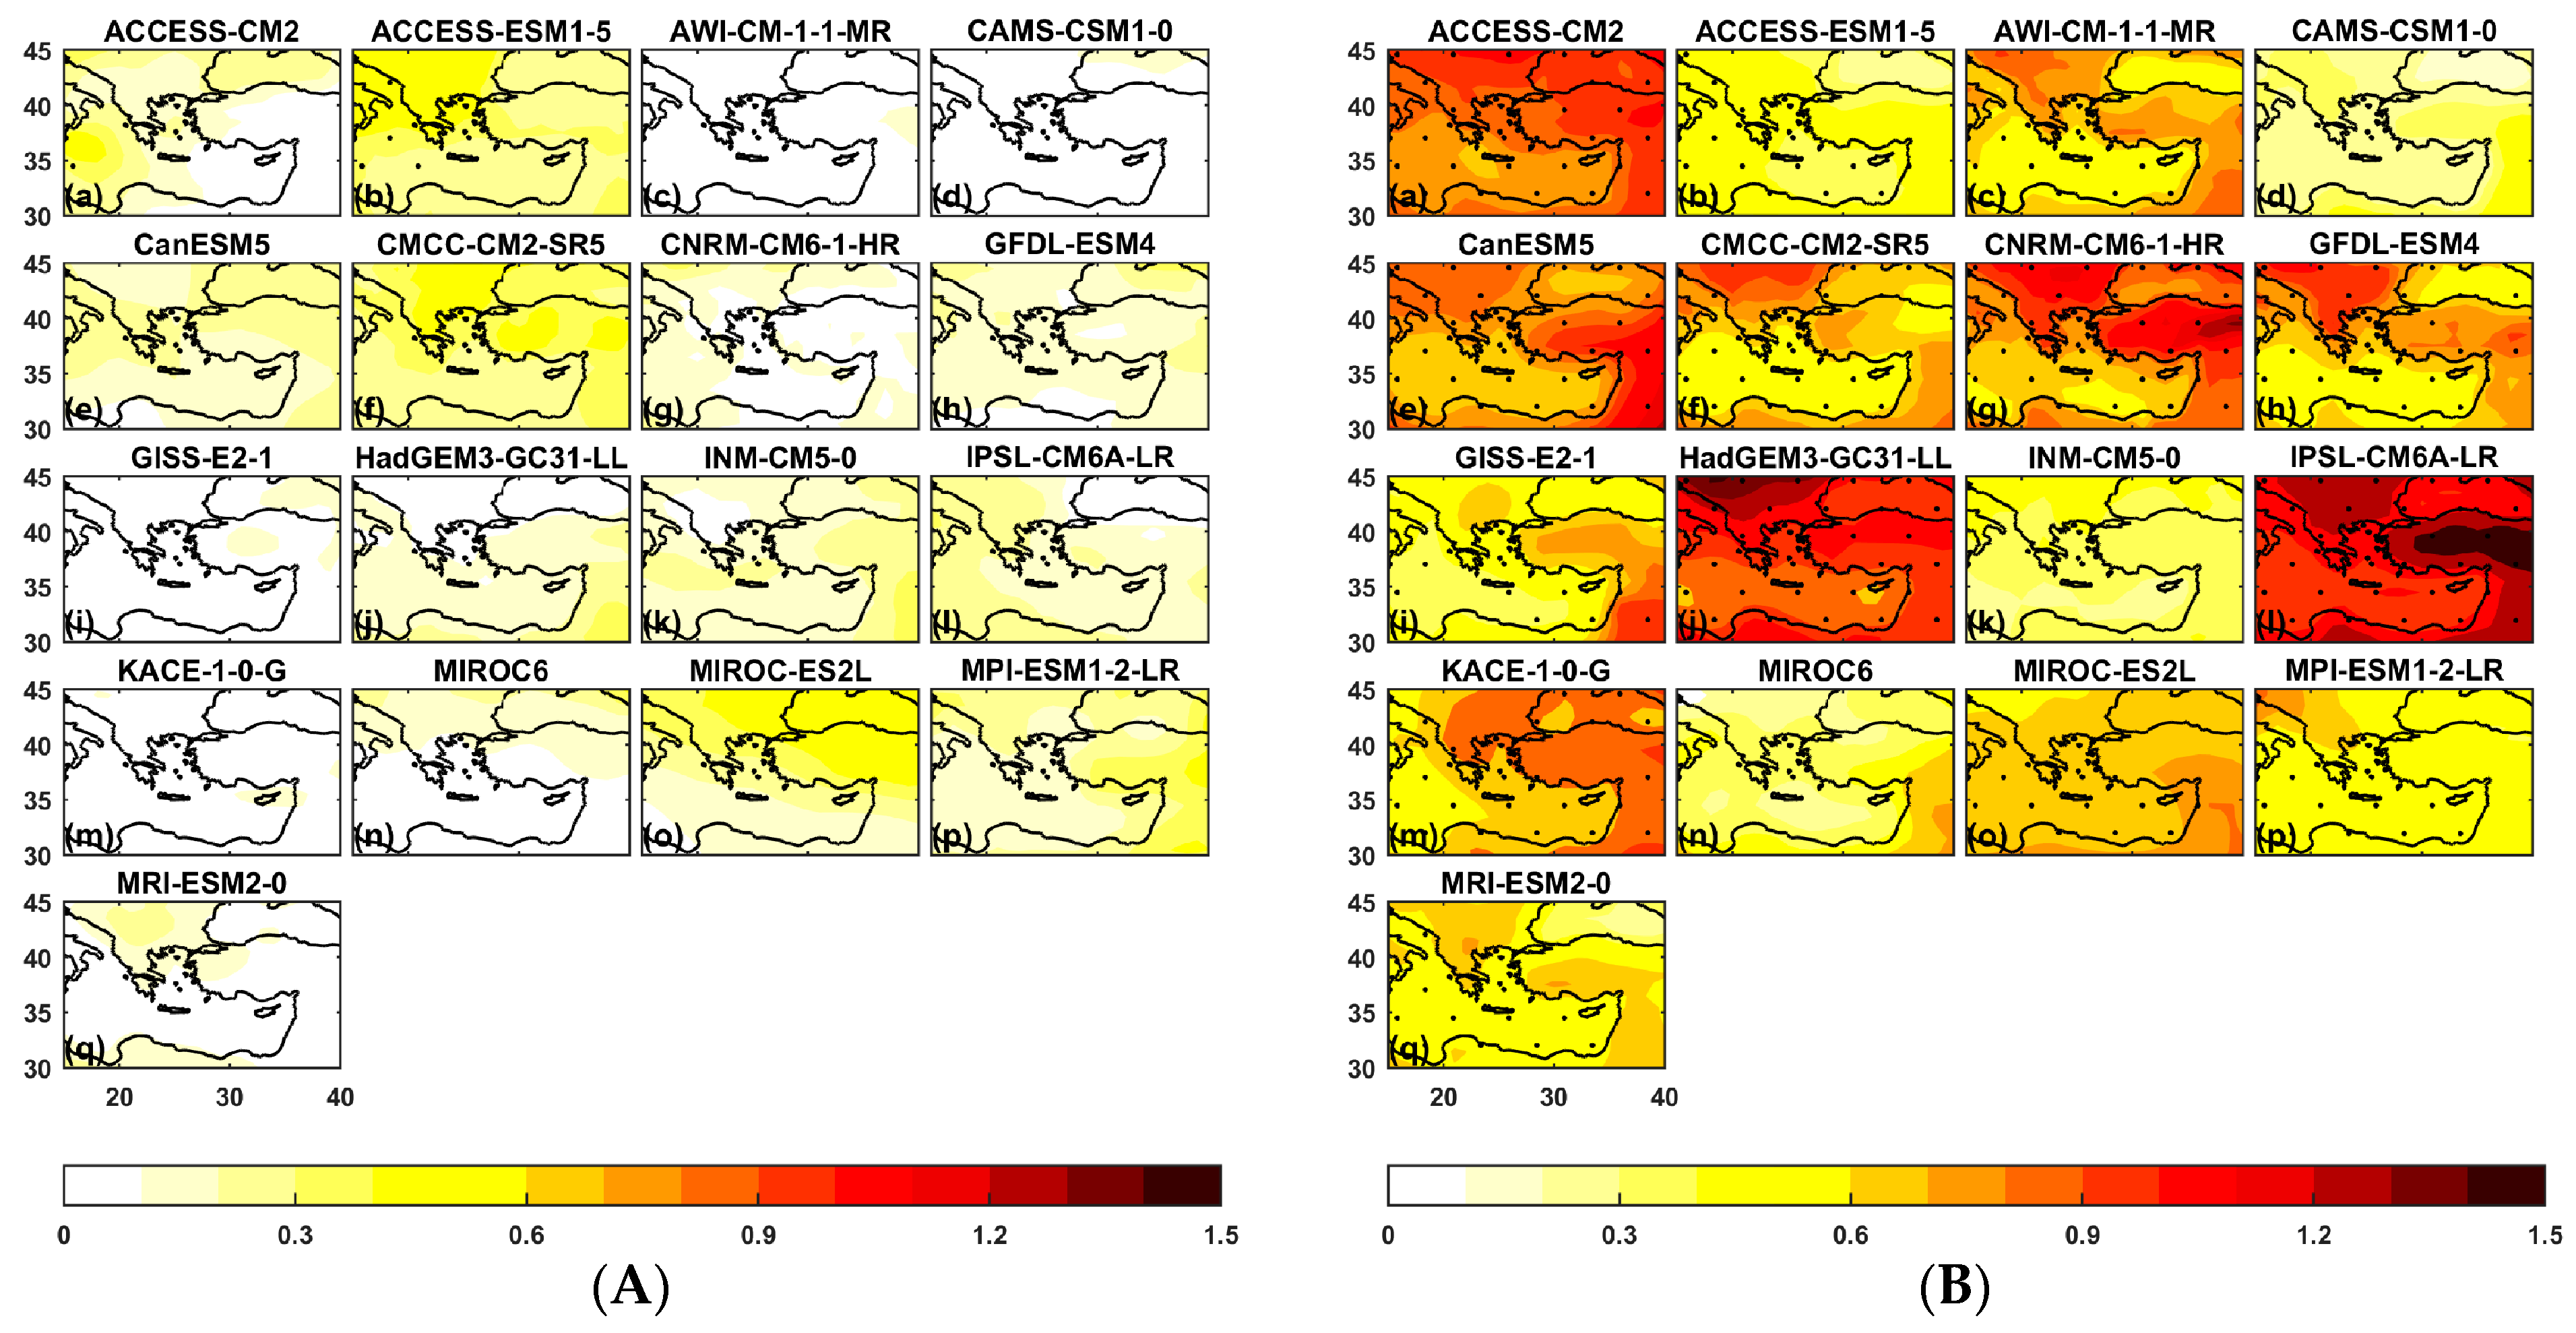
The CMIP6 simulations show that the maximum temperature changes are shown during the last period of the 21st century. Focusing on the period from 2070 to 2100, the differences in annual mean EMed temperature (with respect to the basis period) show that the SSP5-8.5 scenario presents increased temperatures compared with the SSP2-4.5 scenario, showing similar spatial patterns but a (clear) higher temperature for SSP5-8.5 (Figure 4). In particular, for the SSP2-4.5 scenario, CMIP6 model simulations show an increase in EMed temperature during the future period that ranges locally from 1.5 °C to 4.5 °C (Figure 4A). The analysis shows that the CMIP6 model mean presents an increase for the EMed temperature related to the basis period of about 3.4 °C (95% CI: [2.89, 3.83]). The maximum changes are presented over the continental areas. For the SSP5-8.5 scenario the GCMs show an increased EMed temperature which varies from 3 °C to 8 °C. In particular, the EMed temperature for the CMIP6 model mean shows a warming with respect to the basis period of about 5.1 °C (95% CI: [4.27, 5.69]). The maximum changes (for both SSPs) are presented over the continental area (mainly over Turkey and north Greece) (Figure 4). The findings show that the EMed warming varies among the different GCMs (Figure 4). Previous studies have shown that the southeastern Mediterranean (and north latitudes) shows the maximum warming over Europe of ~3 °C to 4 °C [6,16,17,18]. The differences among the CMIP6 for projecting the long-term warming are related to the climate sensitivity of each model simulation. This feature in combination with different future climate scenarios (SSPs) reduces the uncertainties and improves the ability of GCMs to capture the possible future climate changes [19].
Figure 5 shows the temperature trend (°C/decade) for the last period of the 21st century both for the SSP2-4.5 and SSP5-8.5 scenarios. In 13 out of 17 (13/17) model simulations the maximum warming trend is presented over continental areas of Turkey and the Balkan Peninsula indicating that these areas are more prone to climate change and extreme conditions compared with the other EMed regions. For the SSP2-4.5 scenario the warming ranges from 0.0 to 0.4 °C/decade (Figure 5A). The SSP5-8.5 scenario shows increased trends (compared with the SSP2-4.5 scenario) that range from 0.4 to 1.5 °C/decade (Figure 5B).
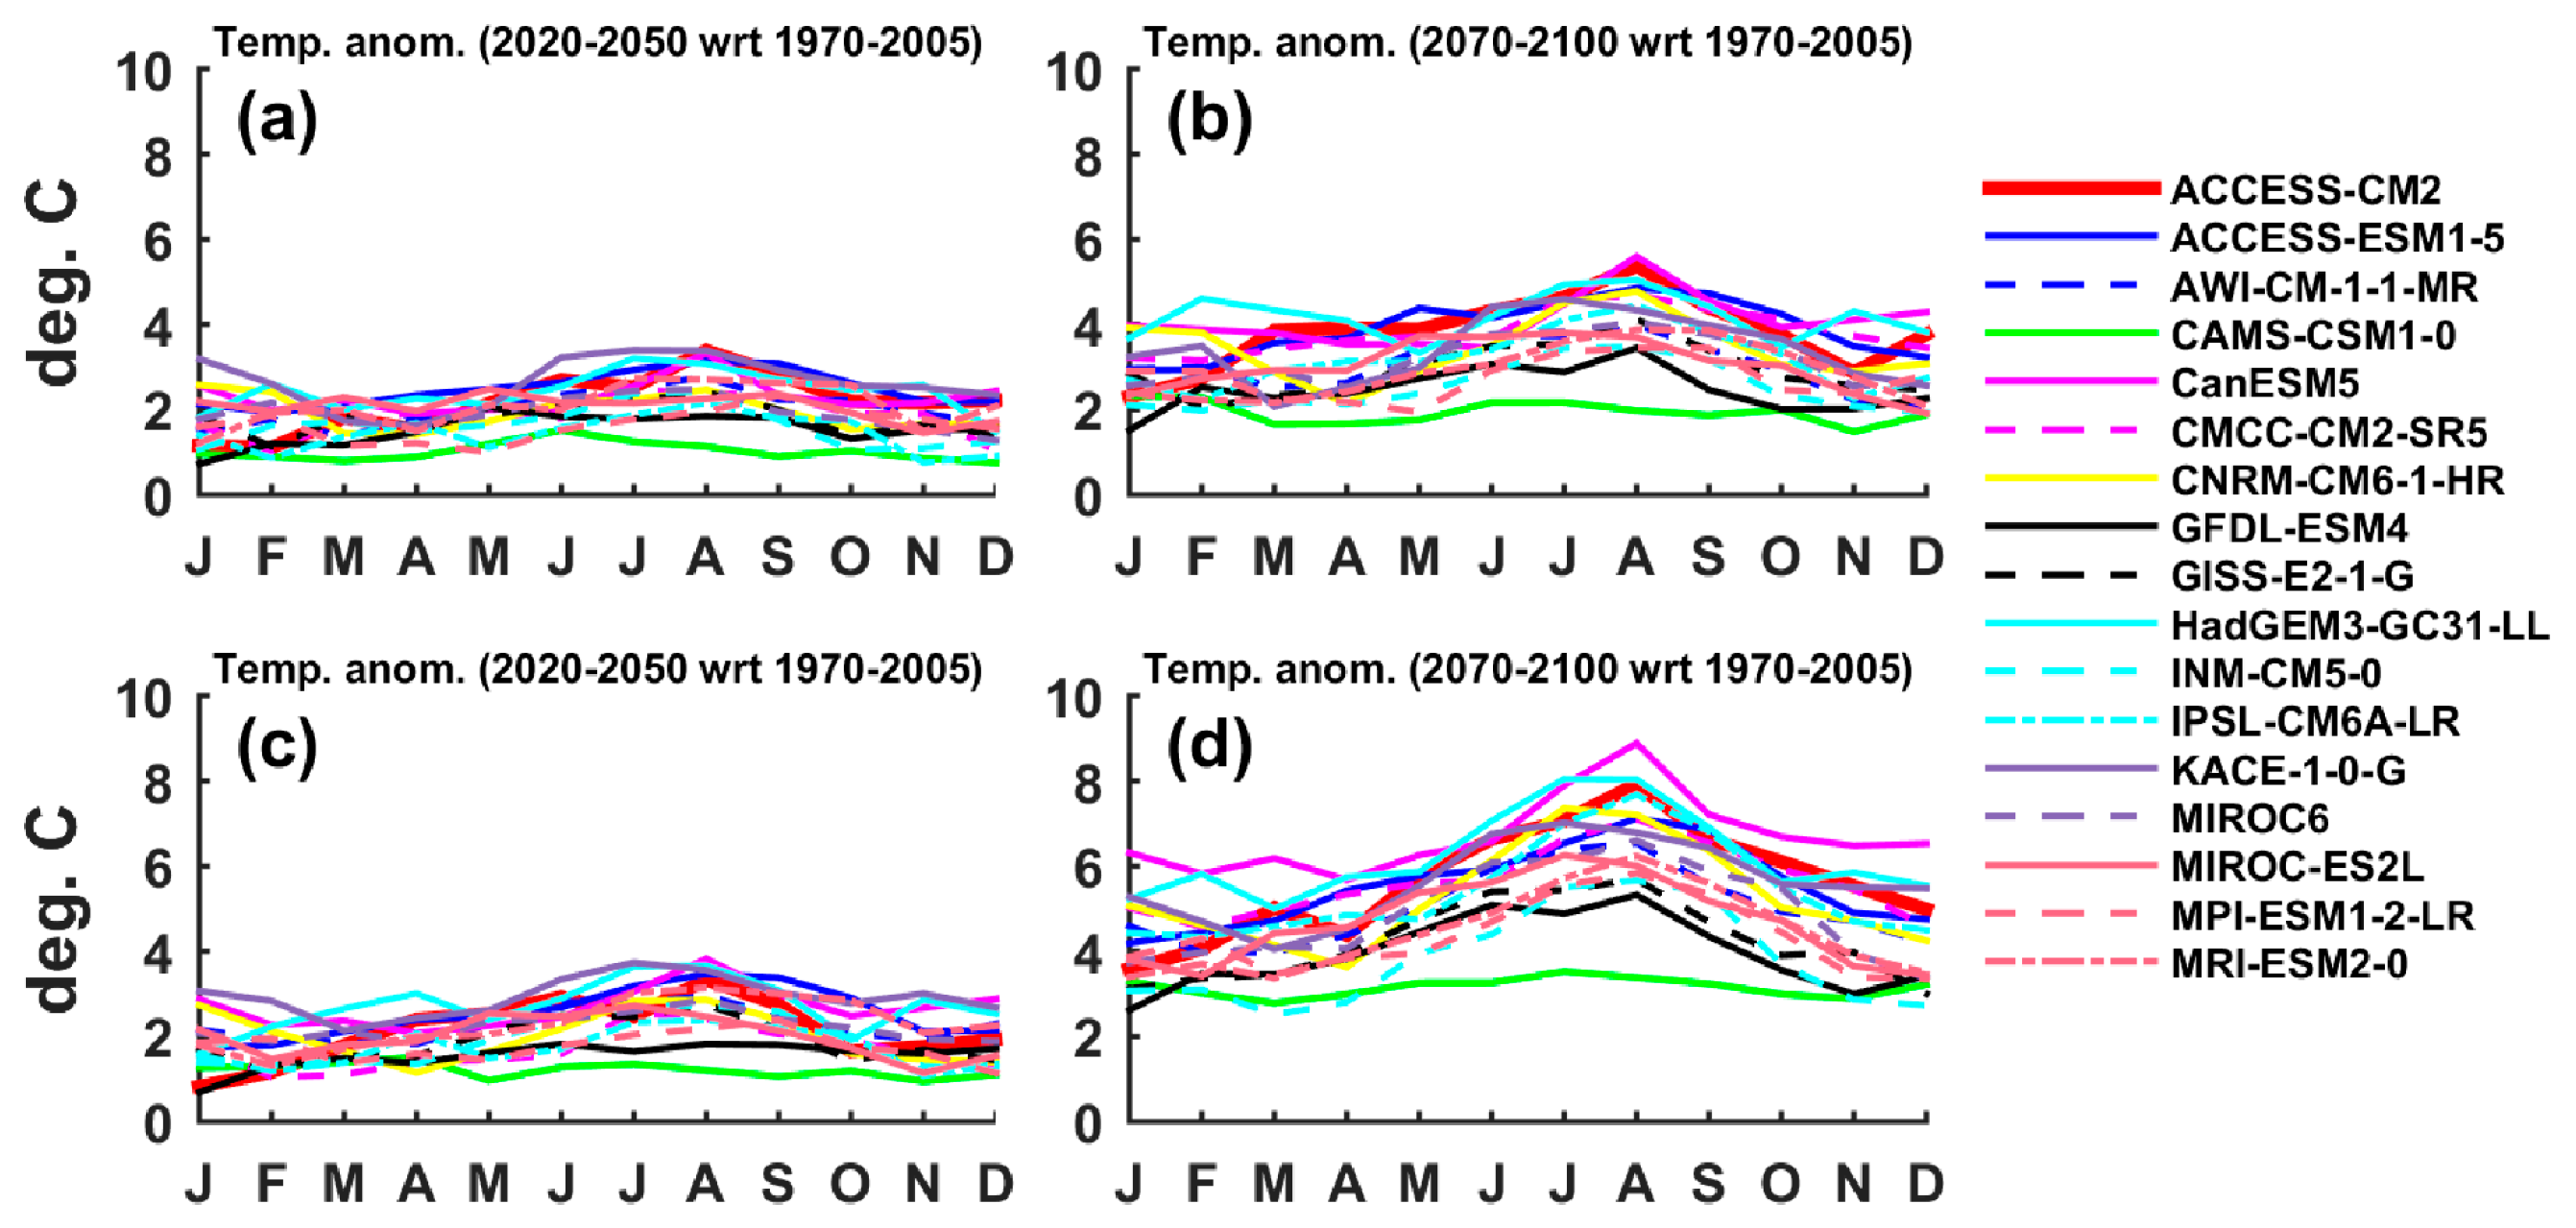
In order to study the seasonal temperature differences in the future period 2070 to 2100 with respect to the basis period the monthly mean temperature anomalies averaged over EMed and the boxplot of seasonal temperature anomalies are calculated (Figure 6 and Figure 7). Both future scenarios show that for all seasons the temperature is increased by about ~3.0 and ~5.0 °C for the SSP2-4.5 and SSP5-8.5 scenarios, respectively. The summer season (JJA) shows the maximum temperature increase compared with the other seasons ranging from ~3.0 °C to ~5.0 °C for the SSP2-4.5 scenario and from ~5.0 °C to ~7.0 °C for the SSP5-8.5 scenario. The analysis of CMIP5 model simulations under the RCP8.5 scenario has shown that the temperature in the Mediterranean is projected to increase by about 20% more than the global mean warming, with the maximum warming to be shown during the summer (JJA) season (about 50% more than the global mean). The increased warming over the Mediterranean and the reduced precipitation due to climate change categorize this region as one of the most responsive regions to climate stress and future resilience [20].

4. Conclusions

This work focuses on investigating the future temperature changes over the EMed using CMIP6 model simulations according to the SSP2-4.5 and SSP5-8.5 scenarios. The results show that GCMs present different skills for capturing and reproducing the EMed temperature compared with ERA5. The ACCESS-ESM1-5, CMCC-CM2-SR5, INM-CM5-0, IPSL-CM6A-LR and MIROC6 show a better performance compared with other GCMs for capturing the temporal and distributional features of mean EMed temperature (0.4 ≤ KGE < 0.47). All model simulations show a warming of ~4 °C to 8 °C for the SSP5-8.5 scenario and ~2 °C to 4 °C for the SSP2-4.5 scenario till the end of the 21st century. The maximum changes are presented during the last period of the 21st century and they are identified over continental areas of the Balkan Peninsula and Turkey. Focusing on the end of the 21st century, the warming trend for the EMed fluctuates from 0.4 to 1.5 °C/decade for the SSP5-8.5 scenario and from 0.0 to 0.4 °C/decade for the SSP2-4.5 scenario. Finally, the seasonal temperature projections show that summer months show the maximum warming.

Author Contributions

Conceptualization, I.L. and K.T.; methodology, I.L.; software, I.L.; validation, I.L.; formal analysis, I.L.; investigation, I.L.; resources, I.L.; data curation, I.L.; writing—original draft preparation, I.L.; writing—review and editing, I.L., K.T. and D.M.; visualization, I.L.; supervision, K.T. and D.M.; project administration, K.T. and D.M.; funding acquisition, D.M. All authors have read and agreed to the published version of the manuscript.

Funding

This research received no external funding.

Institutional Review Board Statement

Not applicable.

Informed Consent Statement

Not applicable.

Data Availability Statement

https://esgf-data.dkrz.de/search/cmip6-dkrz/ (accessed on 11 August 2023). https://cds.climate.copernicus.eu/ (accessed on 7 October 2024).

Acknowledgments

We would like to acknowledge all institutes for the contribution to the CMIP6 project. Additionally, we would like to thank the ESGF nodes for the distribution and storage of CMIP6 data. Finally, the authors would like to acknowledge ECMWF for providing ERA-5 data that are freely available in the Copernicus Climate Change Service CDS (https://cds.climate.copernicus.eu/ accessed on 16 September 2024).

Conflicts of Interest

The authors declare no conflicts of interest.

References

  1. Cos, J.; Francisco Doblas-Reyes, F.; Jury, M.; Marcos, R.; Bretonnière, P.A.; Samsó, M. The Mediterranean climate change hotspot in the CMIP5 and CMIP6 projections. Earth Syst. Dynam. 2022, 13, 321–340. [Google Scholar] [CrossRef]
  2. UN Environment Programme—The Mediterranean Action Plan (MAP)—Barcelona Convention. Available online: https://www.unep.org/unepmap/resources/factsheets/climate-change (accessed on 23 September 2024).
  3. Urdiales-Flores, D.; Zittis, G.; Hadjinicolaou, P.; Osipov, S.; Klingmüller, K.; Mihalopoulos, N.; Kanakidou, M.; Economou, T.; Lelieveld, J. Drivers of accelerated warming in Mediterranean climate-type regions. Npj Clim. Atmos. Sci. 2023, 6, 97. [Google Scholar] [CrossRef]
  4. Giorgi, F.; Lionello, P. Climate change projections for the Mediterranean region. Glob. Planet. Chang. 2008, 63, 90–104. [Google Scholar] [CrossRef]
  5. Zittis, G.; Almazroui, M.; Alpert, P.; Ciais, P.; Cramer, W.; Dahdal, Y.; Fnais, M.; Francis, D.; Hadjinicolaou, P.; Howari, F.; et al. Climate change and weather extremes in the Eastern Mediterranean and Middle East. Rev. Geophys. 2022, 60, e2021RG000762. [Google Scholar] [CrossRef]
  6. Carvalho, D.; Cardoso Pereira, S.; Rocha, A. Future surface temperatures over Europe according to CMIP6 climate projections: An analysis with original and bias-corrected data. Clim. Chang. 2021, 167, 10. [Google Scholar] [CrossRef]
  7. Eyring, V.; Bony, S.; Meehl, G.A.; Senior, C.A.; Stevens, B.; Stouffer, R.J.; Taylor, K.E. Overview of the Coupled Model Intercomparison Project Phase 6 (CMIP6) experimental design and organization. Geosci. Model Dev. 2016, 9, 1937–1958. [Google Scholar] [CrossRef]
  8. Hersbach, H.; Bell, B.; Berrisford, P.; Hirahara, S.; Horányi, A.; Muñoz-Sabater, J.; Nicolas, J.; Peubey, C.; Radu, R.; Schepers, D.; et al. The ERA5 global reanalysis. Q. J. R. Meteorol. Soc. 2020, 146, 1999–2049. [Google Scholar] [CrossRef]
  9. IPCC. Climate Change 2022: Climate Change 2022: Impacts, Adaptation, and Vulnerability. Contribution of Working Group II to the Sixth Assessment Report of the Intergovernmental Panel on Climate Change; Pörtner, H.-O., Roberts, D.C., Tignor, M., Poloczanska, E.S., Mintenbeck, K., Alegría, A., Craig, M., Langsdorf, S., Löschke, S., Möller, V., et al., Eds.; Cambridge University Press: Cambridge, UK; New York, NY, USA, 2022; 3056p. [Google Scholar]
  10. Riahi, K.; van Vuuren, D.P.; Kriegler, E.; Edmonds, J.; O’Neill, B.C.; Fujimori, S.; Bauer, N.; Calvin, K.; Dellink, R.; Fricko, O.; et al. The Shared Socioeconomic Pathways and their energy, land use, and greenhouse gas emissions implications: An overview. Glob. Environ. Chang. 2017, 42, 153–168. [Google Scholar] [CrossRef]
  11. Siabi, E.K.; Awafo, E.A.; Kabo-bah, A.T.; Derkyi, N.S.A.; Akpoti, K.; Mortey, E.M.; Yazdanie, M. Assessment of Shared Socioeconomic Pathway (SSP) climate scenarios and its impacts on the Greater Accra region. Urban Clim. 2023, 49, 101432. [Google Scholar] [CrossRef]
  12. Gupta, H.V.; Kling, H.; Yilmaz, K.K.; Martinez, G.F. Decomposition of the Mean Squared Error and NSE Performance Criteria: Implications for Improving Hydrological Modelling. J. Hydrol. 2009, 377, 80–91. [Google Scholar] [CrossRef]
  13. Zareian, M.; Dehban, H.; Gohari, A.; Haghighi, A.T. Assessment of CMIP6 models performance in simulation precipitation and temperature over Iran and surrounding regions. Environ. Monit. Assess. 2024, 196, 701. [Google Scholar] [CrossRef] [PubMed]
  14. Patil, S.D.; Stieglitz, M. Comparing spatial and temporal transferability of hydrological model parameters. J. Hydrol. 2015, 525, 409–417. [Google Scholar] [CrossRef]
  15. Tebaldi, C.; Debeire, K.; Eyring, V.; Fischer, E.; Fyfe, J.; Friedlingstein, P.; Knutti, R.; Lowe, J.; O’Neill, B.; Sanderson, B.; et al. Climate model projections from the Scenario Model Intercomparison Project (ScenarioMIP) of CMIP6. Earth Syst. Dynam. 2021, 12, 253–293. [Google Scholar] [CrossRef]
  16. Lelieveld, J.; Hadjinicolaou, P.; Kostopoulou, E.; Chenoweth, J.; El Maayar, M.; Giannakopoulos, C.; Hannides, C.; Lange, M.A.; Tanarhte, M.; Tyrlis, E.; et al. Climate change and impacts in the Eastern Mediterranean and the Middle East. Clim. Chang. 2012, 114, 667–687. [Google Scholar] [CrossRef] [PubMed]
  17. Almazroui, M.; Saeed, F.; Saeed, S.; Nazrul Islam, M.; Ismail, M.; Klutse, N.A.B.; Siddiqui, M.H. Projected Change in Temperature and Precipitation Over Africa from CMIP6. Earth Syst. Environ. 2020, 4, 455–475. [Google Scholar] [CrossRef]
  18. Rosselló, R.; Pascual, A.; Combes, V. Assessing marine heat waves in the Mediterranean Sea: A comparison of fixed and moving baseline methods. Front. Mar. Sci. 2023, 10, 1168368. [Google Scholar] [CrossRef]
  19. Evin, G.; Ribes, A.; Corre, L. Assessing CMIP6 uncertainties at global warming levels. Clim. Dyn. 2024, 62, 8057–8072. [Google Scholar] [CrossRef]
  20. Lionello, P.; Scarascia, L. The relation between climate change in the Mediterranean region and global warming. Reg. Environ. Chang. 2018, 18, 1481–1493. [Google Scholar] [CrossRef]
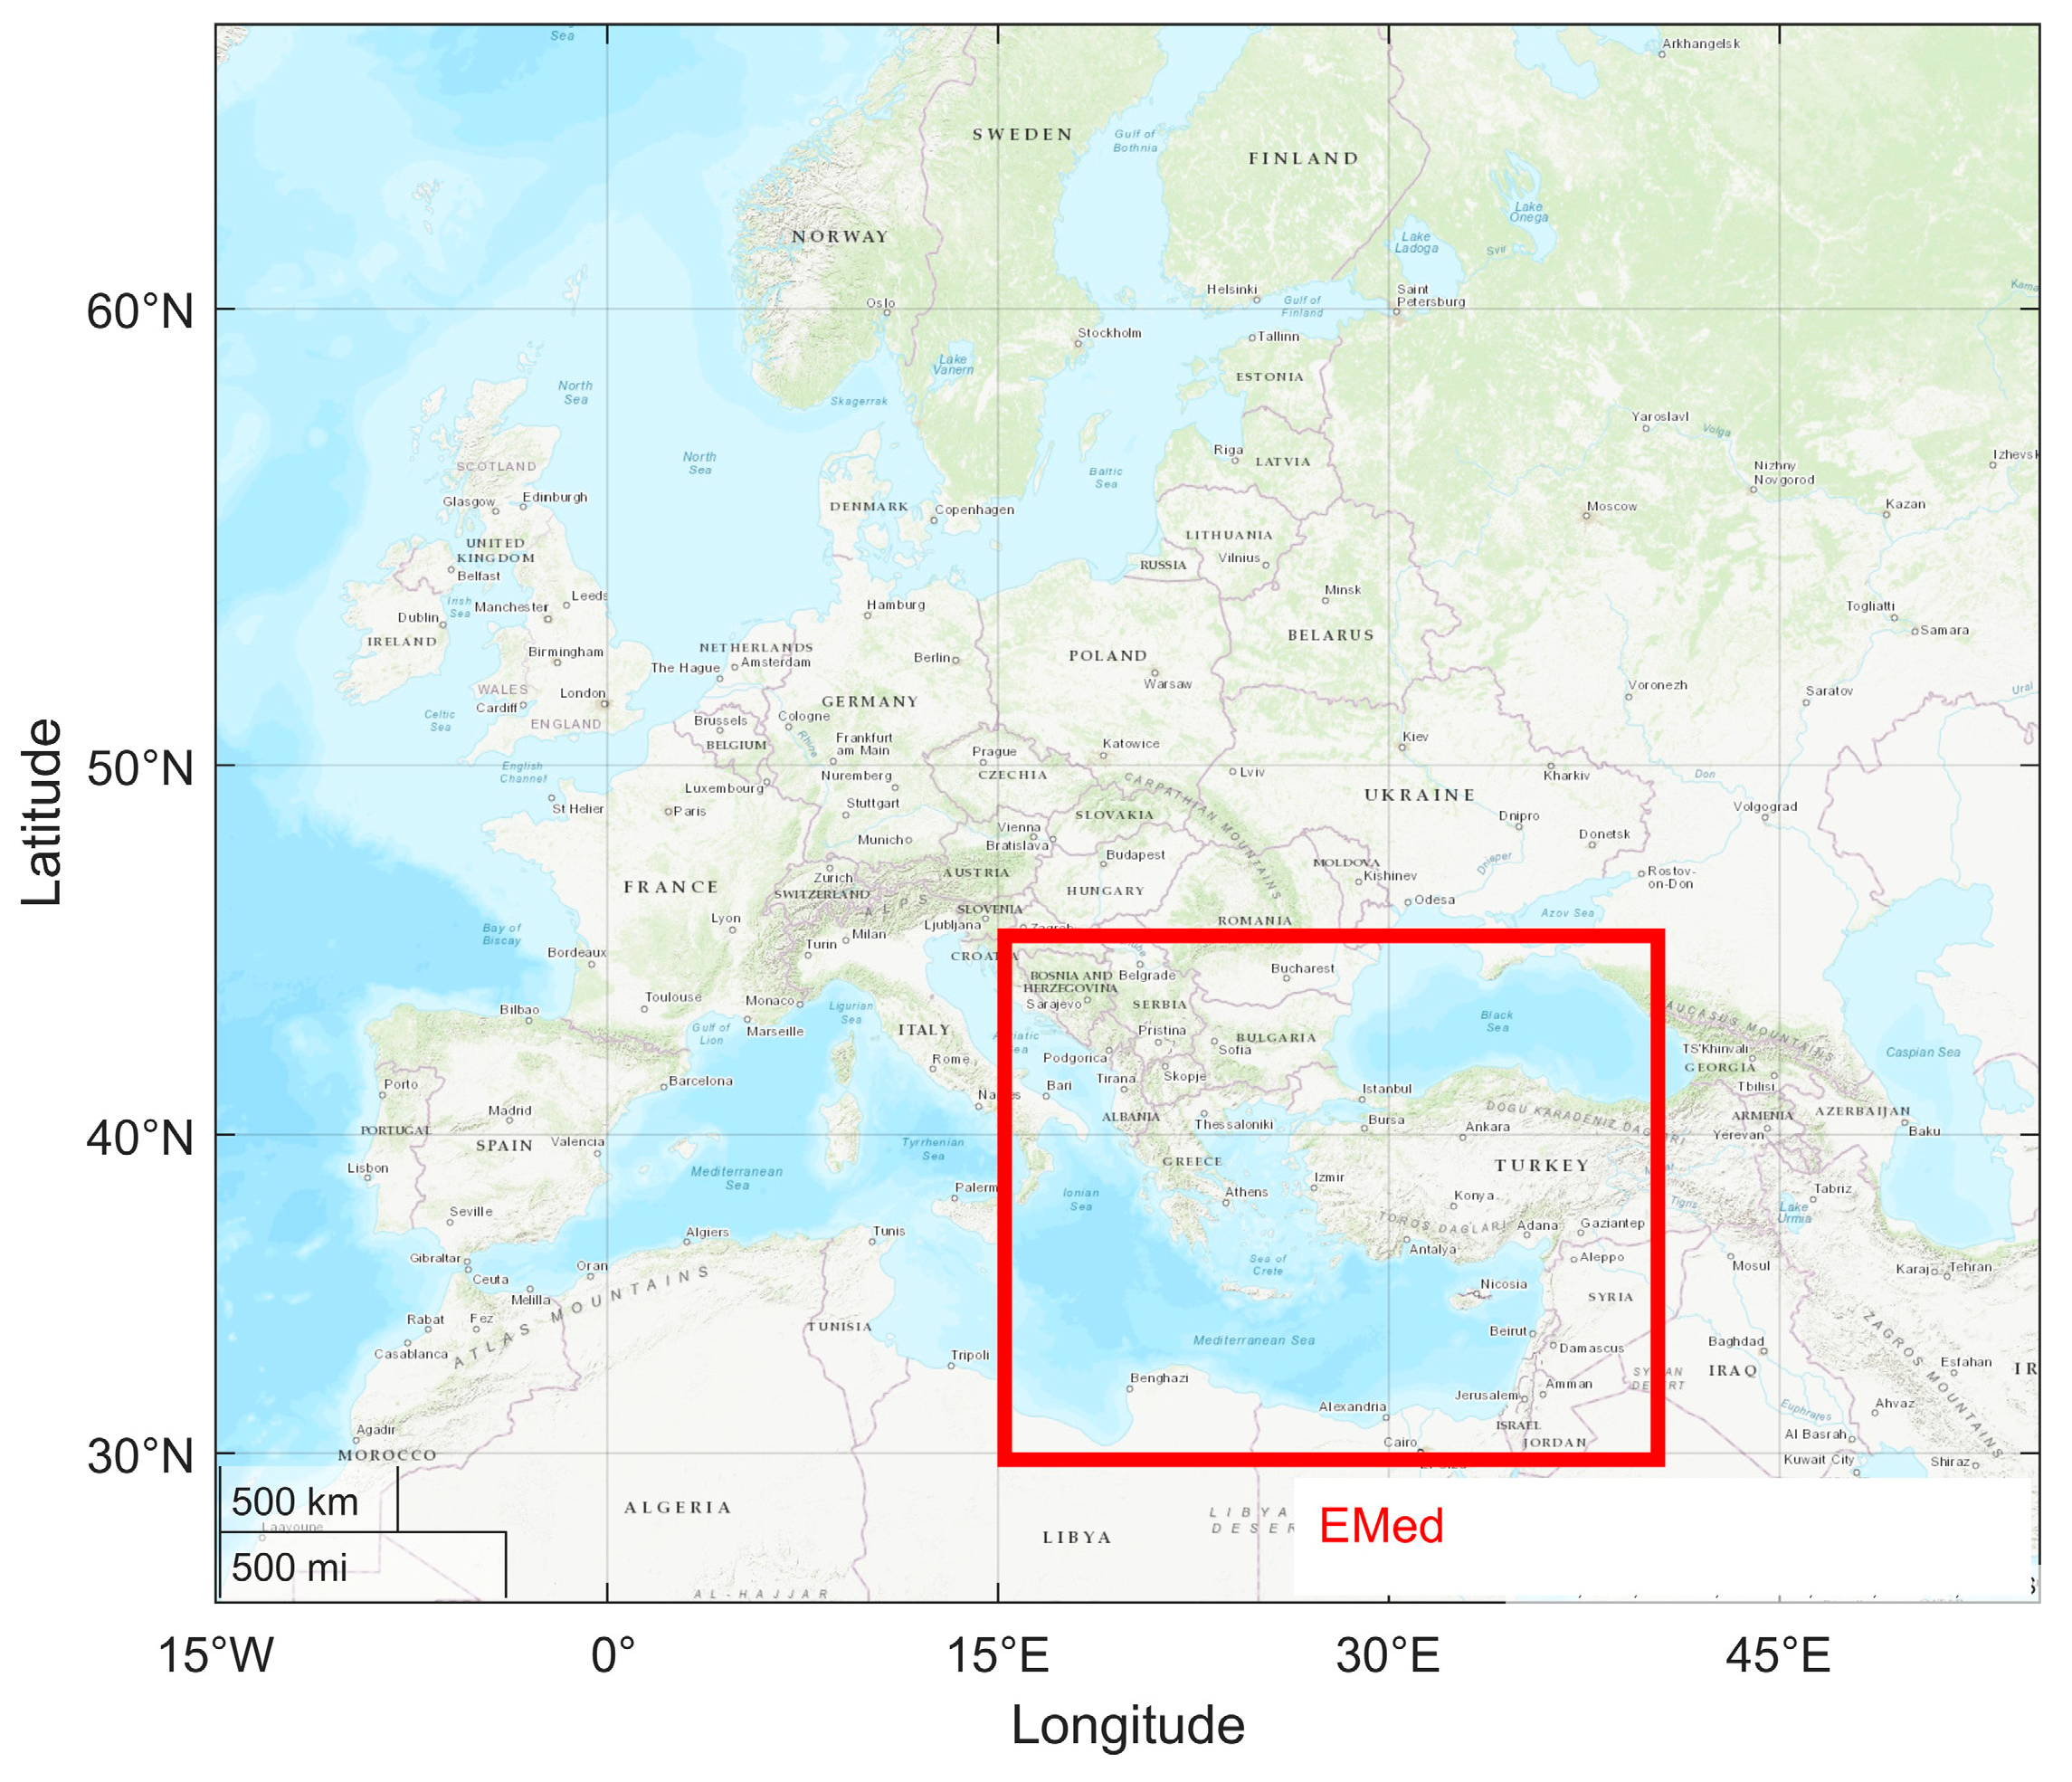
Figure 1. The Europe domain. The red box indicates the region of study (ecosystem of Eastern Mediterranean; EMed).
Eesp 34 00012 g001
Figure 2. The calculated (a) temperature bias for each CMIP6 simulation. Τhe red dotted lines indicate the ± 1.5 σ 0 . The red cycles indicate for CMIP6 that the averaged temperature bias is into the ERA5 limit of ± 1.5 σ 0 . (b) Correlation coefficients (blue line), bias ratios ( μ s μ 0 ; magenta line), variability ratios ( σ s σ 0 ; green line) and KGE indices (black line) of the EMed temperature for CMIP6 model simulations relative to ERA5 during the basis period. The red cycles indicate for CMIP6 that KGE values are larger than 0.4 (KGE > 0.4).
Eesp 34 00012 g002
Figure 3. Projections of annual mean EMed temperature anomalies (with respect to the basis period from 1970 to 2005) up to 2100 for each model (aq). The black line shows the temperature anomalies of historical period. The red/blue line shows the temperature anomalies projections according to SSP5-8.5/SSP2-4.5 scenarios.
Eesp 34 00012 g003
Figure 4. Composite difference in annual mean EMed temperature between future period from 2070 to 2100 and historical period from 1970 to 2005 according to (A) SSP2-4.5 and (B) SSP5-8.5 scenarios for each model (aq). The dots indicate the statistical significant differences (99% stat. level).
Eesp 34 00012 g004
Figure 5. Temperature trend (°C/ decade) for period 2070 to 2100 in (A) SSP2-4.5 and (B) SSP5-8.5 scenarios for each model (aq). The dots indicate the statistical significant trend values (99% stat. level).
Eesp 34 00012 g005
Figure 6. Monthly mean EMed temperature anomalies for periods from 2020 to 2050 and from 2070 to 2100 with respect to basis period according to (a,c) SSP2-4.5 and (b,d) SSP5-8.5 scenarios.
Eesp 34 00012 g006
Figure 7. Boxplot of mean seasonal (DJF, MAM, JJA and SON) and annual (Ann.) temperature anomalies during future period from 2070 to 2100 with respect to historical period for (A) SSP2-4.5 and (B) SSP5-8.5 scenarios for each model (aq). The dashed line shows the null value. The red lines shos the median of each distribution and the red stars show the outliers.
Eesp 34 00012 g007
Table 1. List of CMIP6 model simulations that are used in this study.
ModelInstitute (Country)Resolution (lon/lat)Ensemble
ACCESS-CM2Australian Community Climate and Earth System Simulator Climate Model Version 2 (Australia)192 × 144r1i1p1f1
ACCESS-ESM1-5Australian Community Climate and Earth System Simulator Earth System Model Version 1.5192 × 145r1i1p1f1, r2i1p1f1, r3i1p1f1
AWI-CM-1-1-MRAlfred Wegener Institute, Helmholtz Centre for Polar and Marine Research384 × 192r1i1p1f1
CAMS-CSM1-0Climate Academy of Meteorological Sciences—Climate Simulation Model320 × 160r1i1p1f1
CanESM5Canadian Centre for Climate Modelling and Analysis, Environment and Climate Change Canada128 × 64r1i1p1f1
CMCC-CM2-SR5Fondazione Centro Euro-Mediterraneo sui Cambiamenti Climatici, Italy288 × 192r1i1p1f1
CNRM-CM6-1-HRCentre National de Recherches Meteorologiques, Centre Europeen de Recherche et de Formation Avancee en Calcul Scientifique, France256 × 128r1i1p1f2
GFDL-ESM4National Oceanic and Atmospheric Administration, Geophysical Fluid Dynamics Laboratory, USA360 × 180r1i1p1f1
GISS-E2-1-GGoddard Institute for Space Studies, USA144 × 90r1i1p1f2
HadGEM3-GC31-LLMet Office Hadley Centre, UK92 × 144r1i1p1f3
INM-CM5-0Institute for Numerical Mathematics, Russian Academy of Science, Russia180 × 120r1i1p1f1
IPSL-CM6A-LRInstitut Pierre Simon Laplace, France144 × 143r2i1p1f1
KACE-1-0-GNational Institute of Meteorological Sciences/Korea Meteorological Administration, Climate Research Division, Republic of Korea192 × 144r1i1p1f1
MIROC6Japan Agency for Marine-Earth Science and Technology, The University of Tokyo, Japan256 × 128r1i1p1f1
MIROC-ES2LJapan Agency for Marine-Earth Science and Technology, The University of Tokyo, Japan128 × 64r1i1p1f1
MPI-ESM1-2-LRMax Planck Institute for Meteorology, Germany192 × 96r1i1p1f1
MRI-ESM2-0Meteorological Research Institute, Japan128 × 64r1i1p1f1
Disclaimer/Publisher’s Note: The statements, opinions and data contained in all publications are solely those of the individual author(s) and contributor(s) and not of MDPI and/or the editor(s). MDPI and/or the editor(s) disclaim responsibility for any injury to people or property resulting from any ideas, methods, instructions or products referred to in the content.