1. Introduction
Floods, among the most widespread and damaging natural hazards, are increasingly frequent and severe due to climate change and urbanization, highlighting the need for policymakers and researchers to understand their causes and develop effective risk-management strategies. Flood-contributing factors can be categorized into three main themes: natural, built environment, and socioeconomic. Natural factors include elements such as topographic features, precipitation, and lithological composition, while built-environment factors encompass aspects like land use and related variables. Socioeconomic factors, on the other hand, involve various demographic and economic indicators, such as income level, age distribution, gender ratio, and education level. The direct relationships between socioeconomic factors and society significantly influence the vulnerability of communities to floods. These factors also influence the capacity to face and cope with such hazards [
1]. Communities with low incomes, limited access to education, and inadequate infrastructure are particularly vulnerable, as they often lack the resources needed for effective disaster preparedness and recovery [
2].
Various approaches, including multi-criteria decision-making methods, GIS-based spatial modelling, and community involvement, are used in flood-risk assessment, susceptibility estimation, and flood mitigation. These methods contribute to effective risk management by identifying flood-risk factors and developing related spatial analyses. Recent studies emphasize that socioeconomic data should be integrated into flood-risk assessment. Integrating these data provides a comprehensive understanding of how different segments of society are affected by flood events and how they can respond to them. In flood-risk assessments, other methods, such as the Social Vulnerability Index (SVI) and Principal Component Analysis (PCA), are practical tools for determining regional vulnerability levels. The SVI combines variables such as population density, age group, and educational attainment to determine the levels of vulnerability of communities to flooding [
1]. PCA classifies these variables and statistically analyses the relationships between socioeconomic profiles and risk levels. It can be seen that these two methods are used together in the studies in the relevant literature. For example, Ref. [
3] identified the most vulnerable areas using the Social Vulnerability Index (SVI), which was developed with indicators including physical exposure and resistance dimensions, for a social vulnerability assessment in Sarawak, while [
4] followed a method that creates vulnerability maps with GIS tools by using PCA-based objective weighting methods, with an analysis including indicators suitable for the local socio-economic context and flood-related variables, for a study in Romania. Apart from these two methods, there are also studies in which the Analytic Hierarchy Process (AHP), a decision-making tool that ranks and weights criteria based on their importance, and SVI methods are used together. For example, in [
1], the AHP was used to evaluate and rank social vulnerability indicators, and then the SVI was calculated with the weights of these criteria.
This study aims to develop more effective disaster management and planning strategies by analyzing the relationship between flood risk and socioeconomic vulnerability in Büyükçekmece district, which was selected as the study area due to the fact that it has both lake and sea coasts and it has experienced flood events in the past. With reference to the examples in the literature, the weighting between natural and built indicators is performed by the AHP, while PCA is used for weighting between socioeconomic factors. The SVI was calculated by determining the weights of socioeconomic factors, and vulnerable neighborhoods were identified. By comparing the maps obtained, the relationship between socioeconomic factors and flood risk was analyzed and attention was drawn to the need to develop more sensitive intervention policies for areas at risk.
2. Study Area
The study area is located on the western side of Istanbul, along the coast of the Marmara Sea, and encompasses the district of Büyükçekmece. The surface area of the district is 196 km
2. The climate of this district is mild and humid, which is characteristic of the Marmara Region, and influences local weather patterns and environmental conditions [
5]. Regarding urbanization of the study area, with 24 neighborhoods and a population of 276,252 people, Büyükçekmece is undergoing a rapid urbanization process with significant infrastructure development, contributing to its transformation into a densely populated area [
6]. Flood events in the region in the past have inundated many homes and businesses, causing economic losses. For example, on 8 September 2009, heavy rains caused severe flooding in Istanbul, killing at least 30 people, destroying bridges, and inundating houses and streets [
7]. Furthermore, the growing population and expanding urban footprint were factors in the selection of the study area, as the potential impacts of natural disasters on a growing urban environment reflect a possibly increased vulnerability to flooding.
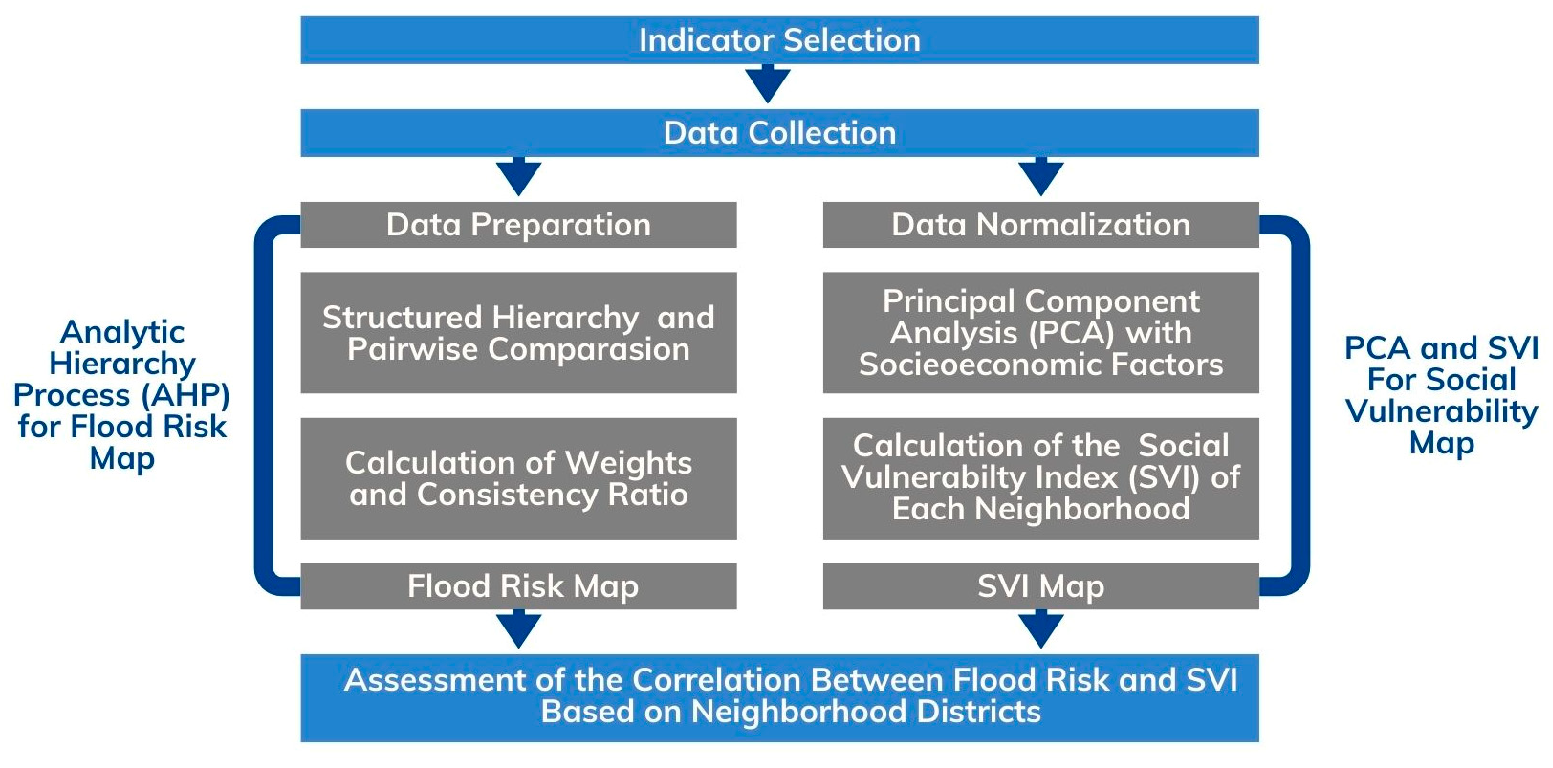
3. Methodology
Consisting of six steps, the methodology of this study follows a systematic approach in producing a flood-risk map for the Büyükçekmece District based on socioeconomic factors. These steps are given in
Figure 1.
3.1. Indicator Selection
The key indicators were chosen for both the flood-risk and social vulnerability maps. The indicators of the flood-risk map are slope, elevation, aspect, proximity to stream, soil, lithology, land use, and precipitation. In contrast, the socioeconomic indicators include population density, age and gender distribution, household size, income level, education level, and total number of vehicles. Each indicator was carefully selected based on its relevance to flood risk or social vulnerability. These indicators were selected because they are easily determinable within the study area and are among the key indicators in the literature.
3.2. Data Collection and Preparation
Data were collected from various institutions, such as the United States Geological Survey (USGS), Büyükçekmece Municipality, the Ministry of Agriculture and Forestry, the General Directorate of Meteorology, the Turkish Statistical Institute (TÜİK), and Endeksa, as shown in
Table 1. After the data collection step, all indicators were normalized and standardized to ensure consistency across the different data types and prepare the data for further analysis.
3.3. Producing a Flood-Risk Map by Using the AHP
Developed by Saaty [
12], the Analytic Hierarchy Process (AHP) was used in this study to produce the flood-risk map. The AHP is a multi-criteria decision-making tool that helps rank and weight different criteria according to their importance. In this step, while scoring the natural and built indicators, case studies in the literature were analyzed, the rationale for scoring each parameter was examined, and a site-specific scoring was performed by two urban planners. The steps of AHP are given in the following:
Hierarchical Structure: The process begins by defining the flood-risk assessment and organizing the criteria that influence this risk into a hierarchical structure.
Pairwise Comparison Matrix: The criteria are compared pairwise using expert judgment and a review of the literature. Relative importance weights are assigned based on a scale developed by [
12]. This results in a square matrix reflecting the relative importance of each criterion compared to others.
Weight Calculation: To calculate the criteria weights, each element in the matrix is divided by the sum of its column, and the arithmetical mean of each row is taken. This gives the eigenvector, which represents the weight of each criterion.
Consistency Ratio (CR) Check: The largest eigenvalue is calculated to assess the consistency of the comparisons. The Consistency Index (CI) is then determined and divided by the Random Index (RI) to calculate the Consistency Ratio (CR). If the CR is less than 0.1, the comparison matrix is considered consistent, and the criterion weights are reliable. These weights are then used to produce the flood-risk map, using a weighted-sum approach, in the ArcGIS Pro 3.1.
Flood-Risk Mapping: The final map visualized flood risk across different neighborhoods in the district, showing each area described as being very high risk of flood, high risk of flood, risky, moderate risk of flood, or low risk of flood.
3.4. Producing Social Vulnerability Map by Using PCA
For the Social Vulnerability Index (SVI), Principal Component Analysis (PCA) was used to identify the most critical socioeconomic factors affecting vulnerability. PCA is a statistical technique that reduces the dimensionality of data while retaining the most crucial variance [
4].
Normalization and PCA Application: The socioeconomic indicators were first normalized, and PCA was carried out using statistical software (IBM SPSS 29.0.2.0). This analysis identified the main components contributing to social vulnerability.
SVI Calculation: The normalized values of the selected principal components were multiplied by their respective weights and summed to calculate the SVI for each neighborhood. This index represented the level of social vulnerability in each area.
SVI Mapping: ArcGIS 3.1 spatially visualized the calculated SVI across neighborhood boundaries.
3.5. Correlation Analysis Between Flood Risk and Social Vulnerability
Once both the flood-risk and SVI maps had been produced, a correlation analysis was conducted to assess the relationship between flood risk and social vulnerability at the neighborhood level.
3.6. GIS-Based Visualization and Analysis
GIS (Geographic Information System) tools were extensively used in this study for spatial analysis and visualization of flood risk and SVI. ArcGIS Pro 3.1 software transformed the data into meaningful spatial layers. Each neighborhood’s flood risk and SVI were mapped, allowing a clear visual comparison of the areas and the determination of those with the highest flood risk and vulnerability.
4. Results and Discussion
This study created two key maps: the flood-risk map and the Social Vulnerability Index (SVI) map for the Büyükçekmece District. These maps were generated using GIS tools, combining physical and socioeconomic data.
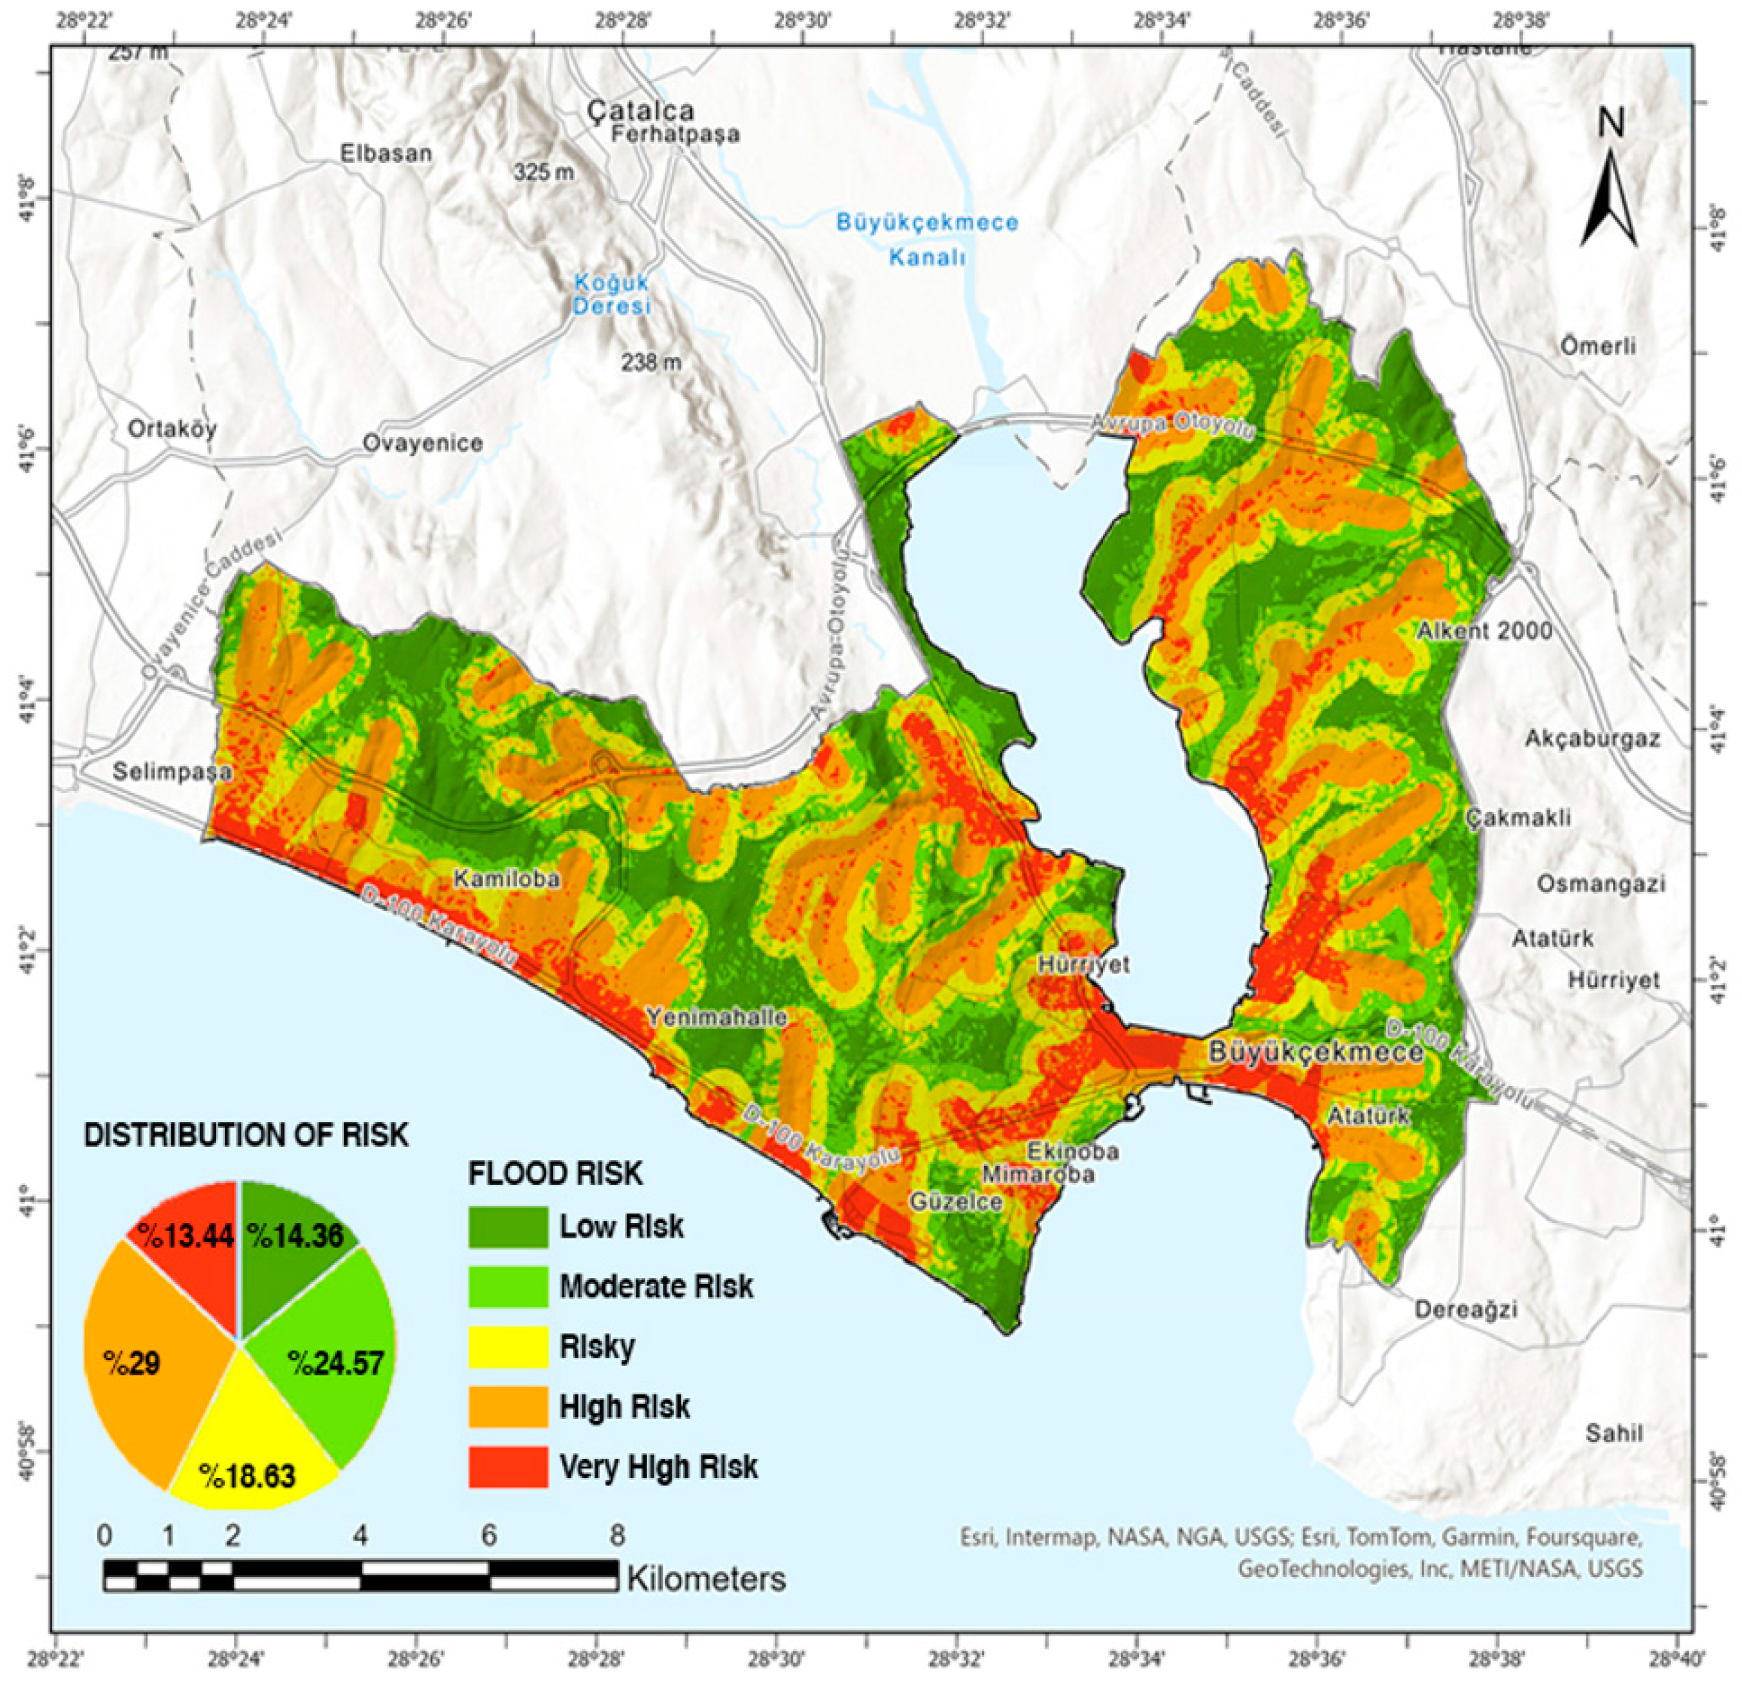
Firstly, a flood-risk map was produced, using a 30 × 30 m grid resolution. It was obtained by integrating the slope, elevation, aspect, proximity to stream, soil, lithology, land use, and precipitation layers, based on weights determined by the AHP method, using the weighted-sum tool. As shown in
Figure 2 and
Table 2, proximity to the stream was identified as the most critical factor, which led to the classification of areas near water bodies as very high-risk zones on the flood-risk map. Subsequent study of historical flood events in these high-risk areas has validated the risk analysis.
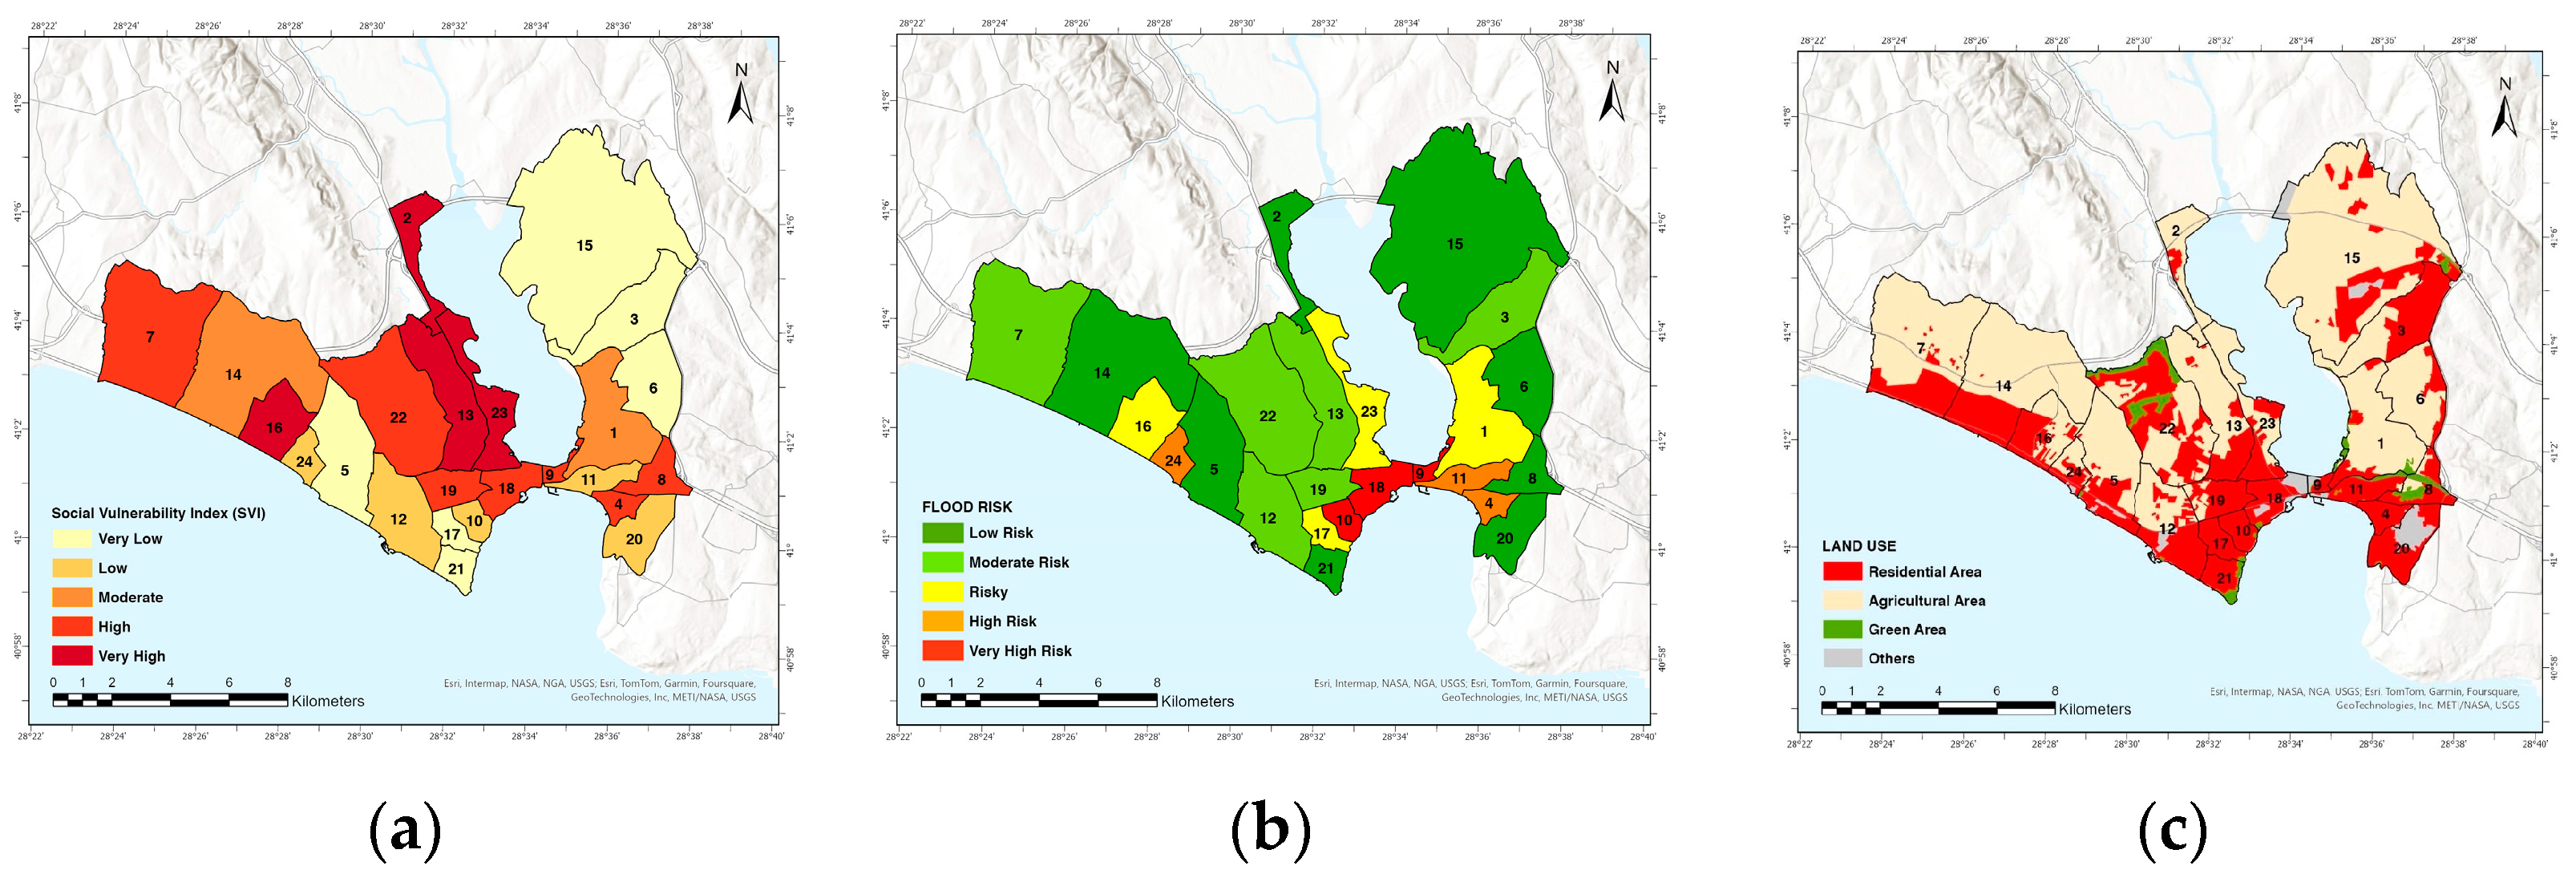
The social vulnerability values forming the dataset for the second generated map are presented in
Table 3. According to the table, the neighborhoods with the highest Social Vulnerability Index values include Ahmediye (No. 2), Güzelce (No. 12), Kumburgaz (No. 16), and Ulus (No. 23). In contrast, the neighborhoods with the lowest Social Vulnerability Index values are Alkent 2000 (No. 3), Bahçelievler (No. 5), Çakmaklı (No. 6), Karaağaç (No. 15), Mimaroba (No. 17), and Sinanoba (No. 21).
As shown in
Figure 3, Ahmediye Neighborhood (No. 2) has a very high Social Vulnerability Index, yet its average flood risk is low. In contrast, examining Neighborhoods No. 9 and No. 18 reveals that both have high SVI values and, similarly, high flood-risk levels. This finding indicates that more than a purely statistical approach is required to interpret the area’s flood risk and social vulnerability accurately. Furthermore, it has been determined that neighborhoods’ rural or urban characteristics influence both the Social Vulnerability Index and flood-risk analysis. The rural nature of Ahmediye Neighborhood (No. 2) reduces flood risk but increases social vulnerability. On the other hand, Neighborhoods No. 9 and No. 18 have high social vulnerability indices and high flood risk due to their urban character and strategic locations within a connecting area between the lake and the sea.
In addition, as shown in
Table 4, it was observed that agricultural and residential areas have a strong negative correlation, indicating they generally do not coexist in a certain location. Residential and green areas show a weak positive correlation, suggesting that they can sometimes be found together. Flood risk is positively correlated with residential and green areas, indicating higher flood risk in these zones. The Social Vulnerability Index is lower in residential areas. However, it tends to be higher in agricultural areas, underscoring how different land uses contribute to varying social vulnerability and flood risk.
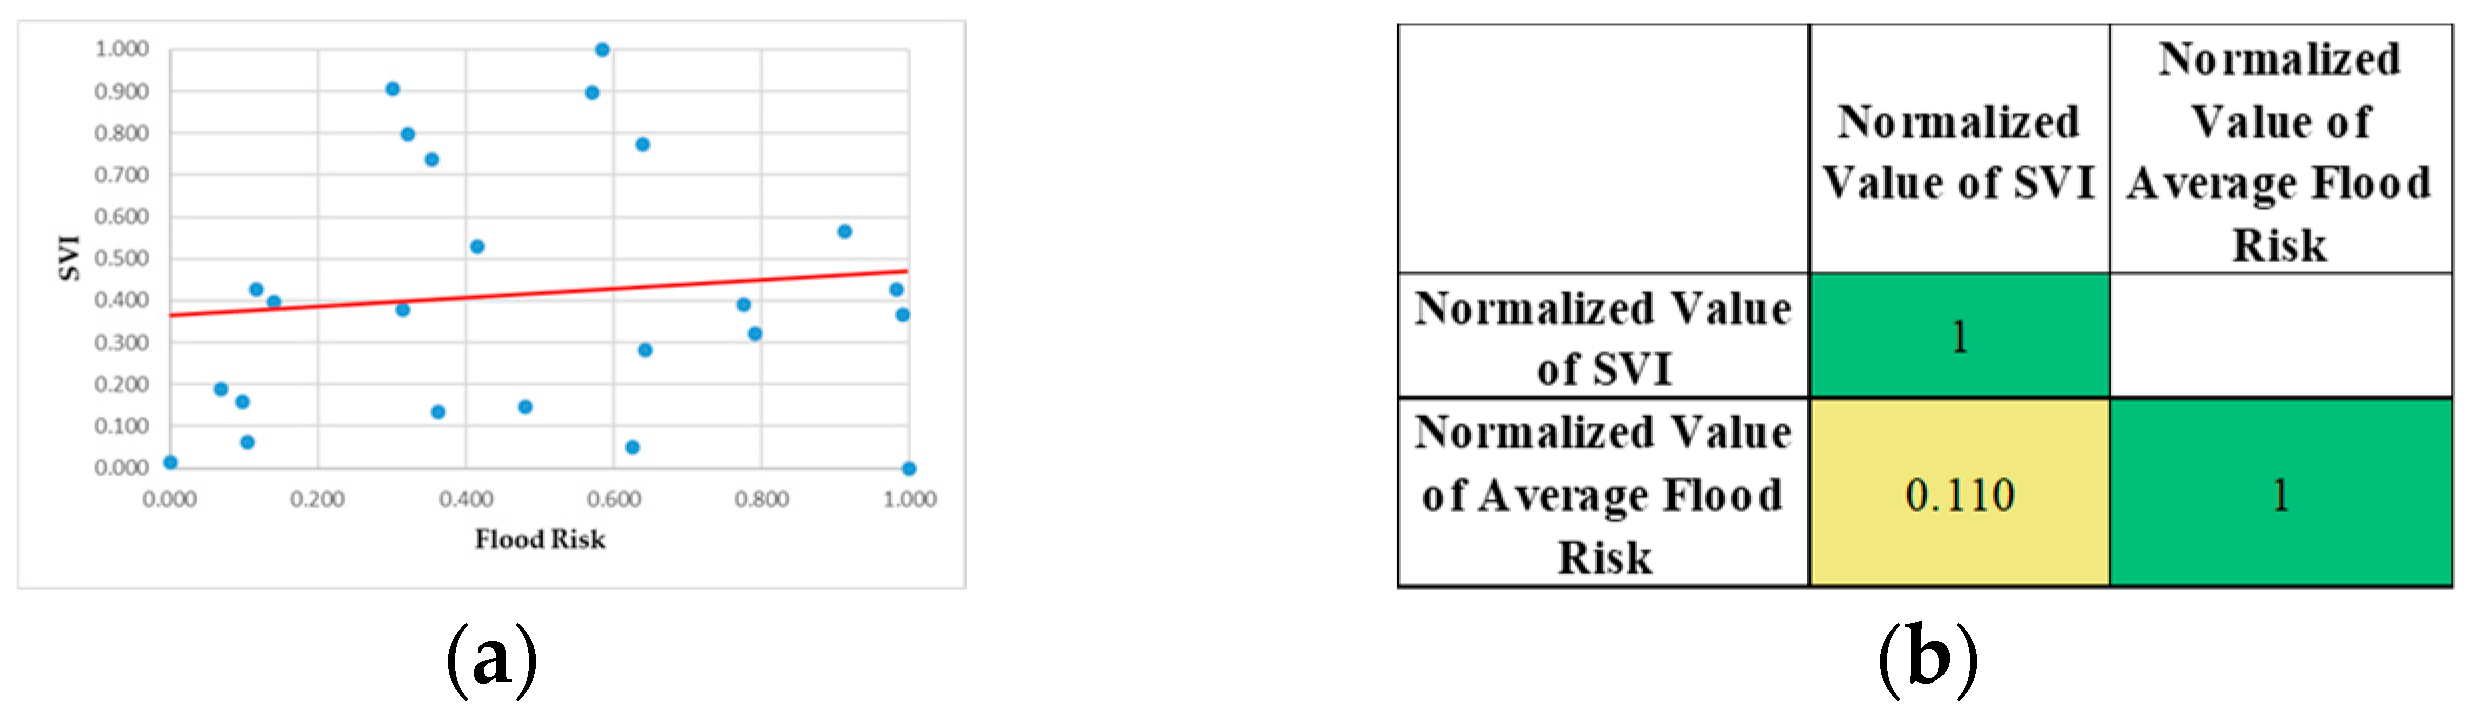
The statistical analysis conducted using neighborhood boundaries found a weak positive correlation between the Social Vulnerability Index (SVI) and flood risk, according to
Figure 4. As shown in
Figure 5, in Neighborhood No. 9, which has experienced flooding events, 54% of the area is classified as very high risk and 45% as high risk. In this neighborhood, 57% of the population is exposed to a very high risk, while 43% is subject to a high flood risk. In Neighborhood No. 18, 59% of the area is classified as being very high risk, 30% as high risk, and 11% as moderate risk. Here, 63% of the population is exposed to a high-risk level, 19% to moderate risk, and 18% to a very high flood risk. In conclusion, Neighborhoods No. 9 and No. 18 exhibit significantly high flood risk and SVI values. A large portion of the population in these areas is categorized as being under high or very high risk, with this risk being more concentrated in the coastal zones. Given their high exposure and vulnerability, these neighborhoods should be prioritized in the district’s disaster management and flood mitigation plans. To reduce both immediate and long-term risks in these neighborhoods, the focus should be on increasing infrastructure resilience, improving emergency response capacities, and addressing the specific needs of vulnerable populations.
5. Conclusions
This study produced a flood-risk map for Büyükçekmece District, Istanbul, Türkiye, and analyzed its relationships to socioeconomic factors. The findings reveal a weak and insignificant positive correlation between flood risk and the Social Vulnerability Index (SVI), suggesting that the increase in social vulnerability is minimal as flood risk increases. The rural or urban characteristics of neighborhoods also influence this relationship.
In historically flood-affected areas, especially in buffer zones between lake and sea, flood risk and social vulnerability increase significantly. The strong negative correlation between agricultural and residential areas indicates different land-use patterns, while the weak positive correlation between green areas and residential areas suggests that these areas may coexist with higher flood-risk areas. In particular, social vulnerability is higher in agricultural areas and lower in residential areas, underlining the complex dynamics.
In light of this information, risk maps for neighborhoods with high flood risk must be updated and integrated into disaster management plans. Due to the limited access to socioeconomic factors for this study area, a general conclusion has been drawn. Future research should be based on a more comprehensive dataset that includes social vulnerability, nuances of rural and urban environments, spatial analysis, social resilience, and multidisciplinary perspectives. In this way, more accurate and context-sensitive flood-risk assessments can be obtained and ultimately disaster risk management can be improved. Authorized people in disaster management can use these analyses for strategy formulation in the preparedness and risk-reduction phases of disaster management. Stakeholders, on the other hand, will be able to make more informed decisions regarding planned projects or housing sales in the area.


