Article

Diagnostic Accuracy of Plasma p-tau217 as a Pre-Screening Tool for Amyloid-PET: A Decision Curve Analysis in the ADNI Cohort


Cognitive and Memory Disorders Clinic, AOUP “Paolo Giaccone” University Teaching Hospital, Department of Biomedicine, Neurosciences, and Advanced Diagnostics (Bi.N.D.), University of Palermo, 90127 Palermo, Italy
*
Author to whom correspondence should be addressed.
J. Dement. Alzheimer's Dis. 2026, 3(2), 22; https://doi.org/10.3390/jdad3020022
Submission received: 9 February 2026 / Revised: 8 March 2026 / Accepted: 15 April 2026 / Published: 6 May 2026

Abstract

Background/Objectives: Amyloid-PET is accurate but costly and capacity-limited. Blood-based biomarkers (BBMs), particularly plasma p-tau217, offer a scalable alternative for triaging patients. Objective of this study is to evaluate the diagnostic accuracy and clinical utility of plasma p-tau217 as a pre-screening tool for amyloid-PET positivity, identifying operating thresholds for rule-out and rule-in strategies. Methods: We analyzed 1681 participants from the ADNI cohort with concurrent plasma biomarkers (Fujirebio Lumipulse assays) and 18F-florbetapir PET. The primary outcome was discrimination of amyloid-PET positivity (Centiloid > 20). We compared p-tau217 alone against multivariable models (including Aβ42/40, GFAP, NfL, APOE) using Area Under the Curve (AUC) and Decision Curve Analysis (DCA). Two clinical thresholds were defined: a high-sensitivity “rule-out” cut-off (≥95% sensitivity) and a Youden-optimal “balanced” cut-off. These were validated using stratified bootstrap resampling. Results: Of 1681 participants, 679 (40.4%) were amyloid-positive. In the full sample, plasma p-tau217 alone achieved an AUC of 0.902 (95% CI 0.885–0.918). Operating thresholds were derived on a development split and applied to an independent validation split (N = 505). In the validation cohort, the high-sensitivity threshold (0.106 pg/mL) yielded 94.6% sensitivity and 93.7% NPV, effectively ruling out amyloid pathology. The Youden threshold (0.177 pg/mL) offered 78.9% sensitivity and 86.0% specificity. DCA demonstrated net benefit for p-tau217 screening over “PET all” strategies across clinically relevant probability ranges. Conclusions: Plasma p-tau217 provides high discrimination and clinically interpretable operating points for prioritizing confirmatory PET. Implementing a p-tau217-first strategy could significantly reduce unnecessary imaging without compromising diagnostic safety.

1. Introduction

Alzheimer’s disease (AD) is increasingly conceptualized as a biological continuum rather than solely a clinical syndrome. This paradigm shift was formalized by the National Institute on Aging–Alzheimer’s Association (NIA-AA) research framework, which defines AD in vivo through the presence of β-amyloid (A), pathologic tau (T), and neurodegeneration (N) biomarkers—the AT(N) system [1]. This biological definition has become critical with the recent regulatory approval of anti-amyloid monoclonal antibodies, such as lecanemab and donanemab, which require confirmation of amyloid pathology for treatment eligibility [2,3]. Consequently, health systems worldwide are facing an unprecedented demand for accurate amyloid detection to triage eligible patients [4].
Currently, the reference standards for detecting amyloid pathology are cerebrospinal fluid (CSF) analysis and amyloid-positron emission tomography (PET). Both modalities demonstrate excellent diagnostic accuracy and are widely accepted as “gold standards” [5]. However, their widespread implementation faces significant obstacles. PET is costly and geographically restricted, while lumbar puncture is invasive and limited by contraindications or patient refusal [6]. These constraints create a diagnostic bottleneck, risking delays in accessing disease-modifying therapies.
To address these limitations, high-performance blood-based biomarkers (BBMs) have emerged as a scalable alternative [7,8]. Specifically, plasma phosphorylated tau at threonine-217 (p-tau217) has consistently shown the highest accuracy for discriminating AD pathology, recently receiving attention as a key component of the new diagnostic landscape [9]. While other markers such as plasma Aβ42/40, GFAP, and NfL provide valuable information, recent evidence suggests p-tau217 alone may suffice for detecting amyloid positivity in clinical workflows [10].
However, high diagnostic accuracy (AUC) alone is insufficient for clinical adoption. Clinicians require actionable “operating points” tailored to specific intents—such as a high-sensitivity threshold for safely ruling out pathology, or a balanced threshold for confirming likely cases. Furthermore, as highlighted by the recent International Working Group recommendations, the interpretation of these biomarkers must distinguish between “at-risk” status and clinical disease [11].
In this study, using the Alzheimer’s Disease Neuroimaging Initiative (ADNI) cohort, we evaluated plasma p-tau217 as a pre-screening test for amyloid-PET positivity. We aimed to: (1) compare the performance of p-tau217 alone versus multivariable models; (2) assess clinical utility using Decision Curve Analysis (DCA); and (3) define robust cut-offs for “rule-out” and “rule-in” strategies to optimize referrals to confirmatory imaging.

2. Materials and Methods

2.1. Study Design and Participants

Data used in the preparation of this article were obtained from the Alzheimer’s Disease Neuroimaging Initiative (ADNI) database (https://adni.loni.usc.edu). The ADNI was launched in 2003 as a public–private partnership, led by Principal Investigator Michael W. Weiner, MD. The primary goal of ADNI has been to test whether serial magnetic resonance imaging (MRI), positron emission tomography (PET), other biological markers, and clinical and neuropsychological assessment can be combined to measure the progression of mild cognitive impairment (MCI) and early Alzheimer’s disease (AD) [12].
We conducted a cross-sectional diagnostic accuracy study adhering to the Standards for Reporting Diagnostic Accuracy (STARD 2015) guidelines [13]. Inclusion criteria for the present analysis were: (1) availability of valid plasma biomarker data for p-tau217 analyzed via the designated platform; (2) a concurrent ^18F-florbetapir amyloid-PET scan; and (3) a time interval between blood draw and PET scan of ≤180 days, to minimize the risk of biological progression. Participants with incomplete demographic data, technical failures in PET acquisition, or hemolyzed plasma samples were excluded. Written informed consent was obtained from all participants or their authorized representatives at each ADNI site.

2.2. Amyloid-PET Reference Standard

The reference standard for this study was global cortical amyloid-β load measured by 18F-florbetapir PET. PET data were acquired across multiple sites and scanners but were harmonized using standard ADNI preprocessing protocols. Images were processed according to the UC Berkeley pipeline, which creates a standardized uptake value ratio (SUVR) map using the whole cerebellum as the reference region.
To ensure interoperability and clinical translation, SUVR values were converted to the Centiloid (CL) scale using the specific transformation equation derived for 18F-florbetapir [14]. Consistent with established cut-offs validated against neuropathology, amyloid-PET positivity (A+) was defined as a Centiloid value > 20 CL. This threshold was chosen to detect established amyloid pathology while minimizing noise from early accumulation.

2.3. Plasma Biomarker Quantification

Plasma biomarkers were analyzed using the Lumipulse G1200 fully automated chemiluminescent enzyme immunoassay (CLEIA) platform (Fujirebio Europe, Ghent, Belgium). This platform was selected for its high analytical sensitivity, precision, and potential for widespread clinical implementation. Blood samples were collected in EDTA tubes, centrifuged, aliquoted, and stored at −80 °C at the ADNI Biomarker Core Laboratory following standardized pre-analytical protocols to minimize degradation.
The biomarker panel included plasma p-tau217, Aβ42, Aβ40, GFAP, and NfL. The plasma Aβ42/40 ratio was calculated from the individual concentrations. All assays were performed by technicians blinded to the participants’ clinical and amyloid-PET status. To address potential assay variability and batch effects, we utilized the Lumipulse G1200 platform, which is a fully automated system utilizing ready-to-use reagent cartridges. This automation eliminates manual pipetting steps and standardizes incubation times, thereby inherently mitigating the lot-to-lot and day-to-day batch effects commonly observed in manual assays. Quality control (QC) was strictly monitored using internal calibration standards run at the beginning of each analytical batch. Both intra-assay and inter-assay coefficients of variation (CV) were evaluated, and any samples with CVs exceeding the platform’s pre-defined acceptable limits were systematically re-analyzed or excluded from the final dataset. Plasma p-tau217 was pre-specified as the primary predictor of interest.

2.4. Statistical Analysis

2.4.1. Descriptive Statistics and Discrimination

Continuous variables were tested for normality using the ShapirozWilk test. Group comparisons were performed using the non-parametric Wilcoxon rank-sum test. We fitted a series of univariate and multivariable logistic regression models to predict binary amyloid-PET status: Model 1 (p-tau217 alone), Model 2 (M1 + Aβ42/40), Model 3 (M2 + GFAP + NfL), and Model 4 (M3 + APOE ε4). Discrimination was quantified using the Area Under the ROC Curve (AUC) and compared using DeLong’s test [15].

2.4.2. Threshold Derivation and Robust Internal Validation

To define clinically actionable cut-offs, we identified two operating points:
  • High-Sensitivity (“Rule-Out”) Threshold: Derived to fix sensitivity at ≥95%, prioritizing the minimization of False Negatives.
  • Youden-Optimal (“Rule-In”) Threshold: Calculated to maximize the Youden Index (J = Sensitivity + Specificity − 1).
Regarding missing data, participants lacking concurrent PET status (N = 11) constituted a negligible fraction (<1%) of the initial screened cohort (N = 1692). Given this extremely low proportion, missingness was assumed to be completely at random, and data were handled using a complete-case analysis approach (listwise deletion) without employing multiple imputation, thereby avoiding the introduction of synthetic variance. For threshold derivation and validation, the dataset was partitioned into a development split and an independent validation split (N = 505). In the development split, we performed a rigorous internal validation using stratified bootstrap resampling (B = 2000 bootstrap samples) to derive the operating points, which were subsequently tested on the validation split. The thresholds were re-derived in each iteration, and performance metrics (Sensitivity, Specificity, PPV, NPV, Likelihood Ratios) were calculated. We report the bias-corrected 95% percentile confidence intervals (CIs).

2.5. Clinical Utility

We performed Decision Curve Analysis (DCA) to evaluate the net benefit of the p-tau217-first strategy compared to “PET all” and “PET none” strategies across a range of threshold probabilities. All analyses were performed using R 4.5.2. ROC curve analysis and comparison were performed using the ‘pROC’ package. Decision curve analysis was conducted using the ‘dcurves’ (or ‘rmda’) package. Bootstrap resampling was performed using the ‘boot’ package. Statistical significance was set at p < 0.05 (two-sided).

3. Results

3.1. Study Participants and Descriptive Statistics

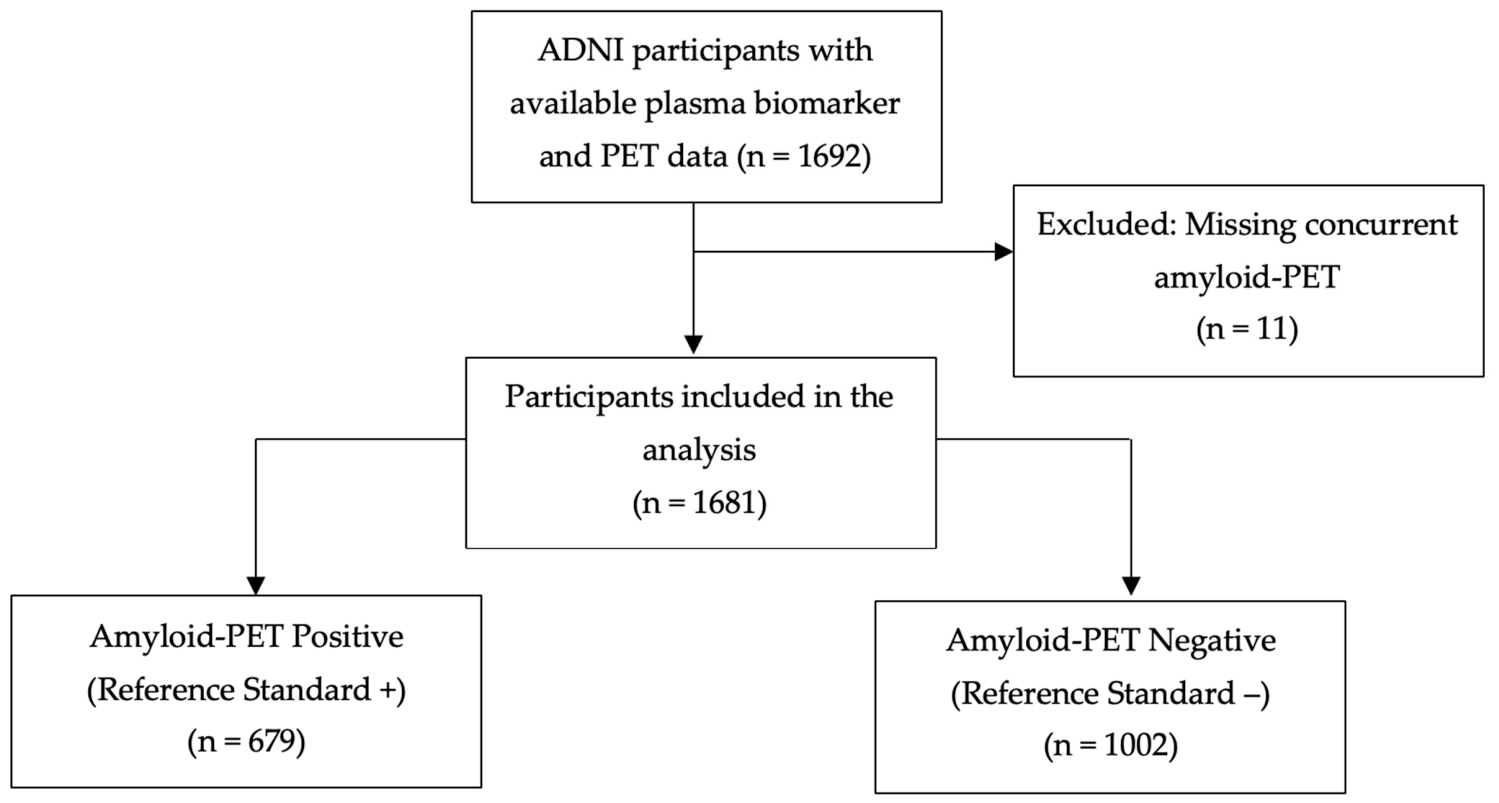
We identified 1692 rows after linkage of plasma biomarker and PET files by ADNI Research ID; 11 lacked PET status and were excluded, yielding 1681 participants with both plasma biomarkers and amyloid-PET (Figure 1).
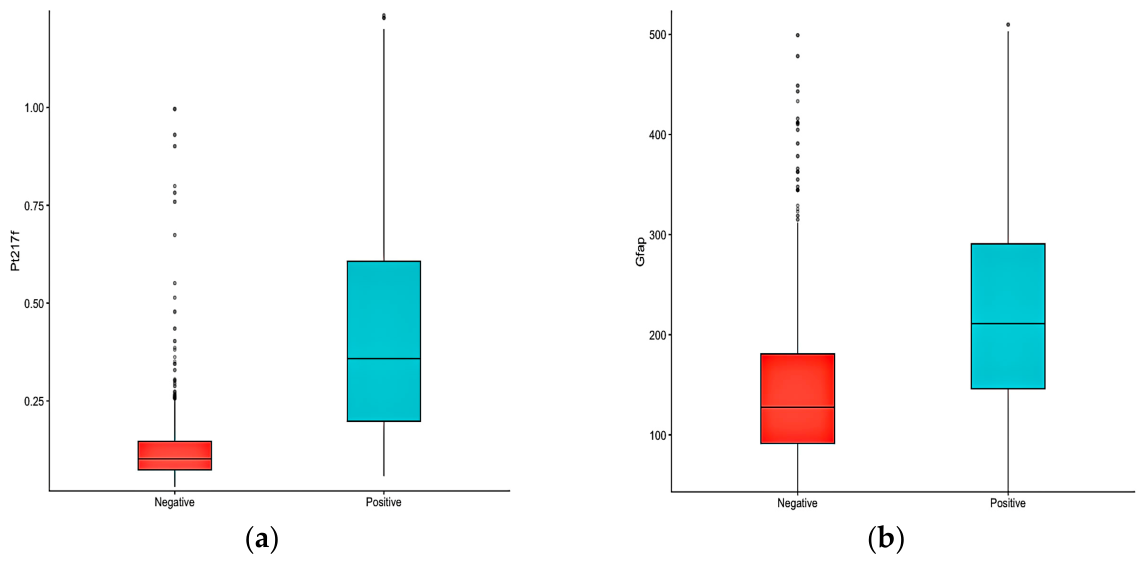
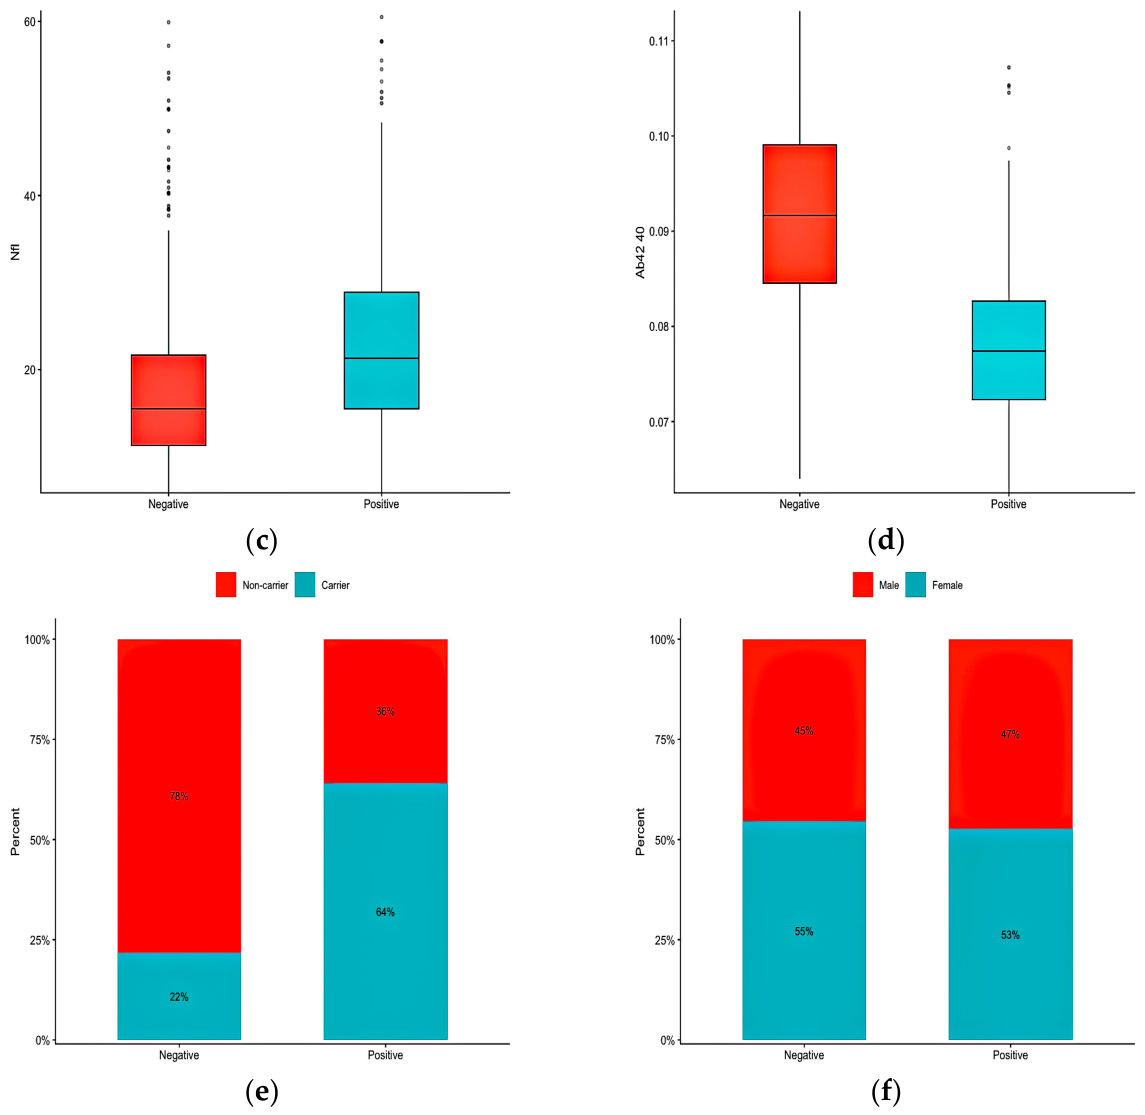
The blood-draw-to-PET interval had a median of 8 days (IQR 1–28; range 0–180). Overall, 679/1681 (40.4%) were amyloid-PET positive (Centiloid > 20). Demographic and biomarker characteristics are summarized in Table 1. As expected, amyloid-positive (A+) participants were older, more likely to be APOE ε4 carriers (64.1% vs. 21.8%), and had significantly higher plasma p-tau217, GFAP, and NfL levels compared to amyloid-negative (A−) participants (p < 0.001 for all). Although plasma Aβ42/40 was significantly lower in the A+ group in univariate comparison (p < 0.001), the overlap between groups was substantial compared to p-tau217 (Figure 2).

3.2. Univariate and Multivariable Discrimination Models

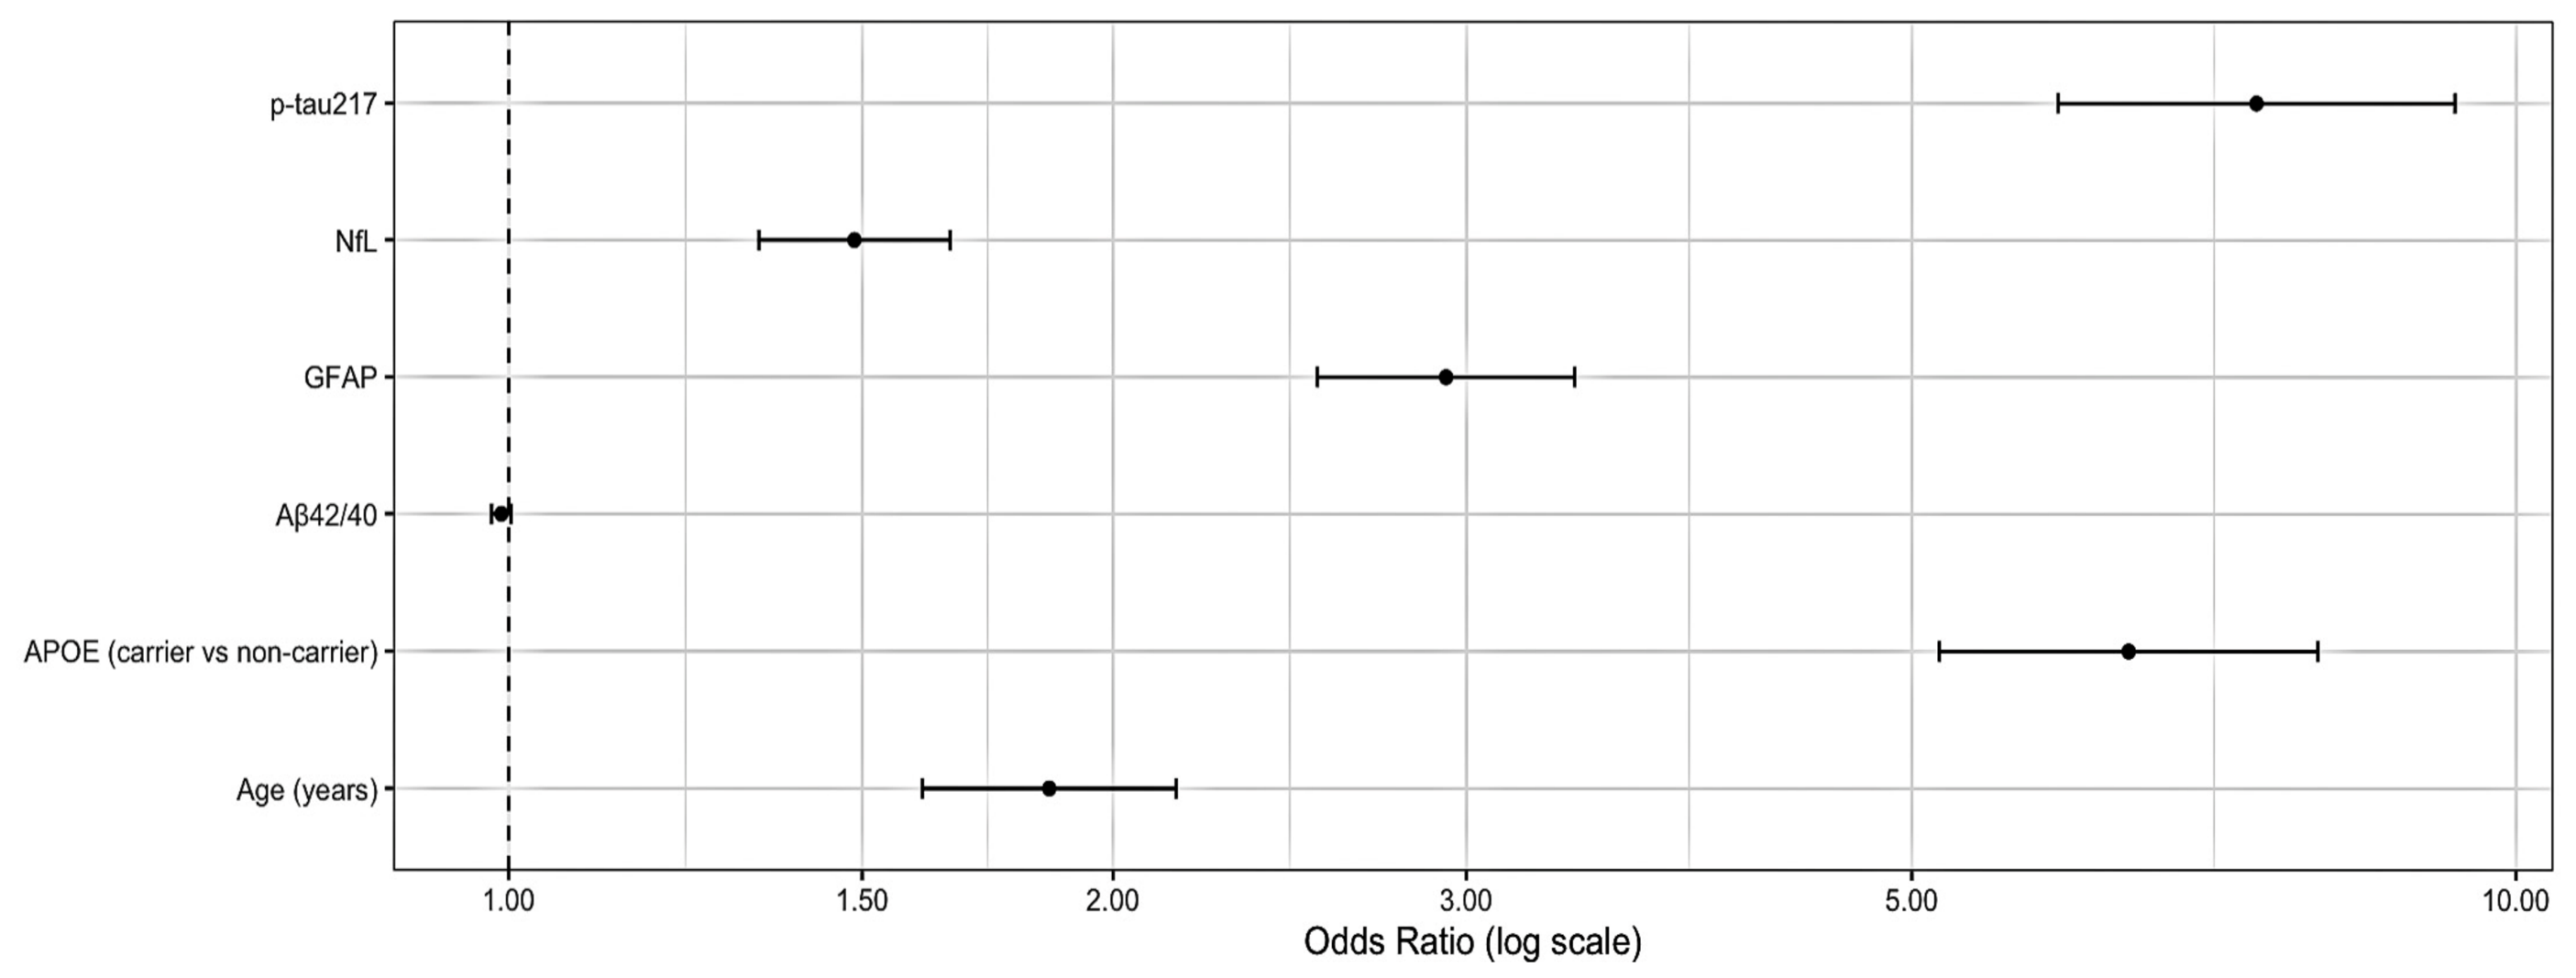
In univariate logistic regression (odds ratios [OR] per IQR for continuous predictors), plasma p-tau217 showed a strong association with PET positivity (full estimates in Table S1; univariate forest plot in Figure 3).
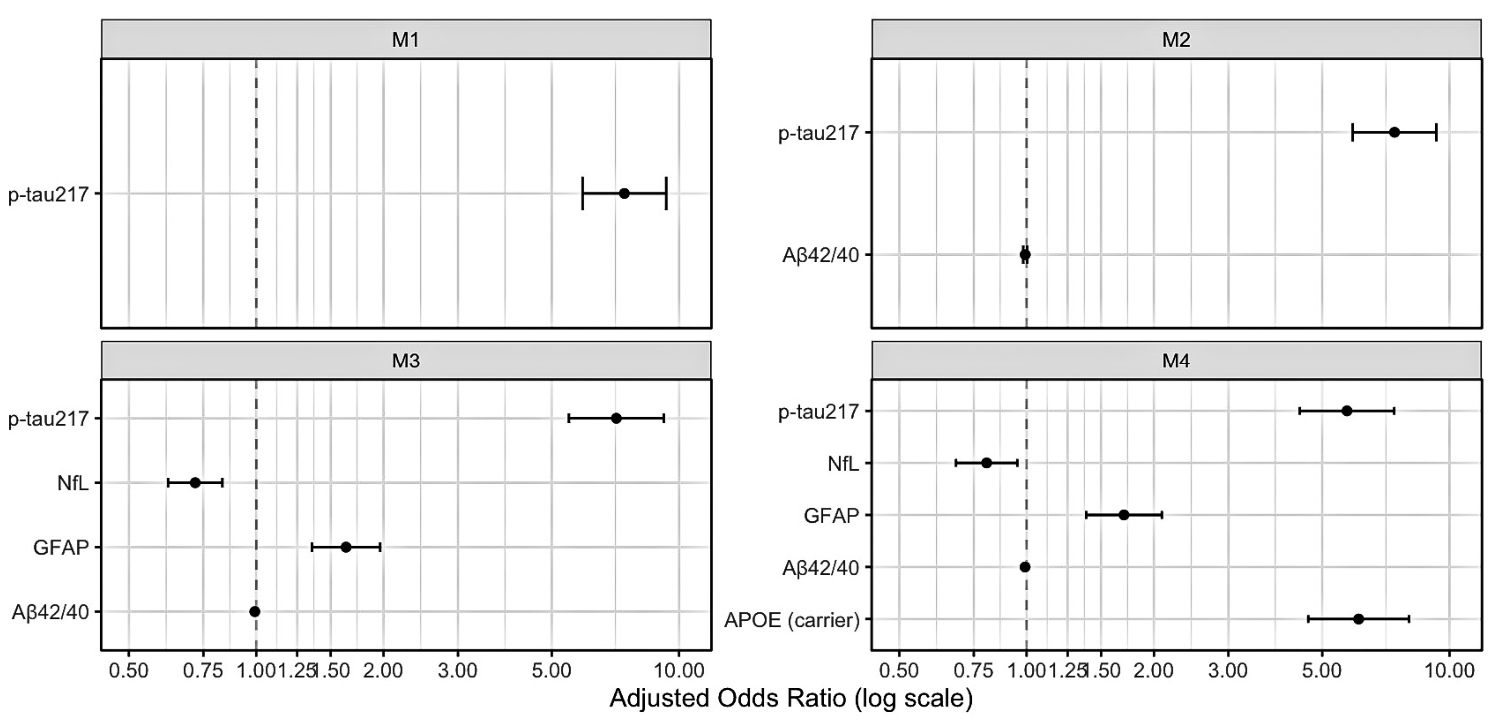
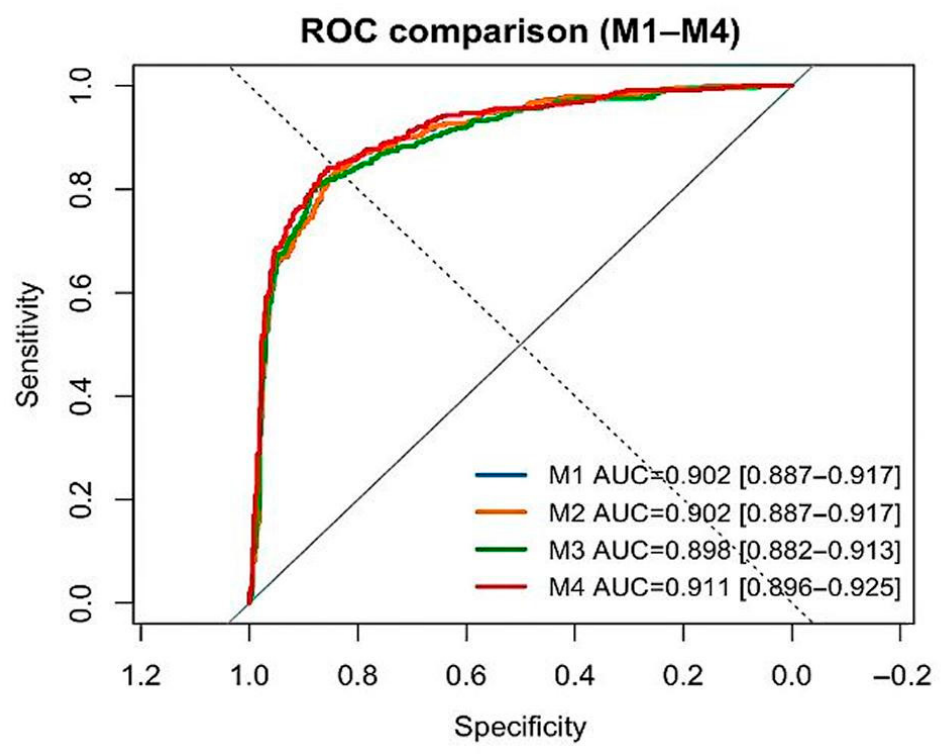
Multivariable models were then fitted to assess incremental discrimination: M1 (p-tau217), M2 (+Aβ42/40), M3 (+GFAP, NfL), M4 (+APOE). Model summaries include adjusted ORs (per IQR), 95% CIs and p-values, AUC with DeLong 95% CIs, Brier score, McFadden’s R2, ΔAIC, and calibration (intercept/slope and plots) (Tables S2 and S3; Figure 4). Comparative ROC curves are shown in Figure 5.

3.3. Clinical Utility and Decision Curve Analysis

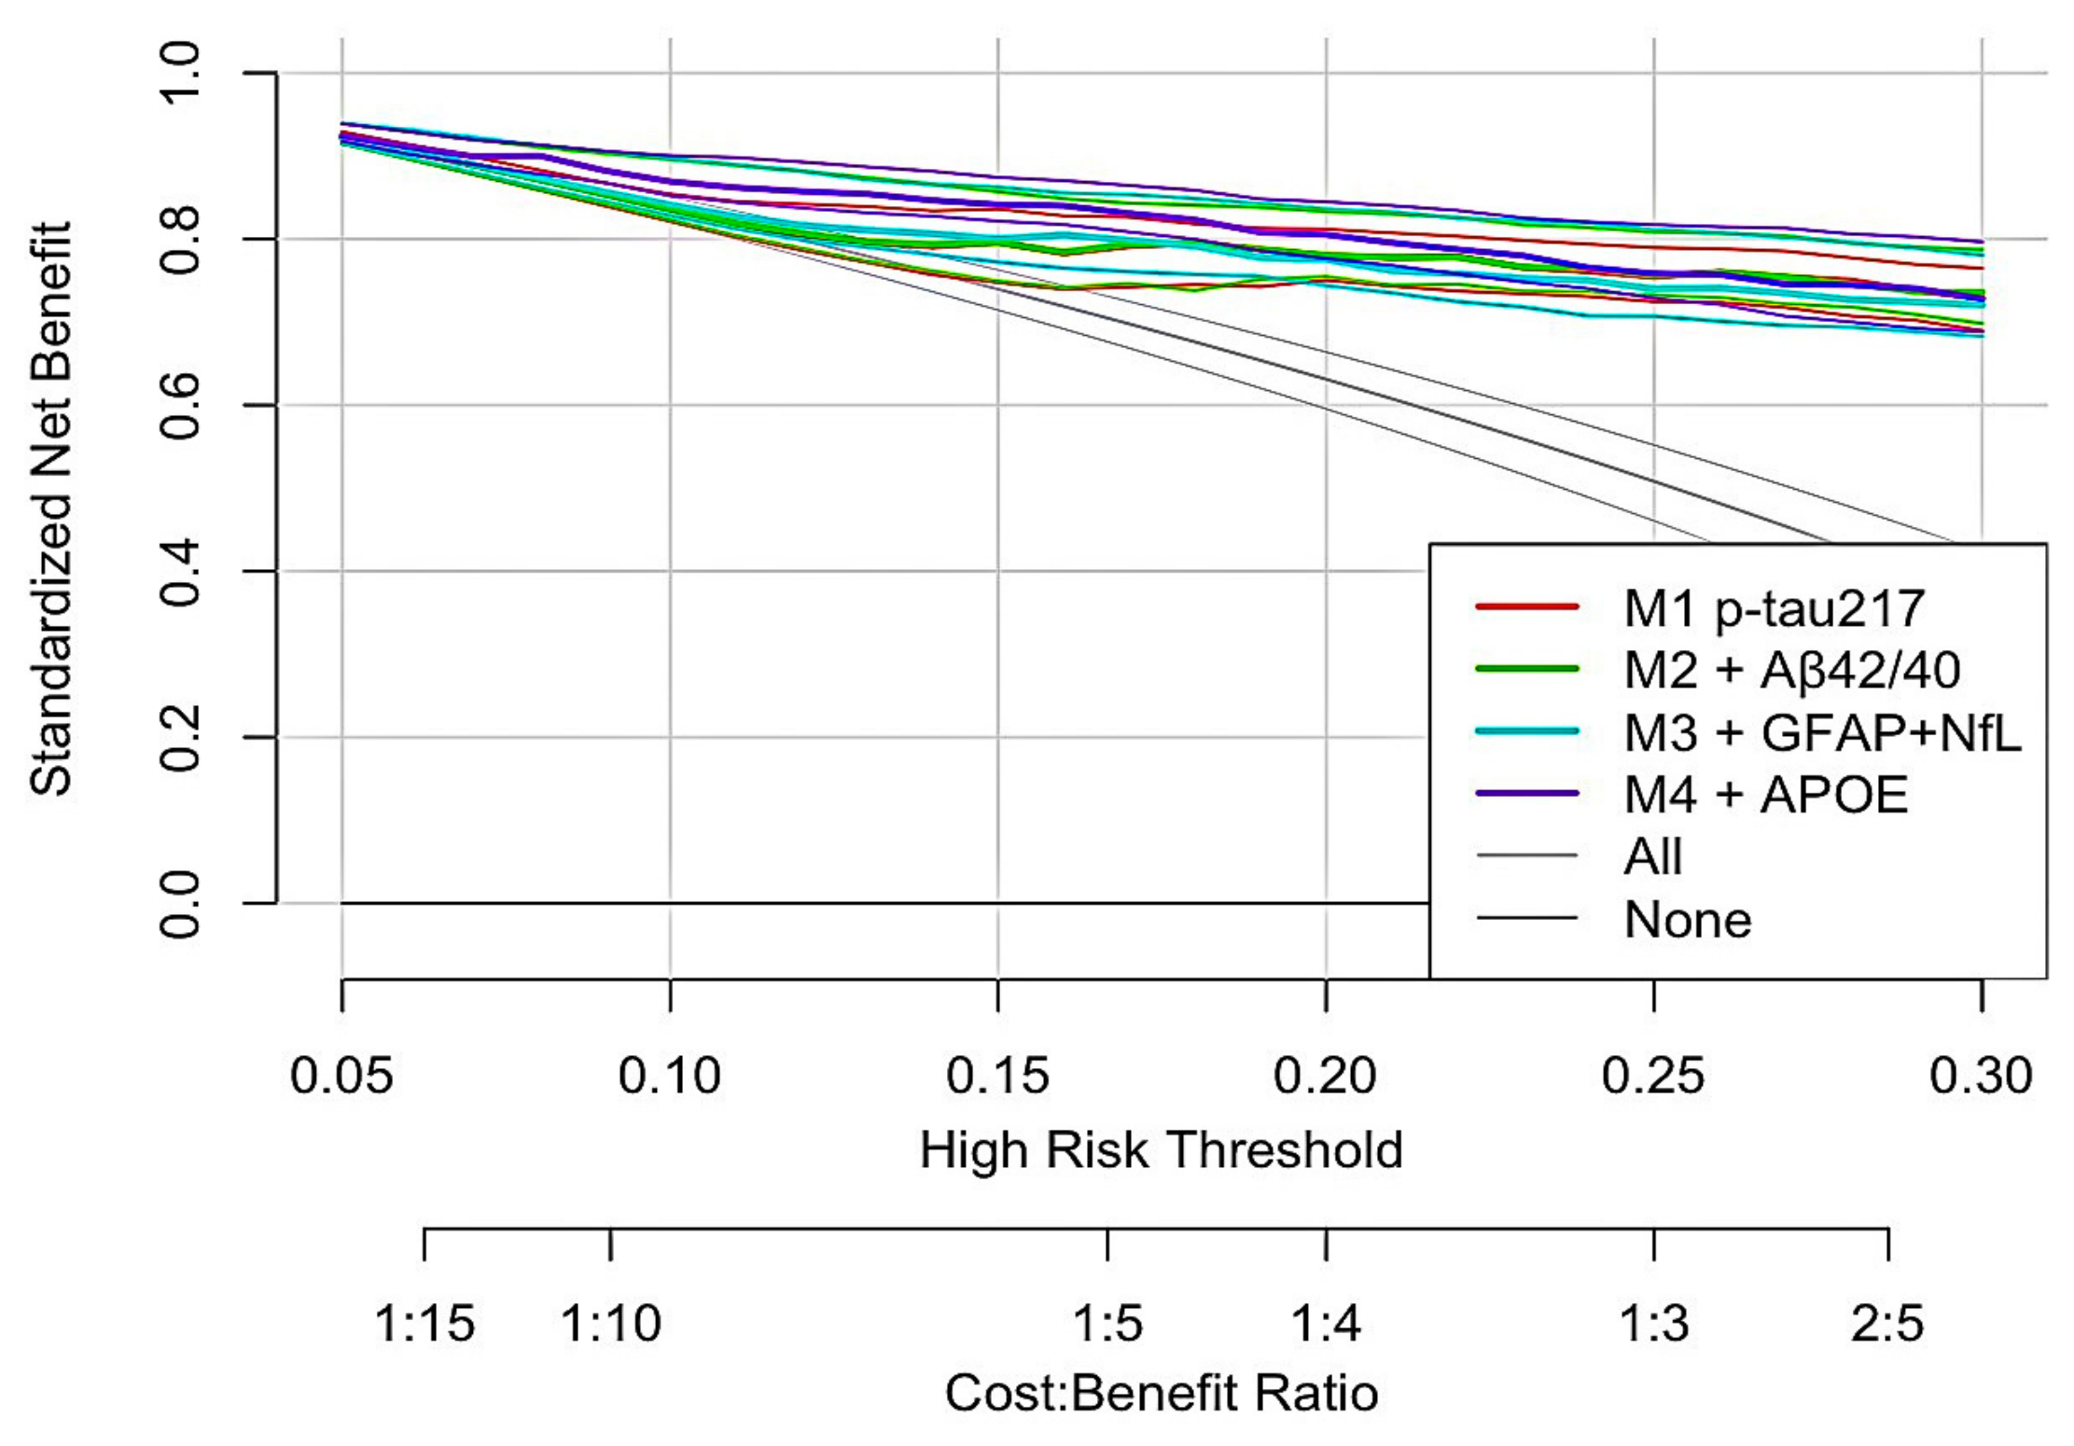
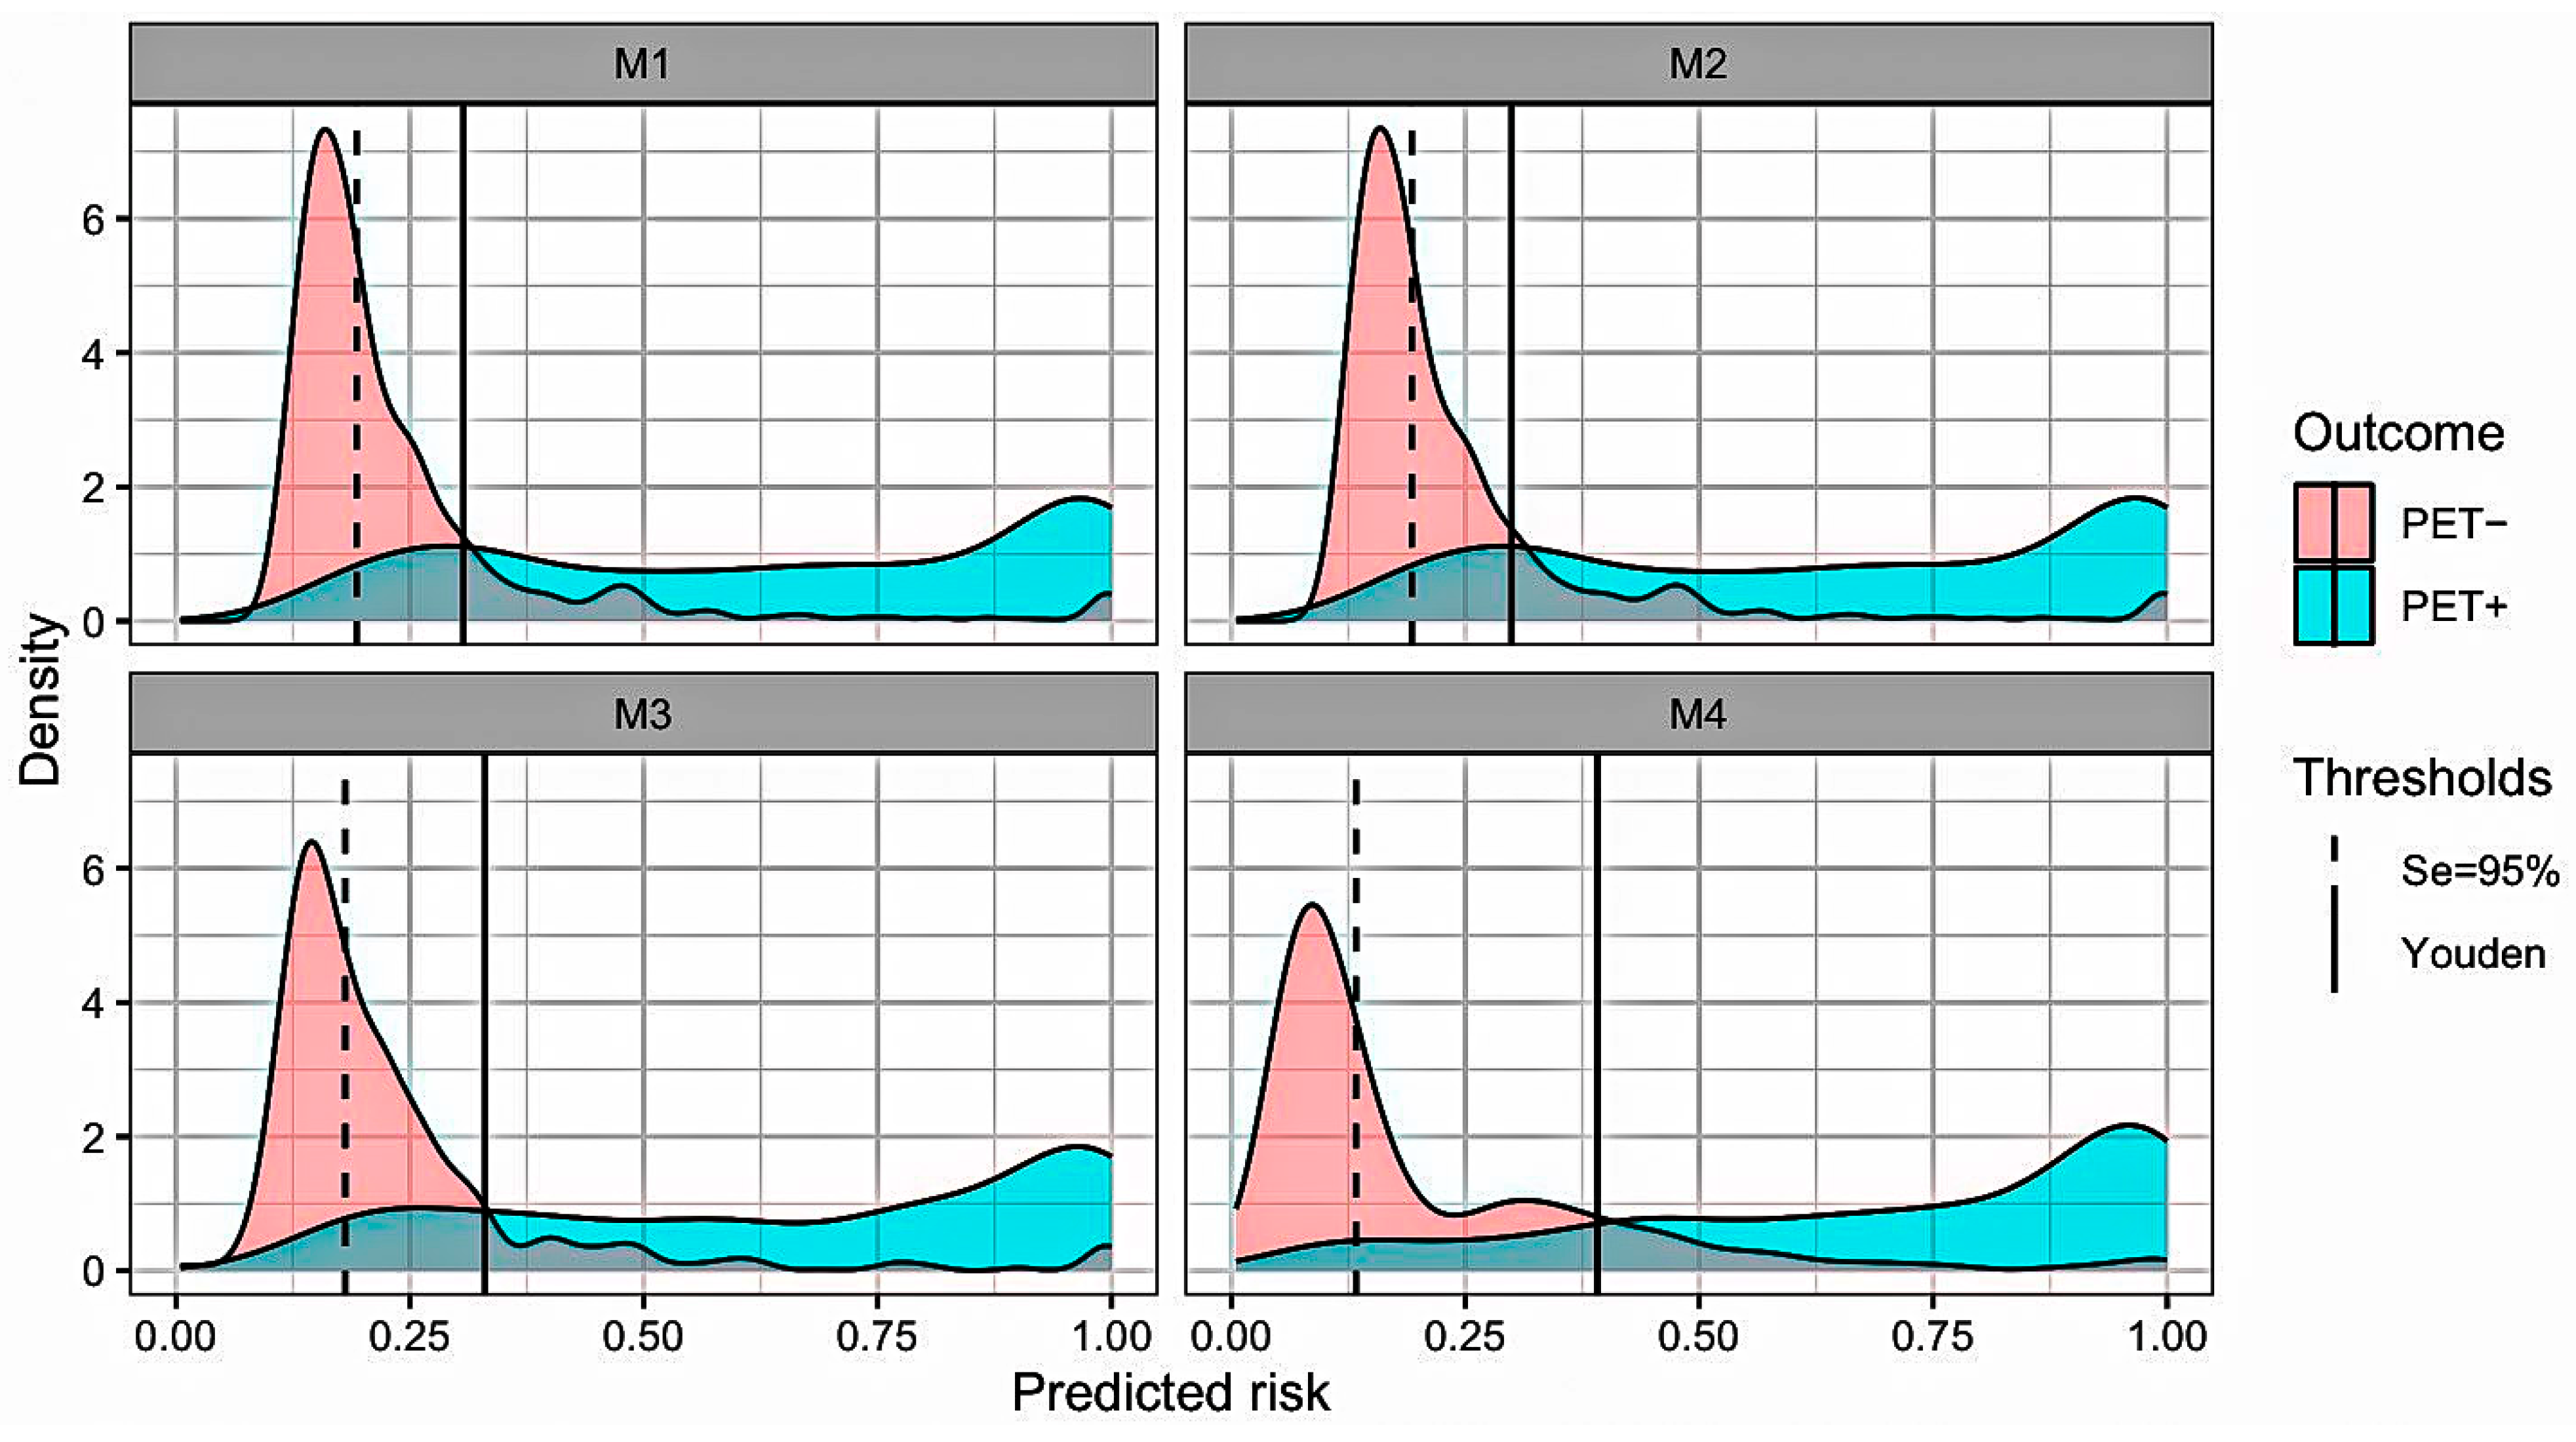
Discrimination and threshold-based performance of M1 were broadly comparable to those of more complex models, with limited incremental gains in sensitivity/specificity or predictive values. Decision-curve analysis showed net benefit for p-tau217 alone overlapping with, or not meaningfully inferior to, that of extended models (Figure 6); risk-distribution plots confirmed clear separation of predicted probabilities between PET− and PET+ for M1, with only modest additional separation after adding other biomarkers (Figure 7).

3.4. Primary Outcome and Threshold Validation

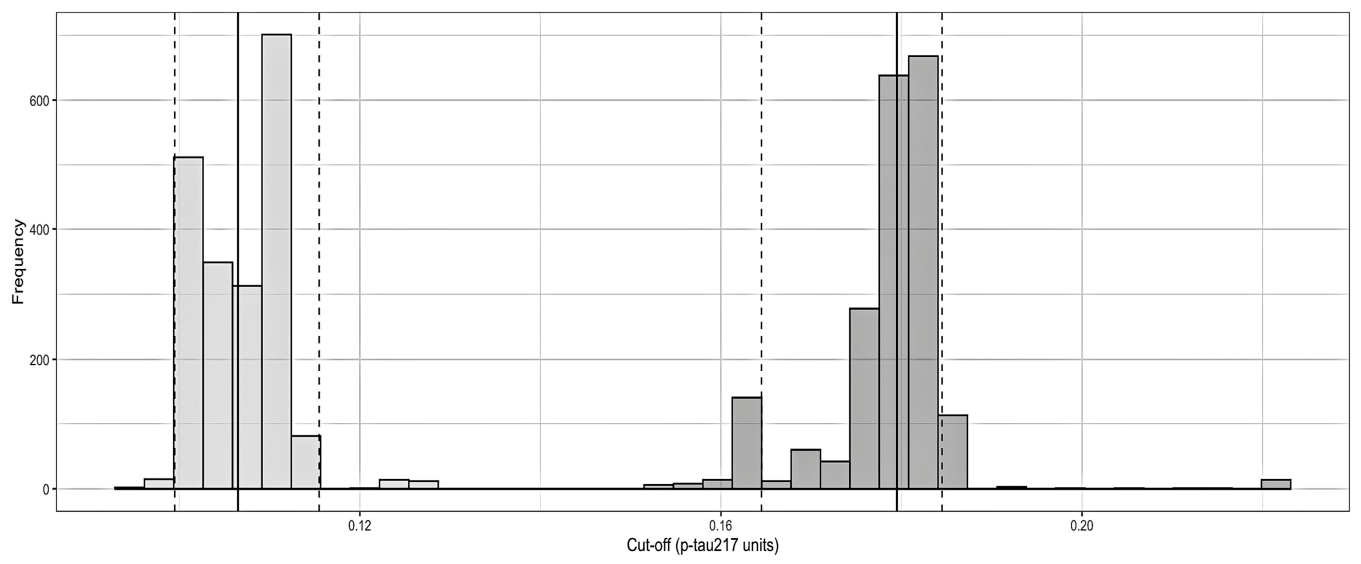
As a continuous test for PET positivity, plasma p-tau217 achieved an AUC of 0.902 (95% CI 0.885–0.918). We then evaluated two prespecified operating thresholds derived on the development split (performance detailed in Table S4) and quantified by stratified non-parametric bootstrap (B = 2000; percentile 95% CIs); the resulting cut-offs (~0.106 for high-sensitivity and ~0.177 for Youden) were frozen and applied unchanged to the validation split. When applied to the independent validation split (N = 505), the high-sensitivity threshold (0.106 pg/mL) yielded a Sensitivity of 94.6%, Specificity of 54.2%, PPV of 58.3%, and NPV of 93.7%; absolute counts in the validation cohort were TP 193, FP 138, TN 163, FN 11. At the Youden-optimal threshold (0.177 pg/mL), performance in the validation split was: Sensitivity 78.9%, Specificity of 86.0%, PPV of 79.3%, and NPV of 85.8%; absolute counts were TP 161, FP 42, TN 259, FN 43 (Table S5, Figure 8).

4. Discussion

In this diagnostic accuracy study leveraging the large ADNI cohort, we demonstrate that plasma p-tau217, measured via a widely accessible automated immunoassay, offers high discrimination for amyloid-PET positivity. Our findings indicate that a parsimonious single-marker model performs equivalently to more complex panels including plasma Aβ42/40, GFAP, NfL, and APOE genotype. Furthermore, by applying Decision Curve Analysis and deriving robust “rule-out” and “rule-in” thresholds, we provide a clinically actionable framework. This approach aligns with the emerging need to streamline the diagnostic pathway for Alzheimer’s disease (AD), potentially reducing the need for confirmatory PET scans by over 50% without compromising diagnostic safety.

4.1. Comparison with Emerging Frameworks and Biomarker Dynamics

Our results consolidate the consensus that p-tau217 is the premier blood-based biomarker for amyloid pathology, a position recently reinforced by major reviews of the diagnostic landscape [10,16]. Consistent with these reports, we found that adding plasma Aβ42/40 provided negligible incremental diagnostic value. While CSF Aβ42/40 remains a reference standard, plasma Aβ42/40 measured by immunoassays (such as the Lumipulse platform used here) often exhibits a narrower dynamic range compared to Mass Spectrometry [17]. However, the Lumipulse platform itself has been recognized for its automation and potential for widespread clinical adoption [16]. Our data suggest that in this automated context, p-tau217 is sufficiently robust to serve as a standalone “gatekeeper,” and the addition of the plasma Aβ42/40 ratio as a separate covariate provides negligible incremental diagnostic value for initial triage.

4.2. Clinical Utility: Navigating the “At-Risk” State

A key contribution of this work is the translation of statistical discrimination (AUC) into operational strategies that respect the latest nosological recommendations. We defined a “rule-in” threshold (0.177 pg/mL) to identify individuals with a high probability of amyloid pathology.
However, as strongly emphasized by the recent International Working Group (IWG) recommendations [11], the interpretation of these biomarkers requires strict clinical contextualization, particularly in asymptomatic individuals. A positive p-tau217 result in a cognitively unimpaired person strictly denotes an “at-risk” biological state—confirming the presence of AD-related pathophysiological changes—but it must never be conflated with a clinical diagnosis of Alzheimer’s disease. The temporal lag between amyloid/tau accumulation and the onset of cognitive decline can span decades. Furthermore, the trajectory from biological positivity to clinical dementia is highly probabilistic, not deterministic. It is heavily modulated by individual resilience, cognitive reserve, advancing age, and the presence of non-AD co-pathologies (e.g., vascular disease). Consequently, deploying a “rule-in” biomarker strategy in asymptomatic populations raises profound ethical and clinical challenges. Disclosing a positive biomarker status without objective cognitive impairment risks inducing severe psychological burden and “biomarker-driven anxiety,” while offering limited prognostic certainty regarding if or when dementia will actually develop. Therefore, biomarker positivity should not be used for deterministic labeling in routine practice. Instead, our high-specificity threshold is best utilized within specialized settings to prioritize patients for rigorous longitudinal clinical monitoring, comprehensive neuropsychological evaluation, or to determine eligibility for secondary prevention trials and emerging disease-modifying therapies (DMTs). Ultimately, while plasma p-tau217 is a powerful tool for detecting the biological footprint of AD, the diagnosis of dementia remains a fundamentally clinical exercise.
Conversely, our high-sensitivity “rule-out” threshold (0.106 pg/mL) yielded a Negative Likelihood Ratio of 0.09. In a specialized memory clinic setting, this would allow clinicians to safely defer expensive imaging for most negative patients, focusing resources on those who truly need them.

4.3. Systemic Implications and Cost-Effectiveness

The implementation of such a triage strategy addresses a critical urgency. As highlighted in the recent Lancet Series on AD outlook [16], health systems are facing a “bottleneck” due to the approval of anti-amyloid monoclonal antibodies [4]. The demand for amyloid confirmation is expected to far exceed PET and CSF capacity. Adopting a p-tau217-first strategy, as supported by our Decision Curve Analysis, offers a sustainable solution: it reduces the burden on specialized memory clinics and reserves scarce PET slots for complex or equivocal cases. This biomarker-guided pathway is essential to ensure equitable access to diagnosis and potential treatment, mitigating the disparities often seen in high-cost diagnostic settings [18,19].
Despite the clear advantages of a p-tau217-first strategy, several practical implementation barriers must be overcome before widespread clinical adoption. First, laboratory standardization remains a critical hurdle; pre-analytical sample handling, centrifugation protocols, and storage conditions can significantly impact biomarker yield. Second, the field currently lacks harmonized cut-offs across different analytical platforms and laboratory environments. Establishing global reference materials is essential to ensure that a specific pg/mL value holds the same clinical weight universally. Finally, reimbursement pathways present a major bottleneck. Healthcare systems and insurance providers are currently grappling with the cost-effectiveness of reimbursing BBMs, particularly when ordered outside of specialized memory clinics or for patients with ambiguous cognitive profiles. Clear guidelines linking biomarker results to actionable therapeutic or diagnostic steps are urgently needed to secure broad reimbursement.

4.4. Limitations and Generalizability

Our findings must be interpreted within the context of several limitations. First, our data extraction focused strictly on the biological AT(N) continuum, meaning syndromic clinical labels (CN, MCI, AD dementia) were not included in the models. Pooling accuracy across this broad clinical spectrum introduces a spectrum bias. Second, the ADNI cohort is a selected research population with a high prevalence of amyloid positivity (~40%), substantially higher than in unselected primary care populations [20]. In a lower-prevalence primary care setting, the Positive Predictive Value (PPV) would substantially decrease, leading to more false positives if used as a standalone diagnostic tool. Conversely, the Negative Predictive Value (NPV) would increase, reinforcing the safety of the “rule-out” strategy. Therefore, our thresholds are best suited for specialized memory clinics rather than general primary care. Third, the ADNI cohort is predominantly Caucasian and highly educated; future studies must validate these specific p-tau217 thresholds in cohorts with greater ethnic, socioeconomic, and medical comorbidity diversity [18,19]. Finally, we focused on biological prediction of amyloid status; as noted by the IWG [11], the translation from amyloid positivity to clinical dementia is probabilistic, not deterministic, and clinical judgment remains paramount.

5. Conclusions

Plasma p-tau217 stands out as a robust, standalone tool for amyloid triage. By validating specific operating points for ruling out and ruling in pathology, this study supports a pragmatic workflow that integrates seamlessly with the new diagnostic and therapeutic landscape described by recent major guidelines. Implementing this p-tau217-first strategy represents a scalable, cost-effective path to manage the growing demand for AD diagnosis in specialized clinical settings.

Supplementary Materials

The following supporting information can be downloaded at https://www.mdpi.com/article/10.3390/jdad3020022/s1. Table S1: Full estimates of univariate logistic regression models for all candidate biomarkers; Table S2: Multivariable logistic regression models: adjusted Odds Ratios and p-values; Table S3: Model calibration metrics and detailed ROC analysis; Table S4: Detailed performance metrics at the High-Sensitivity and Youden thresholds; Table S5: Bootstrap percentile confidence intervals for diagnostic thresholds.

Author Contributions

Conceptualization, T.P. and P.R.; Methodology, T.P.; Formal Analysis, P.R. and V.B.; Investigation, V.B.; Data Curation, P.R.; Writing—Original Draft Preparation, P.R.; Writing—Review and Editing, T.P. and V.B.; Supervision, T.P. All authors have read and agreed to the published version of the manuscript.

Funding

Data collection and sharing for this project was funded by the Alzheimer’s Disease Neuroimaging Initiative (ADNI) (National Institutes of Health Grant U01 AG024904) and DOD ADNI (Department of Defense award number W81XWH-12-2-0012).

Institutional Review Board Statement

Ethical review and approval were waived for this study due to the use of de-identified data from the ADNI repository. The ADNI study was approved by the Institutional Review Boards of all participating institutions.

Informed Consent Statement

Informed consent was obtained from all subjects involved in the study via the ADNI protocol.

Data Availability Statement

Publicly available datasets were analyzed in this study. This data can be found here: https://adni.loni.usc.edu.

Acknowledgments

During the preparation of this manuscript/study, the author(s) used [R studio, 4.5.2] for the purposes of statistical analysis. The authors have reviewed and edited the output and take full responsibility for the content of this publication.

Conflicts of Interest

The authors declare no conflict of interest.

References

  1. Jack, C.R.; Bennett, D.A.; Blennow, K.; Carrillo, M.C.; Dunn, B.; Haeberlein, S.B.; Holtzman, D.M.; Jagust, W.; Jessen, F.; Karlawish, J.; et al. NIA-AA Research Framework: Toward a Biological Definition of Alzheimer’s Disease. Alzheimer Dement. 2018, 14, 535–562. [Google Scholar] [CrossRef] [PubMed]
  2. Van Dyck, C.H.; Swanson, C.J.; Aisen, P.; Bateman, R.J.; Chen, C.; Gee, M.; Kanekiyo, M.; Li, D.; Reyderman, L.; Cohen, S.; et al. Lecanemab in Early Alzheimer’s Disease. N. Engl. J. Med. 2023, 388, 9–21. [Google Scholar] [CrossRef] [PubMed]
  3. Sims, J.R.; Zimmer, J.A.; Evans, C.D.; Lu, M.; Ardayfio, P.; Sparks, J.; Wessels, A.M.; Shcherbinin, S.; Wang, H.; Monkul Nery, E.S.; et al. Donanemab in Early Symptomatic Alzheimer Disease: The TRAILBLAZER-ALZ 2 Randomized Clinical Trial. JAMA 2023, 330, 512. [Google Scholar] [CrossRef] [PubMed]
  4. Fox, N.C.; Belder, C.; Ballard, C.; Kales, H.C.; Mummery, C.; Caramelli, P.; Ciccarelli, O.; Frederiksen, K.S.; Gomez-Isla, T.; Ismail, Z.; et al. Treatment for Alzheimer’s Disease. Lancet 2025, 406, 1408–1423. [Google Scholar] [CrossRef] [PubMed]
  5. Clark, C.M. Use of Florbetapir-PET for Imaging β-Amyloid Pathology. JAMA 2011, 305, 275. [Google Scholar] [CrossRef] [PubMed]
  6. Howell, J.C.; Parker, M.W.; Watts, K.D.; Kollhoff, A.; Tsvetkova, D.Z.; Hu, W.T. Research Lumbar Punctures among African Americans and Caucasians: Perception Predicts Experience. Front. Aging Neurosci. 2016, 8, 296. [Google Scholar] [CrossRef] [PubMed]
  7. Hansson, O.; Blennow, K.; Zetterberg, H.; Dage, J. Blood Biomarkers for Alzheimer’s Disease in Clinical Practice and Trials. Nat. Aging 2023, 3, 506–519. [Google Scholar] [CrossRef] [PubMed]
  8. Teunissen, C.E.; Verberk, I.M.W.; Thijssen, E.H.; Vermunt, L.; Hansson, O.; Zetterberg, H.; Van Der Flier, W.M.; Mielke, M.M.; Del Campo, M. Blood-Based Biomarkers for Alzheimer’s Disease: Towards Clinical Implementation. Lancet Neurol. 2022, 21, 66–77. [Google Scholar] [CrossRef] [PubMed]
  9. Frisoni, G.B.; Hansson, O.; Nichols, E.; Garibotto, V.; Schindler, S.E.; Van Der Flier, W.M.; Jessen, F.; Villain, N.; Arenaza-Urquijo, E.M.; Crivelli, L.; et al. New Landscape of the Diagnosis of Alzheimer’s Disease. Lancet 2025, 406, 1389–1407. [Google Scholar] [CrossRef] [PubMed]
  10. Ashton, N.J.; Brum, W.S.; Di Molfetta, G.; Benedet, A.L.; Arslan, B.; Jonaitis, E.; Langhough, R.E.; Cody, K.; Wilson, R.; Carlsson, C.M.; et al. Diagnostic Accuracy of a Plasma Phosphorylated Tau 217 Immunoassay for Alzheimer Disease Pathology. JAMA Neurol. 2024, 81, 255. [Google Scholar] [CrossRef] [PubMed]
  11. Dubois, B.; Villain, N.; Schneider, L.; Fox, N.; Campbell, N.; Galasko, D.; Kivipelto, M.; Jessen, F.; Hanseeuw, B.; Boada, M.; et al. Alzheimer Disease as a Clinical-Biological Construct—An International Working Group Recommendation. JAMA Neurol. 2024, 81, 1304. [Google Scholar] [CrossRef] [PubMed]
  12. Mueller, S.G.; Weiner, M.W.; Thal, L.J.; Petersen, R.C.; Jack, C.R.; Jagust, W.; Trojanowski, J.Q.; Toga, A.W.; Beckett, L. Ways toward an Early Diagnosis in Alzheimer’s Disease: The Alzheimer’s Disease Neuroimaging Initiative (ADNI). Alzheimer Dement. 2005, 1, 55–66. [Google Scholar] [CrossRef] [PubMed]
  13. Bossuyt, P.M.; Reitsma, J.B.; Bruns, D.E.; Gatsonis, C.A.; Glasziou, P.P.; Irwig, L.; Lijmer, J.G.; Moher, D.; Rennie, D.; De Vet, H.C.W.; et al. STARD 2015: An Updated List of Essential Items for Reporting Diagnostic Accuracy Studies. BMJ 2015, 351, h5527. [Google Scholar] [CrossRef] [PubMed]
  14. Klunk, W.E.; Koeppe, R.A.; Price, J.C.; Benzinger, T.L.; Devous, M.D.; Jagust, W.J.; Johnson, K.A.; Mathis, C.A.; Minhas, D.; Pontecorvo, M.J.; et al. The Centiloid Project: Standardizing Quantitative Amyloid Plaque Estimation by PET. Alzheimer Dement. 2015, 11, 1–15.e4. [Google Scholar] [CrossRef] [PubMed]
  15. DeLong, E.R.; DeLong, D.M.; Clarke-Pearson, D.L. Comparing the Areas under Two or More Correlated Receiver Operating Characteristic Curves: A Nonparametric Approach. Biometrics 1988, 44, 837. [Google Scholar] [CrossRef] [PubMed]
  16. Frisoni, G.B.; Aho, E.; Brayne, C.; Ciccarelli, O.; Dubois, B.; Fox, N.C.; Frederiksen, K.S.; Gabay, C.; Garibotto, V.; Hofmarcher, T.; et al. Alzheimer’s Disease Outlook: Controversies and Future Directions. Lancet 2025, 406, 1424–1442. [Google Scholar] [CrossRef] [PubMed]
  17. Schindler, S.E.; Bollinger, J.G.; Ovod, V.; Mawuenyega, K.G.; Li, Y.; Gordon, B.A.; Holtzman, D.M.; Morris, J.C.; Benzinger, T.L.S.; Xiong, C.; et al. High-Precision Plasma β-Amyloid 42/40 Predicts Current and Future Brain Amyloidosis. Neurology 2019, 93, e1647–e1659. [Google Scholar] [CrossRef] [PubMed]
  18. Yaffe, K.; Falvey, C.; Harris, T.B.; Newman, A.; Satterfield, S.; Koster, A.; Ayonayon, H.; Simonsick, E.; for the Health ABC Study. Effect of Socioeconomic Disparities on Incidence of Dementia among Biracial Older Adults: Prospective Study. BMJ 2013, 347, f7051. [Google Scholar] [CrossRef] [PubMed]
  19. O’Bryant, S.E.; Petersen, M.; Hall, J.; Johnson, L.A.; for the HABS-HD Study Team. Medical Comorbidities and Ethnicity Impact Plasma Alzheimer’s Disease Biomarkers: Important Considerations for Clinical Trials and Practice. Alzheimer Dement. 2023, 19, 36–43. [Google Scholar] [CrossRef] [PubMed]
  20. Tideman, P.; Karlsson, L.; Strandberg, O.; Calling, S.; Smith, R.; Midlöv, P.; Verghese, P.B.; Braunstein, J.B.; Mattsson-Carlgren, N.; Stomrud, E.; et al. Primary Care Detection of Alzheimer’s Disease Using a Self-Administered Digital Cognitive Test and Blood Biomarkers. Nat. Med. 2025, 31, 4131–4139. [Google Scholar] [CrossRef] [PubMed]
Figure 1. STARD flow diagram of participant inclusion. The flowchart details the selection process from the initial ADNI cohort with available plasma p-tau217 data to the final analytical sample, stratified by amyloid-PET status (Reference Standard).
Jdad 03 00022 g001
Figure 2. Distribution of plasma biomarkers and demographic characteristics stratified by amyloid-PET status. (a) Plasma p-tau217 concentrations; (b) Plasma GFAP concentrations; (c) Plasma NfL concentrations; (d) Plasma Aβ42/40 ratio; (e) APOE ε4 carrier status frequency; (f) Gender distribution. Box plots represent the median (horizontal line), interquartile range (box boundaries), and range (whiskers). Amyloid-positive participants (A+) are compared to amyloid-negative participants (A−), showing significant separation particularly for p-tau217.
Jdad 03 00022 g002aJdad 03 00022 g002b
Figure 3. Forest plot of univariate logistic regression analysis predicting amyloid-PET positivity. The plot displays Odds Ratios (OR) as dots and 95% Confidence Intervals (CI) as horizontal error bars. The x-axis represents the OR on a logarithmic scale. The vertical dashed gray line at OR = 1.00 indicates the null value (no association). Continuous predictors (p-tau217, NfL, GFAP, Aβ42/40, Age) are scaled per Interquartile Range (IQR), while APOE is analyzed as ε4 carriers versus non-carriers. Note that the confidence interval for Aβ42/40 crosses the null line, indicating a lack of significant association in this univariate model.
Jdad 03 00022 g003
Figure 4. Forest plots of multivariable logistic regression models assessing the incremental value of biomarkers for predicting amyloid-PET positivity. Panels represent sequential models: (M1) p-tau217 alone; (M2) p-tau217 adjusted for Aβ42/40; (M3) addition of plasma GFAP and NfL; and (M4) the fully adjusted model including APOE ε4 carrier status. Data points indicate the adjusted Odds Ratio (aOR) with 95% Confidence Intervals (error bars). The x-axis is logarithmic; the vertical dashed line at 1.00 represents the null value. Continuous predictors are scaled per Interquartile Range (IQR). Note that p-tau217 remains the strongest predictor across all models, while Aβ42/40 remains non-significant (crossing the null line).
Jdad 03 00022 g004
Figure 5. Comparative Receiver Operating Characteristic (ROC) curves for models M1 to M4 predicting amyloid-PET positivity. The plot illustrates the diagnostic discrimination of M1 (p-tau217 alone; blue line), M2 (M1 + Aβ42/40; orange line), M3 (M2 + GFAP + NfL; green line), and M4 (M3 + APOE ε4; red line). Area Under the Curve (AUC) values with 95% Confidence Intervals are listed in the legend. The diagonal gray line represents chance performance (AUC = 0.50). Note the substantial overlap between the curves, indicating that the single-marker model (M1) performs comparably to the more complex multivariable models.
Jdad 03 00022 g005
Figure 6. Decision Curve Analysis (DCA) comparing the net benefit of diagnostic models. The plot displays the Standardized Net Benefit (y-axis) across a range of clinically relevant risk thresholds (x-axis). The curves represent M1 (p-tau217 alone; red line), M2 (M1 + Aβ42/40; green line), M3 (M2 + GFAP + NfL; blue line), and M4 (M3 + APOE; purple line). The thin gray lines represent the reference strategies: assuming all patients are amyloid-positive (“All”) or none are (“None”).
Jdad 03 00022 g006
Figure 7. Predicted risk distributions stratified by amyloid-PET status across models M1–M4. The density plots illustrate the separation between PET-negative (pink) and PET-positive (cyan) participants based on predicted risk scores. Vertical lines indicate the High-Sensitivity threshold (dashed; Se ≈ 95%) and the Youden-optimal threshold (solid). Performance metrics at the Youden threshold for each model are as follows: M1 (Se 82.5%, Sp 85.0%, PPV 78.9%, NPV 87.7%); M2 (Se 83.8%, Sp 83.8%, PPV 77.8%, NPV 88.4%); M3 (Se 80.7%, Sp 87.8%, PPV 81.8%, NPV 87.0%); M4 (Se 83.5%, Sp 86.1%, PPV 80.3%, NPV 88.5%).
Jdad 03 00022 g007
Figure 8. Internal validation of p-tau217 thresholds using bootstrap resampling (B = 2000). The histograms display the frequency distribution of optimal cut-off values derived from the development set. The left cluster corresponds to the High-Sensitivity (“Rule-Out”) threshold (target Se ≥ 95%), while the right cluster corresponds to the Youden-Optimal (“Balanced”) threshold. Solid vertical lines represent the point estimates from the original dataset (0.106 and 0.177 pg/mL, respectively); dashed vertical lines indicate the 95% percentile confidence intervals. The narrow spread of the distributions demonstrates the stability of these operating points.
Jdad 03 00022 g008
Table 1. Demographic and biomarker characteristics of the study population.
VariableNegative (N = 1002) 1Positive (N = 679) 1p-Value 2
pt217F0.10 [0.07, 0.15]0.36 [0.20, 0.61]<0.001
AB4227.67 [24.46, 31.58]23.87 [21.25, 27.03]<0.001
AB40303.79 [270.94, 336.18]310.48 [273.12, 354.11]0.011
AB42/400.09 [0.08, 0.10]0.08 [0.07, 0.08]<0.001
pt217F/AB420.00 [0.00, 0.01]0.01 [0.01, 0.02]<0.001
NfL15.50 [11.30, 21.70]21.30 [15.50, 28.90]<0.001
GFAP127.55 [91.39, 180.90]211.00 [145.90, 291.30]<0.001
APOE <0.001
   - Non-carrier78.2% (784.0)35.9% (244.0)
   - Carrier21.8% (218.0)64.1% (435.0)
gender 0.484
   - Male45.5% (453.0)47.3% (318.0)
   - Female54.5% (543.0)52.7% (355.0)
age72.00 [67.00, 78.00]76.00 [71.00, 82.00]<0.001
   pt217F0.10 [0.07, 0.15]0.36 [0.20, 0.61]<0.001
1 Median [Q1, Q3]; % (n). 2 Wilcoxon rank sum test; Fisher’s exact test. Continuous variables are reported as median [IQR]; categorical variables as % (n).
Disclaimer/Publisher’s Note: The statements, opinions and data contained in all publications are solely those of the individual author(s) and contributor(s) and not of MDPI and/or the editor(s). MDPI and/or the editor(s) disclaim responsibility for any injury to people or property resulting from any ideas, methods, instructions or products referred to in the content.