Article

Fetuin Purification from Fetal Bovine Serum by Ion-Exchange Chromatography

by
Silvia L. Soto Espinoza
1,2,
Pamela A. Kikot
1,2,
M. Laura Carbajal
1,
Claudio C. Paolazzi
3 and
Mariano Grasselli
1,2,*
1
Laboratorio de Materiales Biotecnológicos (LaMaBio), Departamento de Ciencia y Tecnología, Universidad Nacional de Quilmes, Bernal B1876, Argentina
2
GBEyB, Grupo Vinculado IMBICE-CONICET, Roque Sáenz Peña 352, Buenos Aires B1876, Argentina
3
Agropharma, Presidente Perón y Del Cañón, Moreno B1474, Argentina
*
Author to whom correspondence should be addressed.
J. Pharm. BioTech Ind. 2026, 3(1), 4; https://doi.org/10.3390/jpbi3010004
Submission received: 22 December 2025 / Revised: 12 January 2026 / Accepted: 13 February 2026 / Published: 26 February 2026

Abstract

Background: Fetuin (Ft) is the most abundant protein in fetal bovine serum (FBS) and is considered one of its essential components. This acidic glycoprotein plays a key role in cell adhesion and proliferation and is vital for maintaining in vitro cultures of animal and human cells, tissues, and organs. FBS is a natural source for Ft purification. However, the high demand for FBS as a standard reagent in cell culture severely limits its availability for use as a raw material for protein purification. Furthermore, the industrial production of FBS results in a significant amount of contaminated FBS. This contaminated fraction can thus be utilized for Ft recovery. Methods: In this work, we present a novel method for Ft recovery from FBS using a single chromatographic step based on anion exchange chromatography under acidic conditions. Results: Optimal adsorption conditions for Ft were studied using response surface methodology (RSM), which suggested a buffer pH of 4.2 and an FBS dilution of 40%. However, increasing the pH to 5 resulted in a 28% increase in Ft recovery, although with a slight reduction in Ft purity to 88%. A scale-up to half a liter of FBS was performed using a 400 mL column. A single-step elution with 0.3 M NaCl was employed, yielding an Ft recovery of 90% with a purity greater than 82%. Conclusions: The purified Ft demonstrated biological activity as a growth promoter in MDBK cell culture when utilized in a serum-free culture medium.

1. Introduction

Fetuin-A (Ft), formerly known as fetuin and countertrypin, is a multifunctional protein involved in numerous essential biological processes, including the regulation of bone and calcium metabolism, as well as the insulin signaling pathway. Additionally, it acts as a protease inhibitor, an inflammatory mediator, an anti-inflammatory agent, an atherogenic factor, and an adipogenic factor, as well as several other functions [1]. Early on, it was identified that it promotes cell adhesion and stretching on glass [2]. Since then, it has been used as an essential protein in serum-free media (SFM) for eukaryotic cell cultures [3,4,5] and, more recently, in cultivated meat [6].
Ft is a plasma protein that is widely distributed among mammals. It was not until 1987 that it was classified as part of the cystatin superfamily of proteins [7] and discovered to be analogous to the human alpha2-Heremans Schmid (HS) glycoprotein [7,8]. Pedersen reported this globulin in 1944. It was among the earliest isolated proteins and the first fetal protein identified [9]. It was initially purified from fetal bovine serum (FBS), which constitutes the primary component.
FBS is a natural source for Ft purification. However, due to its high demand as a component of cell culture media, there are insufficient quantities of FBS available for use as a raw material for Ft purification. Industrial production of FBS has resulted in some of this product being discarded as a result of contamination by viruses, prions, bacteria, fungi, endotoxins, and exogenous extracellular vesicles [10]. Although endotoxin contamination can be removed from FBS using anion exchange chromatography (AEC) or affinity adsorbents [11]. However, completely removing endotoxins from protein-rich solutions without compromising protein recovery remains challenging. Consequently, contaminated FBS cannot be used for cell culture.
Ft is purified from FBS using protein precipitation protocols. Three methods have been described for recovering Ft using different chemical reagents. The Pedersen (P) method uses ammonium sulfate [9]. The Spiro (S) method uses cold ethanol with Zn and Ba ions and yields the highest purity [12]. The Deutsch (D) method uses trichloroacetic acid, ammonium sulfate, and cold ethanol, resulting in an intermediate level of purity [13].
Ft(P), the least pure form, is widely used for its growth-promoting effect on anchorage-dependent cells [14]. For many years, there was a debate about whether this effect was caused by contaminating proteins, such as growth factors or hormones, because purer forms of Ft, such as Ft(S), lacked this effect. Later, it was discovered that residual salts from the Spiro purification method (zinc and barium ions) were toxic. In 2010, it was demonstrated that highly pure Ft is key to cell adhesion [15].
A more recent approach involves the one-step purification of Ft from FBS using wheat germ agglutinin (WGA) affinity chromatography [16]. However, scaling up this method for industrial use faces significant obstacles due to its limited adsorption capacity and the high cost of chromatographic supports.
Meanwhile, AEC is one of the most widely used chromatographic techniques for industrial-scale protein purification. However, the adsorption of a large number of proteins from complex mixtures, such as bovine serum or FBS, is expected. Although the use of AEC in an acidic medium is uncommon, it has the potential to purify a selective group of acidic glycoproteins, such as Ft. In the field of downstream processing, one example of this method was reported for purifying glycomacropeptide from sweet whey [17].
This work presents a novel adsorption method for Ft purification from FBS by using a one-step process based on the AEC in an acidic medium. The adsorption conditions were optimized using response surface methodology (RSM), and the biological activity of the isolated Ft was tested in an MDBK cell culture using a synthetic SFM.

2. Materials and Methods

The discarded FBS used in this study was donated by Cells Patagonia S.A. (Buenos Aires, Argentina). Madin-Darby bovine kidney (MDBK) cell line was obtained from ABAC, Argentine Cell Bank Association.
Standard proteins (fetuin, BSA, ovalbumin and lysozyme) were from Sigma-Aldrich (St. Louis, MO, USA). DEAE-Sepharose 6FF and Sephadex G-25 were purchased from Cytiva. All other salts and solvents were obtained from Anedra (Buenos Aires, Argentina).

2.1. Anion Exchange Chromatography

A mini-column (0.65 × 3 cm, VC 1 mL) was packed with 1 mL of DEAE-Sepharose 6FF and connected to the ÄKTA Prime Plus Liquid Chromatography system (Cytiva, Uppsala, Sweden). A linear flow rate of 90 cm/h was used.
For each experimental condition, a 10 mL FBS feedstock was prepared by diluting the FBS in the corresponding 20 mM acetate buffer. The pH was adjusted using either 10% (v/v) acetic acid (HAc) or 0.1 M NaOH. This feedstock was then centrifuged at 12,000× g, and the resulting supernatant was used for column loading.
Before each chromatographic test, the column was equilibrated with greater than 10 column volumes (CVs) of the designated equilibration buffer. The sample volume was standardized to an equivalent of 2 mL of neat FBS for every condition. Following sample loading, the column was washed with more than 10 CVs of equilibration buffer until the absorbance approached zero.
Elution was carried out using a 20 mM sodium acetate buffer containing 0.5 M NaCl. The elution buffer pH (3.5–5.5) was adjusted to match the pH of the equilibration buffer used.

2.2. Adsorption Chromatographic Condition Optimization

The optimal adsorption conditions of Ft onto an anion exchange matrix are studied using the response surface methodology (RSM) with a two-factor and five-level rotatable (α = √2) central composite design (CCD). The independent variables were the pH value of the acetate buffer and the ionic strength, which was adjusted by FBS dilution. Five levels of each variable were set as −α, −1, 0, +1, and +α (Table 1). The CCD results in nine possible combinations of both independent factors.
Nine treatments were performed, with four replicates of the central point of the design. Two responses were studied for each run: mass of Ft purified (mg) and Ft Purity (%). The elution peak of each chromatogram was analyzed for process by monitoring protein content and Ft quantitation (see below).
The analysis of the experimental design was performed with the Minitab® Statistical Software 22.3 trial web version. A quadratic multiterm regression equation was performed for the experimental data to fit into an empirical second-order polynomial model. An analysis of variance (ANOVA) was conducted to determine the model quality and significance of factors on the responses. The study included Fisher’s statistical test (F-test), related probability values, the coefficient of determination R2 of the regression model, residual analysis, and the lack of fit test.

2.3. Protein Concentration Assays

Total protein concentration was quantified using the Bradford method (Bio-Rad Protein Assay Kit, Bio-Rad, Hercules, CA, USA), with Bovine Serum Albumin (BSA) (Sigma-Aldrich) serving as the standard. Fetuin (Ft) concentration was estimated using electrophoresis and quantitative densitometry using a specific stain for glycoproteins (see below).

2.4. Gel Electrophoresis and Densitometry

Gel electrophoresis was performed according to the Laemmli method. Gels comprised 5% acrylamide in the stacking gel and 10% acrylamide in the separating gel, and were run on a Mini-PROTEAN Tetra Cell system (Bio-Rad, Hercules, CA, USA).
Samples were prepared in a buffer containing β-mercaptoethanol and denatured by heating at 100 °C for five minutes. Protein loads per lane were 5 µg for individual proteins and 10 µg for protein mixtures, each in a final volume of 16 µL. The run was conducted at 12 mA.
After migration, gels were stained with Periodic Acid-Schiff stain (PAS) to detect glycosylated proteins, as described by Kapitany [18]. Followed, gels were also stained with Coomassie Blue for total protein pattern analysis. Gels were photographed using a Gel Doc EZ Imager (Bio-Rad), and image analysis was performed using Image Lab Software 6.1 (Bio-Rad).
Ft concentration was calculated by establishing a linear correlation between the densitometry values of the bands and the loaded amount of Ft standard (ST1: 2.4 µg, ST2: 4.2 µg, and ST3: 10.3 µg). Purity was calculated as the concentration of Ft (measured by PAS staining and densitometry) relative to total protein, corresponding to purity with respect to total serum proteins.

2.5. Fetuin Purification

A total of 400 mL of DEAE-Sepharose 6FF was packed in an XK50 GE column (5 × 20.4 cm; VC 400 mL) (Sigma-Aldrich, St. Louis, MO, USA). The column was equilibrated with 4 CV of 20 mM acetate buffer, pH 5, at a flow rate of 20 mL/min (linear flow rate 61 cm/h) using a peristaltic pump.
Half a liter of FBS was diluted with 0.75 L of 20 mM acetate buffer, pH 5, resulting in a 40% FBS concentration. This diluted solution was filtered using a 1.5 µm pore depth filter (Sartopure PP2, Sartorius, Göttingen, Germany) and loaded onto the AEC column. The washing step was performed with the equilibration buffer until the Abs280nm dropped below 0.1 (approximately 4 VC). The elution step was performed in a step gradient using an acetate buffer containing 0.3 M NaCl (4 CV). The Ft purity of the batch process was estimated by densitometry from SDS-PAGE gel stained with PAS.

2.6. Biological Activity Assay of Fetuin

MDBK cells (NBL-1) were cultured in six-well plates using Dulbecco’s Modified Eagle Medium (DMEM) (Thermo Fisher Scientific, Waltham, MA, USA) supplemented with the following: 0.3% L-glutamine, 0.01 g/L sodium penicillin, sodium bicarbonate 0.6 g/L, and 0.25 g/L gentamicin, called StdCM, with the addition of 5% FBS.
Cells were maintained at 37 °C in a humidified atmosphere of 5% CO2. For routine subculture, cells were grown for four days after seeding until they reached 80–90% confluence. Cells were then detached using 0.5 mL Trypsin–EDTA solution containing 0.05% trypsin and 0.02% EDTA. Following detachment, cells were washed and resuspended in fresh medium. For the proliferation assay, MDBK cells were seeded at a density of 6.105–6.106 in a six-well plate, with each well containing 3 mL of culture medium. The plates were incubated under standard growth conditions (37 °C and CO2 5%) for four days. The entire experiment was performed in triplicate (n = 3).
SFM was prepared using Dulbecco Modified Eagle Medium (DMEM) supplemented with 0.3% L-glutamine, 0.01 g/L sodium penicillin, 0.6 g/L sodium bicarbonate, 0.25 g/L gentamicin. SFM was supplemented with 80 mg/L insulin and 0.37% purified Ft.

3. Results

Ft is an acidic alpha globulin with a molecular weight (MW) ranging from 43 to 54 kDa and an acidic isoelectric point (pI) between 3.3 and 4.3. This significant heterogeneity in molecular weight (MW) and isoelectric point (pI) is attributed to extensive O- and N-glycosylation and phosphorylation [19].
Ft is the major protein in FBS; however, serum contains a wide variety of other proteins that perform essential functions. Approximately 20 major protein components have been identified in commercial FBS samples by LC-MS [20]. Their MWs and pIs are summarized in Table S1 of the Supplementary Material.
Concentrations of Ft and total proteins fluctuate during fetal development [21]; specifically, Ft levels decrease while total proteins increase. As a result, commercial SFB exhibits significant variability between batches. Reference values for SFB components are surprisingly scarce and inconsistent in the literature. Most published studies focus on proteomic composition or relative abundance, rather than specific quantification. Furthermore, technical specifications from manufacturers provide highly variable reference ranges [22].
Considering chromatography-based separation methods, an affinity chromatography column utilizing WGA as the ligand was employed for Ft purification [16]. This approach is significantly more straightforward compared to traditional precipitation methods. The column-adsorption procedure necessitates a 10-fold dilution of the serum before application to the column. It was initially reported that this method yielded high purity, demonstrated by a single band in SDS-PAGE when stained with standard Coomassie Brilliant Blue [16]. However, a subsequent study revealed numerous protein bands when a more sensitive technique, colloidal Coomassie Blue staining, was used [15], suggesting the presence of co-purifying contaminants. Furthermore, the maximum binding capacity of the WGA–Toyopearl matrix is relatively low, on the order of 2 mg/mL of adsorbent. Consequently, the column loading is restricted to 0.2 mL of FBS per milliliter of affinity adsorbent to ensure effective binding and recovery [16].
The extensive sialic acid glycosylation of Ft yields a protein with a low isoelectric point (pI) [19]. Spiro in 1960 studied the electrophoretic mobility of Ft and sialic acid-free Ft (Figure 5 of the reference [12]). Ft exhibits a negative charge in acidic media. The isoelectric point shifts from 3.3 to 5.2 upon deglycosylation [12]. The terminal sialic acid residue, with a pKa of 2.2 [23], ensures that Ft remains negatively charged in acidic conditions where most other plasma proteins become neutral or positively charged. This unique property makes AEC an ideal method for isolating Ft from serum. Due to its high binding capacity compared to affinity matrices, ion exchange chromatography can be effectively employed to adsorb Ft selectively. This selection is achieved by designing a purification procedure that exploits the inherent negative charge of the Ft when operating in an acidic medium. This approach could offer a straightforward, highly scalable method for the efficient recovery of Ft from a complex mixture of serum proteins.

Fetuin Adsorption Optimization

This section examines the adsorption conditions for Ft purification using AEC in acidic media. Therefore, optimal adsorption performance of AEC and maximum purity were studied using response surface methodology (RSM). This method allows simultaneous assessment of multiple factors and their interactions, unlike traditional one-factor-at-a-time optimization.
RSM is a collection of experimental design, modeling, and optimization techniques used to identify ideal conditions for desired outcomes influenced by several quantitative variables. Its primary application is to model and optimize responses affected by multiple factors by determining their optimal values.
An appropriate experimental design must be selected to collect the necessary data to estimate the model parameters effectively. Regarding experimental designs in RSM, rotating central composite designs (CCDs) have been the most widely used [24,25,26]. The CCD used in this work is a five-level design consisting of 9 experimental conditions and 12 chromatographic runs (four repetitions of the central points, four axial points, and four factorial design points) as is detailed in Table 2, and it can fit a second-order polynomial model.
The adsorption process of Ft and other proteins of the sample to the anion exchange matrix was studied by column chromatography. Two variables were analyzed: pH and ionic strength of the adsorptive buffer. The pH will influence protein/matrix interaction by changing the charge of proteins. The selection of the pH range was performed based on the pI of the most relevant FSB proteins (see Table S1). From Table S1, it can be seen that Ft (pI 3.3) is the most negatively charged protein of the mixture. The other proteins have pI values higher than 4.0. Therefore, for the RSM analysis, a minimum pH of 3.5 was selected. A range of two pH units (3.5 to 5.5) was selected, considering that the proton concentration changed two orders of magnitude. In addition, in this range, there was an absence or low ionization of the carboxylic moieties of the plasmatic proteins. Considering the second variable, ion strength, plasma has relatively high conductivity in relation to ion-exchange adsorption conditions. Taking into account that plasma also has a high protein concentration, ionic strength was controlled by dilution with an acetate buffer. Therefore, an ion strength between 3 and 5.8 μS/cm, usually used in ion exchange chromatography, was selected, which corresponds to plasma concentrations in the range of 26% to 54%.
All chromatographic runs corresponding to the experimental design (Table 2) were performed on the same column (CV 1 mL) by loading the diluted and cleaned sample prepared by centrifugation. Sample volume corresponds to the equivalent of two mL of FBS.
Elution was performed by a sharp increase in the ionic strength, which was required to release all adsorbed proteins. Therefore, the resolution of different peaks during elution was not anticipated. However, it is worth noting that a small, unresolved initial peak appeared when adsorption conditions at pH 3.8 were used (see Supplementary Material, Figure S1). The eluted peak was pooled, and the protein amount was quantified by Bradford. Considering there were no biochemical methods used to measure Ft concentration, the eluted proteins of each sample were separated by SDS-PAGE and stained with PAS for recognition of glycosylated proteins (see Supplementary Material, Figure S2). Both responses, Ft purity and Ft amount, were determined in the elution peak of every experiment of the experimental design (see Table 2 and Table S2) using a calibration curve built with a commercial standard of Ft (Figure S2).
According to SDS-PAGE, the elution of each chromatographic run contained mainly Ft in different proportions (Figure S3).
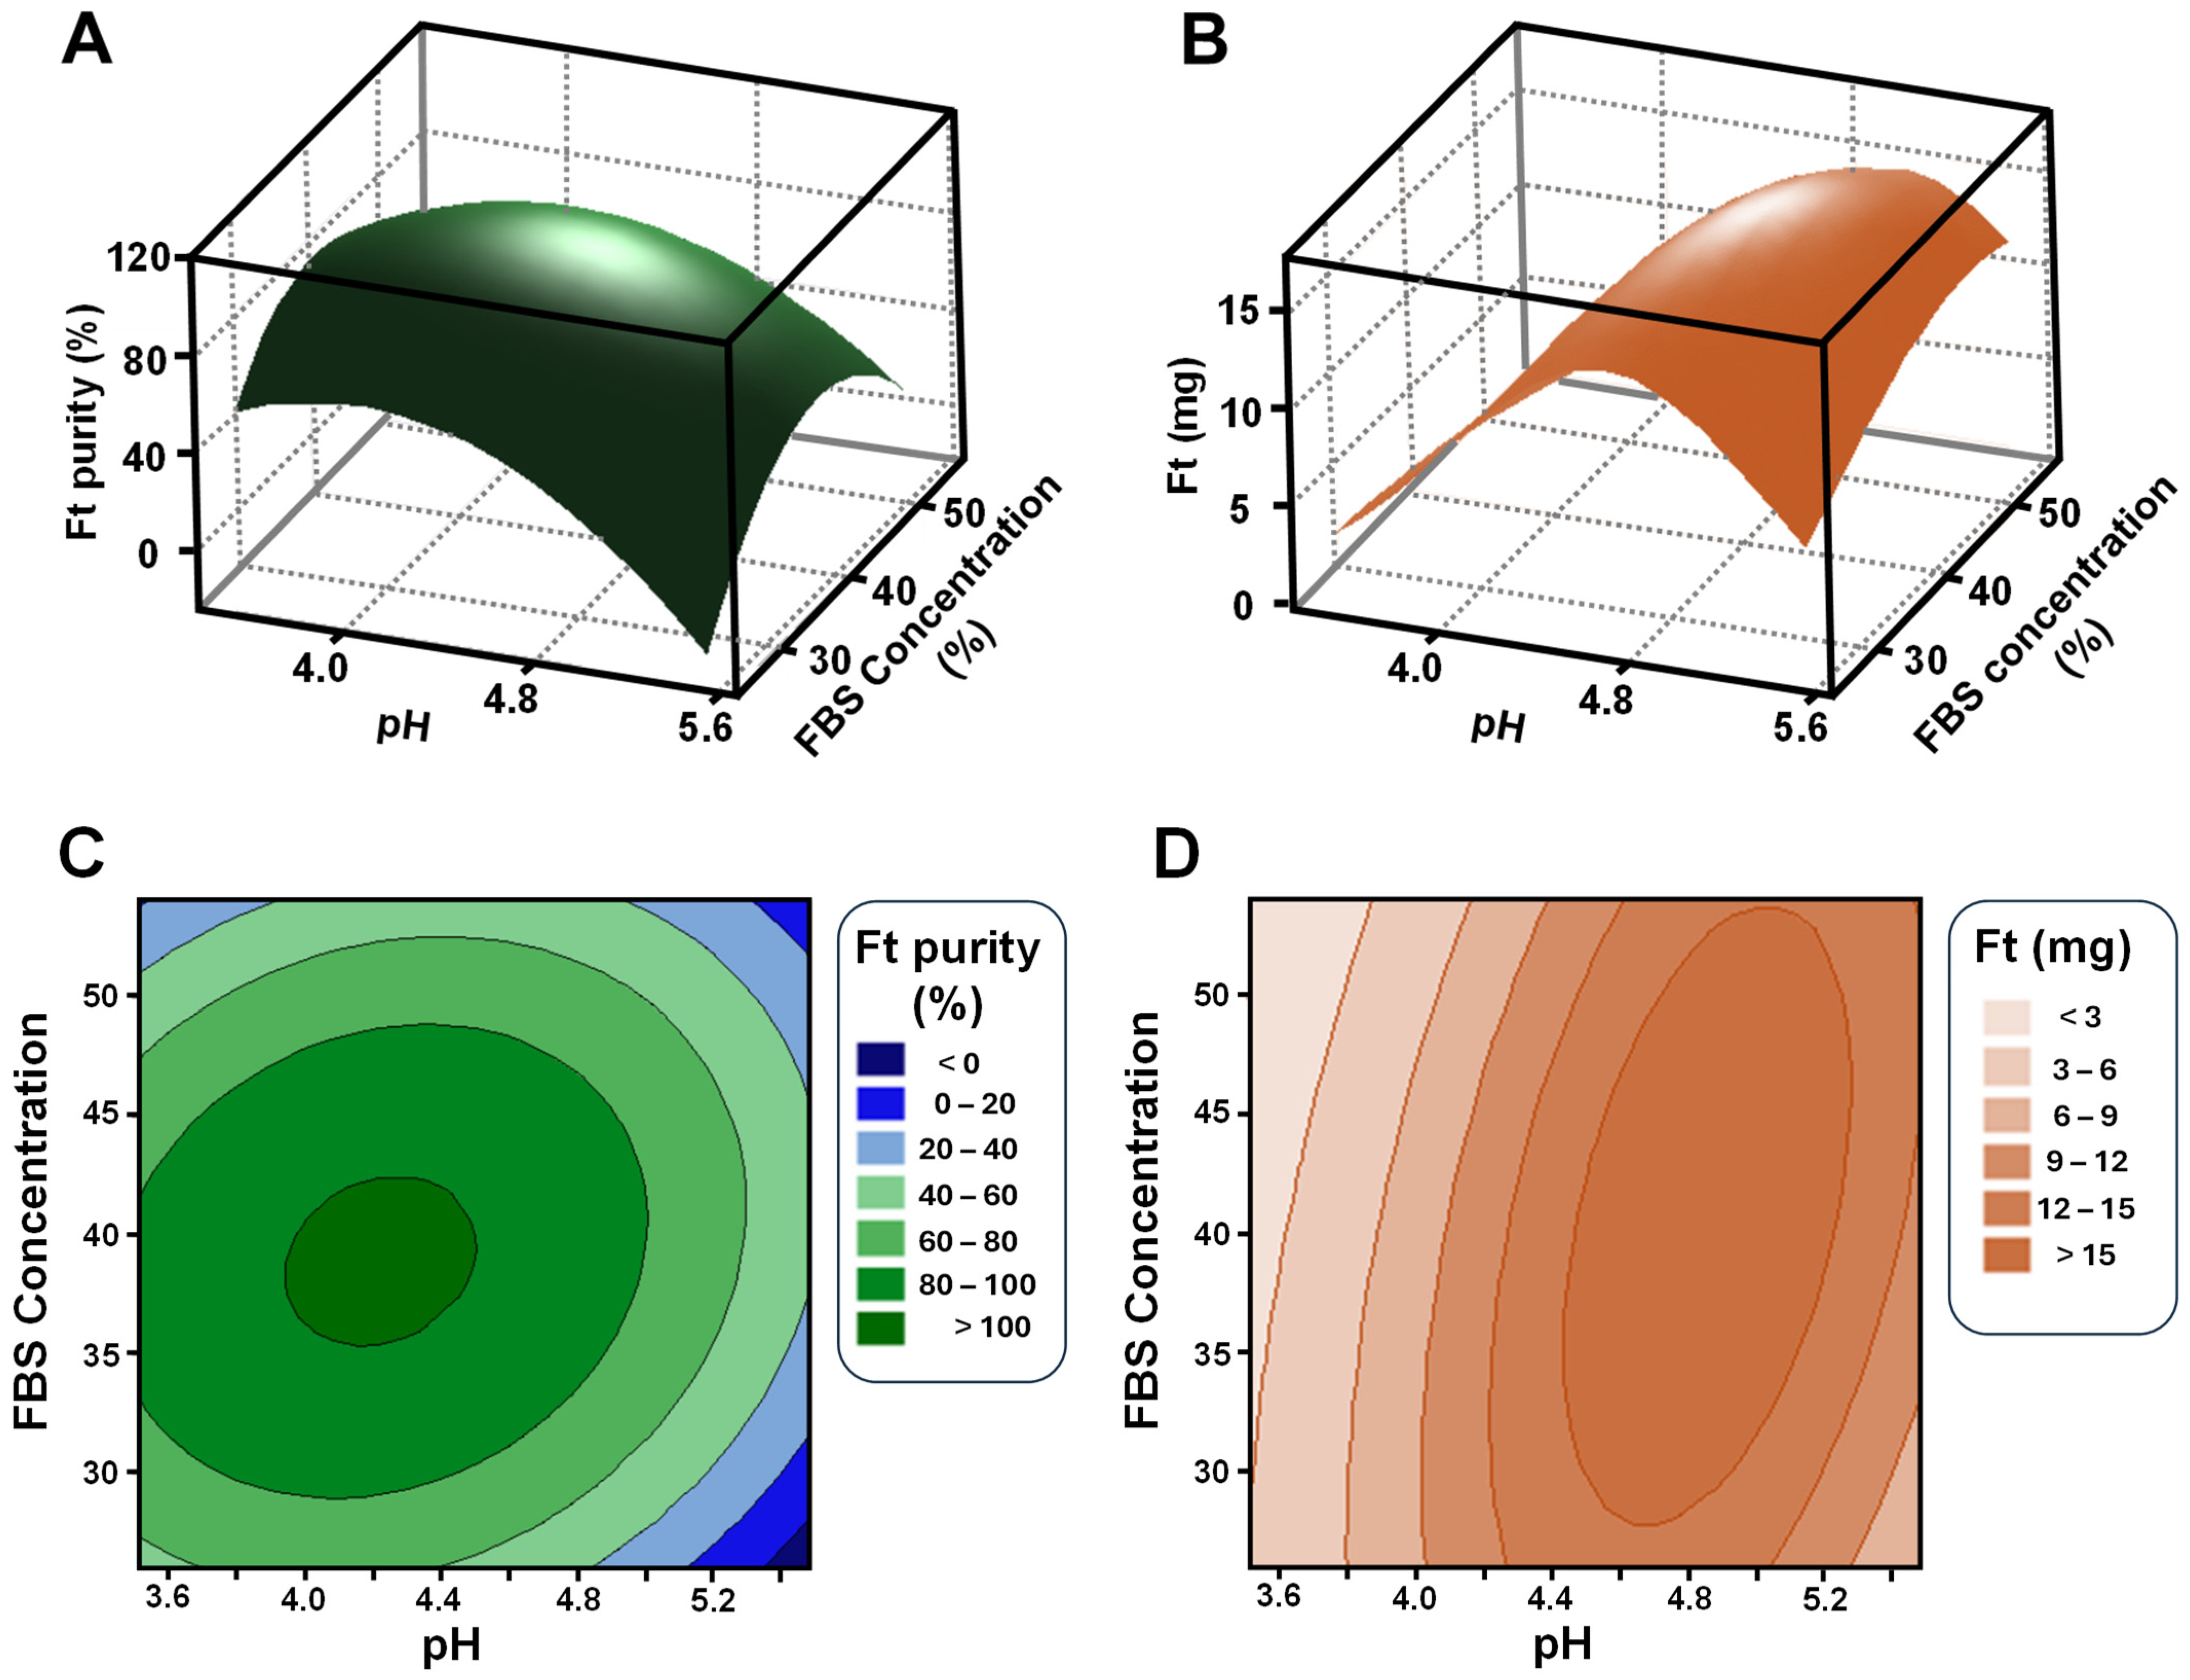
Surface response plots were built for Ft purity (Figure 1A) and the amount of Ft recovered (Figure 1B), where the effects of pH and FBS concentration on the responses can be visualized.
Statistical analysis of responses using a full quadratic model was tested using Fisher’s F-test for analysis of variance (ANOVA), and the results are presented in the Supplementary Material as Figure S4 and Table S3. The response variability can be explained by the coefficient of determination (R2). R2 values near 1 indicate good reciprocity between actual data and estimated results. The R2 values were 0.94 and 0.86 for Ft purity and Ft amount, respectively.
The overall ANOVA results indicated that the models were valid for the actual system. Plots of residuals versus predicted responses demonstrated random distributions of residuals without any trends for both responses (Figure S5). Additionally, normal probability plots drawn for Ft purity (A) and Ft amount were satisfactory because the residual plots clustered around the diagonal line, verifying the assumption that the residuals were normally distributed.
The two variables studied yielded different maximum values of the surface response plot (Figure 1). Considering the Ft purity, the optimal conditions for Ft adsorption to an AEC adsorbent were a pH of 4.2 and a serum concentration of 39% (conductivity of 4 μS/cm). Meanwhile, according to the amount of Ft recovered, its optimum condition was pH 4.9 and an FBS concentration of 41%. Multiple-response optimization yielded optimal conditions of pH 4.6 and a dilution of 39%, with a predicted production of 16.9 mg of Ft with 97% purity.
However, to simplify the sample preparation for scaling up, a dilution of 40% was chosen. Considering the scarcity of FBS, the yield was prioritized over the purity of the produced Ft, which was set to a minimum purity of 80%. By selecting these requirements and using the quadratic equations of the RSM model (described in Table S3), the software output predicts a maximum recovery of 17.3 mg of Ft using an adsorption buffer pH 5.0 (composite desirability 0.98). Composite desirability in RSM is a technique for finding the best configurations for multiple process variables that simultaneously optimize several different responses by combining their individual desirability scores (0 to 1) into a single overall score to find the absolute best compromise for the entire system.
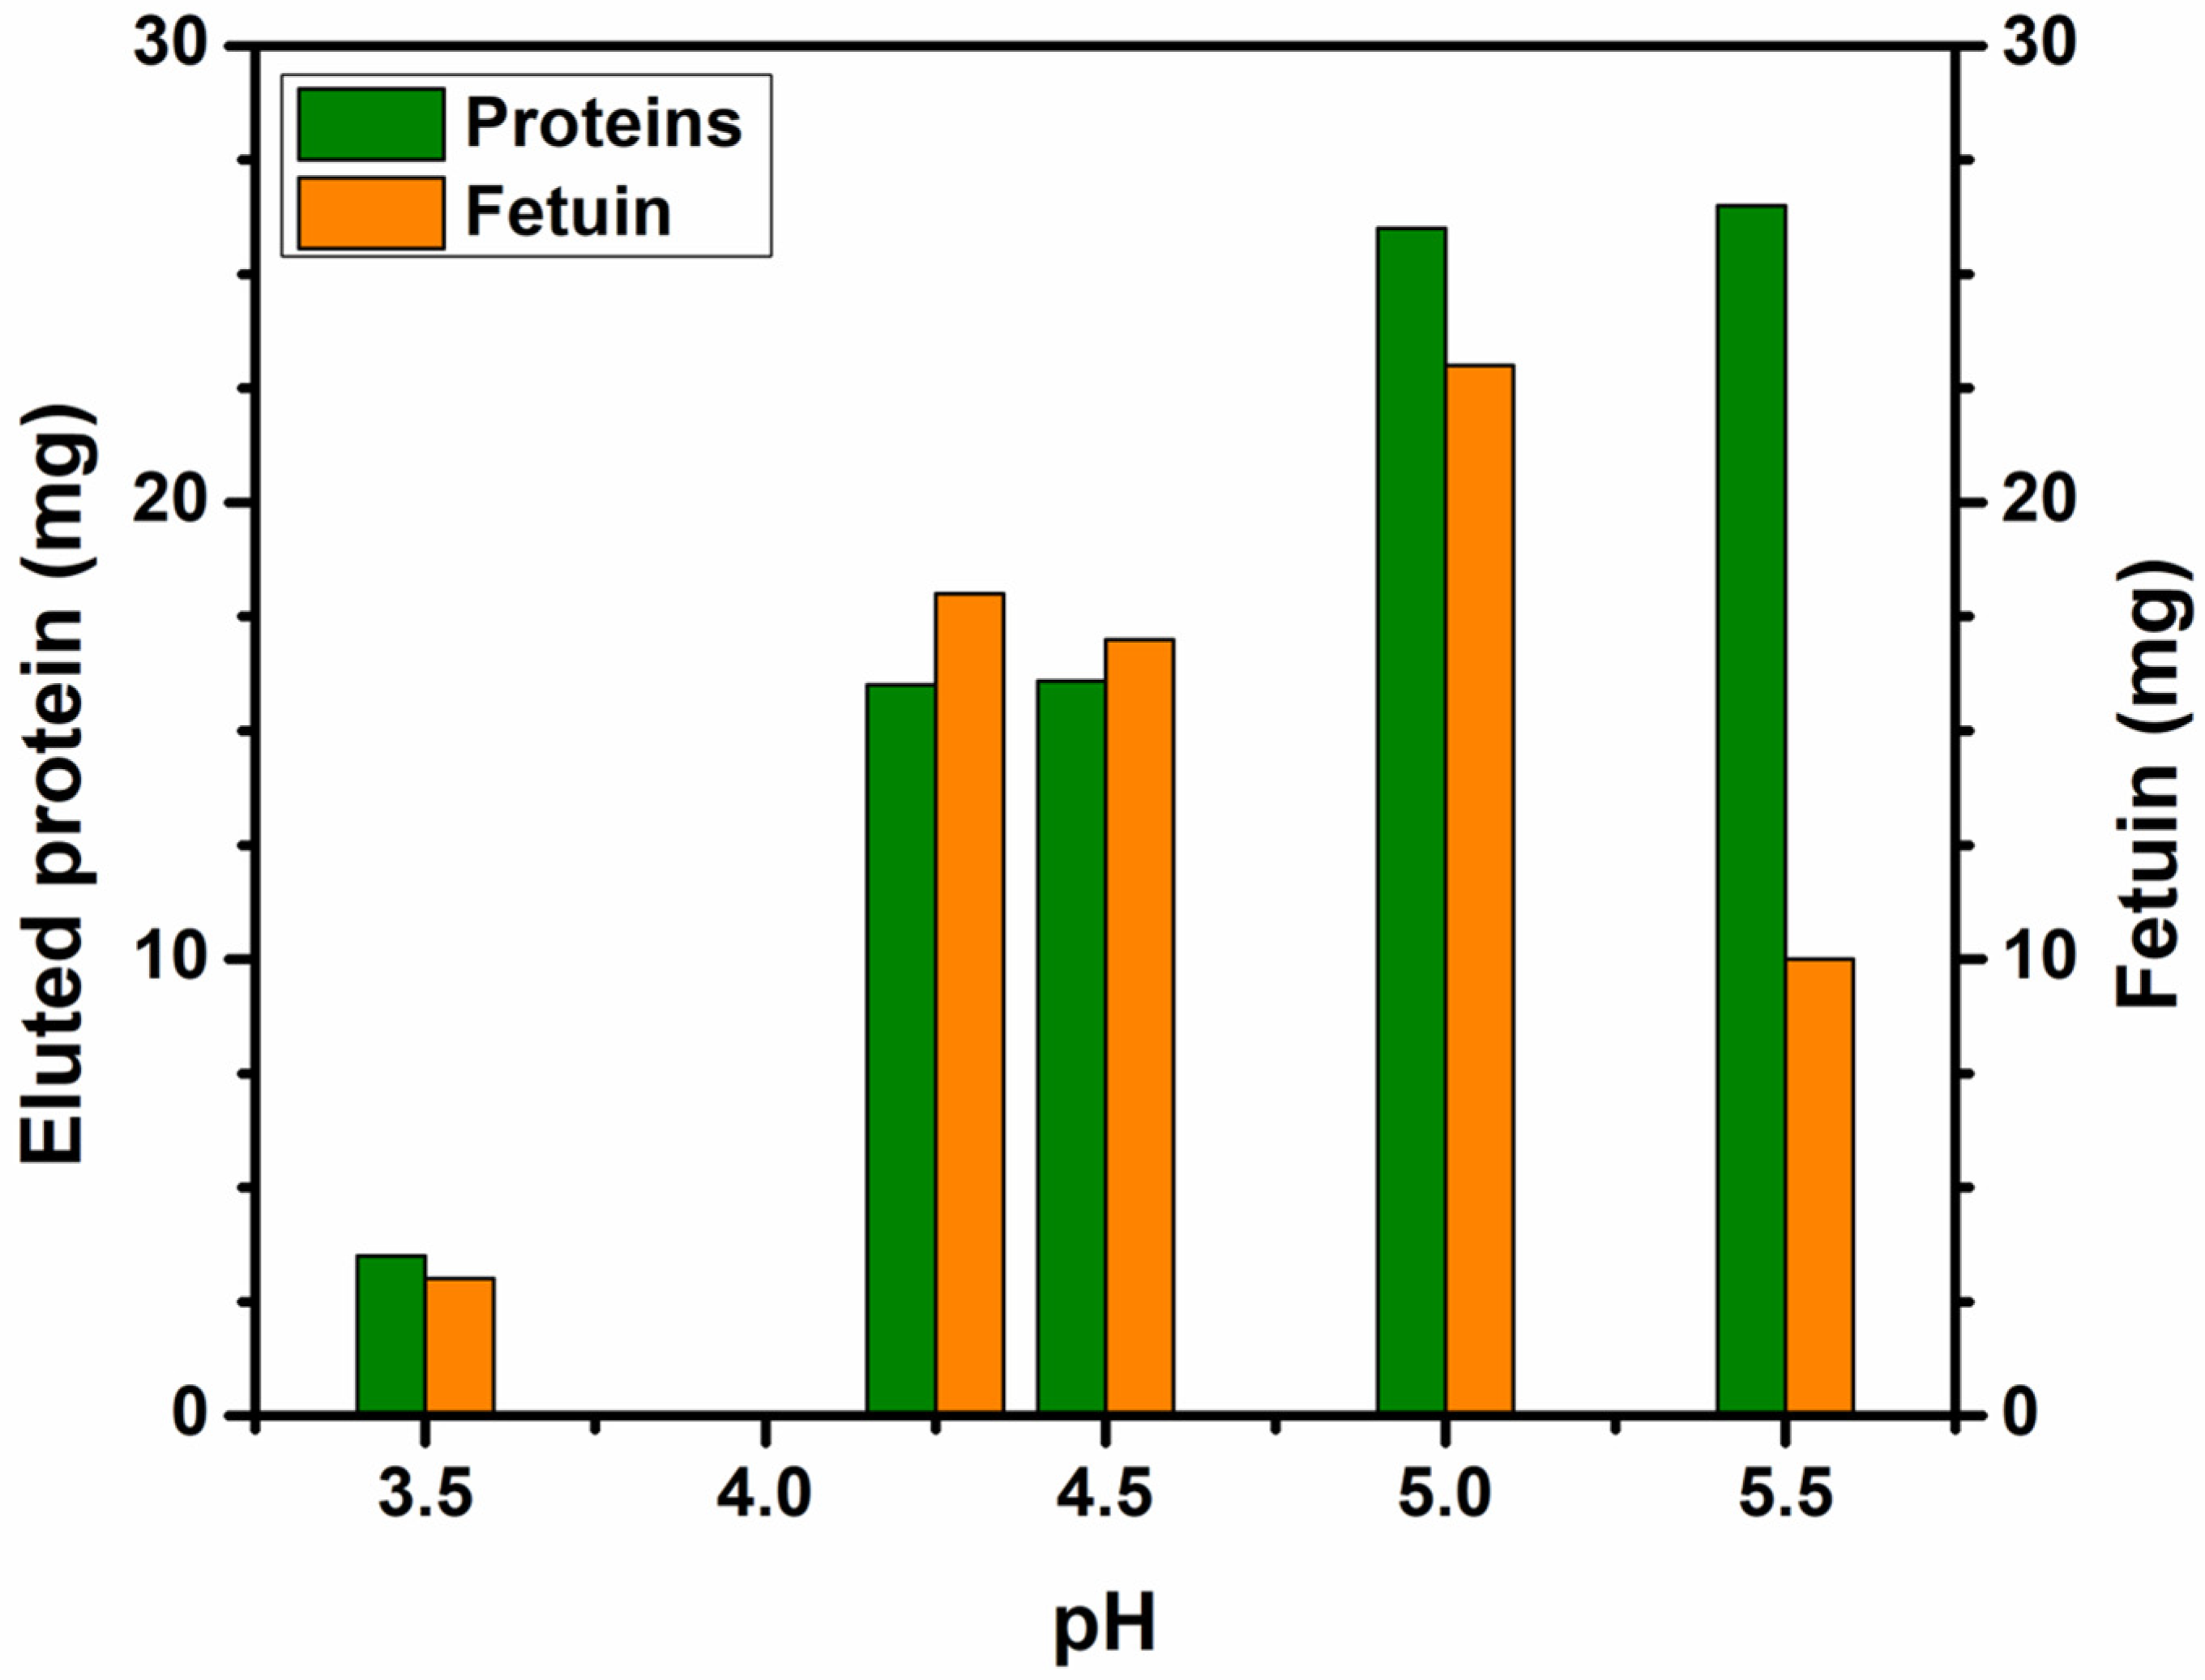
Since this optimal condition does not correspond to any of the RSM experimental data, a chromatographic run was performed at pH 5.0 and at 40% FBS dilution to verify the prediction. In addition, the adsorption condition corresponding to pH 4.2 and at 40% FBS dilution was also evaluated. Figure 2 shows the results for the total amount of eluted proteins and Ft recovered from a 2 mL FBS sample diluted to 40% from these additional runs and data from Exp. 1, 3 and 7 of the RSM test. Although a higher Ft purity (Ft/Eluted proteins ratio) is obtained at pH 4.2, the total amount of Ft is drastically reduced at pH levels lower than 5. Meanwhile, at pH 5 or higher, eluted proteins remain unchanged, but the Ft content is reduced to less than 40% if the adsorption pH is higher than 5. Therefore, pH 5 is the best condition for recovery maximization without compromising purity, which is in agreement with the prediction of RSM.
Therefore, using an acetate buffer at pH 5 and 40% diluted FBS, the anion exchange matrix exhibited a protein-binding capacity of 26 mg/mL. It was able to adsorb 23 mg of Ft per milliliter of resin (17 mg predicted by RSM), with a purity of 88%. This capacity is more than 10 times greater than that obtained by affinity chromatography with WGA–Toyopearl matrix [16].
Considering the scaling up of the chromatographic process, a column with a bed volume of 400 mL was prepared using DEAE-Sepharose 6FF. The following buffers were chosen: equilibrium and washing buffer, 20 mM sodium acetate buffer, pH 5.0, and elution with the addition of 0.5 M NaCl. Half a liter of FBS was diluted with buffer, resulting in a 40% FBS concentration (corresponding to a scaling factor of 250×). After filtration, it was loaded into the anion exchange column at a flow rate of 20 mL/min. Following sample loading, we performed a wash step using the equilibration buffer. This step removed non-specifically bound and non-interacting proteins that remained in the column due to sample overloading. The elution step was performed in a step gradient.
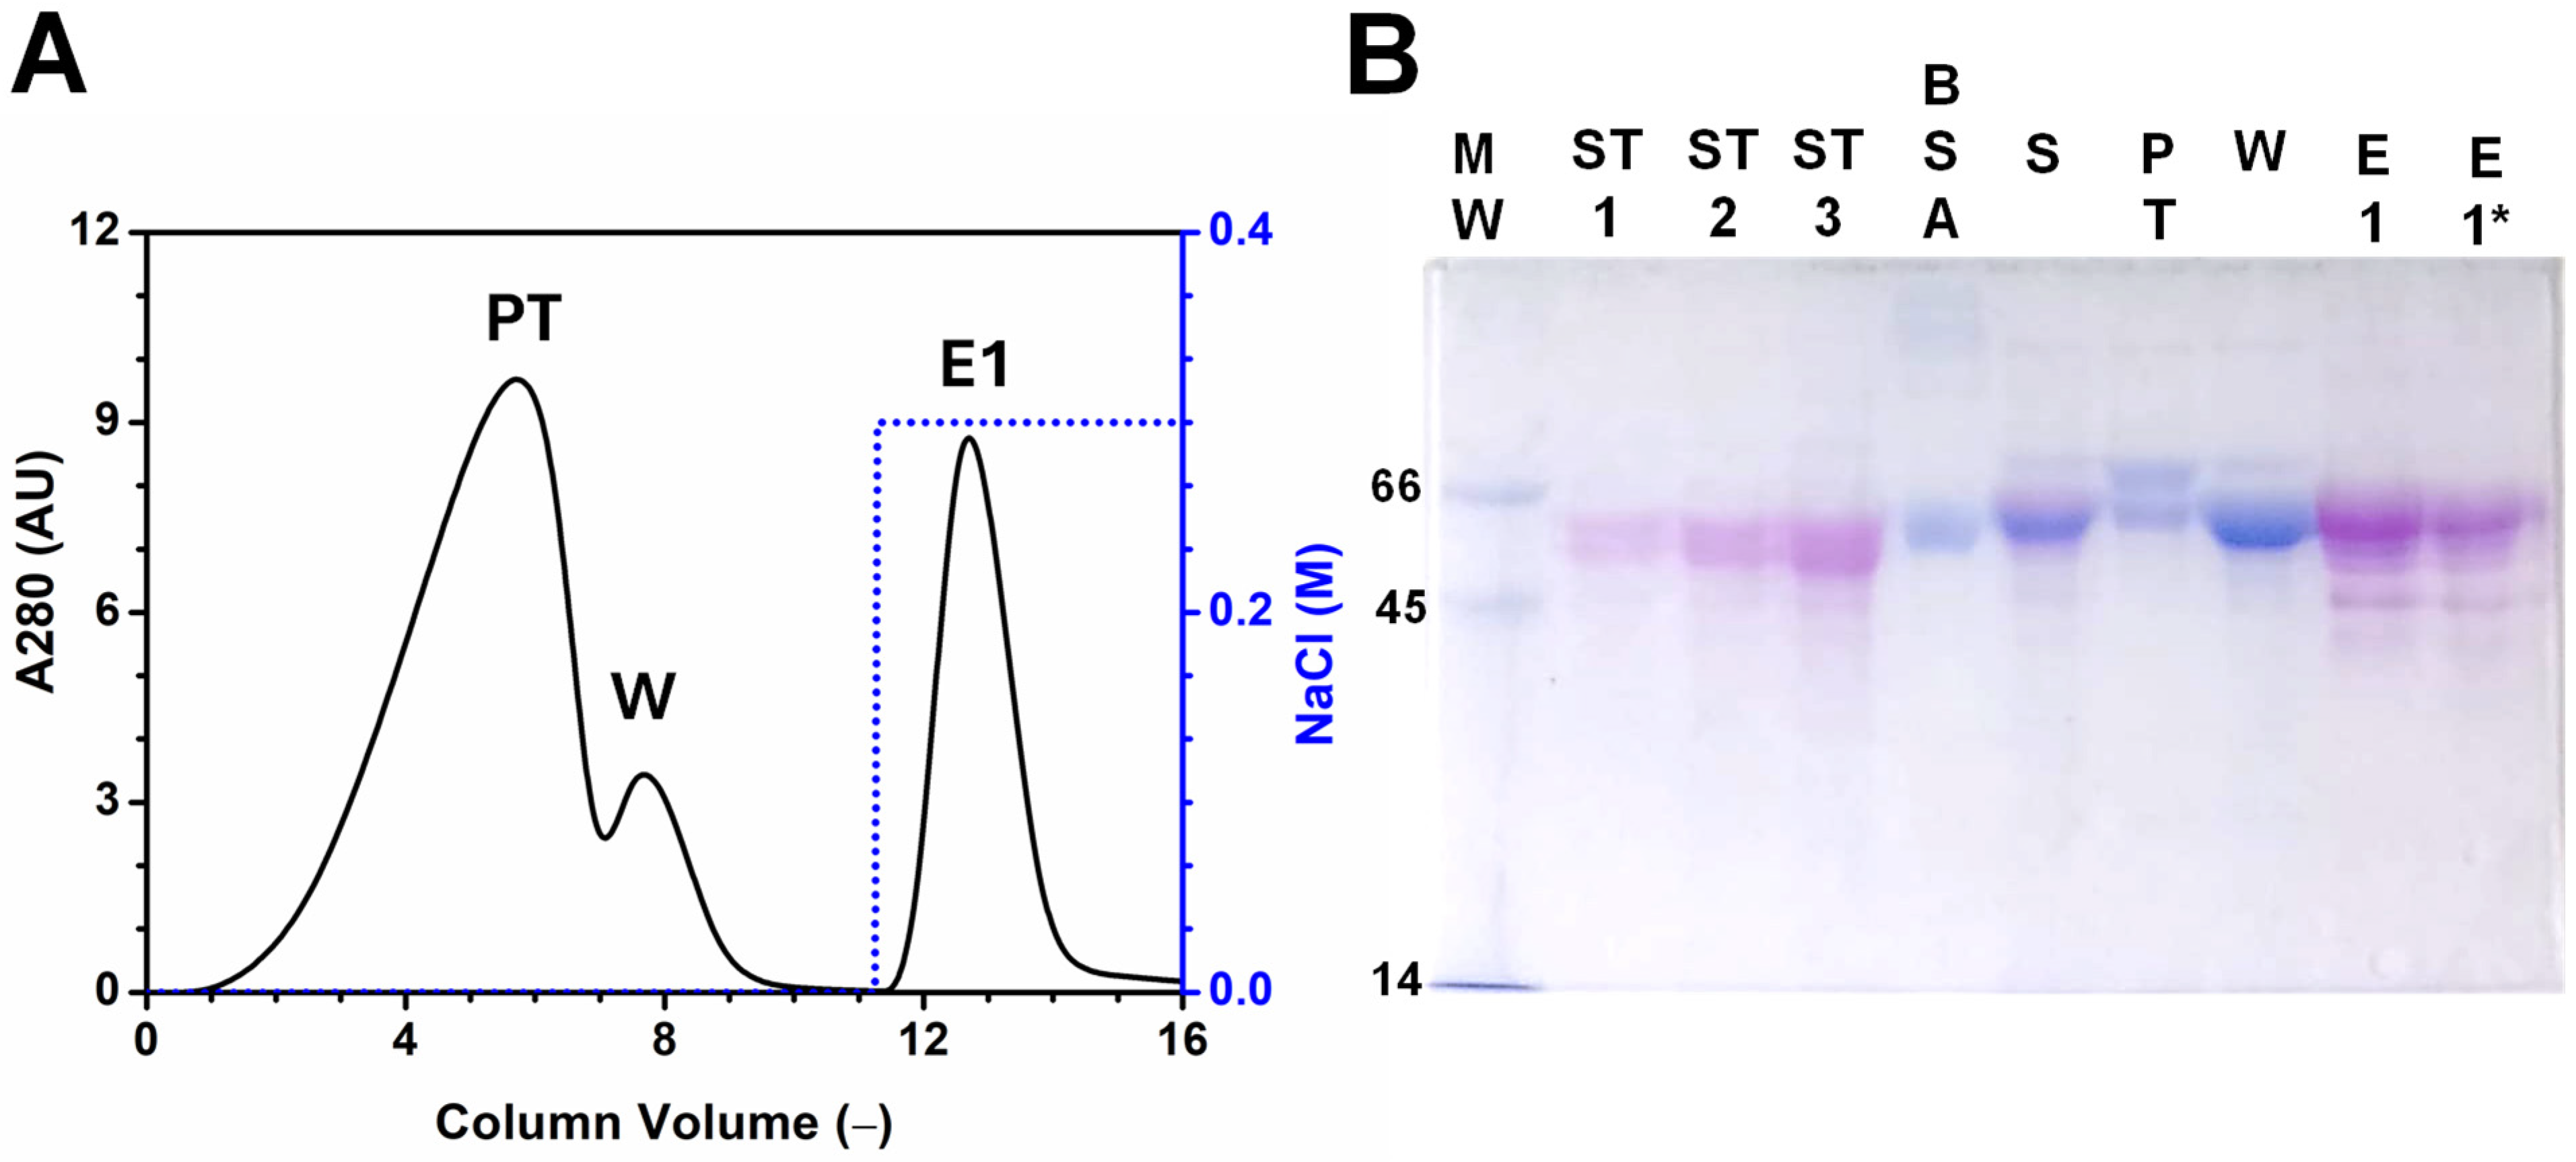
In Figure 3, the chromatographic profile corresponding to the adsorption, washing, and elution steps is shown. The elution step was performed with 0.3 M NaCl. Elutions at higher NaCl concentrations did not elute additional proteins. Samples corresponding to different steps of the chromatography were analyzed by SDS-PAGE using PAS stain (Figure S6) and PAS + Coomassie stains (Figure 3). The comparison of both stains highlights the presence of Ft (revealed in red after PAS staining) in the initial sample (Figure 3B, S) and in the elution step (Figure 3B, E). BSA (revealed in blue), on the other hand, is present in the pass-through (Figure 3B, PT) and wash (Figure 3B, W) steps, and is absent in the elution step (Figure 3B, E1).
Through this process, 3.6 g of Ft (measured by densitometry) is recovered from the elution peak using 500 mL of FBS (3.98 g of Ft). Therefore, the recovery reaches 90% of the total Ft. The Ft purity of the batch is 83%, determined by densitometry on the SDS-PAGE gel line corresponding to the cumulative elution peak (Figure 3B, E1).
The eluted fraction of AEC was pooled and desalted by a Sephadex G-25 column, and the protein fraction was lyophilized. Lyophilized powder was sterilized by gamma irradiation and used for supplementing SFM according to the composition described in M&M.
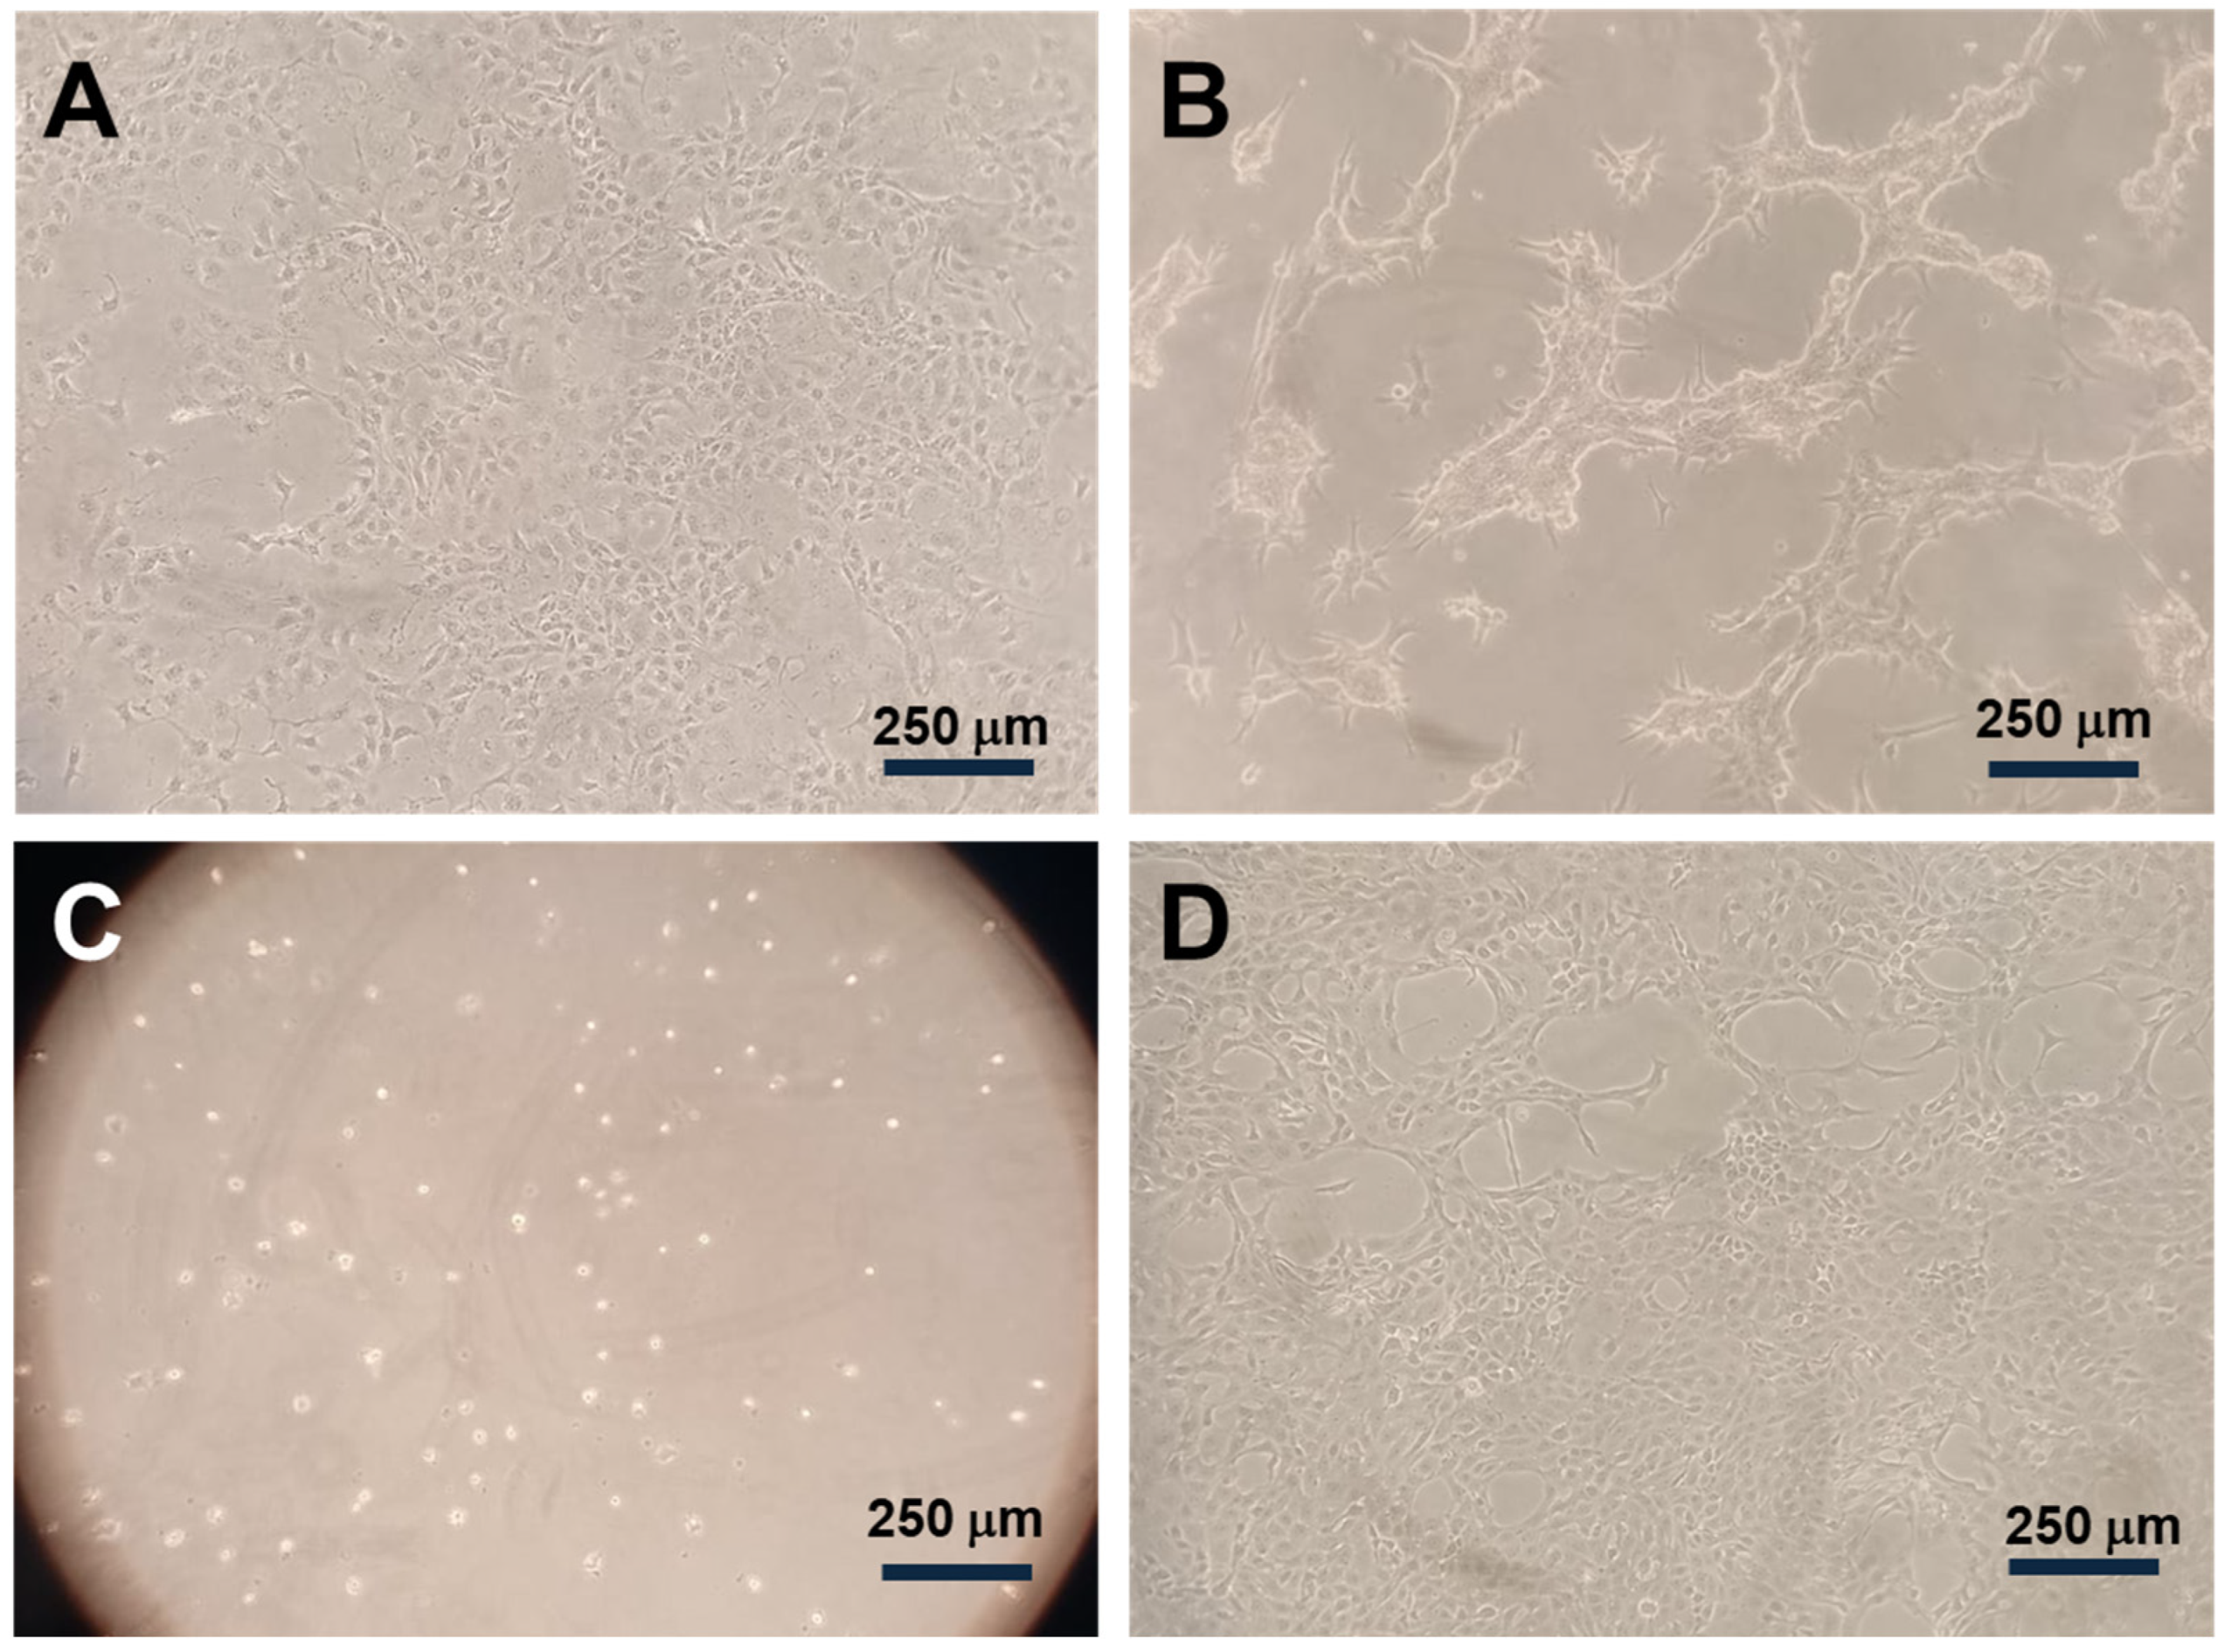
A cell proliferation assay was used to determine the biological activity of purified Ft using an SFM. Initially, the cell culture was adapted to grow in StdCM medium with progressively lower FBS concentrations (5%, 2.5%, and 1.25%). There were five reseeds in each condition to ensure cell culture stability. An inoculum of the adapted MDBK cells was split into three and seeded in an StdCM + FBS medium, an SFM supplemented with insulin, and with the addition of 0.37% Ft. Figure 4 shows microscopy pictures of cell cultures after 3 days of growth in StdCM + FBS 5% and 1.25% and SFM + insulin with or without the addition of Ft. It was found that MDBK cells scarcely grow at StdCM + 1.25% FBS (Figure 4B), and they are unable to spread and grow in a culture medium containing an FBS concentration lower than 1%. Meanwhile, MDBK cell culture using SFM medium supplemented with 80 mg/mL insulin does not spread if Ft is not included in the SFM medium (Figure 4C,D).

4. Conclusions

The development of optimal in vitro culture media is a constant goal in biotechnology. Researchers seek better alternatives to mammalian-based culture media due to the undefined nature of FBS, which leads to inconsistent results and safety risks. Recently, a detailed protocol for a defined medium composition was developed [10], in which Ft is one of the main components.
In this work, Ft protein was purified from FBS by one-step anion-exchange adsorption chromatography. The proposed purification method allows simplification of downstream processing to obtain Ft at a high recovery rate.
The low pKa value of sialic acid of Ft gives it a distinctive characteristic compared to serum proteins, which was exploited for chromatographic purification. Adsorption conditions were successfully optimized using RSM methodology, with a reduced number of experimental chromatographic runs. A specific pH for the adsorption buffer and a minimal serum dilution could be selected.
A scale-up of over 200× allowed for Ft purification with a recovery of 90% and a purity of 83%. The biological activity of the recovered Ft was confirmed by a culture of MDBK cells grown in SFM supplemented with insulin and Ft.

Supplementary Materials

The following supporting information can be downloaded at https://www.mdpi.com/article/10.3390/jpbi3010004/s1. Figure S1: Chromatograms corresponding to the experimental conditions described in Table 2. Figure S2: SDS-PAGE stained with PAS stain (A) and calibration curve corresponding to densitometry of Ft bands (B). Sample labels: MW = molecular weight markers; ST1/2/3 = Ft 2.4/4.2/10.3 µg respectively. Figure S3: SDS-PAGE electrophoresis gel stained initially with PAS and followed by Coomassie stain, corresponding to the elution peak of the experimental conditions described in Table 2. Figure S4: Normal probability plots drawn for Ft purity (A) and Ft amount (B) responses. In the case of Ft amount, a Box-Cox transformation was performed. Values were satisfactory because the residual plots cluster around the diagonal line. Figure S5: Plots of residuals versus predicted responses, for Ft purity (A) and Ft amount (B). In the case of Ft amount (mg), a Box-Cox transformation (λ = 0) was performed in the statistical analysis to stabilize the variance of the response (without which an inverted S shaped normal probability plot was observed). Random distributions of residuals without any trends (homoscedastic distribution) are observed for Ft purity response and for Ft amount logistic response. Figure S6: SDS-PAGE electrophoresis gel stained initially with PAS corresponding to the Figure 3. Sample labels: MW = molecular weight markers; ST1/2/3 = Ft 2.4/4.2/10.3 µg respectively; BSA = Bovine serum albumin; S = FBS 40%; PT = pass-through; W = washing peak; E1 = elution peak (* different dilution). Dilution factors and sample volume are described in the table. Table S1: Molecular weight and isoelectric point of the most abundant proteins present in SFB identified by LC-MS [20,27,28,29,30,31,32,33,34,35,36,37,38,39,40,41,42,43,44,45,46,47,48,49,50,51,52]. Table S2: Protein and Fetuin amounts, Fetuin purity and Area of the eluted peak measured in each experimental condition described in Table 2. Table S3: Central composite parameter estimation of five levels and two factors. Evaluating the ANOVA analysis for each regression coefficient, the effects with a p-value less than 0.05 (indicating that they are significantly different from zero at a confidence level of 95.0%) are considered significant terms in the second-order modelled equation. Since the p-value for lack of fit in the ANOVA test for Ft Purity and Ft Amount are more important than 0.05, the models are adequate for the observed data at the 95.0% confidence level.

Author Contributions

Conceptualization, S.L.S.E., P.A.K. and M.G.; methodology, S.L.S.E., P.A.K. and M.L.C.; validation, S.L.S.E. and P.A.K.; formal analysis, S.L.S.E. and P.A.K.; investigation, S.L.S.E., P.A.K. and M.L.C.; resources, C.C.P. and M.G.; data curation, S.L.S.E. and P.A.K.; writing—original draft preparation, M.G.; writing—review and editing, C.C.P. and M.G.; visualization, S.L.S.E., P.A.K. and M.G.; supervision, C.C.P. and M.G.; project administration, M.G.; funding acquisition, C.C.P. and M.G. All authors have read and agreed to the published version of the manuscript.

Funding

This work was supported by grants from the Consejo Nacional de Investigaciones Científicas y Técnicas of Argentina (PIP 2021/23-1565) and Universidad Nacional de Quilmes (PUNQ EBIODEM 1600/25).

Institutional Review Board Statement

Not applicable.

Informed Consent Statement

Not applicable.

Data Availability Statement

The original contributions presented in this study are included in the article/Supplementary Materials. Further inquiries can be directed to the corresponding author.

Conflicts of Interest

S.L.S.E., P.A.K., M.L.C., and M.G. are researchers from Universidad Nacional de Quilmes. S.L.S.E., P.A.K., M.L.C., and M.G. are members of CONICET. C.C.P. is employed by Agropharma. The remaining authors declare that the research was conducted in the absence of any commercial or financial relationships that could be construed as a potential conflict of interest.

References

  1. Chekol Abebe, E.; Tilahun Muche, Z.; Behaile, T.; Mariam, A.; Mengie Ayele, T.; Mekonnen Agidew, M.; Teshome Azezew, M.; Abebe Zewde, E.; Asmamaw Dejenie, T.; Asmamaw Mengstie, M. The structure, biosynthesis, and biological roles of fetuin-A: A review. Front. Cell Dev. Biol. 2022, 10, 945287. [Google Scholar] [CrossRef] [PubMed]
  2. Fisher, H.W.; Puck, T.T.; Sato, G. Molecular growth requirements of single mammalian cells: The action of fetuin in promoting cell attachment to glass. Proc. Natl. Acad. Sci. USA 1958, 44, 4–10. [Google Scholar] [CrossRef] [PubMed]
  3. Ham, R.G.; St Clair, J.A.; Meyer, S.D. Improved media for rapid clonal growth of normal human skeletal muscle satellite cells. In Myoblast Transfer Therapy; Springer: Boston, MA, USA, 1990; pp. 193–199. [Google Scholar]
  4. Kundranda, M.N.; Henderson, M.; Carter, K.J.; Gorden, L.; Binhazim, A.; Ray, S.; Baptiste, T.; Shokrani, M.; Leite-Browning, M.L.; Jahnen-Dechent, W.; et al. The serum glycoprotein fetuin-A promotes Lewis lung carcinoma tumorigenesis via adhesive-dependent and adhesive-independent mechanisms. Cancer Res. 2005, 65, 499–506. [Google Scholar] [CrossRef] [PubMed]
  5. Rafnsdóttir, Ó.B.; Kiuru, A.; Tebäck, M.; Friberg, N.; Revstedt, P.; Zhu, J.; Thomasson, S.; Czopek, A.; Malakpour-Permlid, A.; Weber, T.; et al. A new animal product free defined medium for 2D and 3D culturing of normal and cancer cells to study cell proliferation and migration as well as dose response to chemical treatment. Toxicol. Rep. 2023, 10, 509–520. [Google Scholar] [CrossRef]
  6. Skrivergaard, S.; Young, J.F.; Sahebekhtiari, N.; Semper, C.; Venkatesan, M.; Savchenko, A.; Stogios, P.J.; Therkildsen, M.; Rasmussen, M.K. A simple and robust serum-free media for the proliferation of muscle cells. Food Res. Int. 2023, 172, 113194. [Google Scholar] [CrossRef]
  7. Dziegielewska, K.M.; Brown, W.M.; Gould, C.C.; Matthews, N.; Sedgwick, J.E.C.; Saunders, N.R. Fetuin: An acute phase protein in cattle. J. Comp. Physiol. B 1992, 162, 168–171. [Google Scholar] [CrossRef]
  8. Christie, D.L.; Dziegielewska, K.M.; Hill, R.M.; Saunders, N.R. Fetuin: The bovine homologue of human α2HS glycoprotein. FEBS Lett. 1987, 214, 45–49. [Google Scholar] [CrossRef]
  9. Pedersen, K.O. Fetuin, a new globulin isolated from serum. Nature 1944, 154, 575. [Google Scholar] [CrossRef]
  10. Weber, T.; Malakpour-Permlid, A.; Chary, A.; D’Alessandro, V.; Haut, L.; Seufert, S.; Wenzel, E.V.; Hickman, J.; Bieback, K.; Wiest, J.; et al. Fetal bovine serum: How to leave it behind in the pursuit of more reliable science. Front. Toxicol. 2025, 7, 1612903. [Google Scholar] [CrossRef]
  11. Anspach, F.B. Endotoxin removal by affinity sorbents. J. Biochem. Biophys. Methods 2001, 49, 665–681. [Google Scholar] [CrossRef]
  12. Spiro, R.G. Studies on Fetuin, a Glycoprotein of Fetal Serum: I. Isolation, chemical composition, and physiocochemical properties. J. Biol. Chem. 1960, 235, 2860–2869. [Google Scholar] [CrossRef] [PubMed]
  13. Deutsch, H.F. Fetuin: The mucoprotein of fetal calf serum. J. Biol. Chem. 1954, 208, 669–678. [Google Scholar] [CrossRef] [PubMed]
  14. Nie, Z. Fetuin: Its enigmatic property of growth promotion. Am. J. Physiol.-Cell Physiol. 1992, 263, C551–C562. [Google Scholar] [CrossRef] [PubMed]
  15. Sakwe, A.M.; Koumangoye, R.; Goodwin, S.J.; Ochieng, J. Fetuin-A (α2HS-glycoprotein) is a major serum adhesive protein that mediates growth signaling in breast tumor cells. J. Biol. Chem. 2010, 285, 41827–41835. [Google Scholar] [CrossRef]
  16. Cartellieri, S.; Hamer, O.; Helmholz, H.; Niemeyer, B. One-step affinity purification of fetuin from fetal bovine serum. Biotechnol. Appl. Biochem. 2002, 35, 83–89. [Google Scholar] [CrossRef]
  17. Nakano, T.; Ozimek, L. Purification of glycomacropeptide from dialyzed and non-dialyzed sweet whey by anion-exchange chromatography at different pH values. Biotechnol. Lett. 2000, 22, 1081–1086. [Google Scholar] [CrossRef]
  18. Kapitany, R.A.; Zebrowski, E.J. A high resolution PAS stain for polyacrylamide gel electrophoresis. Anal. Biochem. 1973, 56, 361–369. [Google Scholar] [CrossRef]
  19. Lin, Y.H.; Franc, V.; Heck, A.J. Similar albeit not the same: In-depth analysis of proteoforms of human serum, bovine serum, and recombinant human fetuin. J. Proteome Res. 2018, 17, 2861–2869. [Google Scholar] [CrossRef]
  20. Zheng, X.; Baker, H.; Hancock, W.S.; Fawaz, F.; McCaman, M.; Pungor, E., Jr. Proteomic analysis for the assessment of different lots of fetal bovine serum as a raw material for cell culture. Part IV. Application of proteomics to the manufacture of biological drugs. Biotechnol. Prog. 2006, 22, 1294–1300. [Google Scholar] [CrossRef]
  21. Brown, W.M.; Dziegielewska, K.M.; Saunders, N.R.; Møsllgård, K. Fetuin-an old friend revisited. Bioessays 1992, 14, 749–755. [Google Scholar] [CrossRef]
  22. Stival, A.C.S.; da Silva, A.C.G.; Valadares, M.C. Qualitative and quantitative evaluation of Fetal Bovine Serum composition: Toward ethical and best quality in vitro science. NAM J. 2025, 1, 100047. [Google Scholar] [CrossRef]
  23. Traving, C.; Schauer, R. Structure, function, and metabolism of sialic acids. Cell. Mol. Life Sci. CMLS 1998, 54, 1330–1349. [Google Scholar] [CrossRef]
  24. Montgomery, D.C.; Montgomery, M. Design and Analysis of Experiments, 8th ed.; John Wiley & Sons: Hoboken, NJ, USA, 2012. [Google Scholar]
  25. Myers, R.H.; Montgomery, D.C.; Anderson-Cook, C.M. Response Surface Methodology: Process and Product Optimization Using Designed Experiments; Wiley: Hoboken, NJ, USA, 2016. [Google Scholar]
  26. Hibbert, D.B. Experimental design in chromatography: A tutorial review. J. Chromatogr. B 2012, 910, 2–13. [Google Scholar] [CrossRef] [PubMed]
  27. Kanal, K.M.; Fullerton, G.D.; Cameron, I.L. Estudio de las fuentes moleculares de la presión osmótica no ideal de soluciones de albúmina sérica bovina en función del pH. Rev. Biofísica 1994, 66, 153–160. [Google Scholar]
  28. Ghosh, D.; Karmakar, P. Perspectivas sobre polímeros de carbohidratos antioxidantes de plantas medicinales: Relaciones estructura-actividad, mecanismos de acción e interacciones con albúmina sérica bovina. Rev. Int. Macromol. Biól. 2021, 166, 1022–1034. [Google Scholar] [CrossRef] [PubMed]
  29. Wiogo, H.T.; Lim, M.; Bulmus, V.; Yun, J.; Amal, R. Stabilization of magnetic iron oxide nanoparticles in biological media by fetal bovine serum (FBS). Langmuir 2011, 27, 843–850. [Google Scholar] [CrossRef]
  30. Zolton, R.P. Studies on Plasminogen; Purdue University: West Lafayette, IN, USA, 1972. [Google Scholar]
  31. Kim, L.T.; Ishihara, S.; Lee, C.C.; Akiyama, S.K.; Yamada, K.M.; Grinnell, F. Altered glycosylation and cell surface expression of β1 integrin receptors during keratinocyte activation. J. Cell Sci. 1992, 103, 743–753. [Google Scholar] [CrossRef]
  32. The UniProt Consortium. UniProt (ID P53712). 2025. Available online: https://www.ebi.ac.uk/interpro/protein/UniProt/P53712/sequence/#1–798 (accessed on 9 December 2025).
  33. Lipkin, V.M.; Khramtsov, N.V.; Vasilevskaya, I.A.; Atabekova, N.V.; Muradov, K.G.; Gubanov, V.V.; Applebury, M.L. Beta-subunit of bovine rod photoreceptor cGMP phosphodiesterase. Comparison with the phosphodiesterase family. J. Biol. Chem. 1990, 265, 12955–12959. [Google Scholar] [CrossRef]
  34. The UniProt Consortium. UniProt (ID P23439). 2025. Available online: https://www.uniprot.org/uniprotkb/P23439/entry#sequences (accessed on 9 December 2025).
  35. Nordenman, B.; NYSTRöm, C.; BJörk, I. The size and shape of human and bovine antithrombin III. Eur. J. Biochem. 1977, 78, 195–203. [Google Scholar] [CrossRef]
  36. Borzouee, F.; Mofid, M.R.; Varshosaz, J.; Shariat, S.Z.A.S. Purification of lactoperoxidase from bovine whey and investigation of kinetic parameters. Adv. Biomed. Res. 2016, 5, 189. [Google Scholar] [CrossRef]
  37. Skehel, J.M.; Fearnley, I.M.; Walker, J.E. NADH: Ubiquinone oxidoreductase from bovine heart mitochondria: Sequence of a novel 17.2-kDa subunit. FEBS Lett. 1998, 438, 301–305. [Google Scholar] [CrossRef]
  38. The UniProt Consortium. UniProt (ID P15690). 2025. Available online: https://www.uniprot.org/uniprotkb/P15690/entry#sequences (accessed on 9 December 2025).
  39. Ingwall, J.S.; Scheraga, H.A. Purification and properties of bovine prothrombin. Biochemistry 1969, 8, 1860–1869. [Google Scholar] [CrossRef] [PubMed]
  40. Pechet, L.; Smith, J.A. The separation of clotting factors: II (Prothrombin) and IX (Plasma thromboplastin component) by isoelectric focusing. Biochim. Biophys. Acta (BBA)-Protein Struct. 1970, 200, 475–485. [Google Scholar] [CrossRef]
  41. Richardson, N.E.; Buttress, N.; Feinstein, A.; Stratil, A.; Spooner, R.L. Structural studies on individual components of bovine transferrin. Biochem. J. 1973, 135, 87–92. [Google Scholar] [CrossRef] [PubMed]
  42. The UniProt Consortium. UniProt (ID G3X6N3). 2025. Available online: https://www.uniprot.org/uniprotkb/G3X6N3/entry#sequences (accessed on 9 December 2025).
  43. Telser, A.; Farbman, A.I.; Chacko, C. A low-molecular-weight soluble protein from bovine lingual epithelium. II. Purification and characterization. J. Investig. Dermatol. 1982, 79, 286–292. [Google Scholar] [CrossRef]
  44. Drvenica, I.T.; Stančić, A.Z.; Kalušević, A.M.; Marković, S.B.; Dragišić-Maksimović, J.J.; Nedović, V.A.; Bugarski, B.M.; Ilić, V.L. Maltose-mediated, long-term stabilization of freeze-and spray-dried forms of bovine and porcine hemoglobin. J. Serbian Chem. Soc. 2019, 84, 1105–1117. [Google Scholar] [CrossRef]
  45. The UniProt Consortium. UniProt (ID P02081). 2025. Available online: https://www.uniprot.org/uniprotkb/P02081/entry#sequences (accessed on 9 December 2025).
  46. Christensen, S.; Berglund, L.; Sottrup-Jensen, L. Primary structure of bovine α2-antiplasmin. FEBS Lett. 1994, 343, 223–228. [Google Scholar] [CrossRef][Green Version]
  47. The UniProt Consortium. UniProt (ID P28800). 2025. Available online: https://www.uniprot.org/uniprotkb/P28800/entry#sequences (accessed on 9 December 2025).
  48. Hook, V.Y.; Tezapsidis, N.; Hwang, S.R.; Sei, C.; Byrne, M.; Yasothornsrikul, S. α1-Antichymotrypsin-Like Proteins I and II Purified from Bovine Adrenal Medulla Are Enriched in Chromaffin Granules and Inhibit the Proenkephalin Processing Enzyme “Prohormone Thiol Protease”. J. Neurochem. 1999, 73, 59–69. [Google Scholar] [CrossRef]
  49. Lindqvist, A.; Åkerström, B. Bovine α1-microglobulin/bikunin. Isolation and characterization of liver cDNA and urinary α1-microglobulin. Biochim. Biophys. Acta (BBA)-Gene Struct. Expr. 1996, 1306, 98–106. [Google Scholar] [CrossRef]
  50. The UniProt Consortium. UniProt (ID P81644). 2025. Available online: https://www.uniprot.org/uniprotkb/P81644/entry#sequences (accessed on 9 December 2025).
  51. Scaloni, A.; Pieragostini, E.; Malorni, A.; Ferrara, L.; Di Luccia, A. Polimorfismo de la cadena de α-globina de la hemoglobina bovina: Determinación de la estructura primaria de dos nuevas variantes genéticas mediante espectrometría de masas y secuenciación de aminoácidos. Biochimie 1998, 8, 333–338. [Google Scholar] [CrossRef]
  52. The UniProt Consortium. UniProt (ID P01966). 2025. Available online: https://www.uniprot.org/uniprotkb/P01966/entry#sequences (accessed on 9 December 2025).
Figure 1. Response surface for the effects of adsorption parameters (pH and FBS concentration) on Ft purity (A) and recovered Ft amount (B) and contour plots of Ft purity (C) and recovered Ft amount (D).
Jpbi 03 00004 g001
Figure 2. Total eluted protein and amount of recovered fetuin (Ft) following anion exchange chromatography at varying adsorption buffer pH values using 40% diluted FBS.
Jpbi 03 00004 g002
Figure 3. Chromatogram plot corresponding to 1250 mL 40% FBS loaded into a 400 mL DEAE-Sepharose column using 20 mM acetate buffer, pH 5 (A). SDS-PAGE gel corresponding to different samples of the process, stained with PAS, followed by Coomassie stain (B). Sample labels: MW = molecular weight markers; ST1/2/3 = Ft 2.4/4.2/10.3 µg respectively; BSA = bovine serum albumin; S = FBS 40%; PT = pass-through; W = washing peak; E1 = elution peak (* different dilution). Dilution factors and sample volume are described in Figure S6.
Jpbi 03 00004 g003
Figure 4. Microphotograph pictures of MDBK culture in different media: (A) StdCM + 5% FBS, (B) StdCM + 1.25% FBS, (C) SFM + 80 mg/mL insulin, and (D) SFM + 80 mg/mL insulin + 0.37% Ft.
Jpbi 03 00004 g004
Table 1. Factors and levels used for the response surface methodology test.
FactorsLevel
−α−10+1
pH (value)3.53.84.55.25.5
Concentration (%)2630405054
Table 2. Results of the response surface methodology test. Four repetitions of the central points (Exp. 1), four axial points (Exp. 3, 5, 7, and 9), and four factorial design points (Exp. 2, 4, 6, and 8).
Experiment n°Factors LevelExperimental Conditions Response
FBS Concentration (%), pHConductivity (μS/cm)Ft (mg)Ft Purity (%)
10, 040, 4.5417 ± 3 (n = 4)103 ± 11 (n = 4)
2+1, +150, 5.25.41349
30, +α40, 5.541038
4−1, +130, 5.23.71646
5−α, 026, 4.531150
6−1, −130, 3.83.7683
70, −α40, 3.54386
8+1, −150, 3.85.4257
9+α, 054, 4.55.81654
Disclaimer/Publisher’s Note: The statements, opinions and data contained in all publications are solely those of the individual author(s) and contributor(s) and not of MDPI and/or the editor(s). MDPI and/or the editor(s) disclaim responsibility for any injury to people or property resulting from any ideas, methods, instructions or products referred to in the content.