Article

Quantification of Trace Polymorphic Impurity in Celecoxib with Powder X-Ray Diffraction Technique

by
Amita G. Dhadphale
and
Kamini J. Donde
*
Department of Chemistry, Ramnarain Ruia Autonomous College, L. N. Road, Matunga (East), Mumbai 400 019, India
*
Author to whom correspondence should be addressed.
J. Pharm. BioTech Ind. 2025, 2(2), 4; https://doi.org/10.3390/jpbi2020004
Submission received: 29 October 2024 / Revised: 12 February 2025 / Accepted: 3 March 2025 / Published: 21 March 2025

Abstract

:
A selective inhibitor of cyclooxygenase-2 (COX-2), Celecoxib (CEB), known for its anti-inflammatory properties, can exhibit polymorphism, with Form III often emerging as an undesired crystalline impurity during the green manufacturing process of the preferred Form I. Controlling the Form III content in the drug product is crucial, as different crystalline forms can impact drug bioavailability and therapeutic efficacy. This study presents a method to quantify the weight percentage of Form III in the bulk of CEB Form I by employing powder X-ray diffraction (PXRD). Initially, pure Form I and III of CEB were characterized using DSC, FTIR, and PXRD, supporting the method’s development. Binary mixtures, with varying ratios of CEB polymorphs Form I and Form III, were prepared and analyzed using continuous scans over an angular (2θ) range of 2–40. The calibration curve was constructed using 2θ unique peaks for Form I and Form III, respectively. Linear regression analysis exhibited a strong linear relationship within the weight ratio range of 1–20%. The developed method was validated to assess recovery, precision, ruggedness, limits of detection, and quantitation. These findings indicate that the method exhibits repeatability, sensitivity, and accuracy. The newly developed and validated PXRD method is applicable for quality control of CEB Form I produced through the green melt crystallization process by detecting low levels of Form III polymorphic impurity. This research significantly contributes to ensuring the clinical efficacy and manufacturing quality of Celecoxib by providing a reliable method for controlling polymorphic impurities.

1. Introduction

Polymorphism refers to how chemical compounds can crystallize into various crystalline forms, each characterized by different packing arrangements of molecules within its crystal lattice [1,2]. It is widely acknowledged that some pharmaceutical solids, e.g., gliclazide, furosemide, hydrochlorothiazide, etc., can adopt multiple polymorphic forms under specific conditions [2,3,4,5]. These crystalline forms often exhibit distinct physicochemical properties, such as solubility, bio efficacy and stability, which can significantly impact drug efficacy [6,7,8]. Consequently, controlling the crystalline phase composition of solid drugs is crucial, as required by Pharmacopeia monographs, to ensure active pharmaceutical ingredients (APIs) remain in a single, fixed crystalline form [9]. Detecting and quantifying polymorphs is essential to prevent compromising the physicochemical properties of pharmaceuticals due to polymorphic impurities.
(4-[5-(4-methylphenyl)-3-trifluoromethyl-1H-pyazol-1-yl] benezenesulfonamide, Celecoxib, abbreviated as CEB (Figure 1), is a selective cyclooxygenase-2 (COX-2) inhibitor having anti-inflammatory activity approved for treatment of mild to moderate pain and to alleviate symptoms associated with arthritis, such as inflammation, swelling, stiffness, and joint pain, including rheumatoid arthritis, juvenile rheumatoid arthritis or osteoarthritis [10,11,12]. Polymorphism is a significant phenomenon observed in CEB. Various literature documents on more than 15 molecular modifications, including co-crystals, salts, solvates, eutectics, etc., of CEB have been reported [13,14,15,16,17,18,19,20]. So far, only four crystalline polymorphic forms of CEB have been documented in the literature [13,14]; out of which, Form II is observed to be thermodynamically unstable and is converted to Form III gradually during storage [14]. CEB Form I is often used as a drug substance due to its higher stability. The undesired polymorph of CEB, i.e., Form III may emerge as polymorphic impurity in minor quantities during the industrial production of Form I by green solventless process such as melt crystallization [15,16]. The reason may be that slight variation in the cooling rate of molten CEB leads to the formation of seeds of undesired polymorph, i.e., Form III [21]. Due to varying solubility and bioavailability of the two polymorphic forms of CEB, the presence of polymorphic impurity may affect the therapeutic outcome. In order to optimize the parameters of melt crystallization process, it is important to analyze and quantify the polymorphic impurities present in the CEB prepared by melt crystallization process. Thus, quantifying the polymorphic impurity Form III during the industrial production of CEB Form I would be of great significance.
Various analytical techniques, including Raman spectroscopy, Fourier transform infrared spectroscopy (FTIR), thermal methods, solid-state nuclear magnetic resonance spectroscopy (ssNMR), and powder X-ray diffraction (PXRD), are used to quantify polymorphs and amorphous content present in the mixtures of crystalline materials [22,23,24,25,26,27]. Among these, PXRD, despite its limitations [28], is preferred, due to its unique ability to provide distinct X-ray powder patterns, non-destructive analysis, simplicity in operation, and room temperature analysis suitability for most of the drug substances and formulations [29,30,31,32,33]. PXRD is particularly effective in probing crystalline lattices, making it ideal for analyzing polymorphic content. Although other techniques like thermal analysis and spectroscopy can complement PXRD results and further characterize solid-state systems, PXRD remains unmatched in its low detection limits for polymorphic impurities [34]. The PXRD approach might yield an extremely low detection limit (LOD), as demonstrated in a prior study [35,36,37]. The literature offers findings on the quantification of various polymorphs, solvates and co-crystals of active pharmaceutical compounds performed using PXRD as the method of analysis [38,39,40].
To date, there are no reported studies on the quantification of Forms I and III of CEB. This study aims to develop and validate a reliable single-peak-based PXRD method for quantifying these forms using Rietveld Refinement. Critical factors in assay development include generating authentic and validated calibration curves, accurately identifying and measuring parameters like area of diffraction peaks, intensity, and instrument optimization and conditions of sample preparation [41,42,43]. The study characterizes the intrinsic properties of samples using DSC, FTIR, and PXRD, while optimizing preparation parameters to reduce measurement errors. The newly developed PXRD quantification method is validated for assay errors, providing a robust approach for analyzing polymorphic forms of CEB.

2. Materials and Methods

2.1. Materials and Sample Preparation Method

Pure CEB of purity ≥ 98% (w/w) is received as gift sample from Anusha Associates, Maharashtra, India, and used without purifying further. The other chemicals employed in the investigation were of analytical grade. CEB polymorph Form I was synthesized by melt crystallization employing cooling rate in the range of 15–20 °C/min using temperature-controlled chamber and CEB Form III was obtained through melt crystallization effected in a temperature-controlled chamber by a cooling rate in the range of 1–5 °C/min. The polymorphic purity of both the samples has been confirmed by DSC, FTIR and PXRD analysis.

2.2. Characterization of CEB Polymorphs

The characterization of both CEB polymorphs was conducted using DSC, FTIR, and PXRD analysis. Samples of both CEB polymorphs were thoroughly ground for 3–5 min using an agate mortar and pestle and passed through a sieve of mesh size 400 micron. These powdered homogenized samples were then used for the further DSC, FTIR and PXRD analysis.
DSC measurements were performed on powdered samples (3–4 mg) crimped in 40 μL aluminum pans, using a Mettler Toledo DSC 3+ calorimeter connected to Mettler STAR software (STARe 17.00). Under a nitrogen gas flow of 20 mL/min, the heating rate was adjusted to 5 °C/min throughout the temperature range of 35 to 200 °C to achieve better endothermic peak separation.
FTIR spectra were obtained using a PerkinElmer Spectrum 3 IR spectrophotometer (Perkin-Elmer, Beaconsfield, Buckinghamshire, UK) in transmission mode via the UATR method as it enables the collection of infrared spectra of solid samples without the need for extensive sample preparation. Every sample spectrum was captured at a resolution of 4 cm−1 over the 4000–450 cm−1 spectral range.
PXRD data were collected with the help of a Bruker D8 Advance X-ray diffractometer (Bruker, Billerica, MA, USA), calibrated by using SRM1976c α-Al2O3 (corundum) standard, at room temperature, with Cu-Kα radiation (λ = 1.5406 Å) at 30 mA and 40 kV. The setup included antiscattering slit, divergence slit, a receiving slit (0.15 mm) and a graphite curved crystal monochromator. Over an angle range of 2–40° 2θ, the samples were examined continuously in a mode with a step size of 0.02° and a scan rate of 3°/min. Manual loading of each sample into a Si low background sample container (20 mm × 20 mm × 0.5 mm) was performed and pressed with a glass slide to make the powder surface coplanar with respect to the holder surface. The resulting diffractograms were integrated using Diffrac.EVA software (6.0.0.7).

2.3. Preparation of Calibration Curve

Samples of standard mixtures for calibration curve measurement were prepared by gently blending the phase-pure powdered CEB Form I and Form III for 20 min using an agate mortar and pestle. Prior to mixing, both powdered samples were treated through sieves (400 mesh) with the purpose of minimizing the impact of particle size distribution on the preferred orientation during PXRD analysis [42]. The Qualitative analysis confirmed the identities of pure Form I and Form III. Six reference samples were prepared, containing 2, 4, 8, 12, 16, and 20 wt.% of CEB Form III, with corresponding amounts of CEB Form I to quantify lower percentages of polymorphic impurity present in bulk of CEB Form I. Each mixture consisted of 1.0 g of the respective powders, as listed in Table 1.
Documented evidence has demonstrated that CEB Form I and Form III remain stable for extended periods under normal storage conditions (25 °C, 75% relative humidity) [14]. Consequently, both sample sieving and mixing were carried out under these conditions. The calibration curve was established by taking the average of the three data obtained from the triple X-ray diffraction tests (PXRD) to enhance accuracy of the results. The detection limit (LOD) and quantification limit (LOQ) were subsequently determined using this calibration curve.

2.4. Validation of Analytical Method

The recently devised PXRD method for measuring CEB Form III in Form I was validated for ruggedness, precision, accuracy, LOD, and LOQ, among other criteria, to address the critical need for precise quantification of polymorphic impurities. Ruggedness assesses the method’s reliability under varied conditions, such as different analysts or instruments. Precision measures the consistency of the method when repeated under the same conditions. Accuracy evaluates how close the measured values are to the true value. The LOD (Limit of Detection) is the smallest amount of substance that can be reliably detected but not necessarily quantified. The LOQ (Limit of Quantitation) is the smallest amount of substance that can be quantitatively measured with acceptable precision and accuracy [44]. These key parameters were thoroughly assessed ensuring the method’s compliance with regulatory standards like ICH guidelines [45] and its suitability for routine quality control. These validations highlight the method’s capability to provide consistent and reproducible results, even under varying conditions, making it a valuable tool for pharmaceutical development and quality assurance.

2.4.1. Accuracy

To evaluate the method’s accuracy, a recovery study was carried out by analyzing samples at four different concentrations (2.5, 7.5, 12.5, and 17.5 wt.%) falling within the concentration range selected for calibration curve, each in triplicate. Based on the outcomes, the average % recoveries were calculated.

2.4.2. LOD and LOQ

Equations (1) and (2) were used, respectively, to determine the detection limit (LOD) and the quantification limit (LOQ) for this newly developed quantitative method. The calculations were based on the results obtained from the linear range of the calibration curve.
LOD = 3.3σ/S
LOQ = 10σ/S
where σ is the standard deviation of the blank and S is the slope of calibration curve.

2.4.3. Precision

The method’s precision (repeatability) was assessed by analyzing samples of three known concentrations (8, 12, and 16 wt.%), with six replicates for each concentration. The percentage relative standard deviation (% RSD) was calculated based on its percentage area ratio for each sample. The Indian pharmacopeia states that RSD up to 5–10% is usually acceptable for minor level impurities.

2.5. Estimation of Assay Error

A single mixture containing 1 wt.% of Form III was employed to evaluate parameters including intraday variability, interday variability, instrument precision, and sample packing to assess the errors associated with the PXRD assay.
Instrument repeatability was evaluated by conducting six consecutive measurements of the sample in the PXRD instrument without removing it from the holder. Repeatability in analytical instrumentation ensures consistent measurements under identical conditions, providing reliability essential for scientific research and quality assurance. The percentage relative standard deviation (% RSD) can vary based on instrument setup and sample homogeneity but is often expected to be within 2–5% for repeatability under the same conditions [33].
Interday repeatability also referred to as day-to-day repeatability, is essential for evaluating the consistency of analytical results over time, ensuring method reliability and robustness while identifying variations caused by environmental, operational, or equipment factors. Interday repeatability was examined over six days, with the X-ray profile recorded each day from the same sample. The % RSD for peak intensity is generally expected to be ≤3–5%, as slight variations may occur due to factors like sample preparation or minor fluctuations in instrument settings across days.
Intraday repeatability assesses the consistency of measurements within the same day under identical conditions, ensuring short-term precision, immediate variability detection, data reliability, and robust method validation for consistent analytical performance. Intraday repeatability was evaluated by acquiring six measurements of the single sample over an 8 h period. The acceptable % RSD limit for intraday repeatability of PXRD method is expected to be ≤2–3%, as this may vary slightly due to sample handling or minor environmental fluctuations. To assess variation due to orientation of crystals, the sample was repacked six times, with six measurements taken for each re-packing [33].
The percent relative standard deviation (% RSD) was calculated based on the percentage area ratio of each sample.

3. Results and Discussion

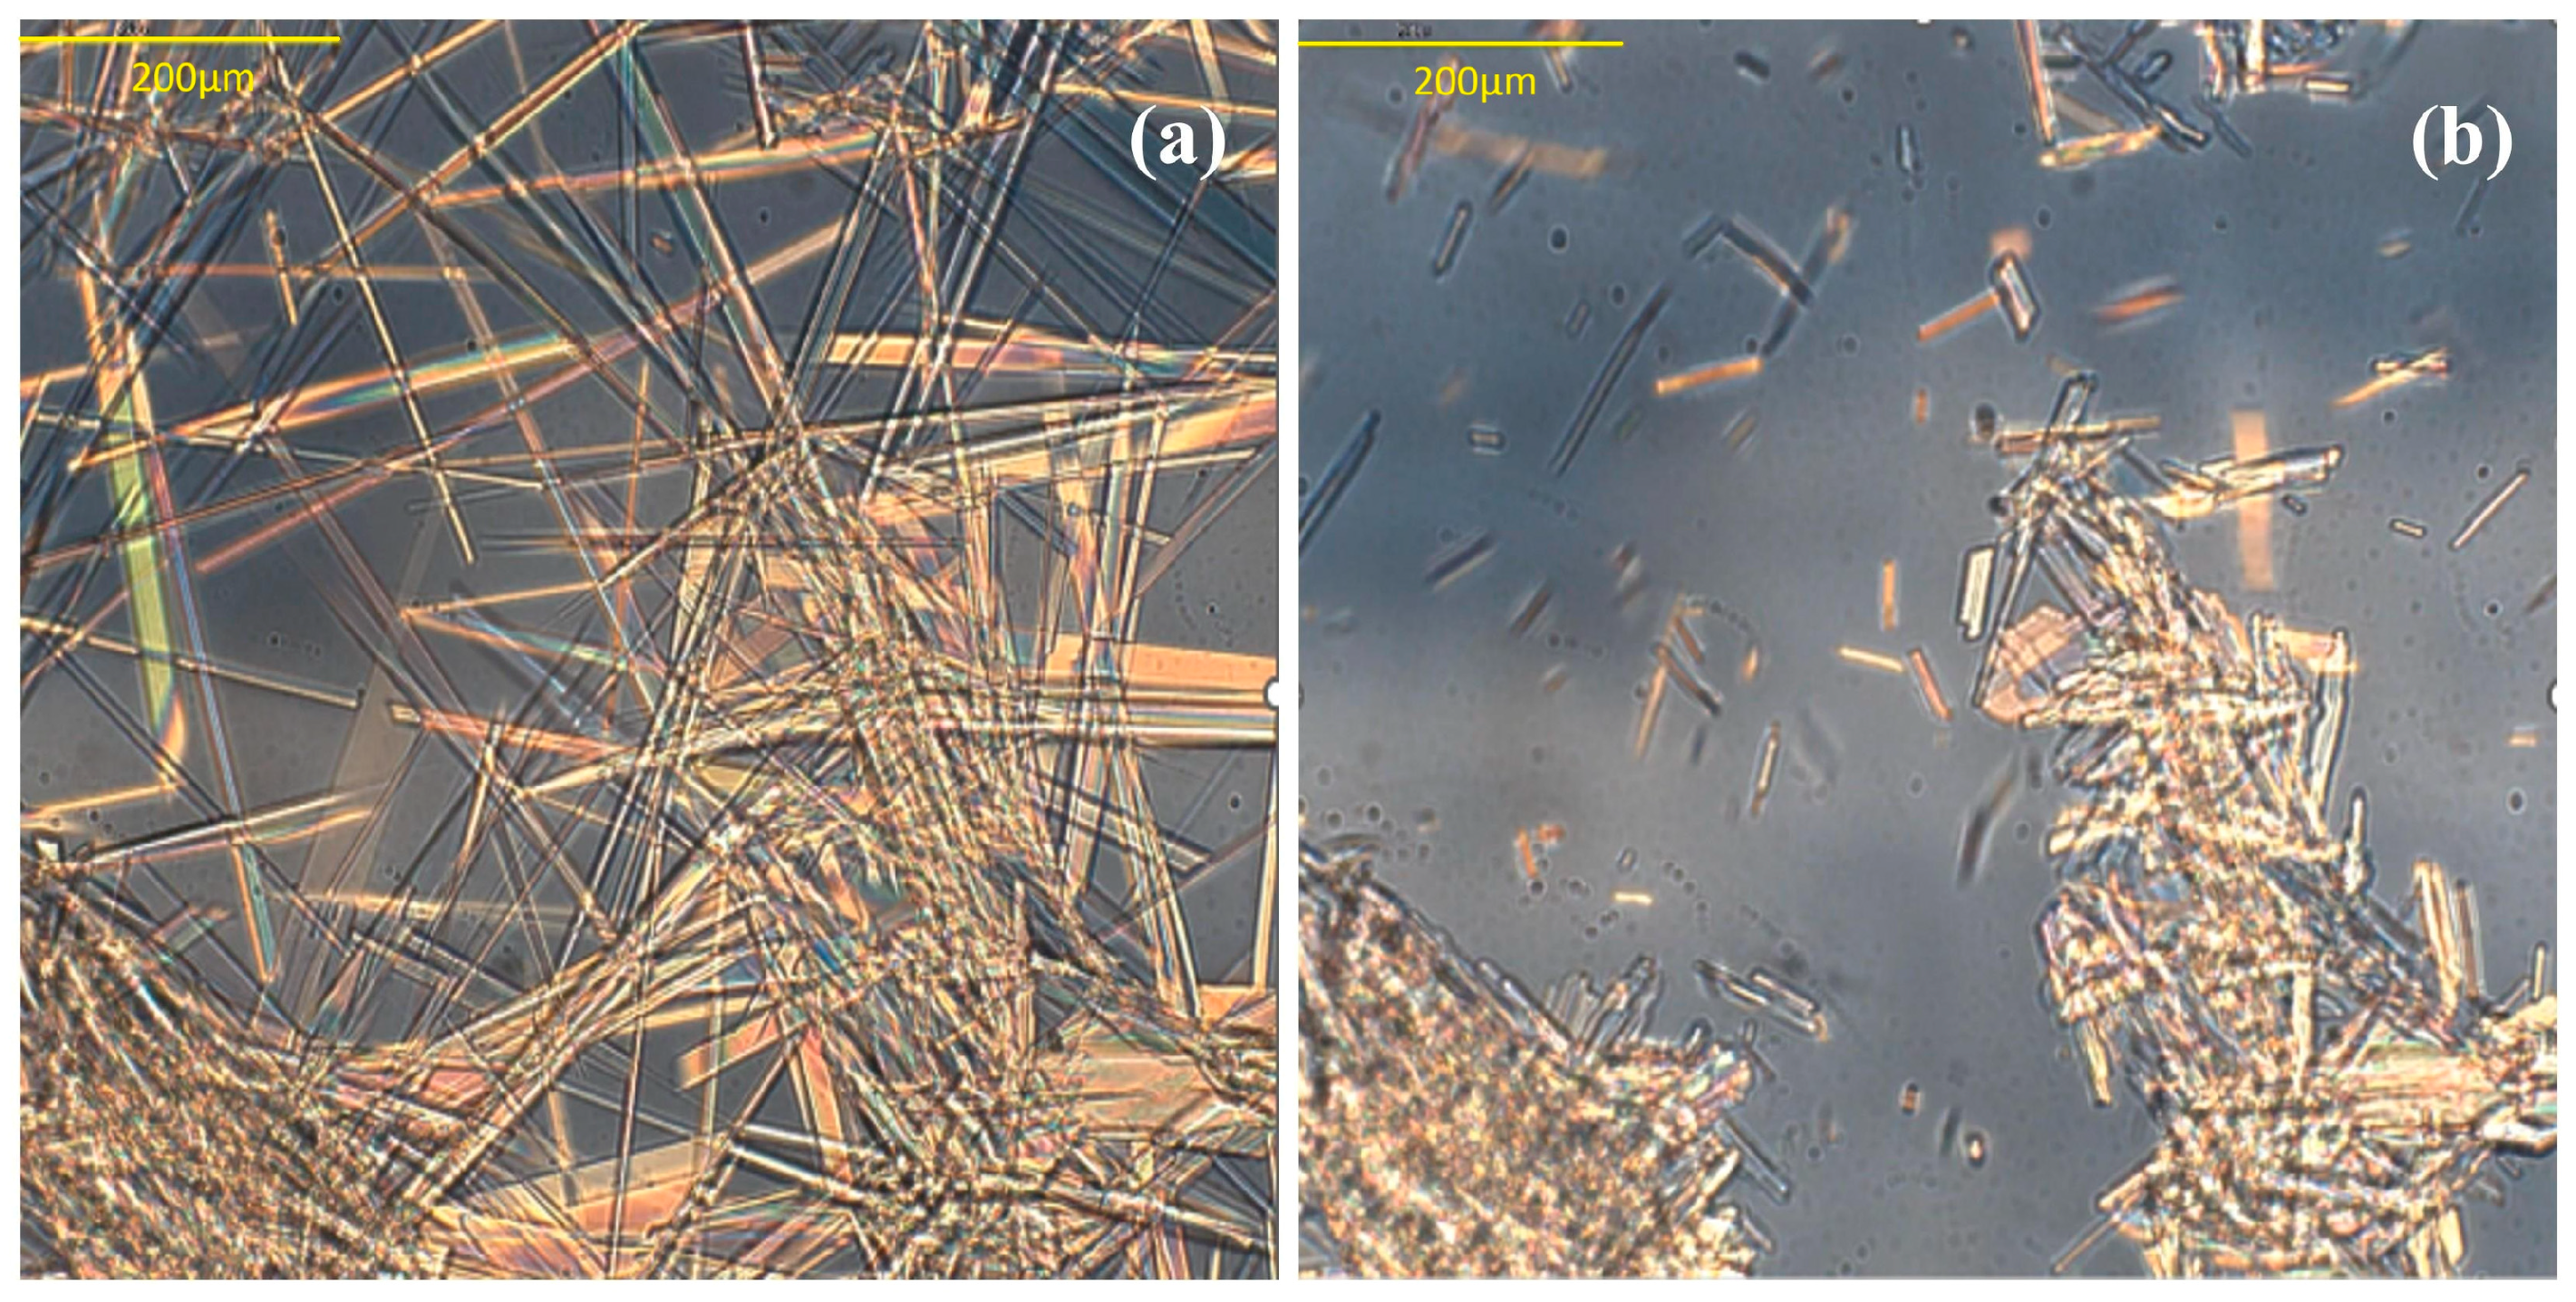
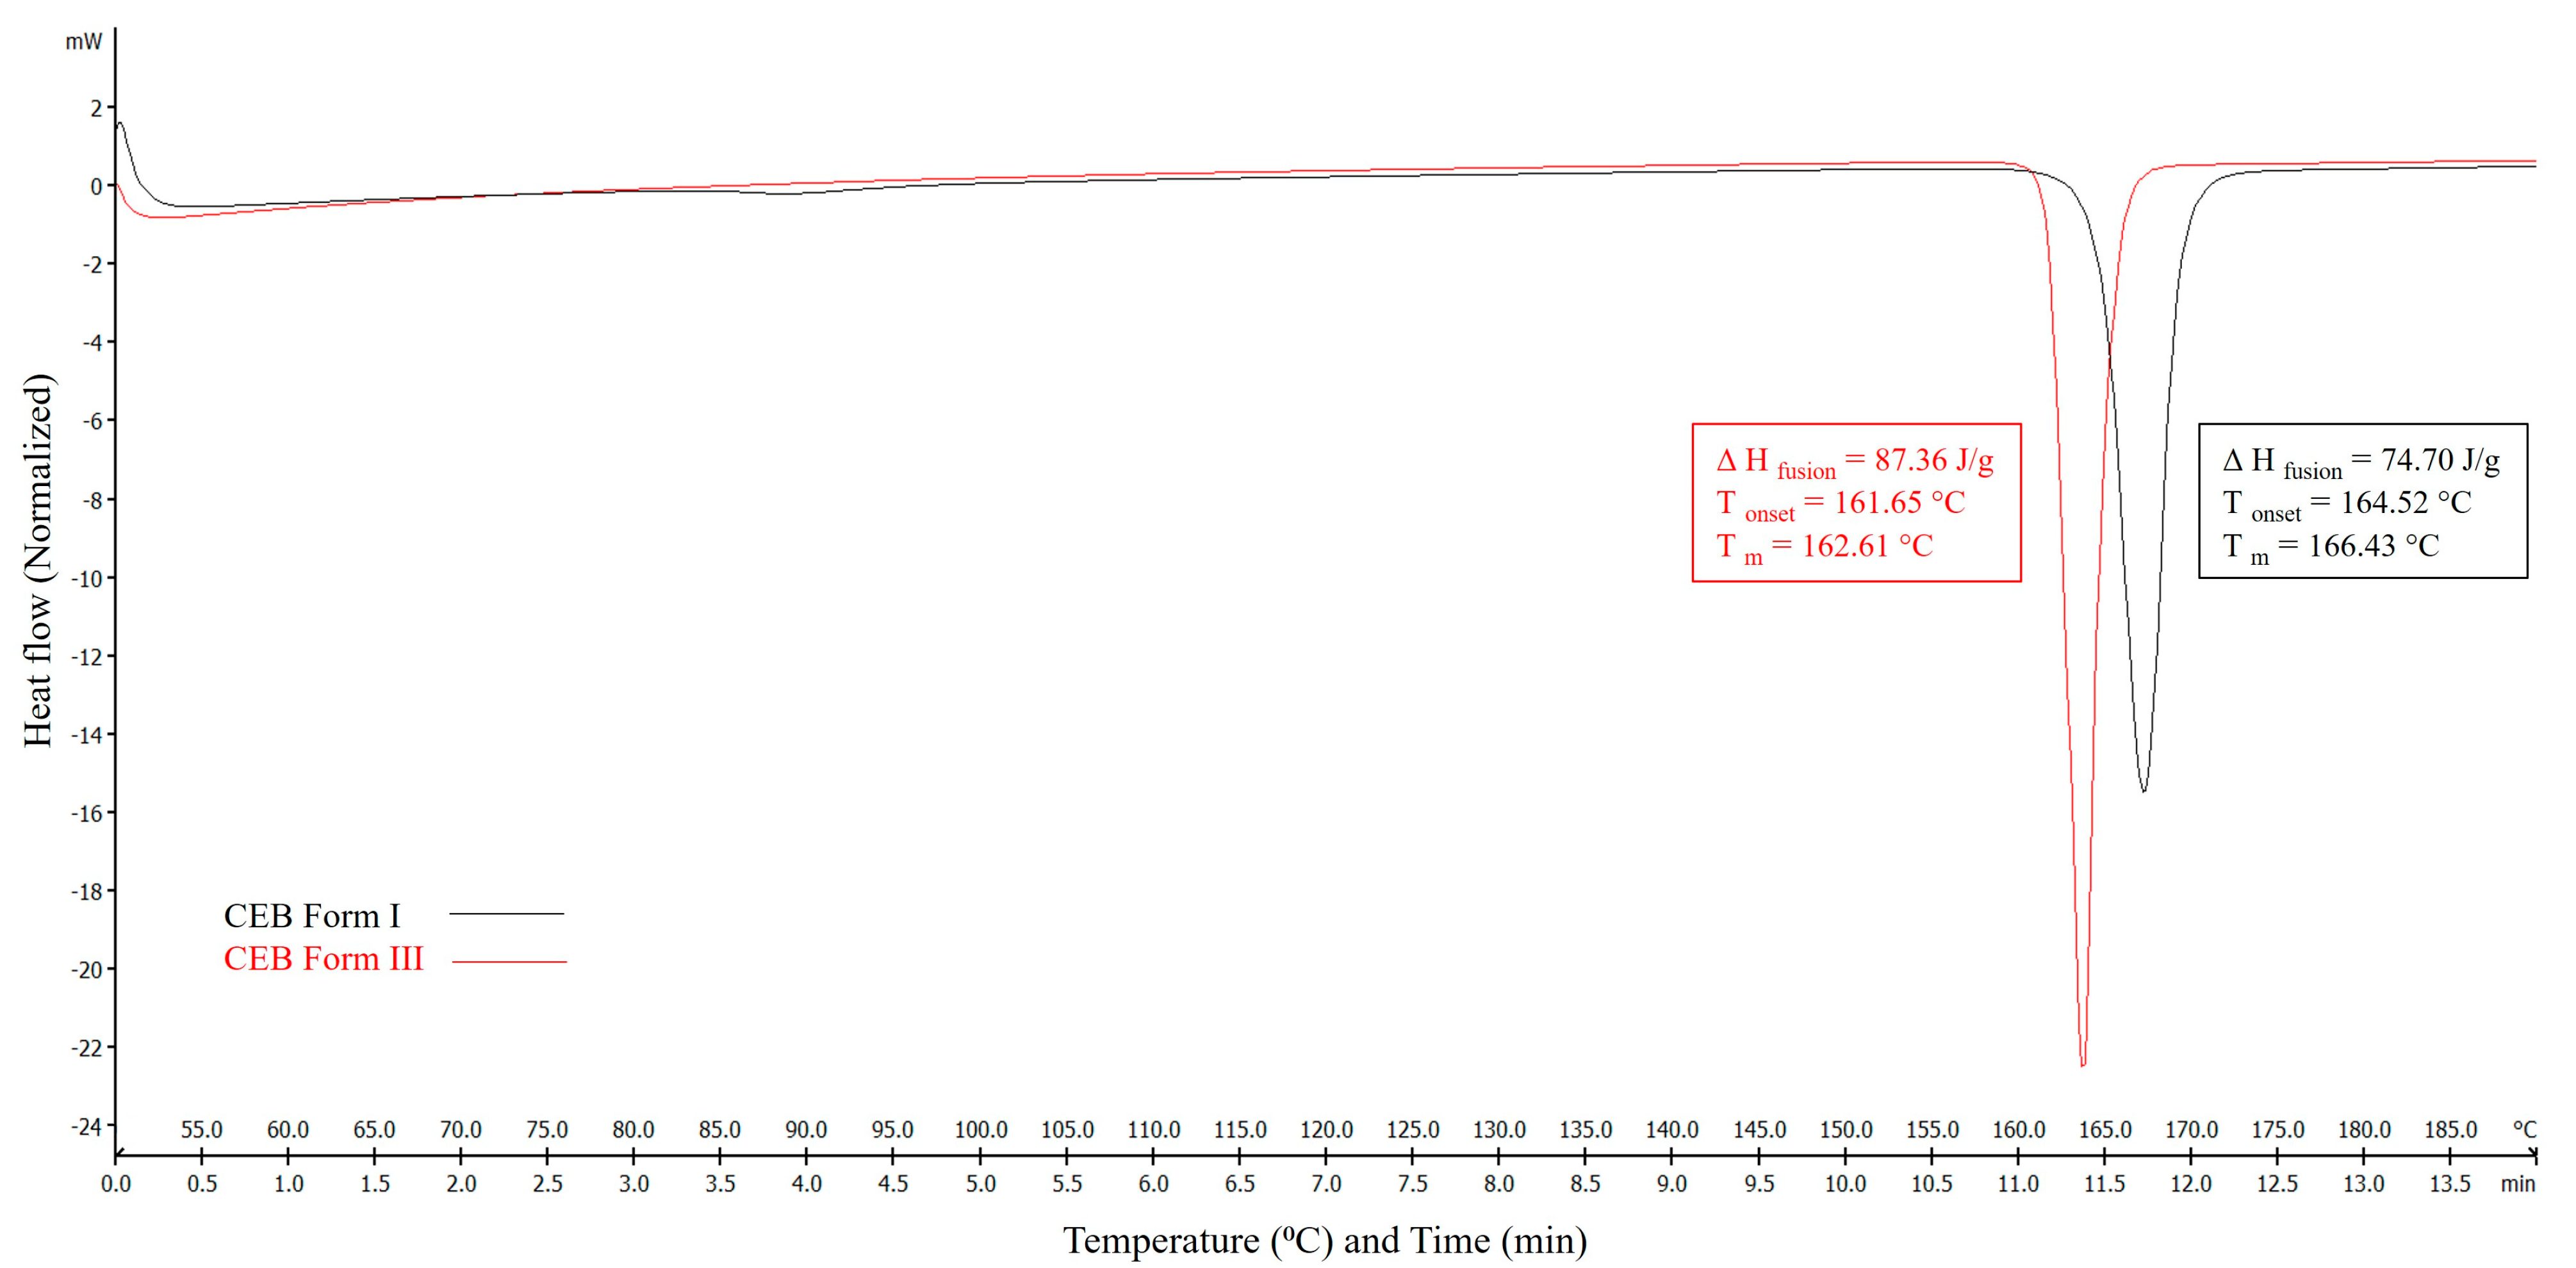
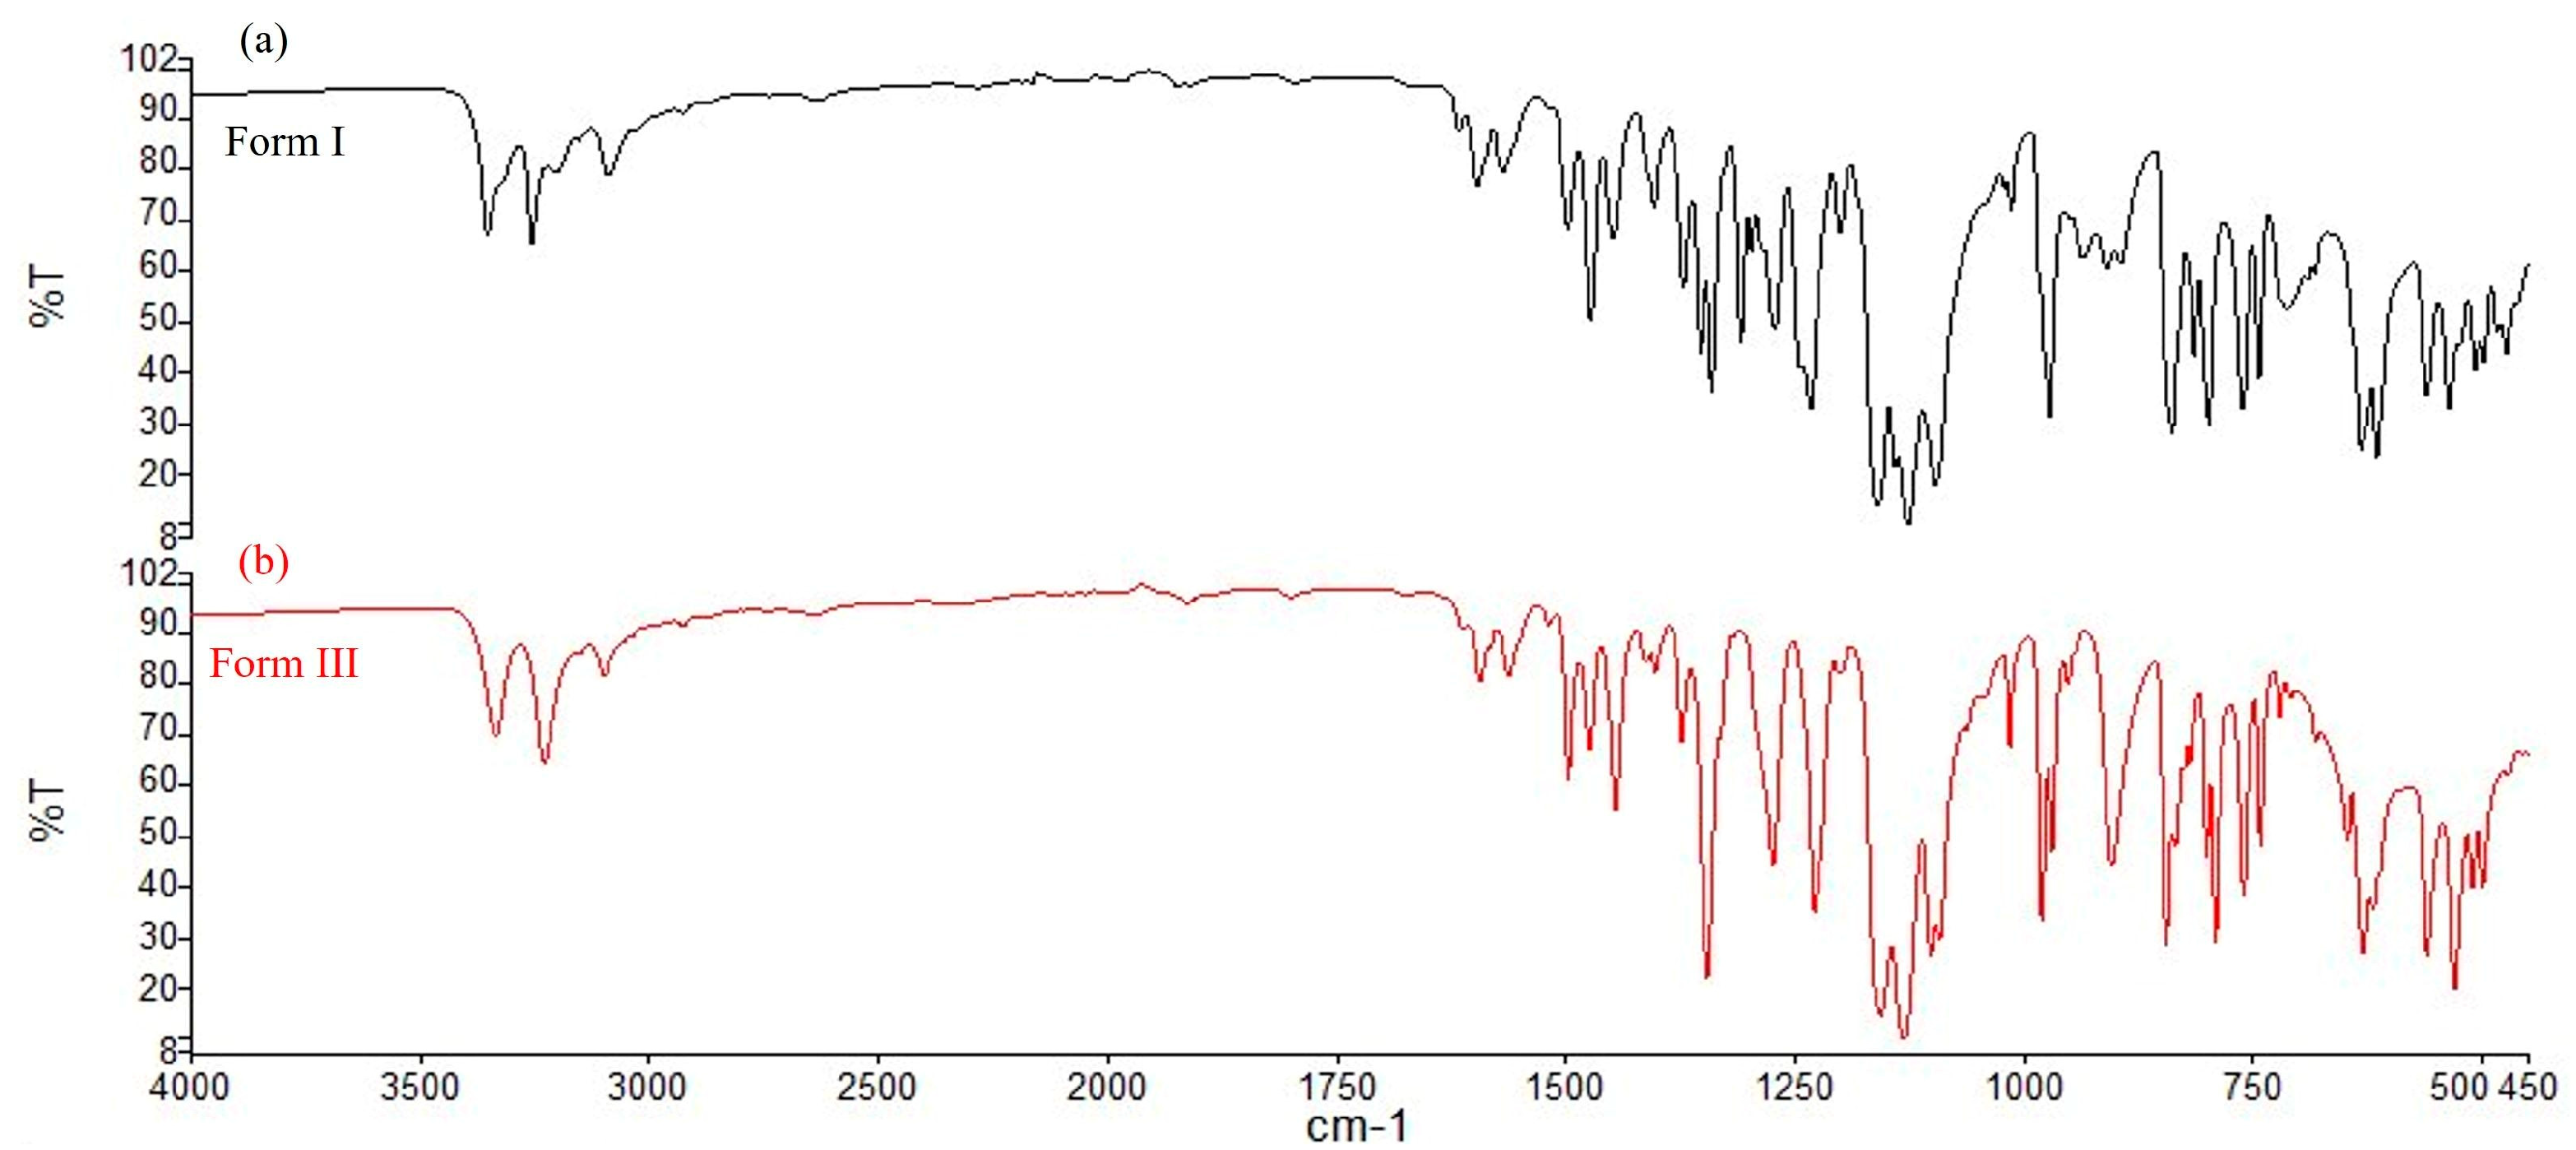
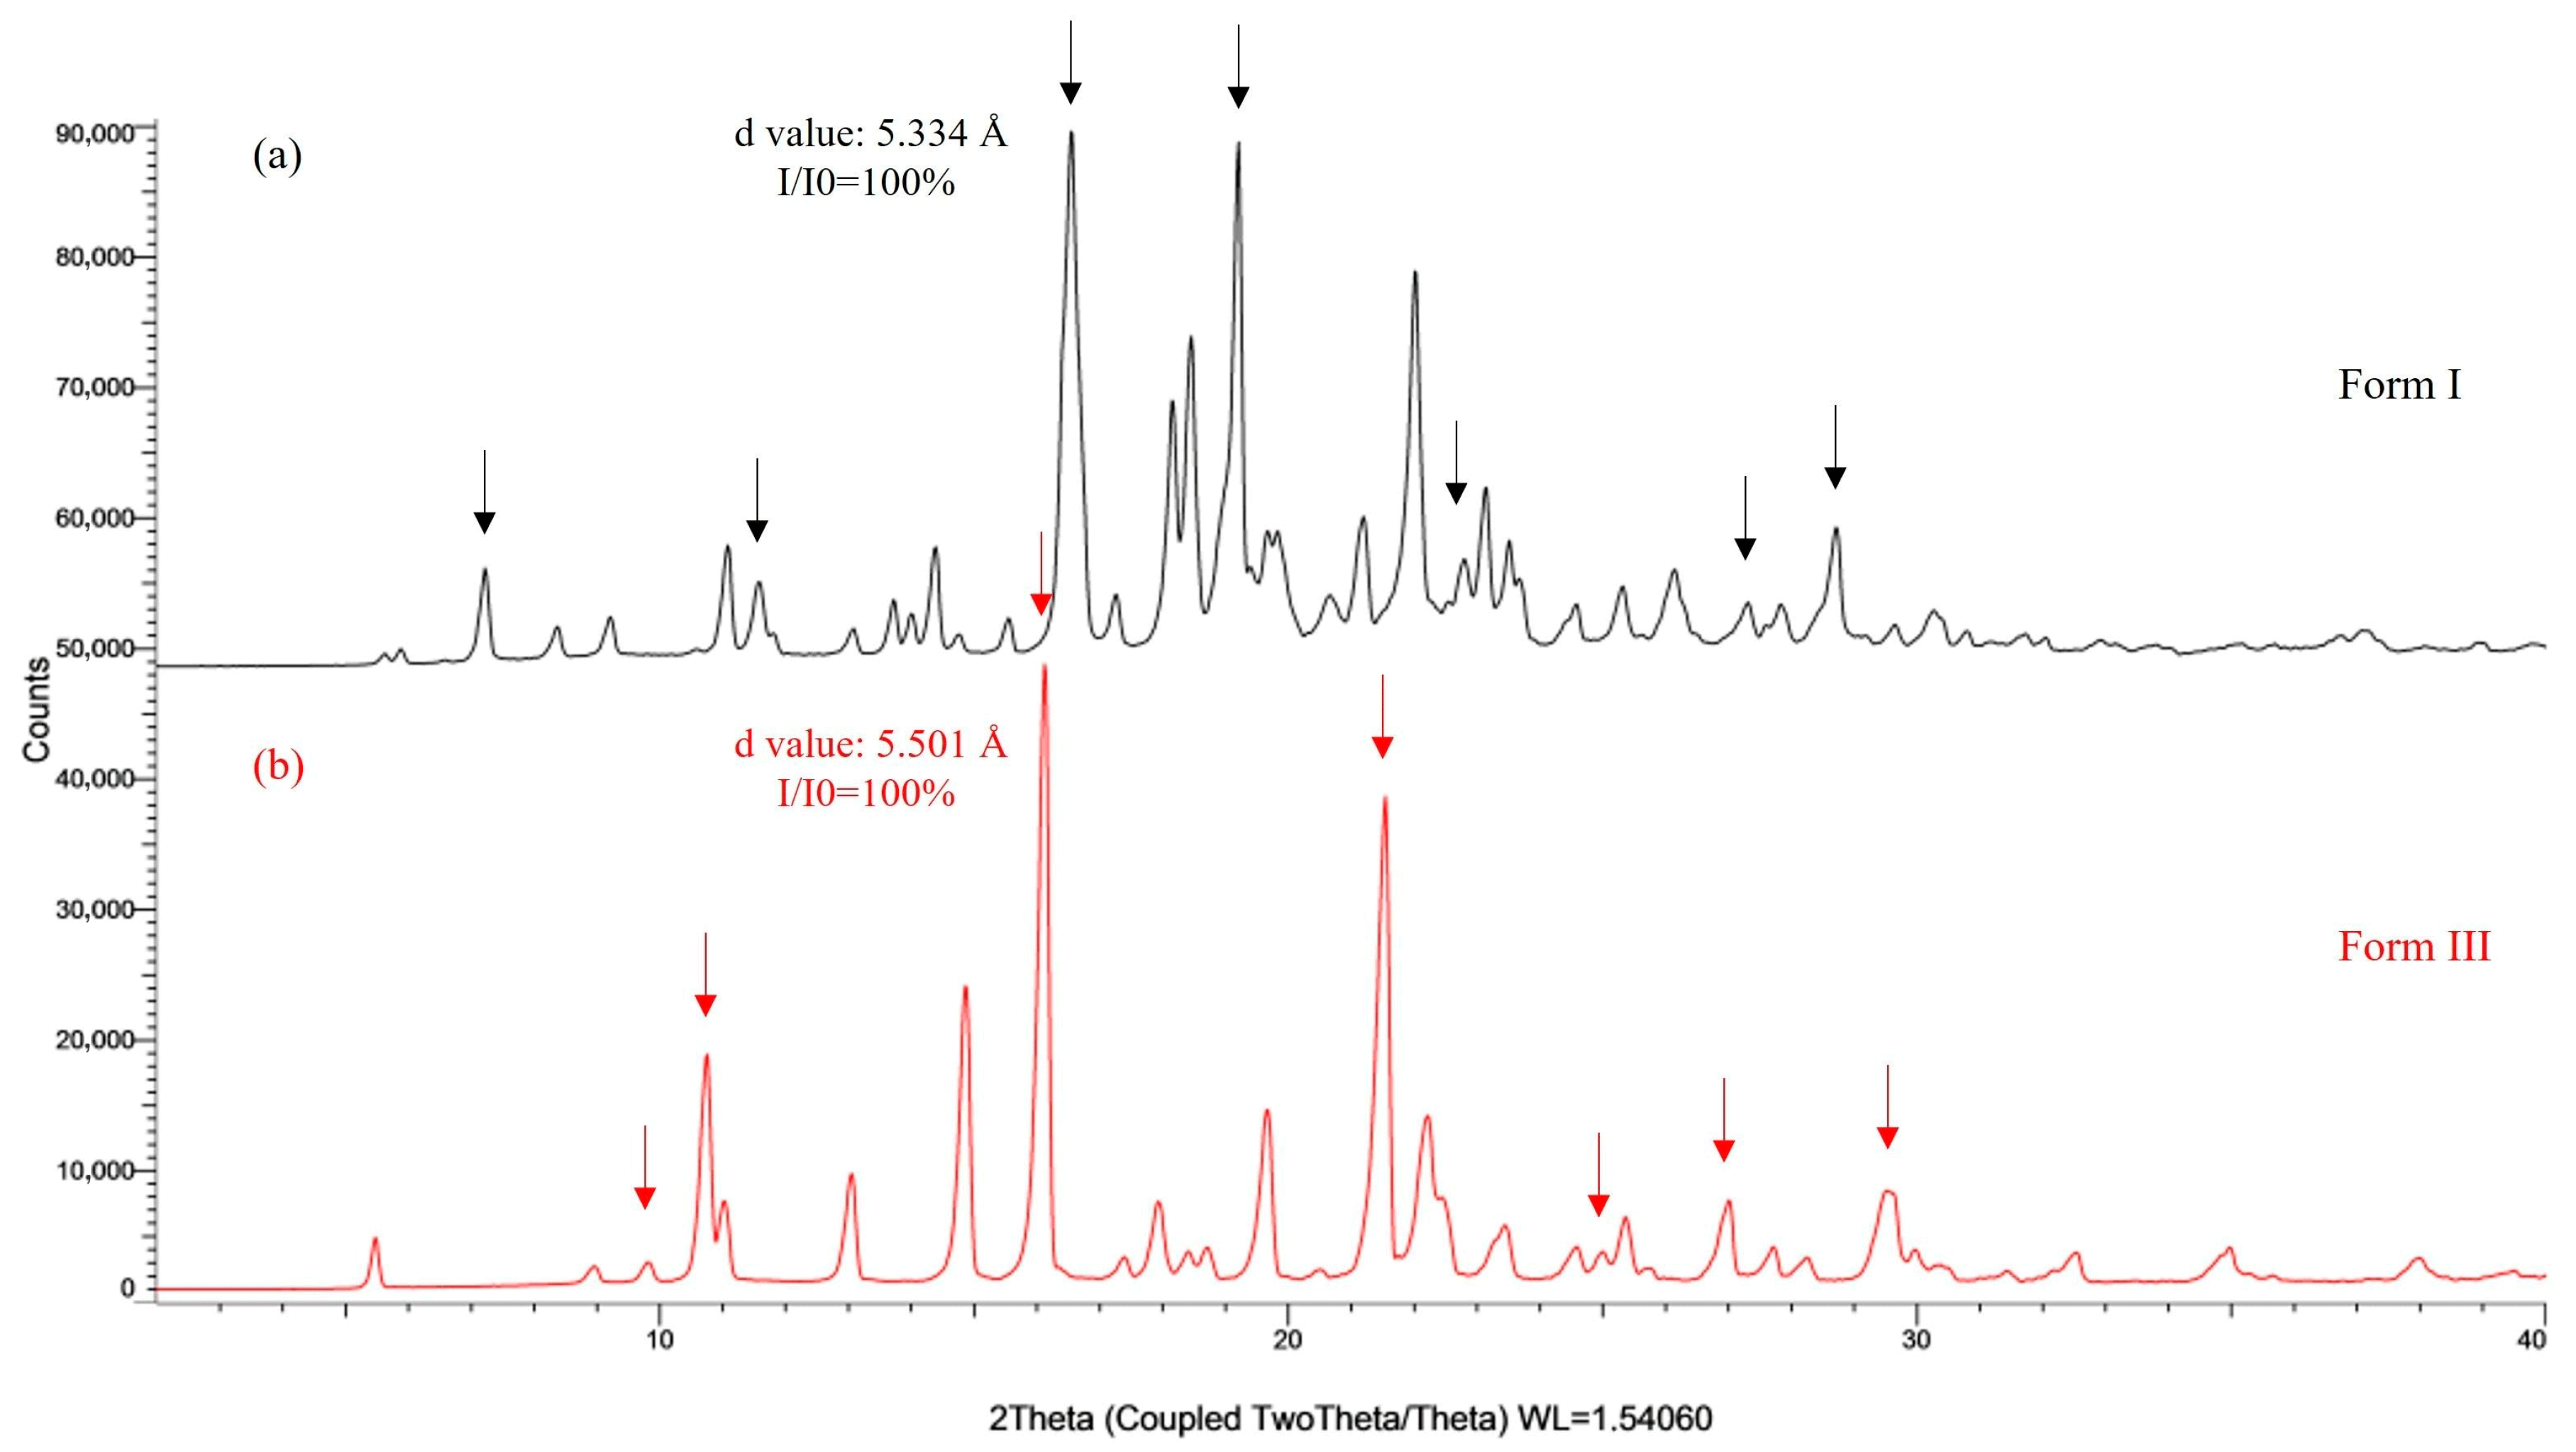
3.1. CEB Polymorphs Characterization

The morphological differences between celecoxib Form I and Form III significantly affect key properties like solubility, dissolution rate, and mechanical stability, impacting formulation processes and drug bioavailability. Controlling the appropriate polymorphic form is crucial to ensure consistent therapeutic performance, optimize product stability, and meet regulatory requirements. Polymorphic qualitative analysis was conducted using hot stage microscopy, PXRD, DSC, and FTIR. Under a polarizing light microscope, the two forms of CEB displayed distinct morphologies. As illustrated in Figure 2, form I exhibited a fiber-bundle like morphology, while Form III presented needle-shaped morphology.
Figure 3 presents the overlay of DSC curves of CEB Forms I and III, respectively. The DSC curve of CEB Form I, as given in Figure 3, displays single endothermic peak with a melting onset at 164.5 °C, indicating absence of any phase transition event. This implies to the better formulation stability of CEB Form I as there is no polymorphic conversion due to thermal triggers. In contrast to CEB Form I, the DSC curve of CEB Form III, as given in Figure 3, exhibits a melting endothermic peak with an onset at 161.6 °C. The higher melting point of Form I signifies the thermal stability during formulation and shelf life.
The FTIR spectra, as given in Figure 4, exhibits the key region of 1370–1335 cm⁻1, corresponding to the S=O stretch of the sulfonamide group. CEB, being a sulfonamide compound, presents difference in the orientation of sulfonamide group with respect to the benzene ring in its both polymorphic forms Making it a reliable marker to identify and distinguish polymorphs I and III of CEB. For form I, absorptions occur at 1341 and 1353 cm⁻1, whereas form III shows a peak at 1346 cm⁻1. These findings are consistent with the previously reported literature [13,14,15].
Figure 5 presents the PXRD pattern of CEB form I and III, respectively (Figure 5a,b), highlighting several unique peaks that do not show any overlapping and therefore can be considered for characterization and quantification. PXRD of the CEB Form I exhibits unique responses at 2θ values of 7.2°, 11.5°, 16.6°, 19.1°, 22.7°, 27.2°, and 28.6°. In contrast, Form III presents indicative responses at 2θ values of 9.8°, 10.7°, 16.1°, 21.5°, 24.9°, 26.9°, and 29.5°. These powder diffraction patterns are consistent with the previously reported literature on polymorphs I and III [13,14,15]. Reported documents have indicated that the tallest peak (I/I0 = 100%) is employed for estimating the polymorphic purity of the mixtures. Therefore, for quantitative analysis, the sharp peaks with a d-spacing of 5.334 Å at 2θ = 16.6° for Form I, and a d-spacing of 5.501 Å at 2θ = 16.1° for Form III, are selected.

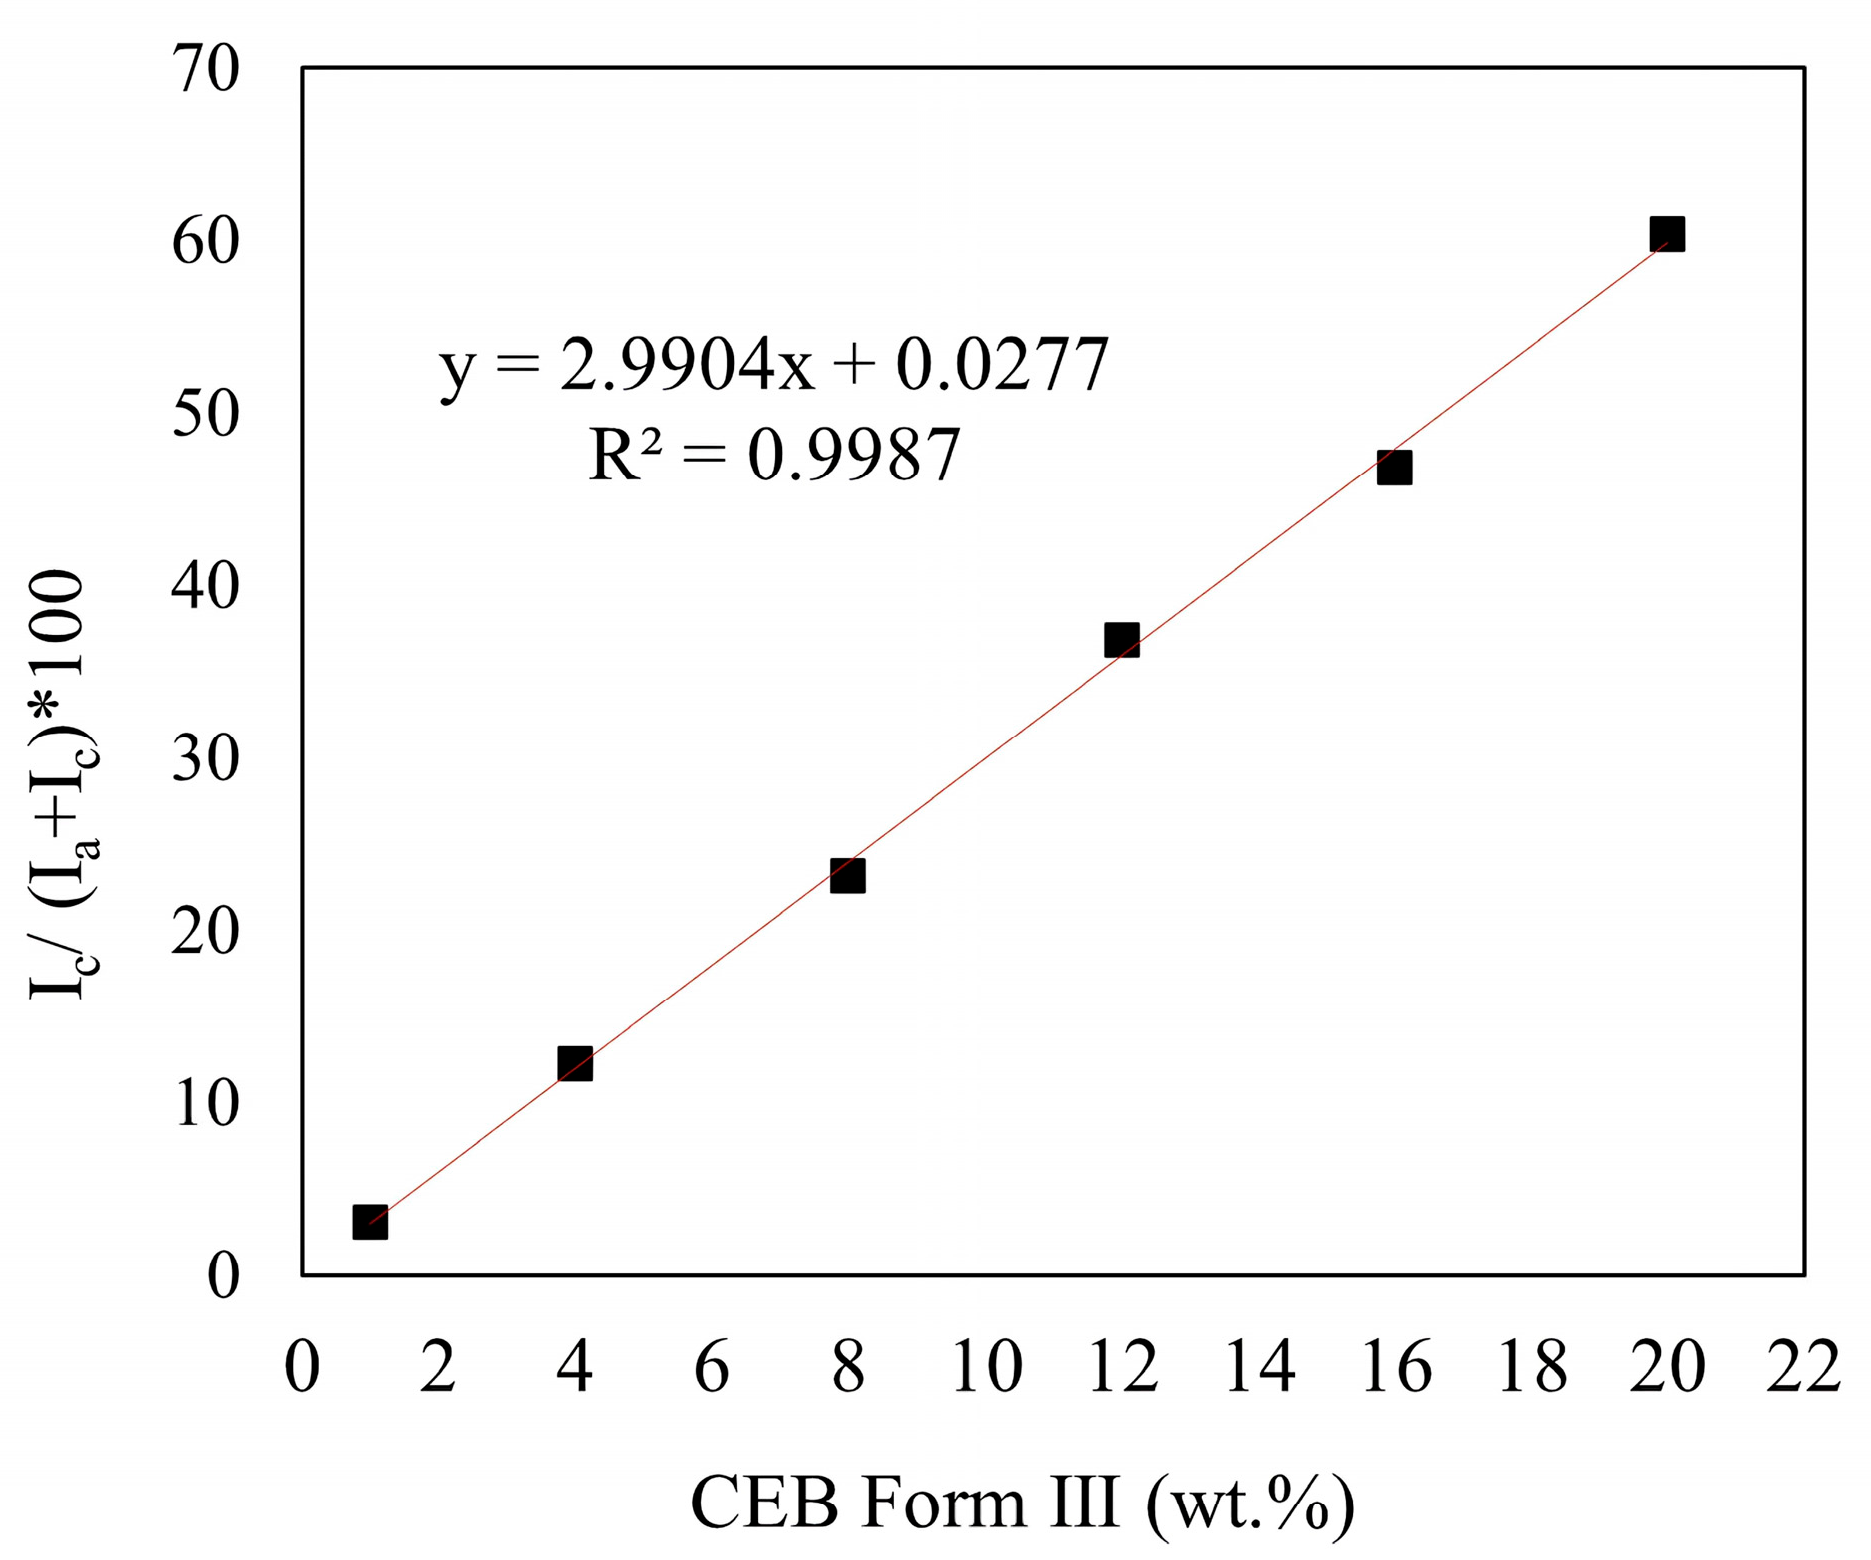
3.2. Calibration Curve Construction

To construct a calibration curve, considering the possible ranges of impurities in the CEB, weight percentages ranging from 1% to 20% were chosen. For phase quantification, standard mixture samples were prepared with varying amounts (1, 4, 8, 12, 16, and 20 wt.%) of CEB Form III (Table 1). The PXRD patterns of these standard mixture samples are illustrated in Figure 6. The intensity of the CEB Form III characteristic peak at 2θ = 16.1° increases progressively with the quantity of Form III in the mixture.
Quantitative determination relies on the assumption that the phase amount correlates with the integrated area of its highest intensity peak. While peak intensity and area are both commonly considered for quantitative analysis, reported studies indicated the peak intensity shows more variability with changes compared to peak area, which is more consistent [23,25,34,36]. Thus, in this study, peak area was utilized for analysis. To obtain the peak areas, peak identification and integration were performed using the software DIFFRAC.EVA.
In the mixture of CEB Forms I and III, the amount of Form III can be expressed as:
Ic/(Ia + Ic) = Kwc
where
Ic = The area of the highest intensity peak of CEB Form III
wc = Weight% of the Form III present in the mixture
K = Constant which can be determined by using the calibration curve.
Figure 7 exhibits the correlation between intensity percentage of CEB Form III [Ic/(Ia + Ic)] and the weight percentage of CEB Form III [wc] present in the standard mixture samples.
A near-perfect linearity (R2 = 0.9987) was observed between the weight percentage and intensity fraction of CEB Form III in the mixtures, aligning well to the theoretical expectations. The calibration curve exhibits minimal standard deviation, affirming PXRD as a highly reliable method for quantifying low levels of polymorphic impurities, specifically Form III, in mixtures of CEB polymorphs, Form I and Form III.

3.3. Analytical Method Validation

Before any method of analysis can be deemed suitable for quantification, it must undergo validation to align better with the established validation guidelines such as ICH Q2(R1) [45]. Along with a near-perfect linearity (R2 = 0.9987) as discussed in Section 3.2, the method demonstrated accuracy, with average recovery ranging from 98.0% to 101.5% (Table 2), and precision, with % RSD values ranging from 1.0% to 3.0% (Table 3) falling within the acceptance criteria of bias of ≤2% and ±5%, respectively.
Typically, the detection limit varies significantly among different APIs. Through experimentation, the developed analytical method was observed to be linear within the concentration range of 1–20%, as calculated LOD (0.344) and LOQ (1.043) are reliably and visually detected, indicating sufficient sensitivity of the method. Despite the high accuracy demonstrated during validation, potential assay errors may arise from factors such as sample packing variability, intraday and interday variations.

3.4. Method Robustness: Assay Error Estimation

The data for evaluating assay error is presented in Table 4. The area ratios of peaks showed results within 5.0%, indicating consistent performance and meeting the industry standards. Instrument repeatability, observed at approximately 2.82%, reflects the precision of consecutive measurements of the same sample without disturbance, highlighting the method’s robustness. Intraday variation was found to be 2.5%, demonstrating the method’s stability within a single day. Interday variation, measured at 5.01%, indicates the method’s performance over multiple days. These error metrics are crucial for assessing the method’s robustness and overall performance, as they provide insights into the reliability and consistency of the assay under different conditions.
Clearly, parameters measuring instrument response without sample disturbance yielded relatively low RSD values (approximately 0.3%), indicating the method’s suitability. However, day-to-day errors, where samples were removed daily from the instrument, showed slightly larger RSD values. This could be attributed to variability arising from sample repositioning and disturbance during reanalysis. The single sample was repacked six times and the powder X-ray diffraction patterns were recorded after each preparation to assess variation due to crystal orientation. The variation observed from repacking the sample was 3.71%. Among the possible errors explored in the study, controlling these parameters seems crucial to ensure the accuracy of the generated data. Thus, maintaining uniformity in sample powders and ensuring measurements are conducted without disturbance throughout the experimental process are essential. To minimize assay errors during routine analysis, automation in sample packing and controlled sample cell positioning are recommended. Additionally, adjustments in sample preparation, such as consistent packing techniques and careful handling, can enhance reproducibility. Implementing these measures will improve the robustness and reliability of the assay in future studies and routine applications.
The summary of validation parameters is listed in Table 5.

4. Conclusions

The developed PXRD quantification method effectively quantifies CEB Form III within crystalline Form I and Form III polymorphic mixtures, demonstrating its practical significance in quality control. Prior to analytical method development, pure polymorphic forms were characterized using DSC, FTIR, and PXRD, supporting the development of the analytical method. An optimization of the preparation method for standard mixture samples and instrument parameters was performed. With a runtime of 30 min, the method allows for the rapid determination of CEB polymorphic mixtures. Validation results demonstrate high accuracy (average recovery 98.0–101.5%), precision (% RSD 0.1–0.3), and sensitivity (LOD 0.344). The method exhibits a good linear range (1–20 wt.%) for quantification. Despite potential assay errors introduced by instrument performance, sample packing, and intra- and interday variations, the calibrated PXRD method reliably determines polymorphic impurity of CEB Form III within the 1–20 wt.% range. These validation outcomes align with regulatory acceptability and industry standards, such as ICH guidelines, reinforcing the method’s suitability for quality control. This method facilitates the quantification of CEB Form III in bulk drug samples containing polymorphic mixtures. Though future studies should investigate the applicability of the method for formulation samples containing excipients, whose signals will likely overlap with the maximum intensity PXRD peaks from CEB Form I and Form III, PXRD proves to be a promising approach for CEB polymorph analysis in industrial production. In such cases, the suitability of any other non-overlapping peaks for quantification should be assessed.

Author Contributions

A.G.D.: Conceptualization, Formal analysis, Investigation, Methodology, Software, Writing—original draft; K.J.D.: Data curation, Project administration, Supervision, Visualization, Writing—review and editing. All authors have read and agreed to the published version of the manuscript.

Funding

This research received no external funding.

Institutional Review Board Statement

Not applicable.

Informed Consent Statement

Not applicable.

Data Availability Statement

The raw data supporting the conclusions of this article will be made available by the authors upon request.

Conflicts of Interest

The authors have stated that there is no conflict of interest.

References

  1. Alleso, M.; van den Berg, F.; Cornett, C.; Jorgensen, F.S.; Halling-Sorensen, B.; de Diego, H.L.; Hovgaard, L.; Aaltonen, J.; Rantanen, J. Solvent diversity in polymorph screening. J. Pharm. Sci. 2008, 97, 2145–2159. [Google Scholar] [CrossRef] [PubMed]
  2. Vippagunta, S.R.; Brittain, H.G.; Grant, D.J.W. Crystalline solids. Adv. Drug Deliv. Rev. 2001, 48, 3–26. [Google Scholar] [CrossRef] [PubMed]
  3. Haleblian, J.; McCrone, W. Pharmaceutical applications of polymorphism. J. Pharm. Sci. 1969, 58, 911–929. [Google Scholar] [CrossRef] [PubMed]
  4. Burger, A.; Ramberger, R. On the Polymorphism of Pharmaceuticals and Other Molecular Crystals. I. Mikrochim. Acta 1979, 72, 259–271. [Google Scholar] [CrossRef]
  5. Burger, A.; Ramberger, R. On the Polymorphism of Pharmaceuticals and Other Molecular Crystals. II. Mikrochim. Acta 1979, 72, 273–316. [Google Scholar] [CrossRef]
  6. Bond, A.D. Polymorphism in molecular crystals. Curr. Opin. Solid State Mater. Sci. 2009, 13, 91–97. [Google Scholar] [CrossRef]
  7. Petruševski, G.; Zbačnik, M.; Kajdžanoska, M.; Ugarkovic, S.; Trimčeski, V.; Kaitner, B.; Jovanovski, G.; Makreski, P. Pholcodine monohydrate: Crystal structure and polymorphism. J. Cryst. Growth 2013, 375, 119–124. [Google Scholar] [CrossRef]
  8. Láng, P.; Kiss, V.; Ambrus, R.; Farkas, G.; Szabó-Révész, P.; Aigner, Z.; Várkonyi, E. Polymorph screening of an active material. J. Pharm. Biomed. Anal. 2013, 84, 177–183. [Google Scholar] [CrossRef]
  9. U.S. Food and Drug Administration. Q6A Specifications: Test Procedures and Acceptance Criteria for New Drug Substances and New Drug Products: Chemical Substances. Fed. Register. 2000, 65, 83041–83063. [Google Scholar]
  10. Gika, H.; Theodoridou, A.; Michopoulos, F.; Theodoridis, G.; Diza, E.; Settas, L.; Nikolaidis, P.; Smith, C.; Wilson, I. Determination of two COX-2 inhibitors in serum and synovial fluid of patients with inflammatory arthritis by ultra performance liquid chromatography–inductively coupled plasma mass spectroscopy and quadrupole time-of-flight mass spectrometry. J. Pharm. Biomed. Anal. 2009, 49, 579–586. [Google Scholar] [CrossRef]
  11. Puljak, L.; Marin, A.; Vrdoljak, D.; Markotic, F.; Utrobicic, A.; Tugwell, P. Celecoxib for osteoarthritis. Cochrane Database Syst. Rev. 2017, 5, 1465–1858. [Google Scholar] [CrossRef] [PubMed]
  12. Clemett, D.; Goa, K.L. Celecoxib: A review of its use in osteoarthritis, rheumatoid arthritis and acute pain. Drugs 2000, 59, 957–980. [Google Scholar] [CrossRef] [PubMed]
  13. Jin, R.; Sohn, Y. Crystal form of celecoxib: Preparation, characterization and dissolution. J. Korean Chem. Soc. 2018, 62, 352–357. [Google Scholar]
  14. Ferro, L.; Miyake, P. Polymorphic Crystalline Forms of Celecoxib. US7476744B2, 13 January 2009. [Google Scholar]
  15. Wang, K.; Sun, C. Crystal Growth of Celecoxib from Amorphous State: Polymorphism, Growth Mechanism, and Kinetics. Cryst. Growth Des. 2019, 19, 3592–3600. [Google Scholar] [CrossRef]
  16. Ou, X.; Li, X.; Rong, H.; Yu, L.; Lu, M. A general method for cultivating single crystals from melt microdroplets. Chem. Commun. 2020, 56, 9950–9953. [Google Scholar] [CrossRef]
  17. Zhang, S.; Brunskill, A.; Schwartz, E.; Sun, S. Celecoxib–Nicotinamide Cocrystal Revisited: Can Entropy Control Cocrystal Formation. Growth Des. 2017, 17, 2836–2843. [Google Scholar] [CrossRef]
  18. Almansa, C.; Mercè, R.; Tesson, N.; Farran, J.; Tomàs, J.; Plata-Salamán, C. Co-crystal of Tramadol Hydrochloride–Celecoxib (ctc): A Novel API–API Co-crystal for the Treatment of Pain. Cryst. Growth Des. 2017, 4, 1884–1892. [Google Scholar] [CrossRef]
  19. Wang, K.; Wang, C.; Sun, C. Structural Insights into the Distinct Solid-State Properties and Interconversion of Celecoxib N-Methyl-2-pyrrolidone Solvates. Cryst. Growth Des. 2021, 1, 277–286. [Google Scholar] [CrossRef]
  20. Bonda, A.; Sun, C. Intermolecular interactions and disorder in six isostructural celecoxib solvates. Acta Cryst. 2020, 76, 632–638. [Google Scholar] [CrossRef]
  21. Remenar, J.; Tawa, M.; Peterson, M.; Almarsson, O.; Hickeya, M.; Foxmanc, B. Celecoxib sodium salt: Engineering crystal forms for performance. CrystEngComm 2011, 13, 1081–1089. [Google Scholar] [CrossRef]
  22. Wellen, R.; Rabello, M.; Araujo, I.; Fechine, G.; Canedo, E. Melting and crystallization of poly(3-hydroxybutyrate): Effect of heating/cooling rates on phase transformation. Polímeros 2015, 25, 296–304. [Google Scholar] [CrossRef]
  23. Li, Y.; Chow, P.S.; Tan, R.B. Quantification of polymorphic impurity in an enantiotropic polymorph system using differential scanning calorimetry, X-ray powder diffraction and Raman spectroscopy. Int. J. Pharm. 2011, 415, 110–118. [Google Scholar] [CrossRef] [PubMed]
  24. Uvarov, V.; Popov, I. Development and metrological characterization of quantitative X-ray diffraction phase analysis for the mixtures of clopidogrel bisulphate polymorphs. J. Pharm. Biomed. Anal. 2008, 46, 676–682. [Google Scholar] [CrossRef] [PubMed]
  25. Soares, F.L.; Carneiro, R.L. Evaluation of analytical tools and multivariate methods for quantification of co-former crystals in ibuprofen-nicotinamide co-crystals. J. Pharm. Biomed. Anal. 2014, 89, 166–175. [Google Scholar] [CrossRef]
  26. Chieng, N.; Rehder, S.; Saville, D.; Rades, T.; Aaltonen, J. Quantitative solid-state analysis of three solid forms of ranitidine hydrochloride in ternary mixtures using Raman spectroscopy and X-ray powder diffraction. J. Pharm. Biomed. Anal. 2009, 49, 18–25. [Google Scholar] [CrossRef]
  27. Vickery, R.D.; Nemeth, G.A.; Maurin, M.B. Solid-state carbon NMR characterization of the polymorphs of roxifiban. J. Pharm. Biomed. Anal. 2002, 30, 125–129. [Google Scholar] [CrossRef]
  28. Szeleszczuk, Ł.; Jurczak, E.; Zielińska-Pisklak, M.; Harwacki, J.; Pisklak, D.M. Comparison of the analytical methods (solid state NMR, FT-IR, PXRD) in the analysis of the solid drug forms with low concentration of an active ingredient-17-β-estradiol case. J. Pharm. Biomed. Anal. 2018, 149, 160–165. [Google Scholar] [CrossRef]
  29. Ibáñez, J.; Font, O.; Moreno, N.; Elvira, J.J.; Alvarez, S.; Querol, X. Quantitative Rietveld analysis of the crystalline and amorphous phases in coal. Fuel 2013, 105, 314–317. [Google Scholar] [CrossRef]
  30. Hestnes, K.H.; Sørensen, B.E. Evaluation of quantitative X-ray diffraction for possible use in the quality control of granitic pegmatite in mineral production. Miner. Eng. 2012, 39, 239–247. [Google Scholar] [CrossRef]
  31. Alexander, L.; Klug, H.P. Basic aspects of X-ray absorption in quantitative diffraction analysis of powder mixtures. Anal. Chem. 1948, 20, 886–889. [Google Scholar] [CrossRef]
  32. Szeleszczuk, Ł.; Pisklak, D.M.; Zielińska-Pisklak, M.; Jurczak, E. A new polymorph of 17-β-estradiol and the application of different analytical techniques (ssNMR, PXRD, DSC, and FTIR) for its study. J. Mol. Struct. 2019, 1183, 274–280. [Google Scholar] [CrossRef]
  33. Chen, X.; Stowell, J.G.; Morris, K.R.; Byrn, S.R. Quantitative study of solid-state acid-base reactions between polymorphs of flufenamic acid and magnesium oxide using X-ray powder diffraction. J. Pharm. Biomed. Anal. 2010, 51, 866–874. [Google Scholar] [CrossRef] [PubMed]
  34. Tiwari, M.; Chawla, G.; Bansal, A.K. Quantification of olanzapine polymorphs using powder X-ray diffraction technique. J. Pharm. Biomed. Anal. 2007, 43, 865–872. [Google Scholar] [CrossRef]
  35. Bugay, D.E. Characterization of the solid-state spectroscopic techniques. Adv. Drug Deliv. Rev. 2001, 48, 43–65. [Google Scholar] [CrossRef]
  36. Clas, S.-D.; Faizer, R.; O’Connor, R.E.; Vadas, E.B. Quantification of crystallinity in blends of lyophilized and crystalline MK-0591 using x-ray powder diffraction. Int. J. Pharm. Res. 1995, 121, 73–79. [Google Scholar] [CrossRef]
  37. Chao, R.S.; Vail, K.C. Polymorphism of 1,2-dihydro-6-neopentyl-2-oxonicotinic acid: Characterization, interconversion, and quantitation. Pharm. Res. 1987, 4, 429–432. [Google Scholar] [CrossRef]
  38. Padrela, L.; de Azevedo, E.G.; Velaga, S.P. Powder X-ray diffraction method for the quantification of cocrystals in the crystallization mixture. Drug Dev Ind Pharm. 2011, 38, 923–929. [Google Scholar] [CrossRef]
  39. Maddileti, D.; Jayabun, S.K.; Nangia, A. Soluble Cocrystals of the Xanthine Oxidase Inhibitor Febuxostat. Cryst. Growth Des. 2013, 13, 3188–3196. [Google Scholar] [CrossRef]
  40. Zhu, X.; Wang, Y.; Du, T. 2-[3-Cyano-4-(2-methylpropoxy)phenyl]-4-methylthiazole-5-carboxylic acid pyridine solvate. Acta Cryst. 2009, 65, o2603. [Google Scholar] [CrossRef]
  41. Jiang, Q.Y.; Qian, J.J.; Gu, J.M.; Tang, G.P.; Hu, X.R. Febuxostat methanol solvate. Acta Cryst. 2011, 67, 1232. [Google Scholar] [CrossRef]
  42. Takehira, R.; Momose, Y.; Yamamura, S. Quantitative analysis of crystalline pharmaceuticals in tablets by patternfitting procedure using X-ray diffraction pattern. Int. J. Pharm. 2010, 398, 33–38. [Google Scholar] [CrossRef] [PubMed]
  43. Roberts, S.N.C.; Williams, A.C.; Grimsey, I.M.; Booth, S.W. Quantitative analysis of mannitol polymorphs. X-ray powder diffractometry-Exploring preferred orientation effects. J. Pharm. Biomed. Anal. 2002, 28, 1149–1159. [Google Scholar] [CrossRef]
  44. Hurst, V.J.; Schroeder, P.A.; Styron, R.W. Accurate quantification of quartz and other phases by powder X-ray diffractometry. Anal. Chim. Acta 1997, 337, 233–252. [Google Scholar] [CrossRef]
  45. Validation of Analytical Procedures: Text and methodology Q2(r1), ICH Harmonised Tripartite Guideline, 4th ed.; International Council for Harmonisation of Technical Requirements for Pharmaceuticals for Human Use: Geneva, Switzerland, 2005; pp. 6–13. Available online: https://database.ich.org/sites/default/files/Q2%28R1%29%20Guideline.pdf (accessed on 1 December 2024).
Figure 1. Chemical structure of celecoxib (CEB).
Jpbi 02 00004 g001
Figure 2. Micrographs of CEB Form I (a) and Form III (b). Images were extracted from the video recorded during the hot-stage microscopy experiment.
Jpbi 02 00004 g002
Figure 3. Overlay of DSC curves of CEB Form I and Form III.
Jpbi 02 00004 g003
Figure 4. FTIR spectra of CEB Form I (a) and Form III (b).
Jpbi 02 00004 g004
Figure 5. PXRD patterns of CEB form I (a) and III (b).
Jpbi 02 00004 g005
Figure 6. X-ray diffraction patterns of the six standard mixture samples.
Jpbi 02 00004 g006
Figure 7. Calibration curve for determination of CEB polymorphic form III in form I by PXRD.
Jpbi 02 00004 g007
Table 1. The standard mixture samples prepared by mixing the pure CEB Form I and Form III powders.
SamplesComposition
2%2 wt.% Form III + 98 wt.% Form I
4%4 wt.% Form III + 96 wt.% Form I
8%8 wt.% Form III + 92 wt.% Form I
12%12 wt.% Form III + 88 wt.% Form I
16%16 wt.% Form III + 84 wt.% Form I
20%20 wt.% Form III + 80 wt.% Form I
Table 2. Method accuracy studies of PXRD method.
Actual Concentration (%)Predicted Concentration (%)Average Recovery (%)
3.003.03101.10
6.006.04100.66
10.009.8598.5
14.0013.9799.8
Table 3. Precision of PXRD method.
Concentration (%)Mean Area Ratio ± SD (%)% RSD
823.09 ± 0.32.14
1236.60 ± 0.71.70
1648.14 ± 1.12.59
Table 4. Results of Method robustness: assay error evaluation.
ParameterMean Area Ratio ± SD (%)% RSD
Instrument repeatability3.05 ± 0.12.82
Intra-day repeatability3.26 ± 0.22.35
Inter-day repeatability3.40 ± 0.25.01
Sample repeatability3.46 ± 0.23.71
Table 5. Summary of validation parameters.
Validation ParametersValidation Data
Average recovery (Method Acuuracy) (%)98.0–101.5%
Precision (% RSD)1.0–3.0%
LOD (%)0.344
LOQ (%)1.043
Instrument repeatability (% RSD)2.82
Intra-day repeatability (% RSD)2.35
Inter-day repeatability (% RSD)5.01
Sample packing (% RSD)3.71
Disclaimer/Publisher’s Note: The statements, opinions and data contained in all publications are solely those of the individual author(s) and contributor(s) and not of MDPI and/or the editor(s). MDPI and/or the editor(s) disclaim responsibility for any injury to people or property resulting from any ideas, methods, instructions or products referred to in the content.

