Article

Effect of Ethanol on the Solubility and Apparent Specific Volume of Sodium Sulfadiazine in Aqueous Mixtures

by
Daniel R. Delgado
1,
Fleming Martinez
2,*,
María Ángeles Peña
3,
Abolghasem Jouyban
4 and
William E. Acree, Jr.
5
1
Programa de Ingeniería Industrial, Facultad de Ingeniería, Universidad Cooperativa de Colombia, Neiva 410001, Colombia
2
Grupo de Investigaciones Farmacéutico-Fisicoquímicas, Departamento de Farmacia, Facultad de Ciencias, Universidad Nacional de Colombia-Sede Bogotá, Cra. 30 No. 45-03, Bogotá 111321, Colombia
3
Departamento de Ciencias Biomédicas, Facultad de Farmacia, Universidad de Alcalá, Alcalá de Henares, 28805 Madrid, Spain
4
Pharmaceutical Analysis Research Center and Faculty of Pharmacy, Tabriz University of Medical Sciences, Tabriz 5166/15731, Iran
5
Department of Chemistry, University of North Texas, Denton, TX 76203-5070, USA
*
Author to whom correspondence should be addressed.
J. Pharm. BioTech Ind. 2025, 2(2), 5; https://doi.org/10.3390/jpbi2020005
Submission received: 26 February 2025 / Revised: 21 March 2025 / Accepted: 24 March 2025 / Published: 31 March 2025

Abstract

:
The main objective of this research was to correlate the equilibrium solubility of sodium sulfadiazine in several {ethanol (EtOH, 1) + water (2)} mixtures reported in mass/volume and mass/mass percentages at different temperatures. Aqueous solubility of sodium sulfadiazine decreases almost linearly with decreasing temperature, but it decreases non-linearly with the addition of EtOH to water. Logarithmic solubility was adequately correlated with a bivariate model involving temperature and mixture composition. These solubility results were also well correlated with the Jouyban–Acree-based models. Moreover, an adapted version of the Jouyban–Acree model was used to represent the density of the saturated solvent mixtures at different temperatures. Furthermore, the apparent specific volumes of this drug at saturation were also calculated from densities of saturated solutions and cosolvent mixtures free of drug as well as from the respective mixture compositions. These findings provide valuable insights into the solubility and volumetric behavior of sodium sulfadiazine, which could be useful for pharmaceutical formulation and process optimization.

1. Introduction

It is well-known that the exhaustive physicochemical characterization of drugs in dissolution plays a crucial role in all stages associated with the R&D of homogenous liquid pharmaceutical dosage forms, especially those intended for parenteral administration in small volumes like ampules, because these products supply high doses of active pharmaceutical ingredients [1,2,3,4].
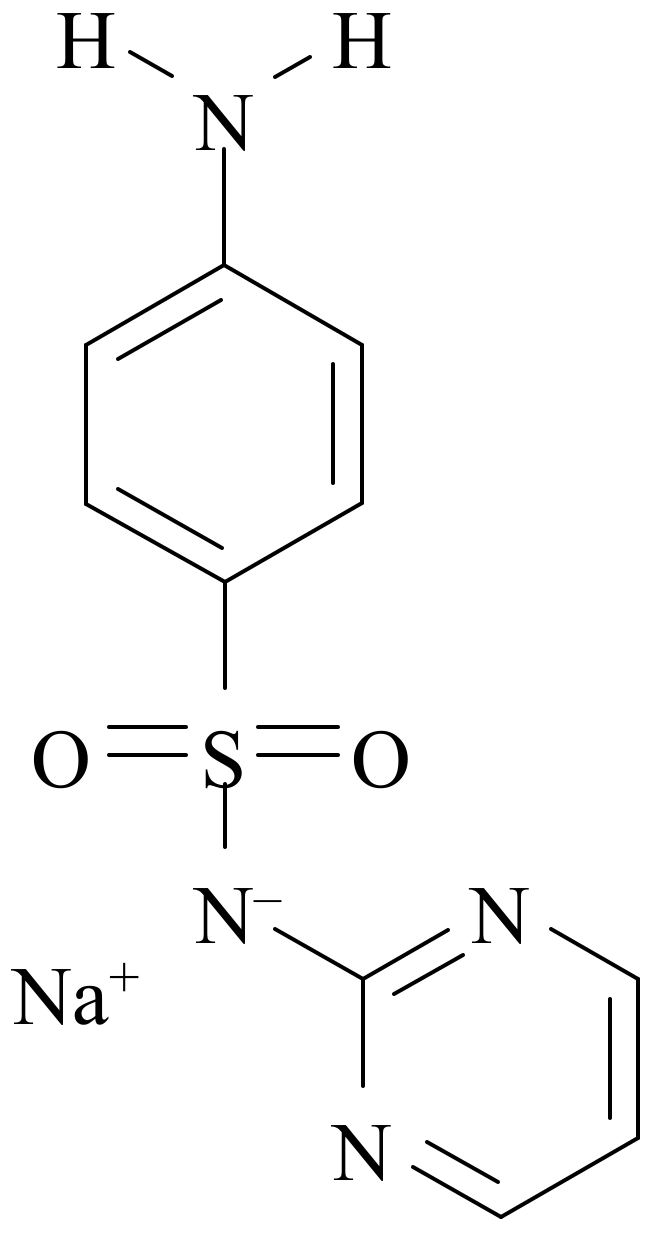
Sodium sulfadiazine (sodium [(4-aminophenyl)sulfonyl](2-pyrimidinyl)azanide, NaSD, Figure 1) is a drug extensively used for the treatment of certain infections caused by several kinds of microorganisms [5,6,7]. Although NaSD is widely used in therapeutics, its physicochemical information regarding its behavior in aqueous solutions is not yet complete. However, some physicochemical studies have been reported in the literature. Thus, the molar and mole fraction equilibrium solubility as well as the respective dissolution and mixing thermodynamic quantities in some ethanol–water blended solvents have been reported [8,9,10]. Moreover, its equilibrium solubility and apparent specific volumes at saturation in different {cosolvent (1) + water (2)} mixtures at 25.0 °C have also been reported, involving propylene glycol, formamide, N-methylformamide, N,N-dimethylformamide, dimethyl sulfoxide, N-methyl-2-pyrrolidone, 1,4-dioxane, and methanol [11,12]. On the other hand, apparent molar volumes at several drug concentrations have been determined at several temperatures in aqueous–cosolvent media [13,14]. Ultimately, the molar electrical conductivity of this saline drug has also been studied as a function of drug concentration as a function of temperature [15]. All these investigations have demonstrated the role of hydrophilic and hydrophobic hydration processes of this drug on the observed physicochemical magnitudes in aqueous media.
From a pharmaceutical viewpoint, the systematic searching, acquisition, and systematization of equilibrium solubility values and volumetric contributions of active pharmaceutical ingredients and excipients at saturation conditions in aqueous and non-aqueous cosolvent mixtures are very significant for theoretical and practical purposes. This is because cosolvent blends are frequently employed in pharmaceutical ingredient purification methods, dosage form preformulation studies, and the development and preparation of homogeneous liquid medicines, as already mentioned [16,17]. Therefore, it is almost mandatory for the global chemical and pharmaceutical community to systematically determine the solubility and specific volume contribution of every pharmaceutical agent.
Otherwise, the study of molar and specific volumes of every kind of pharmaceutical solute has been carried out basically with the aim of facilitating the design of liquid medicines on the one hand and also as an aid to proposing mechanisms for the transferring processes of drugs through biological membranes. Within the first group, studies have been carried out focused on the generation of useful information in the design of drug delivery systems, and as an example, the determination of partial specific volumes and critical micellar concentrations of surfactants from density measurements of their aqueous solutions [18]; in a similar way, these determinations facilitate the proposal of novel calculation methods of partial molar volumes of surfactants dispersed at the micellar level owing to the difficulty observed in determining experimentally this property under extreme conditions [19]. However, from density measurements, the apparent specific volumes of poly(ethylene oxide), poly(butylene oxide), poly(propylene oxide), and octadecyl chains in the micellar state as a function of temperature have been calculated and reported [20]. Moreover, Sarazin and Francois, analyzing various polymers in solvents of differing molecular size and polarity, confirmed the dependence of their apparent specific volume on polymer molecular weight and solvent molar volume [21]. Moreover, it is noteworthy that use of apparent specific volumes is relevant in chemical analysis varying from milk food science to blood biochemistry [22,23]. On the other hand, molar volumes are required to calculate Hildebrand solubility parameters as required for the estimation of the solubility of organic compounds [24,25]. Thus, partial molar volumes and solubility parameters of compounds of pharmaceutical interest such as some esters have been studied [26]. Specifically, regarding the penetration of biological membranes, the solubility and partial molar volume of the ophthalmological drug physostigmine in binary mixtures of isopropanol–isopropyl myristate have been studied as an aid in clarifying the effects of these solvents on the penetration of physostigmine through biological membranes [27].
The extended theory of regular solutions has been applied to explain and estimate the percutaneous absorption of different non-electrolytes or undissociated weak electrolytes by studying the solubility and partial molar volumes of these solutes in certain solvents, with the aim of finding application in the design of dermal controlled release systems. Some of these solutes correspond to certain alkanoic acids, theophylline, and adenosine, among others [28,29,30].
In the research field related to identifying action mechanisms of active ingredients, the effect of volumetric properties has also been studied, as shown in the case of volatile anesthetics such as halothane, which have been evaluated for compressibility, molar volume, and partial molar volume in different solvents [31,32]. More recently, the partial molar volumes of some local anesthetics like lidocaine in water and ethanol were evaluated experimentally, and from these values the corresponding transfer volumes were calculated, and the respective interpretation was made in terms of solute–solvent interactions highlighting the role of the hydrophobicity of the compounds on the binding to the cell membrane [33].
Other compounds of pharmaceutical interest studied include sodium salicylate, methyl orange, tryptophan, phenol and propranolol hydrochlorides, procaine, pilocarpene and ephedrine, whose volumes and apparent molal compressibilities have been determined as a contribution to the clarification of solute–solvent interactions in QSAR studies [34]. A similar investigation was performed with tetracycline hydrochloride and chlortetracycline involving determining the partial molal volumes and compressibilities, interaction coefficients, and several thermodynamic activation parameters from ultrasonic speed, density, and viscosity measurements [35]. Furthermore, the partial molal volumes at infinite dilution of different phenyl alkylamines have also been reported [36]. Moreover, the volumetric properties of several other compounds, including active ingredients and excipients, have also been studied [37,38,39,40,41]. Otherwise, apparent specific volumes have been correlated with primary tastes as well as with specific tastes like amino acids and sweetener agents [42,43,44,45,46,47,48].
In this way, the present research studied the mass/volume (% m/v) and mass/mass (% m/m) percentages, equilibrium solubility, and apparent specific volume ( φ V sp /mL/g) at saturation of NaSD (solute identified as component 3) in several aqueous–alcoholic binary mixtures at different temperatures from 5.0 to 35.0 °C. Thus, this research expands the available database of these properties reported earlier for other drugs and excipients in several binary and ternary aqueous–cosolvent mixtures that include some non-electrolyte organic compounds and active organic salts. These compounds and solvent systems include propranolol·HCl in aqueous binary mixtures of 1,4-dioxane, acetonitrile, polyethylene glycol 400, propylene glycol, and methanol at 25.0 °C [49]; sodium naproxen, procaine·HCl, and lysine clonixinate in (propylene glycol + water) [50] and (methanol + water) [51] mixtures at 25.0 °C; lidocaine·HCl·H2O in aqueous binary mixtures of polyethylene glycol 200, ethanol, and propylene glycol at 25.0 °C [52]; and sodium diclofenac in aqueous binary mixtures of formamide, N-methylformamide, and N,N,-dimethylformamide at 25.0 °C [53]. All these reported physicochemical values of pharmaceutical compounds could be used for improving research and development activities.
Thus, it is noteworthy that these basic physicochemical properties of solid compounds in aqueous solutions have been key factors long time ago in the design of liquid dosage forms like syrups, elixirs, and injectable solutions, as well as in predicting the biological behavior of drugs [54,55].

2. Methods

The equilibrium solubility values of NaSD (CAS number: 547-32-0, molecular formula: C10H9N4NaO2S, molar mass: 272.26 g/mol, provider: Sigma-Aldrich, Burlington, MA, USA, mass fraction purity > 0.99) in binary mixtures of ethanol (CAS number: 64-17-5, molecular formula: C2H6O, molar mass: 46.07 g/mol, provider: Merck, Darmstadt, Germany, mass fraction purity > 0.995) and water (CAS number: 7732-18-5, obtained by distillation, conductivity < 2 μS/cm) as a function of mixture composition and temperature were expressed in molarity and mole fraction earlier [10,11]. Thus, these solubility values were determined at seven temperatures from 5.0 to 35.0 °C in EtOH mass fractions (w1) from w1 = 0.10 to w1 = 0.90 varying by 0.10, studying nine binary mixtures and both pure solvents.
Classical shake-flask method and UV–vis spectrophotometry were employed for solubility determinations [56,57]. An excess of NaSD was added to 50 mL of each cosolvent mixture in stoppered dark glass flasks. Solid–liquid mixtures were stirred in a mechanical shaker (Burrel, Wrist Action Shaker, Model 75, Pittsburgh, PA, USA) at room temperature for at least four hours. After this, the flasks were kept at 35.0 ± 0.05 °C in recirculating thermostatic baths (Neslab RTE 10 Digital One, Thermo Electron Company, Waltham, MA, USA) with sporadic stirring at least for three days until equilibrium is obtained. After this time, the supernatant solutions were filtered (at isothermal conditions) using 0.45 μm pore diameter cartridges to ensure that they were free of particulate matter before sampling. NaSD concentrations at saturation were determined by measuring UV absorbance after appropriate gravimetric dilution with pure water and interpolation from a UV spectrophotometric calibration curve (UV/Vis BioMate 3 spectrophotometer, Thermo Electron Company, Waltham, MA, USA). Then, the temperature was diminished in successive steps of 5.0 °C following the same procedures indicated above to reach 5.0 °C as the lowest research temperature. All the solubility experiments were run at least in triplicate.
Moreover, in order to facilitate the transformation between volumetric and gravimetric concentration scales [2,58] and allow the calculation of apparent specific volumes of NaSD, the density of the saturated solutions at every temperature was determined with a digital density meter (DMA 45 Anton Paar, Graz, Austria) connected to a recirculating thermostatic bath (Neslab RTE 10 Digital One Thermo Electron Company, Waltham, MA, USA). All calculations, correlations, and plots were performed with different tools of MS Excel® v. 2013.

3. Results and Discussion

3.1. Experimental Solubility at Different Temperatures and Mixture Compositions

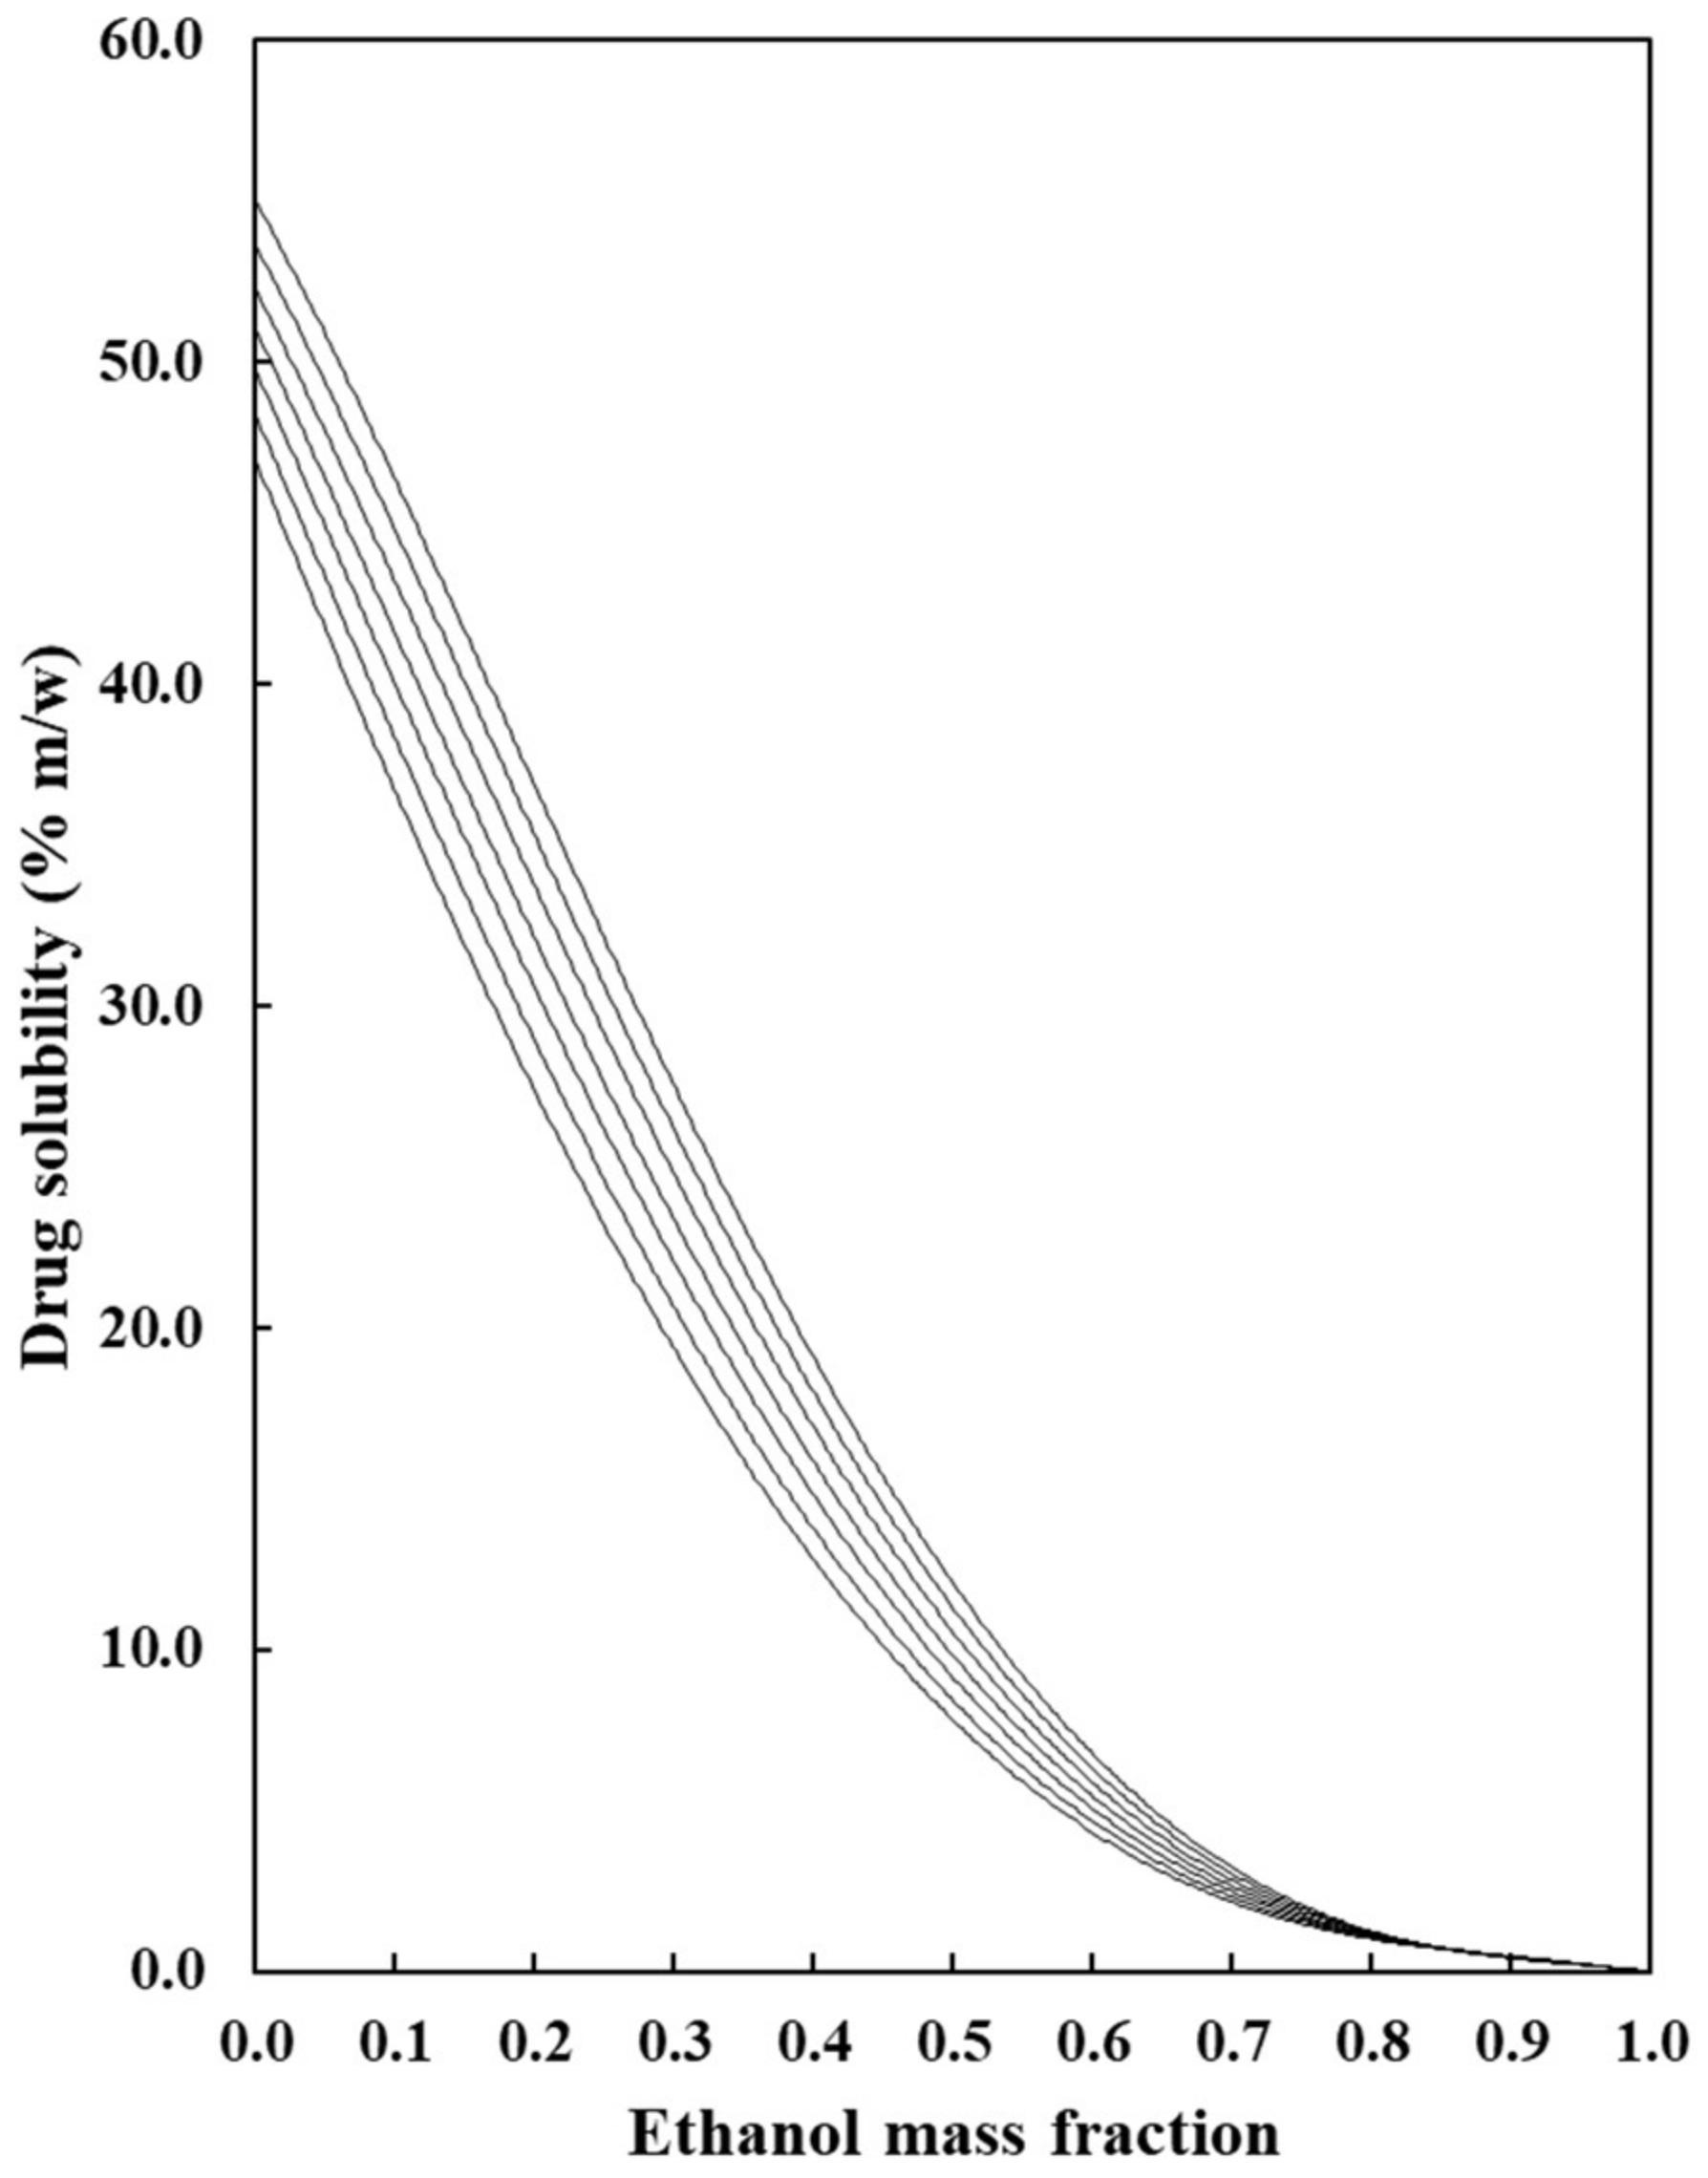
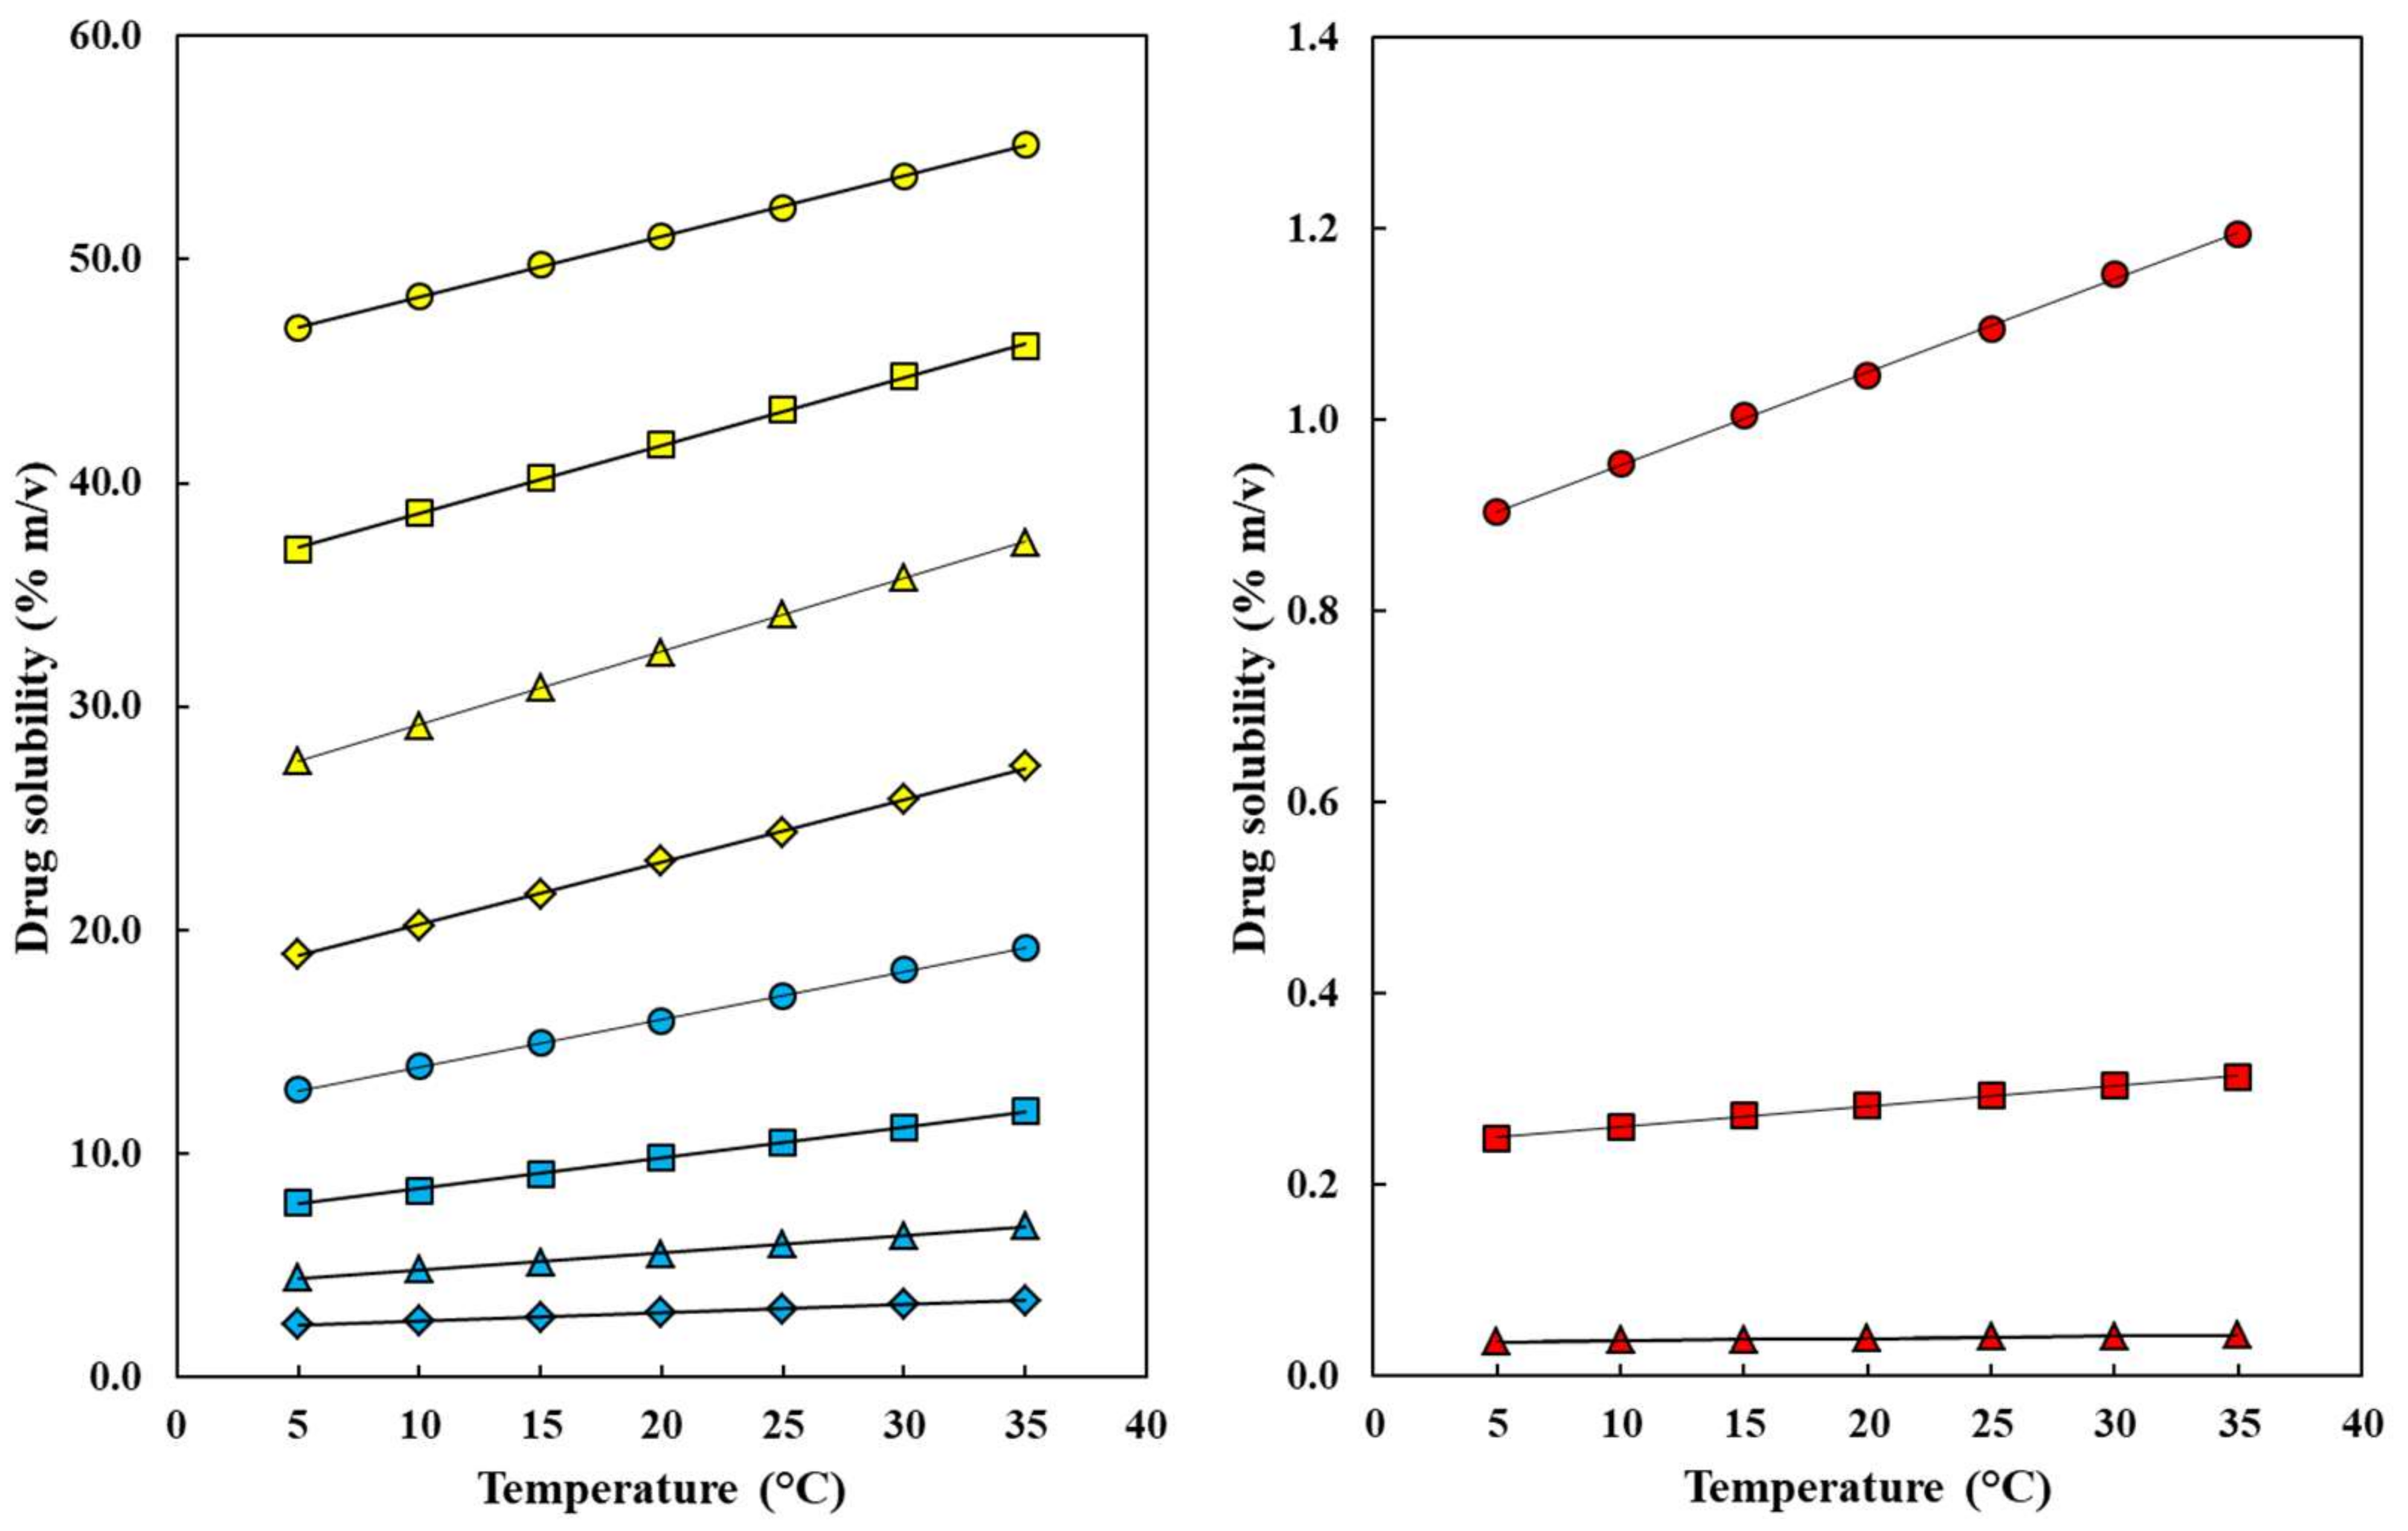
Table 1 summarizes the experimental mass/volume percentage solubilities of NaSD in the aqueous mixtures of ethanol as a function of the mixtures’ composition and temperature. As visual help, % m/v solubilities are depicted as a function of mixture compositions at all temperatures in Figure 2. As observed, NaSD solubility increases with temperature rising, but it diminishes with the increasing EtOH proportion in the mixtures at all temperatures. The respective trends were adjusted to regular polynomials in the fourth degree in all cases [59,60,61]. Moreover, % m/v solubilities are depicted at all mixture compositions as a function of temperature in Figure 3, observing linear NaSD solubility increasing in all the solvent systems [59,60,61].
On the other hand, all logarithmic % m/v solubility values of NaSD (compound 3) in {ethanol (compound 1) + water (compound 2)} (lnS3,1+2) were correlated as the bivariate polynomial model shown as Equation (1), where w1 denotes the mass fraction of ethanol in the solvent mixtures free of drug and the temperature (t) is expressed in degrees Celsius (°C). Obtained statistical parameters were as follows: r2 = 0.9997, mean standard error = 0.0400, and statistical F value = 45,526. This model allows the calculation of NaSD solubility with a mean percentage deviation (MPD %) of 3.0%—as calculated with Equation (2), where S 3 Calculated and S 3 Observed are the calculated and experimental solubility NaSD values, respectively [59,60,61]. It is worth noting that this MPD is slightly higher than the mean relative uncertainty in mass/volume percentage solubility of 2.0% (Table 1), demonstrating the usefulness of this correlation model.
ln S 3 , 1 + 2 = 3.714 + 0.0102 ( ± 0.0005 ) t ( ° C ) 0.769 ( ± 0.223 ) w 1 10.04 ( ± 0.98 ) w 1 2 + 16.46 ( ± 1.50 ) w 1 3 12.80 ( ± 0.75 ) w 1 4
MPD   % = i = 1 n 100 S 3 Calculated S 3 Observed S 3 Observed n
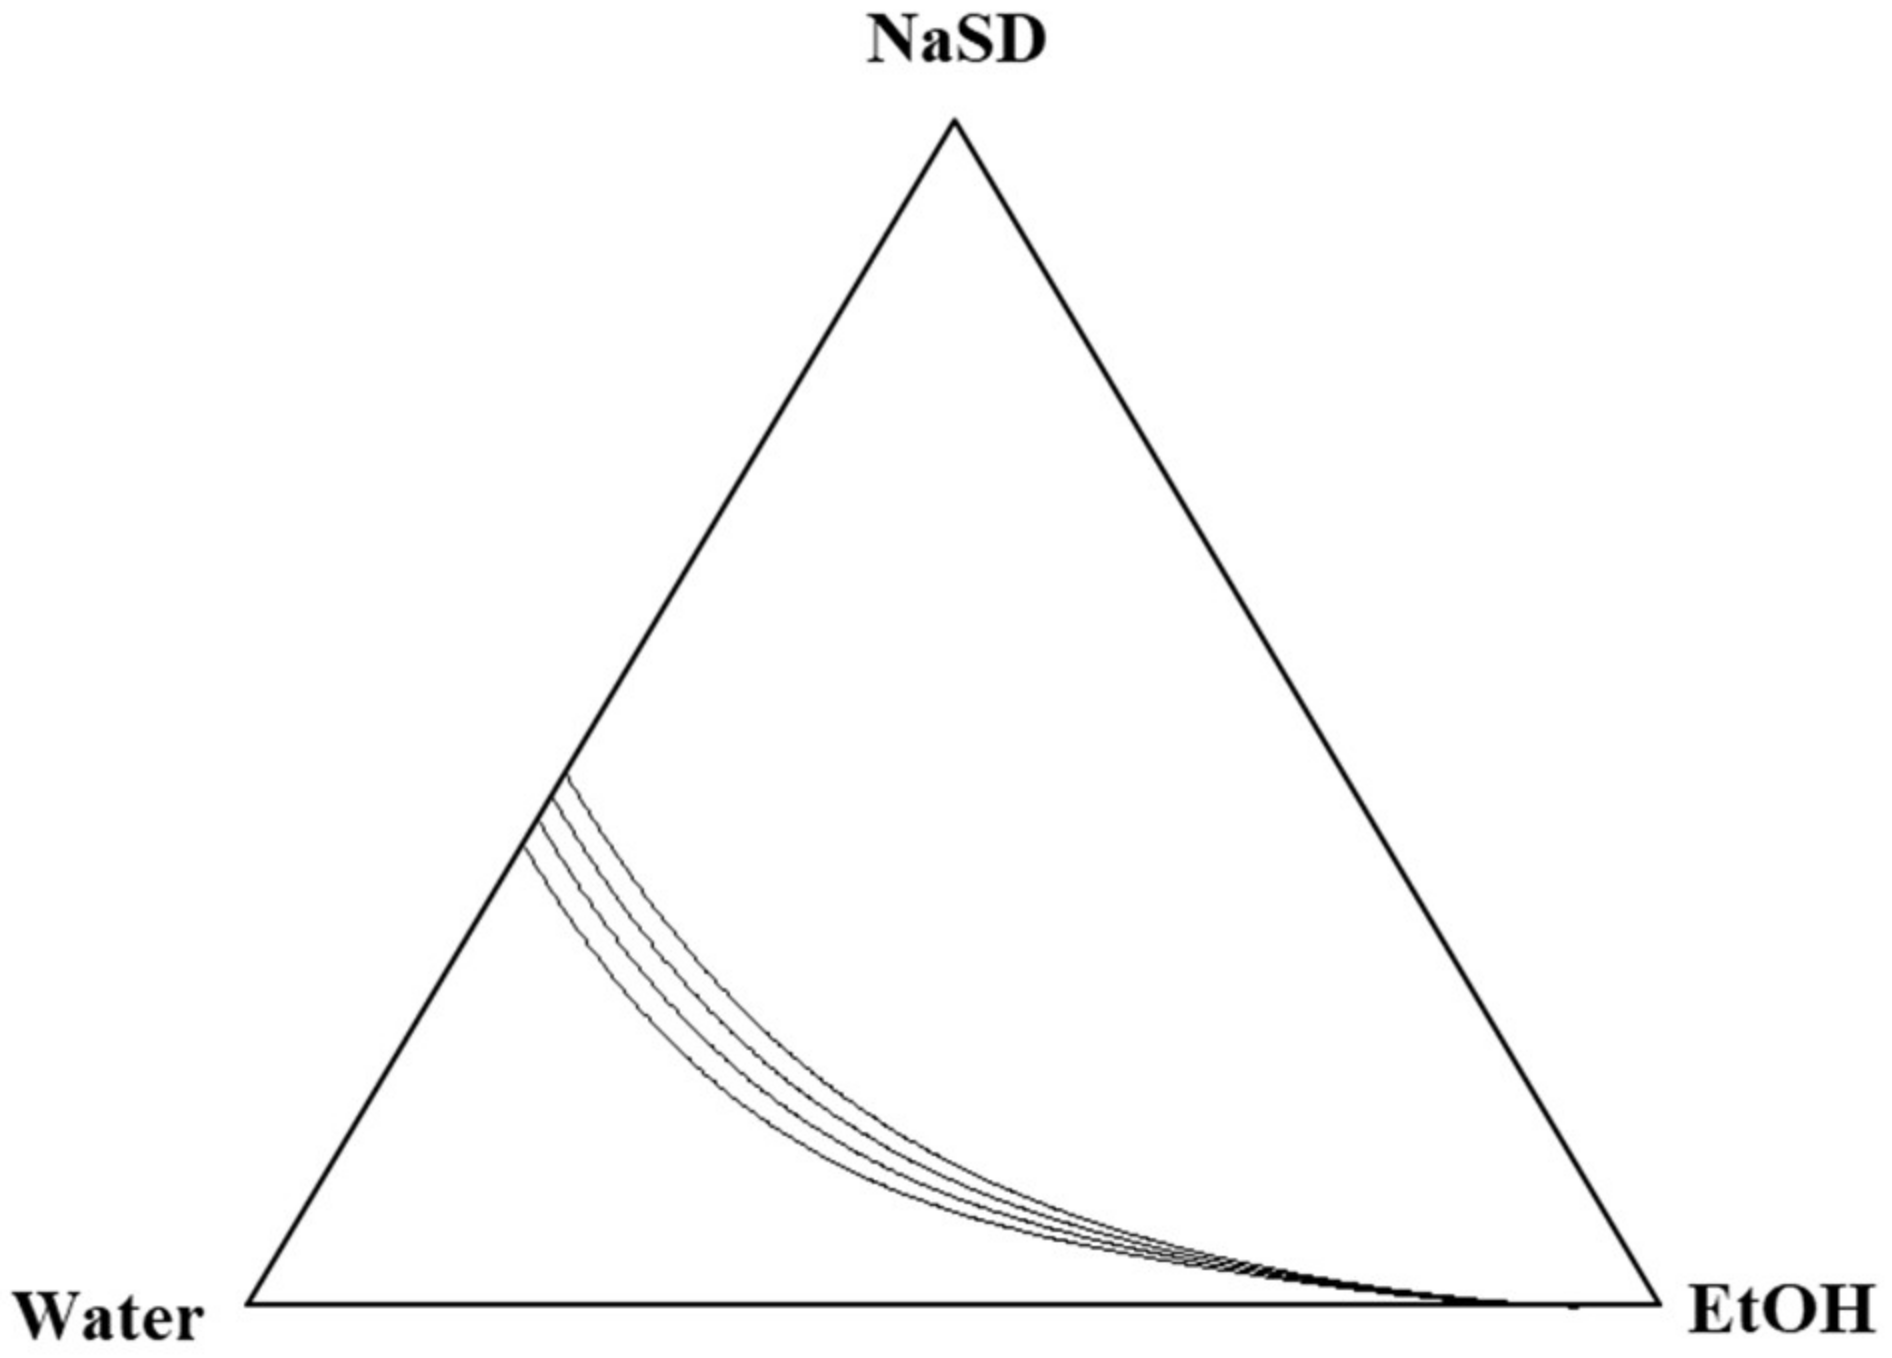
On the other hand, Table 2 summarizes the experimental mass/mass percentage solubilities of NaSD in the aqueous mixtures of ethanol as a function of both the mixtures’ composition and temperature. Moreover, as a visual help, % m/m solubilities are depicted as a function of mixture compositions at four temperatures in Figure 4 as a Gibbs–Roozeboom triangular graph [62,63]. It is noteworthy that mass fraction solubilities are required for calculating apparent specific volumes of NaSD as indicated below.
The effects of solubility units on the accuracy of the cosolvency model of Jouyban–Acree and Jouyban–Acree–van’t Hoff models are investigated [64], and the obtained results are listed in Table 3. As it has been shown in Table 3, the model constants varied with different solubility units; however, there is no big difference among the MPD% values. This is in agreement with the findings reported in a previous study [64].

3.2. Apparent Specific Volume of Sodium Sulfadiazine at Saturation

As widely described in the literature, the complete knowledge of the volumetric contribution of drugs and excipients after dissolution in aqueous cosolvent mixtures as a function of systems composition and temperature is very important from practical and theoretical viewpoints. Thus, a well-described property of every pharmaceutical solute in saturated solutions is its apparent specific volume ( φ V sp ), which is commonly calculated by means of Equation (3) [49,50,51]:
φ V sp = w 3 + w 1 + 2 ( 1 ρ 1 + 2 + 3 / ρ 1 + 2 ) w 3 ρ 1 + 2 + 3
Here, w3 and w1+2 are the mass fractions of the solute (3) and the {ethanol (1) + water (2)} mixture in the saturated solution, respectively. Furthrmore, ρ1+2+3 and ρ1+2 are the densities of the saturated solution and the cosolvent mixture free of solute, respectively.
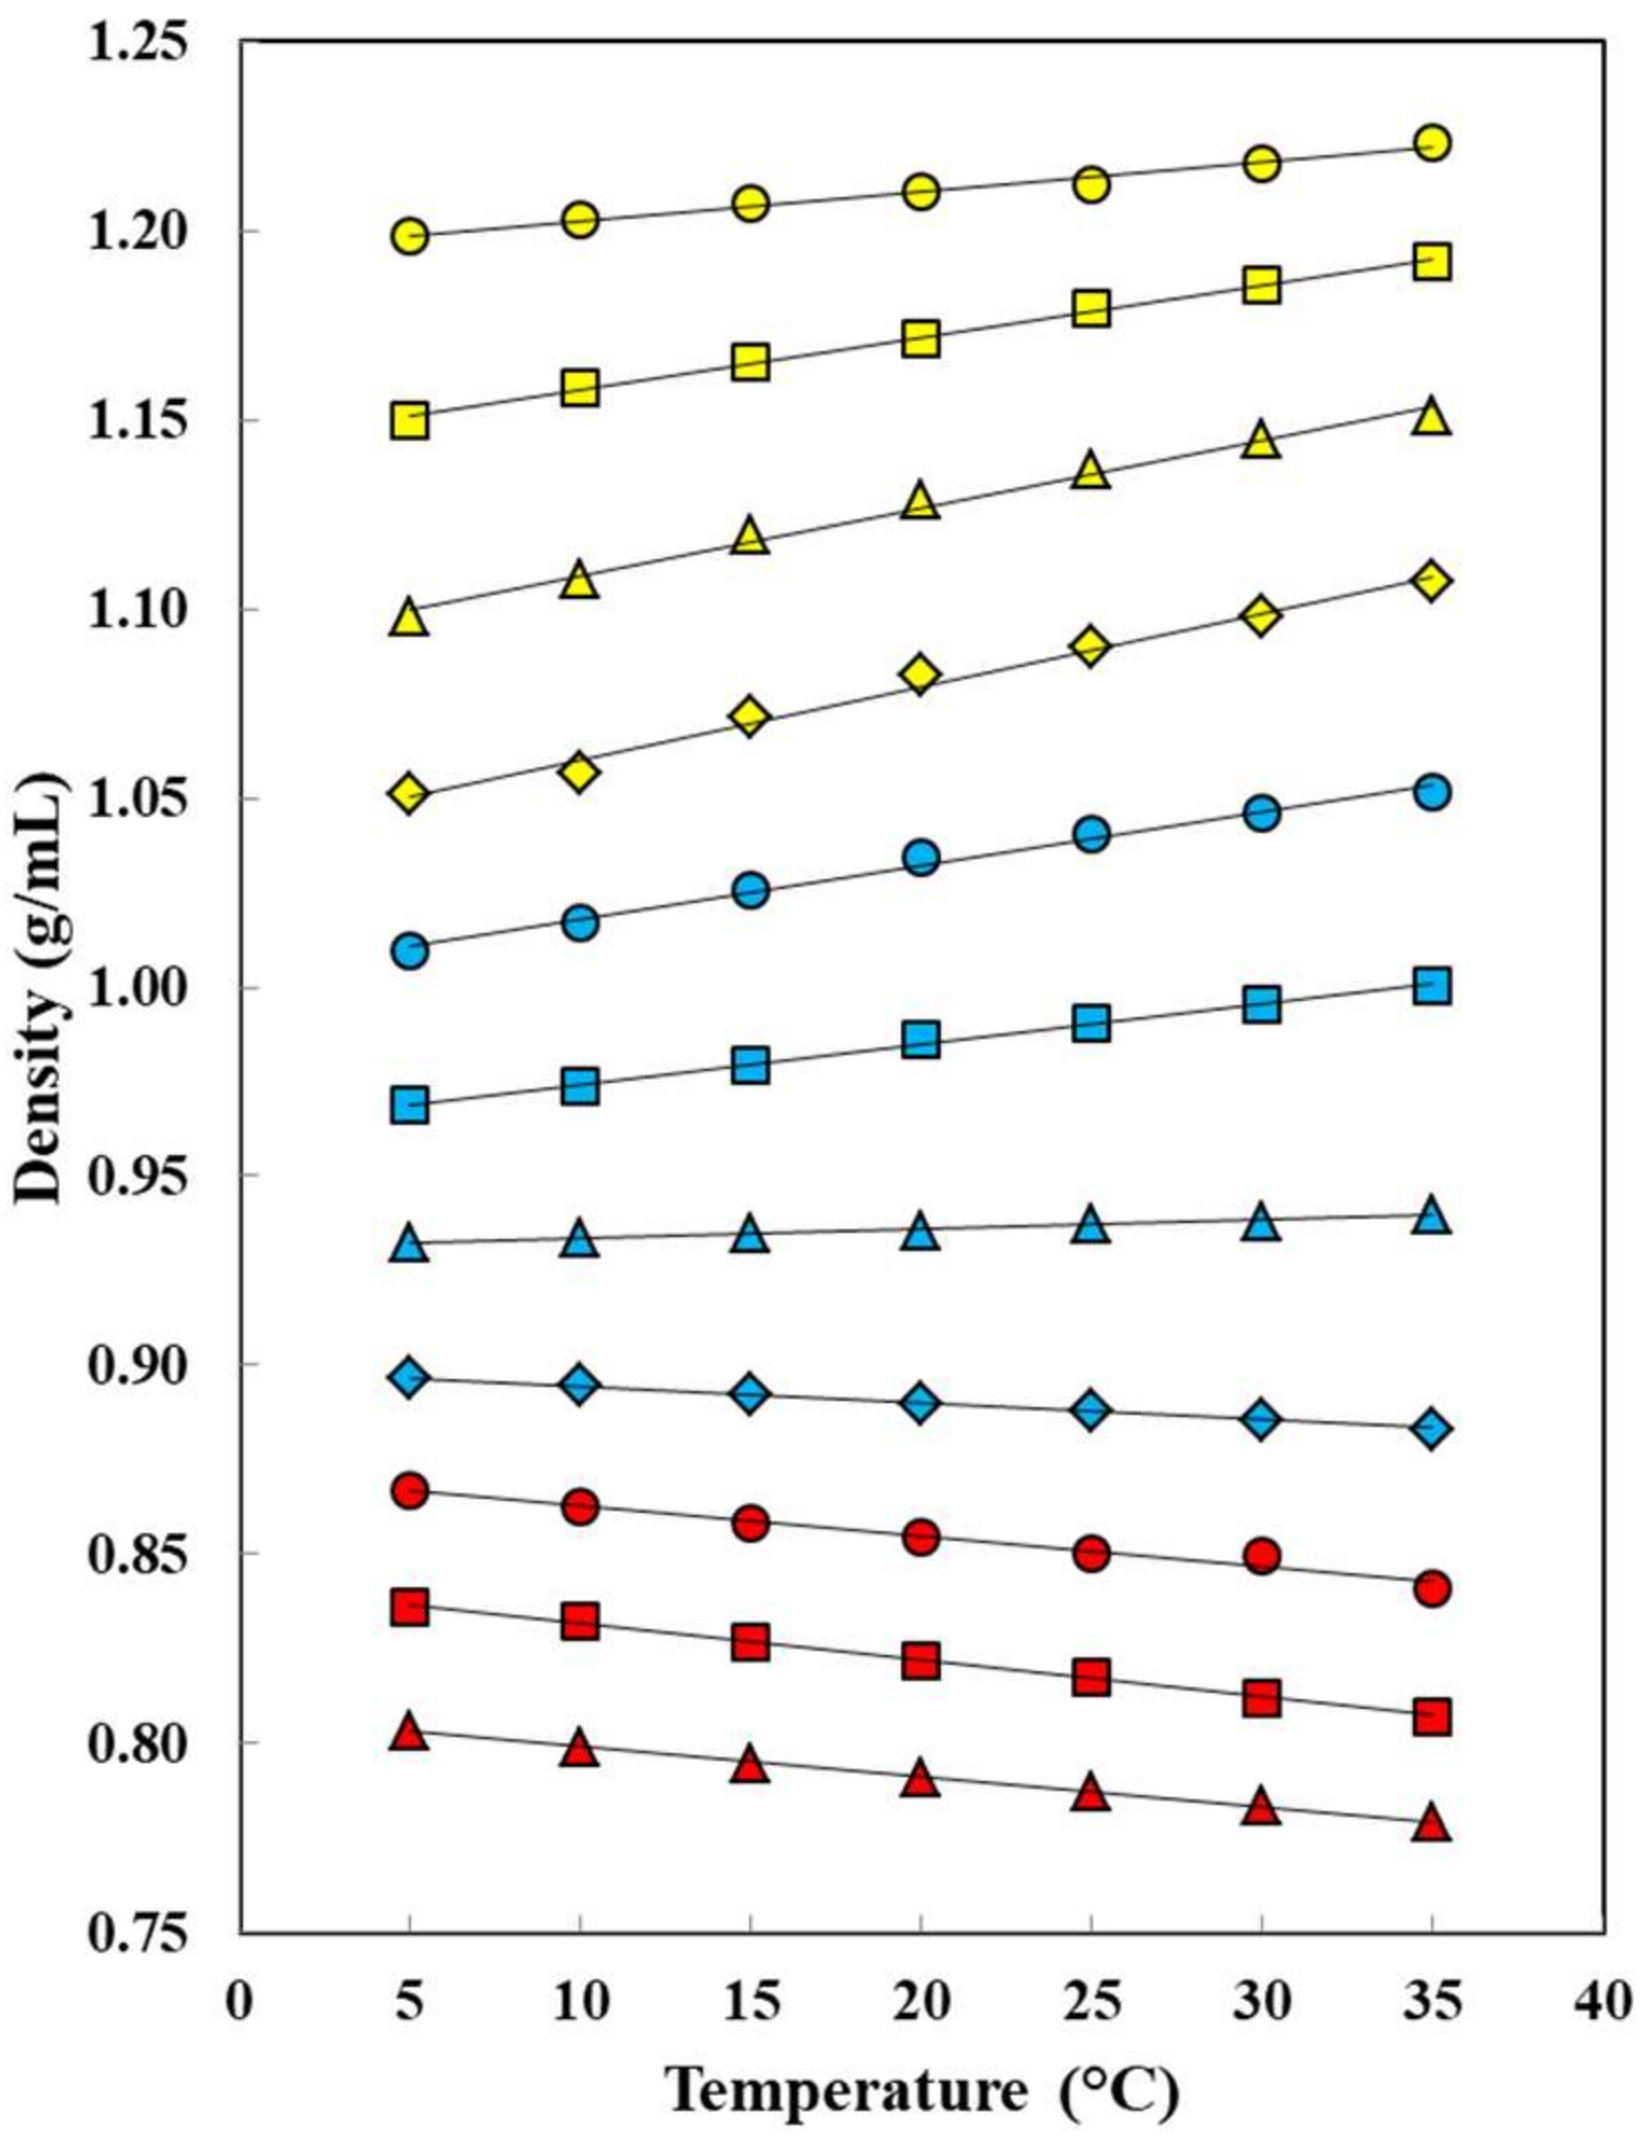
The density values of the NaSD saturated solutions in all the cosolvent mixtures and neat solvents at all temperatures are shown in Table 4 and Figure 5.
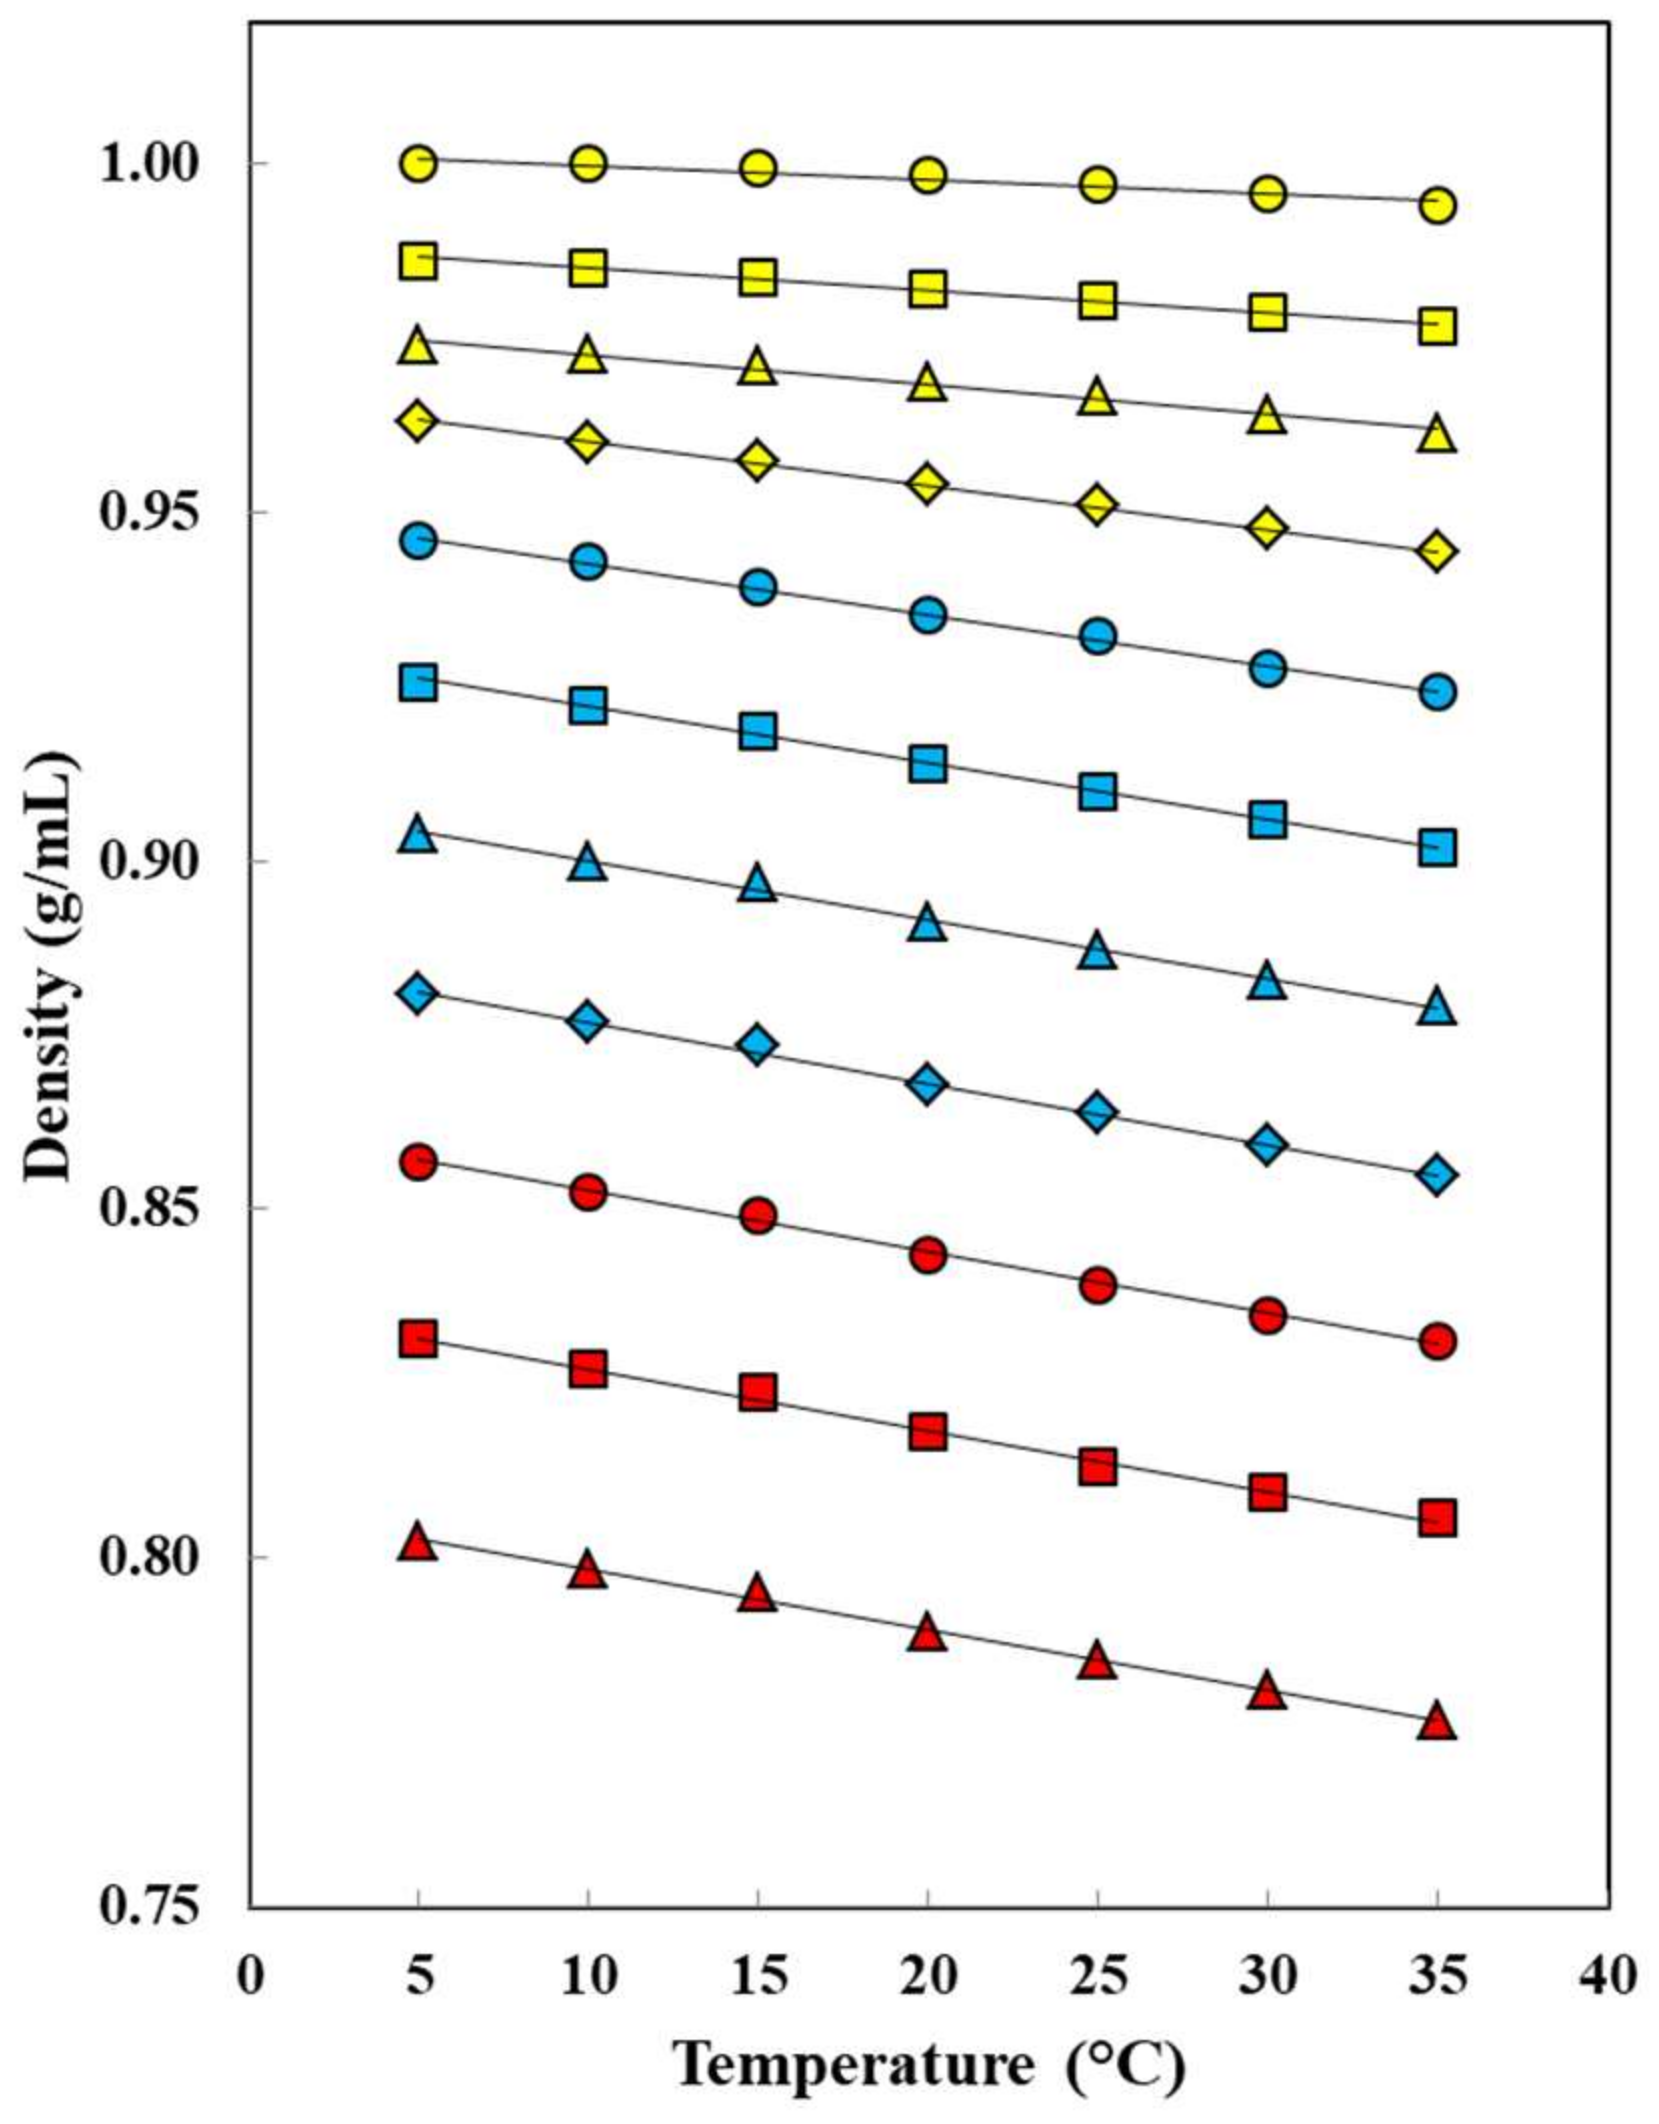
Regarding the saturated mixtures, the density values diminish with the ethanol proportion in the mixtures (Table 4 and Figure 5) because ethanol is the compound exhibiting the lowest density and also because NaSD solubility decreases as the ethanol proportion increases in the mixtures. Regarding temperature increasing, the density of saturated systems increases in pure water and the mixtures of 0.10 ≤ w1 ≤ 0.60 because the effect of NaSD concentration increasing at saturation is more important than the density decreasing of the solvent systems free of drug as shown in Figure 6. Otherwise, the density of saturated systems decreases with temperature increasing in the solvent systems of 0.70 ≤ w1 ≤ 1.00, demonstrating the main role of density diminishing of solvent systems with temperature increasing compared with the NaSD solubility increasing owing to the low drug solubilities observed in these solvent systems.
Moreover, Table 5 summarizes the difference in densities of saturated solutions of sodium sulfadiazine and aqueous alcoholic mixtures free of drug at different temperatures. It is noteworthy that densities of binary mixtures free of drug shown in Figure 6 were taken numerically from the literature [65,66]. It is important to note that volumetric and acoustic measurements have also been used for characterizing (EtOH + water) mixtures, demonstrating that the enhanced packing efficiency of ethanol in water at low concentrations is affected by the formation of cage-like structures around the hydrophobic moiety; however, at high concentrations, linear chains or rings of ethanol molecules are formed, changing its mode of packing within the 3D structure of water [67].
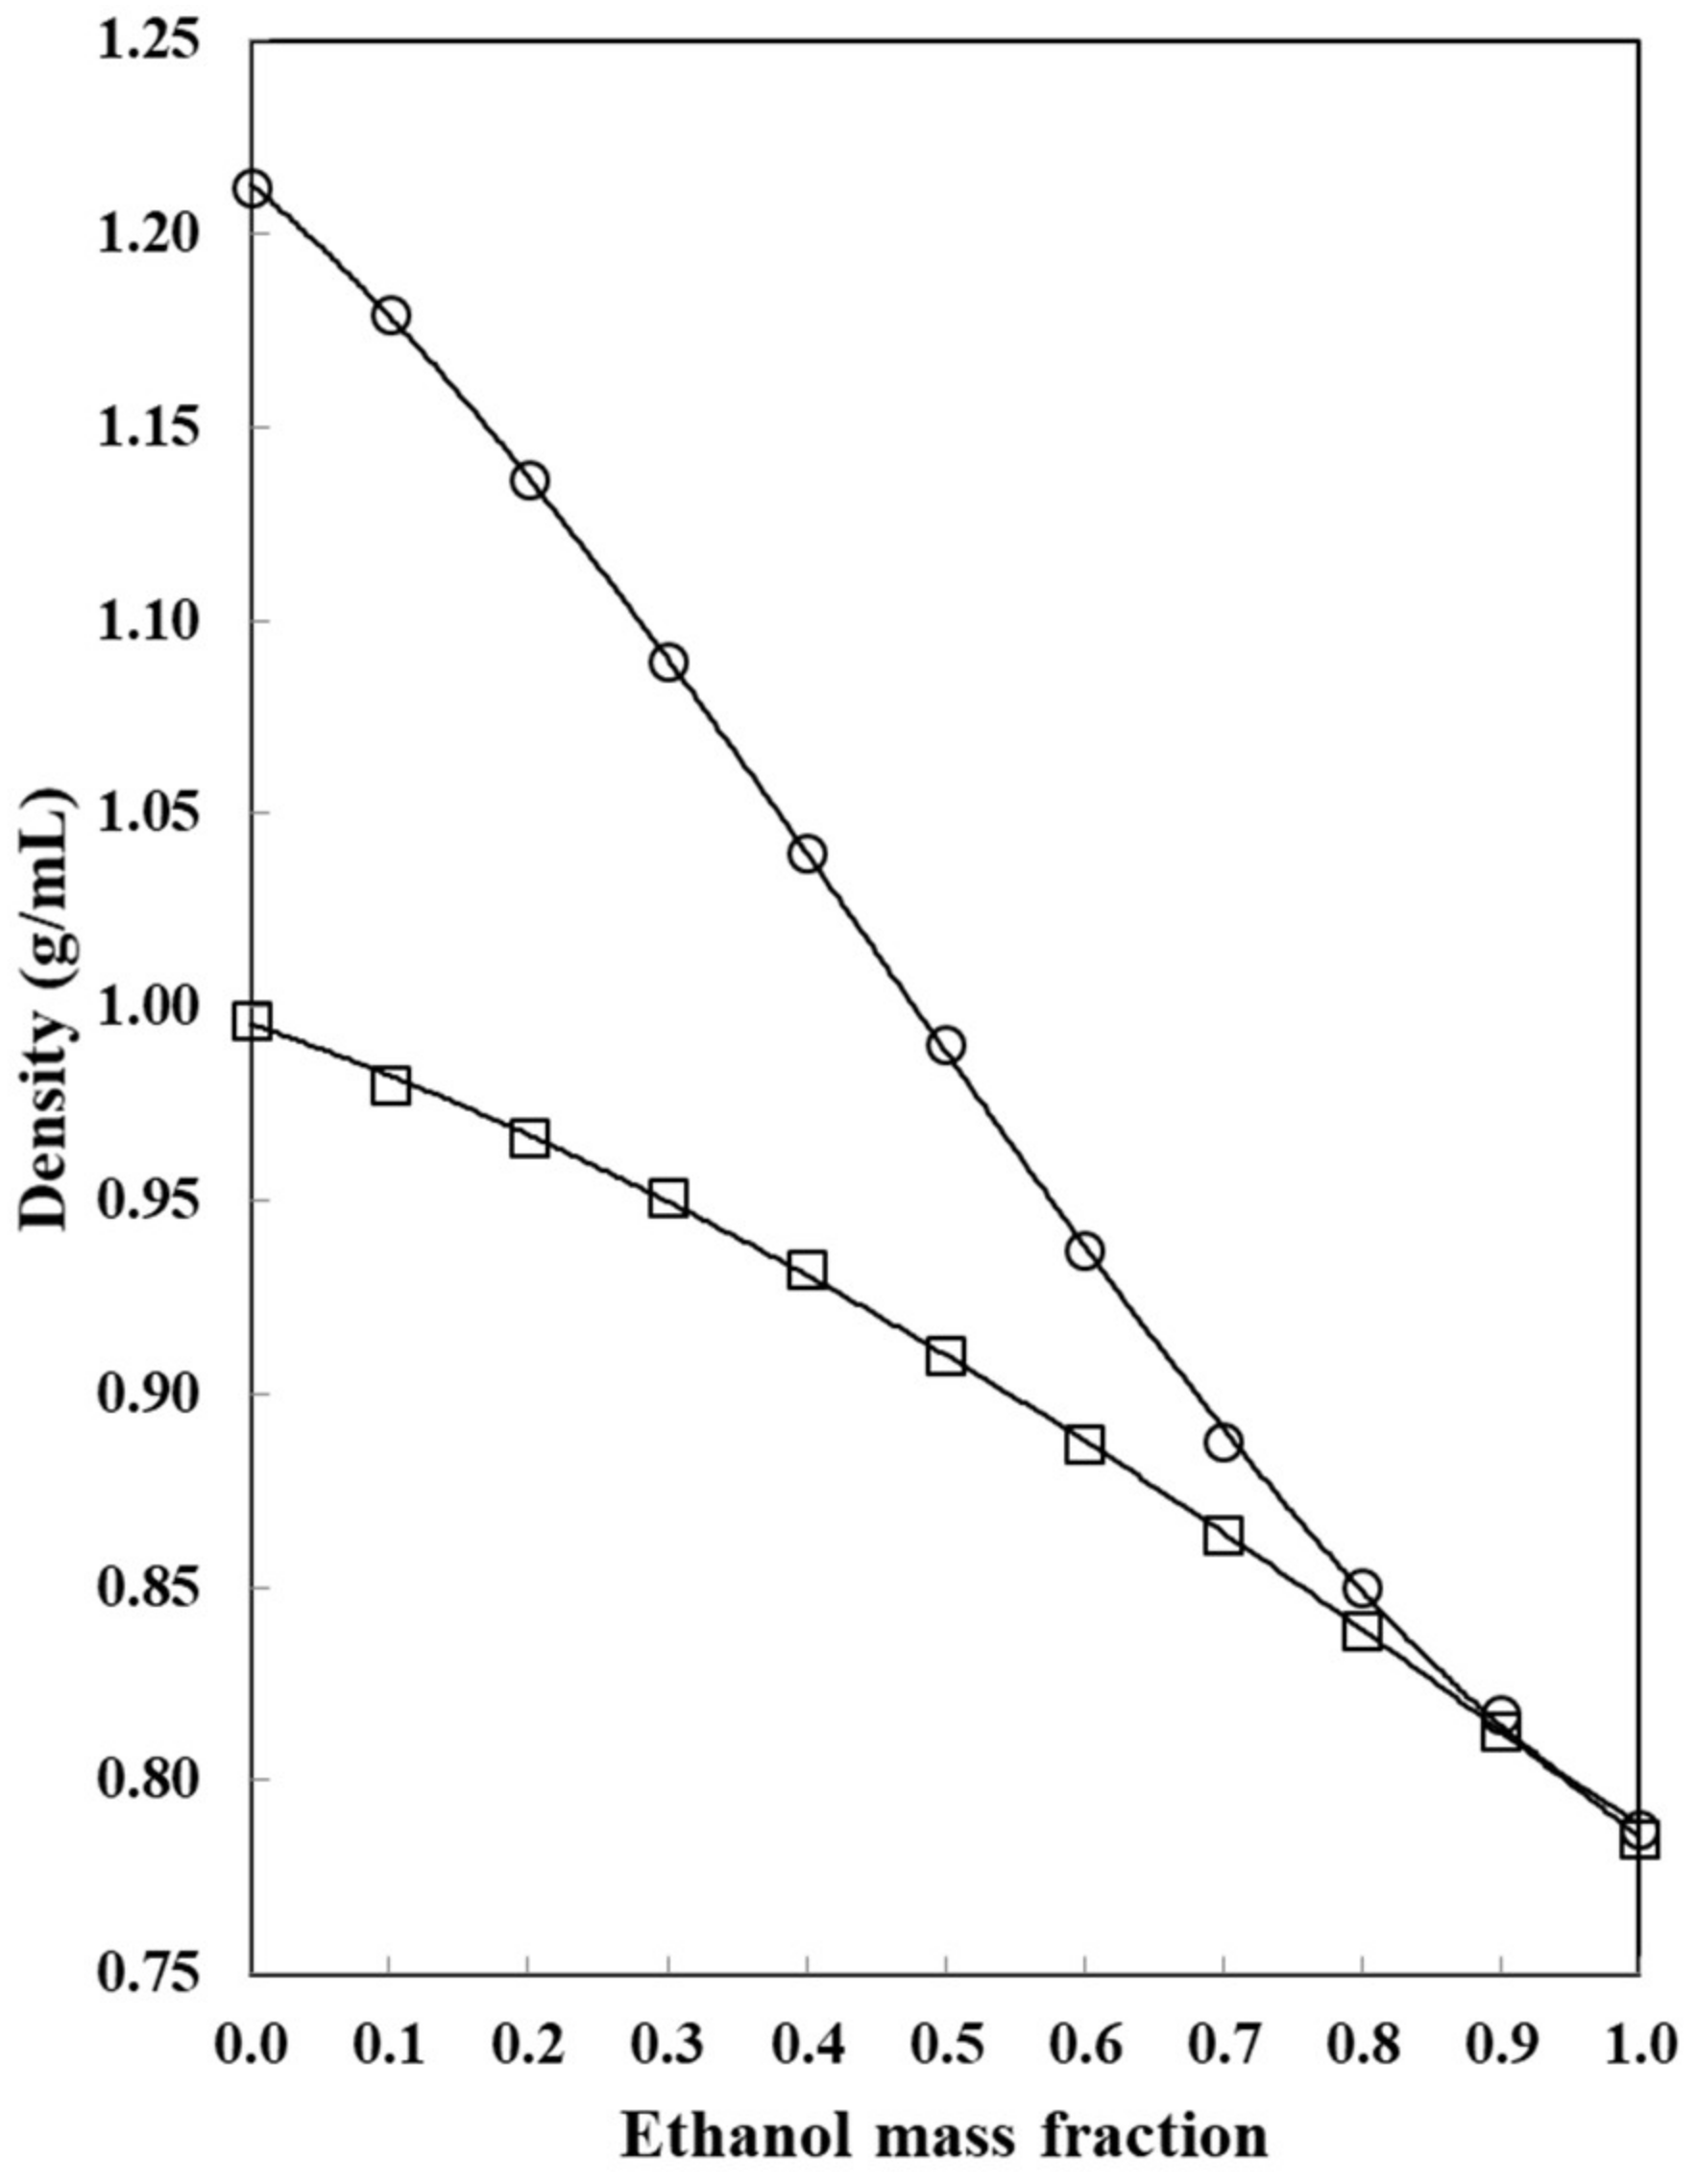
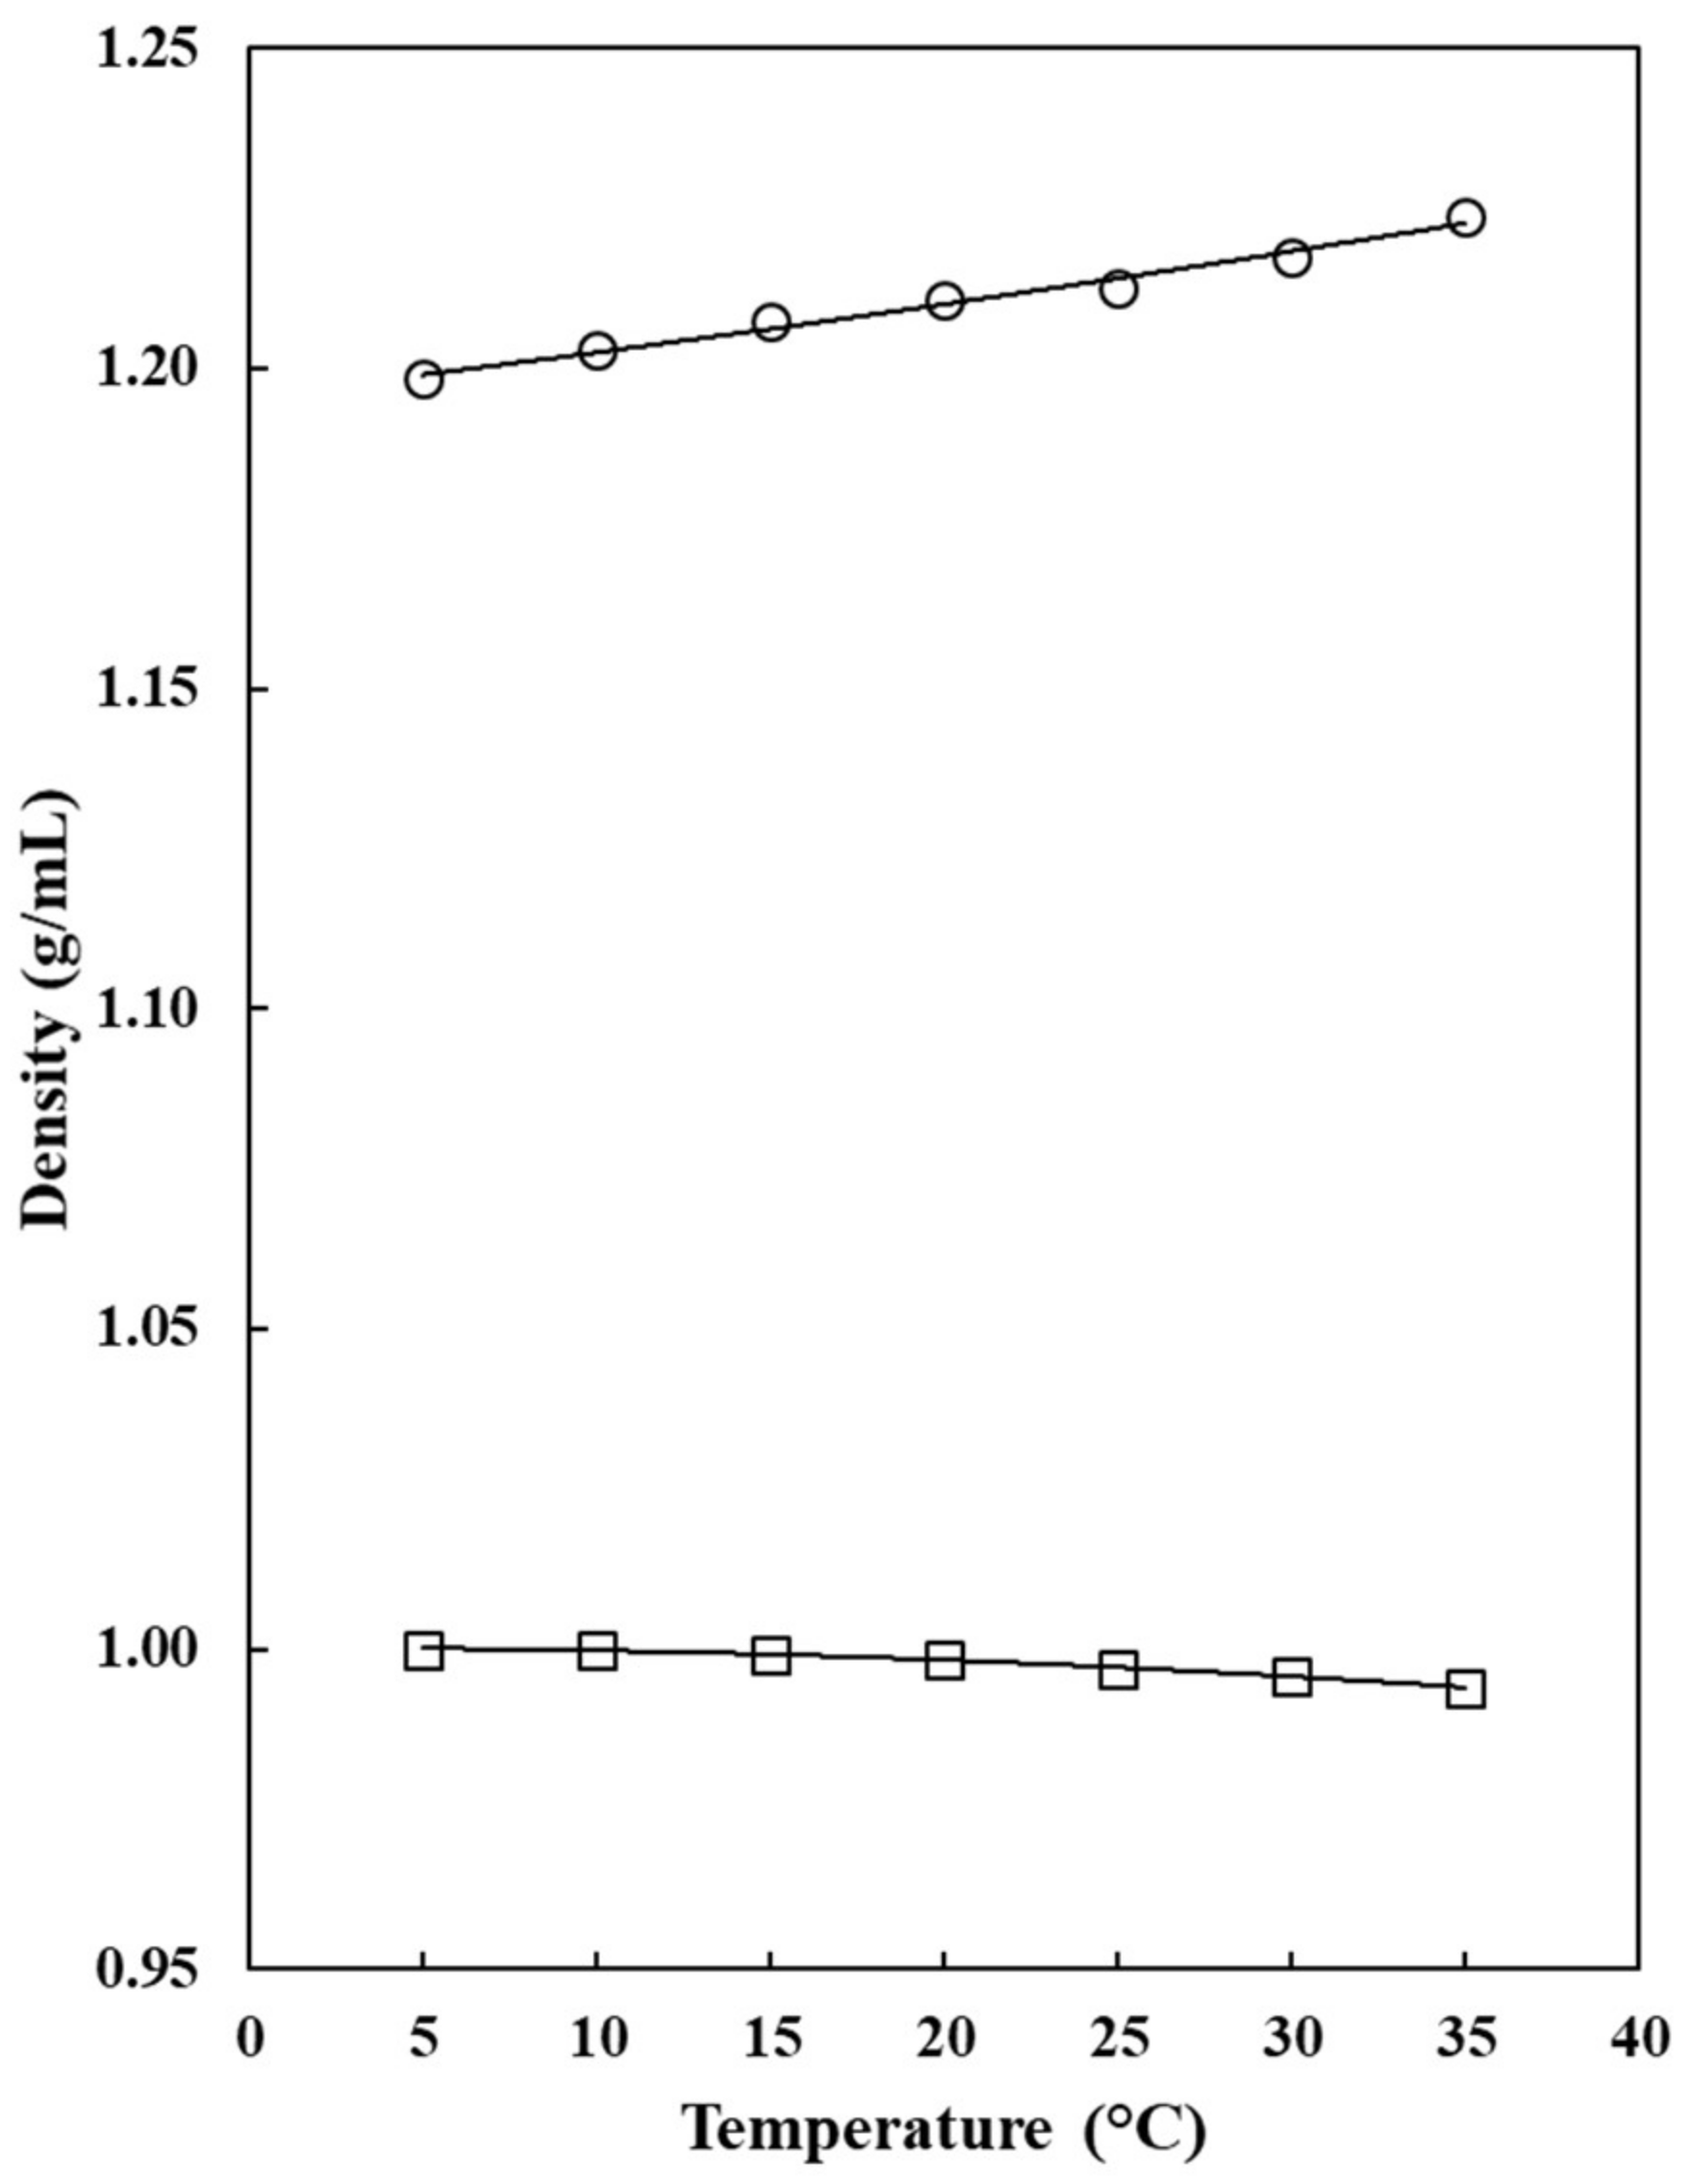
Otherwise, as an example, Figure 7 allows the visual comparison of densities for all the saturated solutions and the respective cosolvent mixtures free of sodium sulfadiazine at 25.0 °C. Moreover, Figure 8 allows the comparison of densities of saturated solutions in pure water regarding the water free of sodium sulfadiazine at different temperatures from 5.0 to 35.0 °C.
As expected, all saturated solutions exhibit density values higher than those of the cosolvent mixtures free of sodium sulfadiazine, which indicates that this drug is denser than all the respective solvent systems.
As observed, density differences decrease as the ethanol proportion decreases in the mixtures owing to the NaSD solubility decreasing. Moreover, density differences increase with the temperature arising from pure water to the mixture of w1 = 0.70 owing to the increase in the NaSD solubility. In mixtures from w1 = 0.80 to pure EtOH, the differences follow erratic tendencies where differences in uncertainty are significant.
An adopted version of the Jouyban–Acree model could be used to represent the physico-chemical properties of the solvent mixtures at different temperatures, including density values [68]. Because of the ignorable effects of the dissolved solute on the density of the saturated solutions of poorly soluble drugs, one may use the trained model using solute-free solvent mixtures and then predict the density of the saturated solutions employing the experimental density of the saturated solutions in the neat mono-solvents. The trained model using the NaSD-free mixtures of aqueous alcoholic mixtures is as follows:
ln ρ m , T = w 1 ln ρ 1 , T + w 2 ln ρ 2 , T + 1.048 w 1 w 2 T
This model predicted the density of the NaSD saturated solutions with the MPD % of 1.6%.
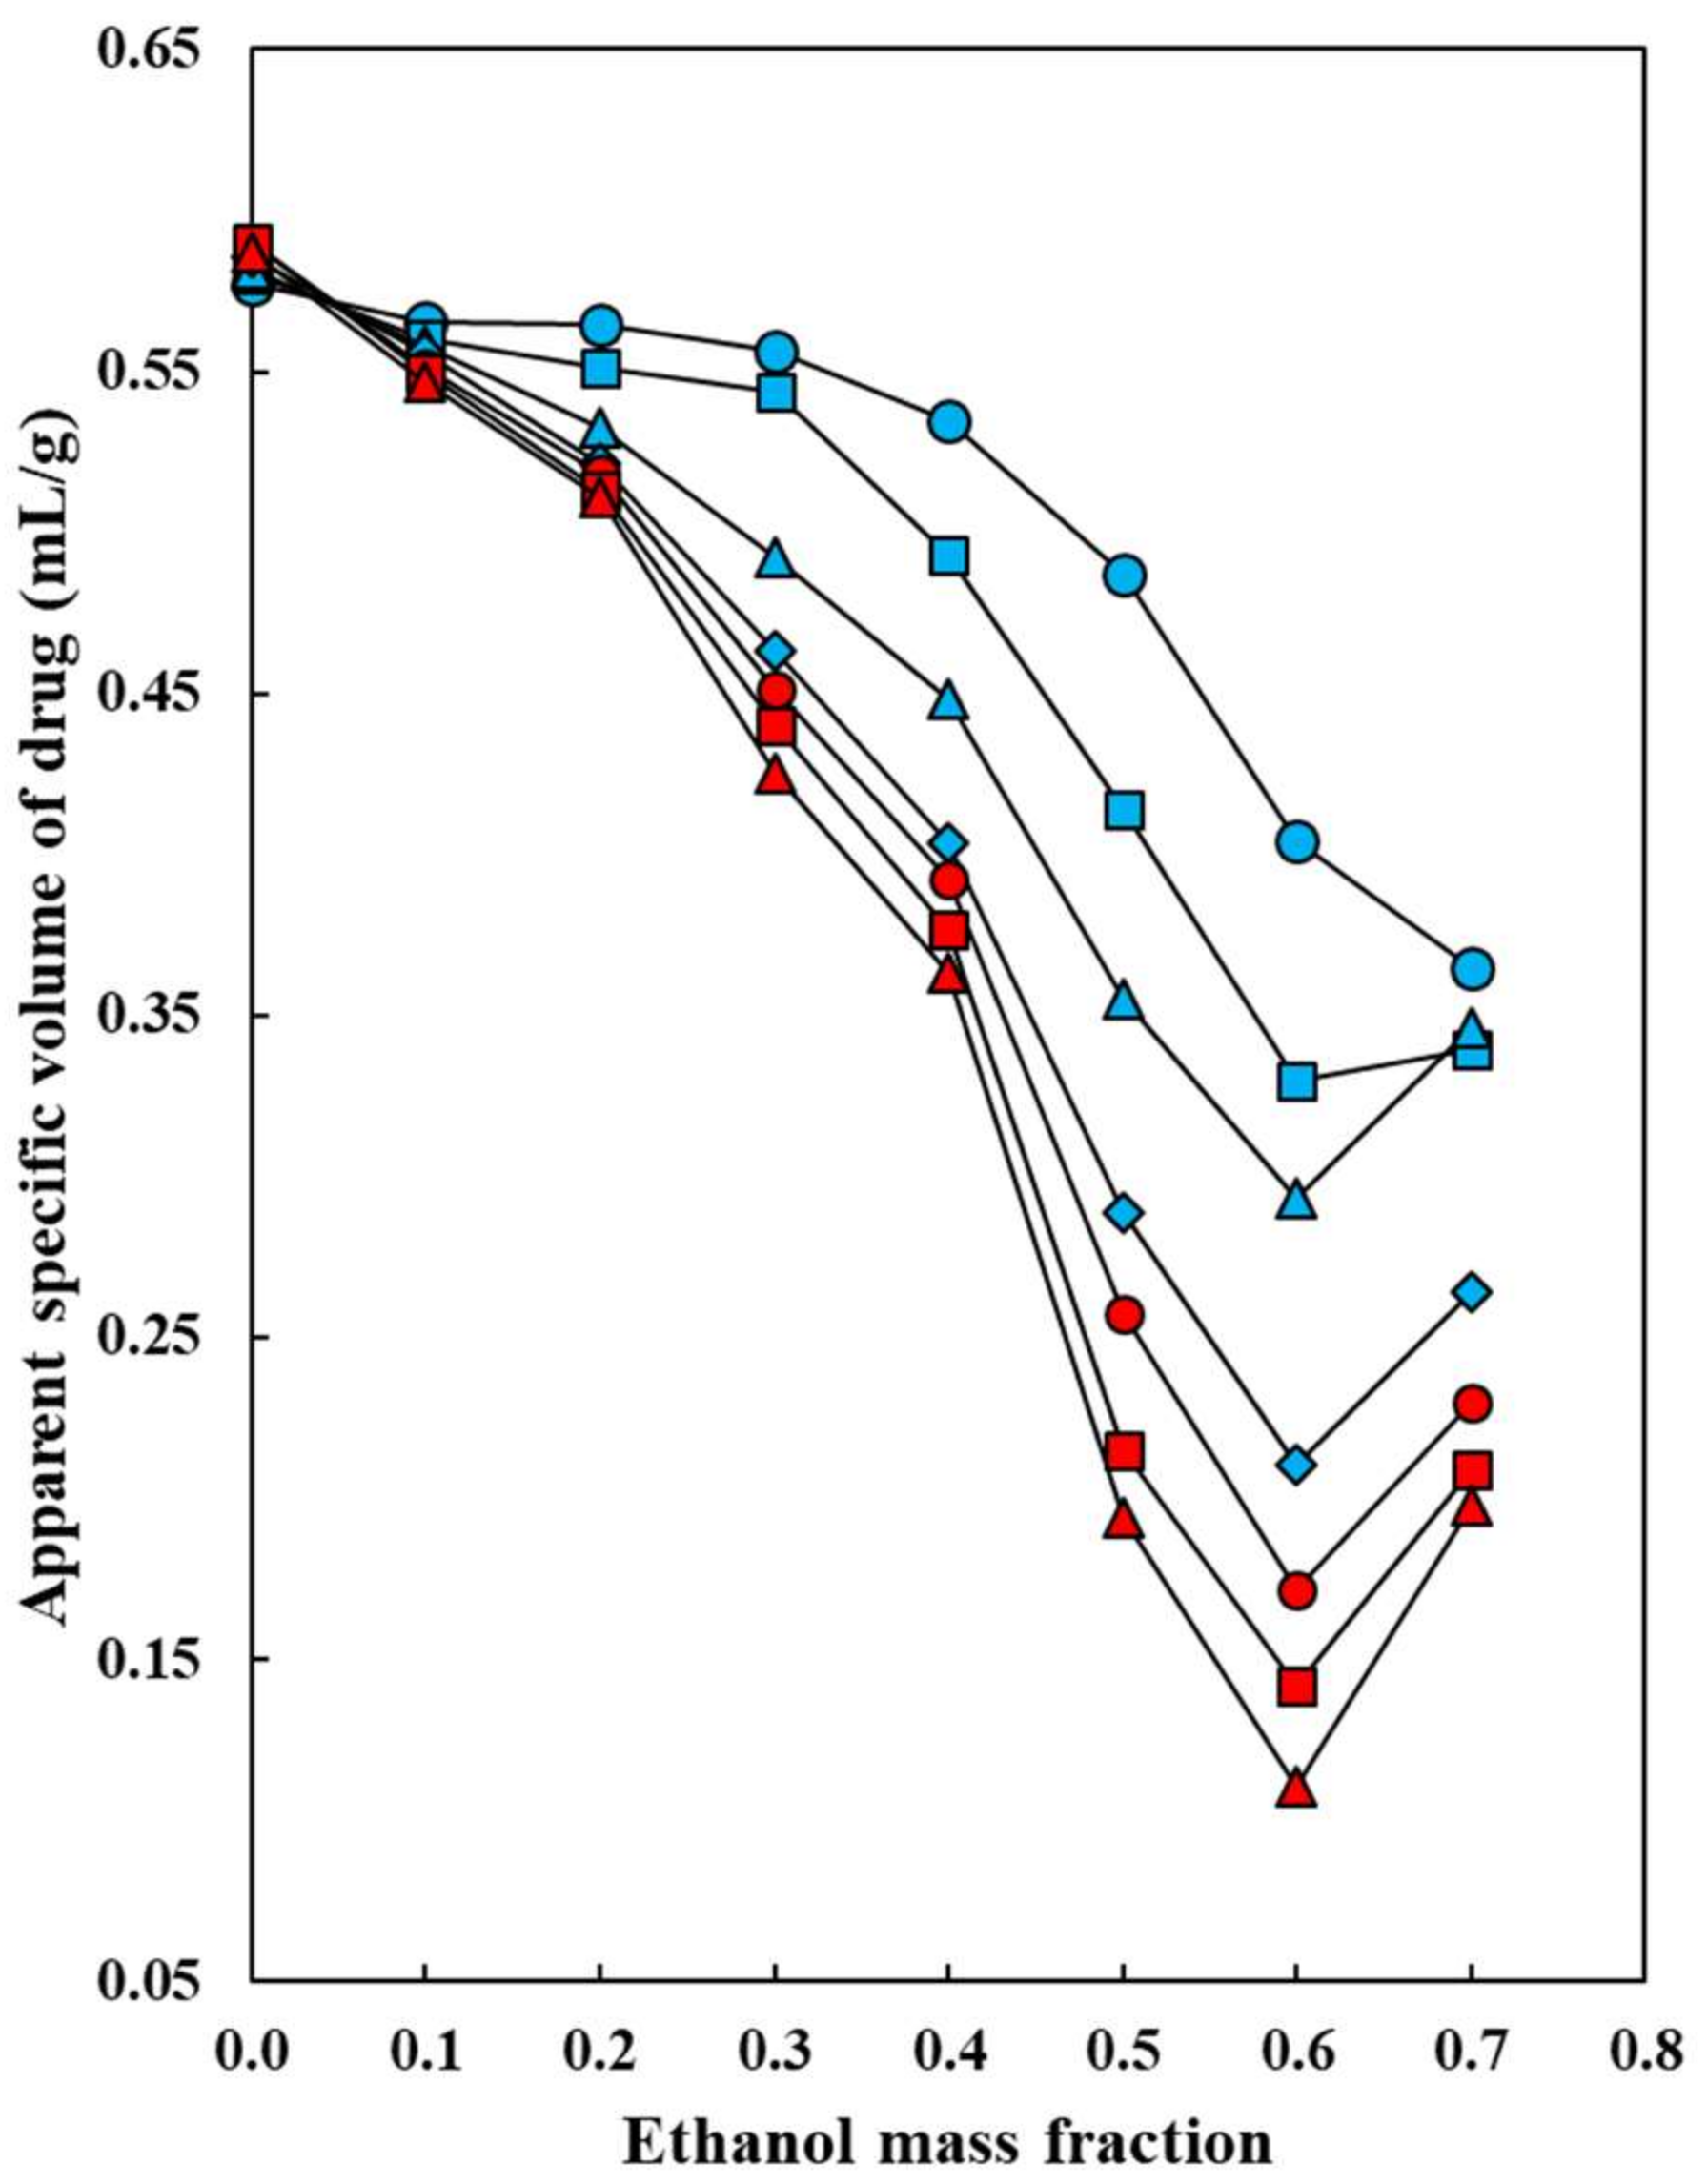
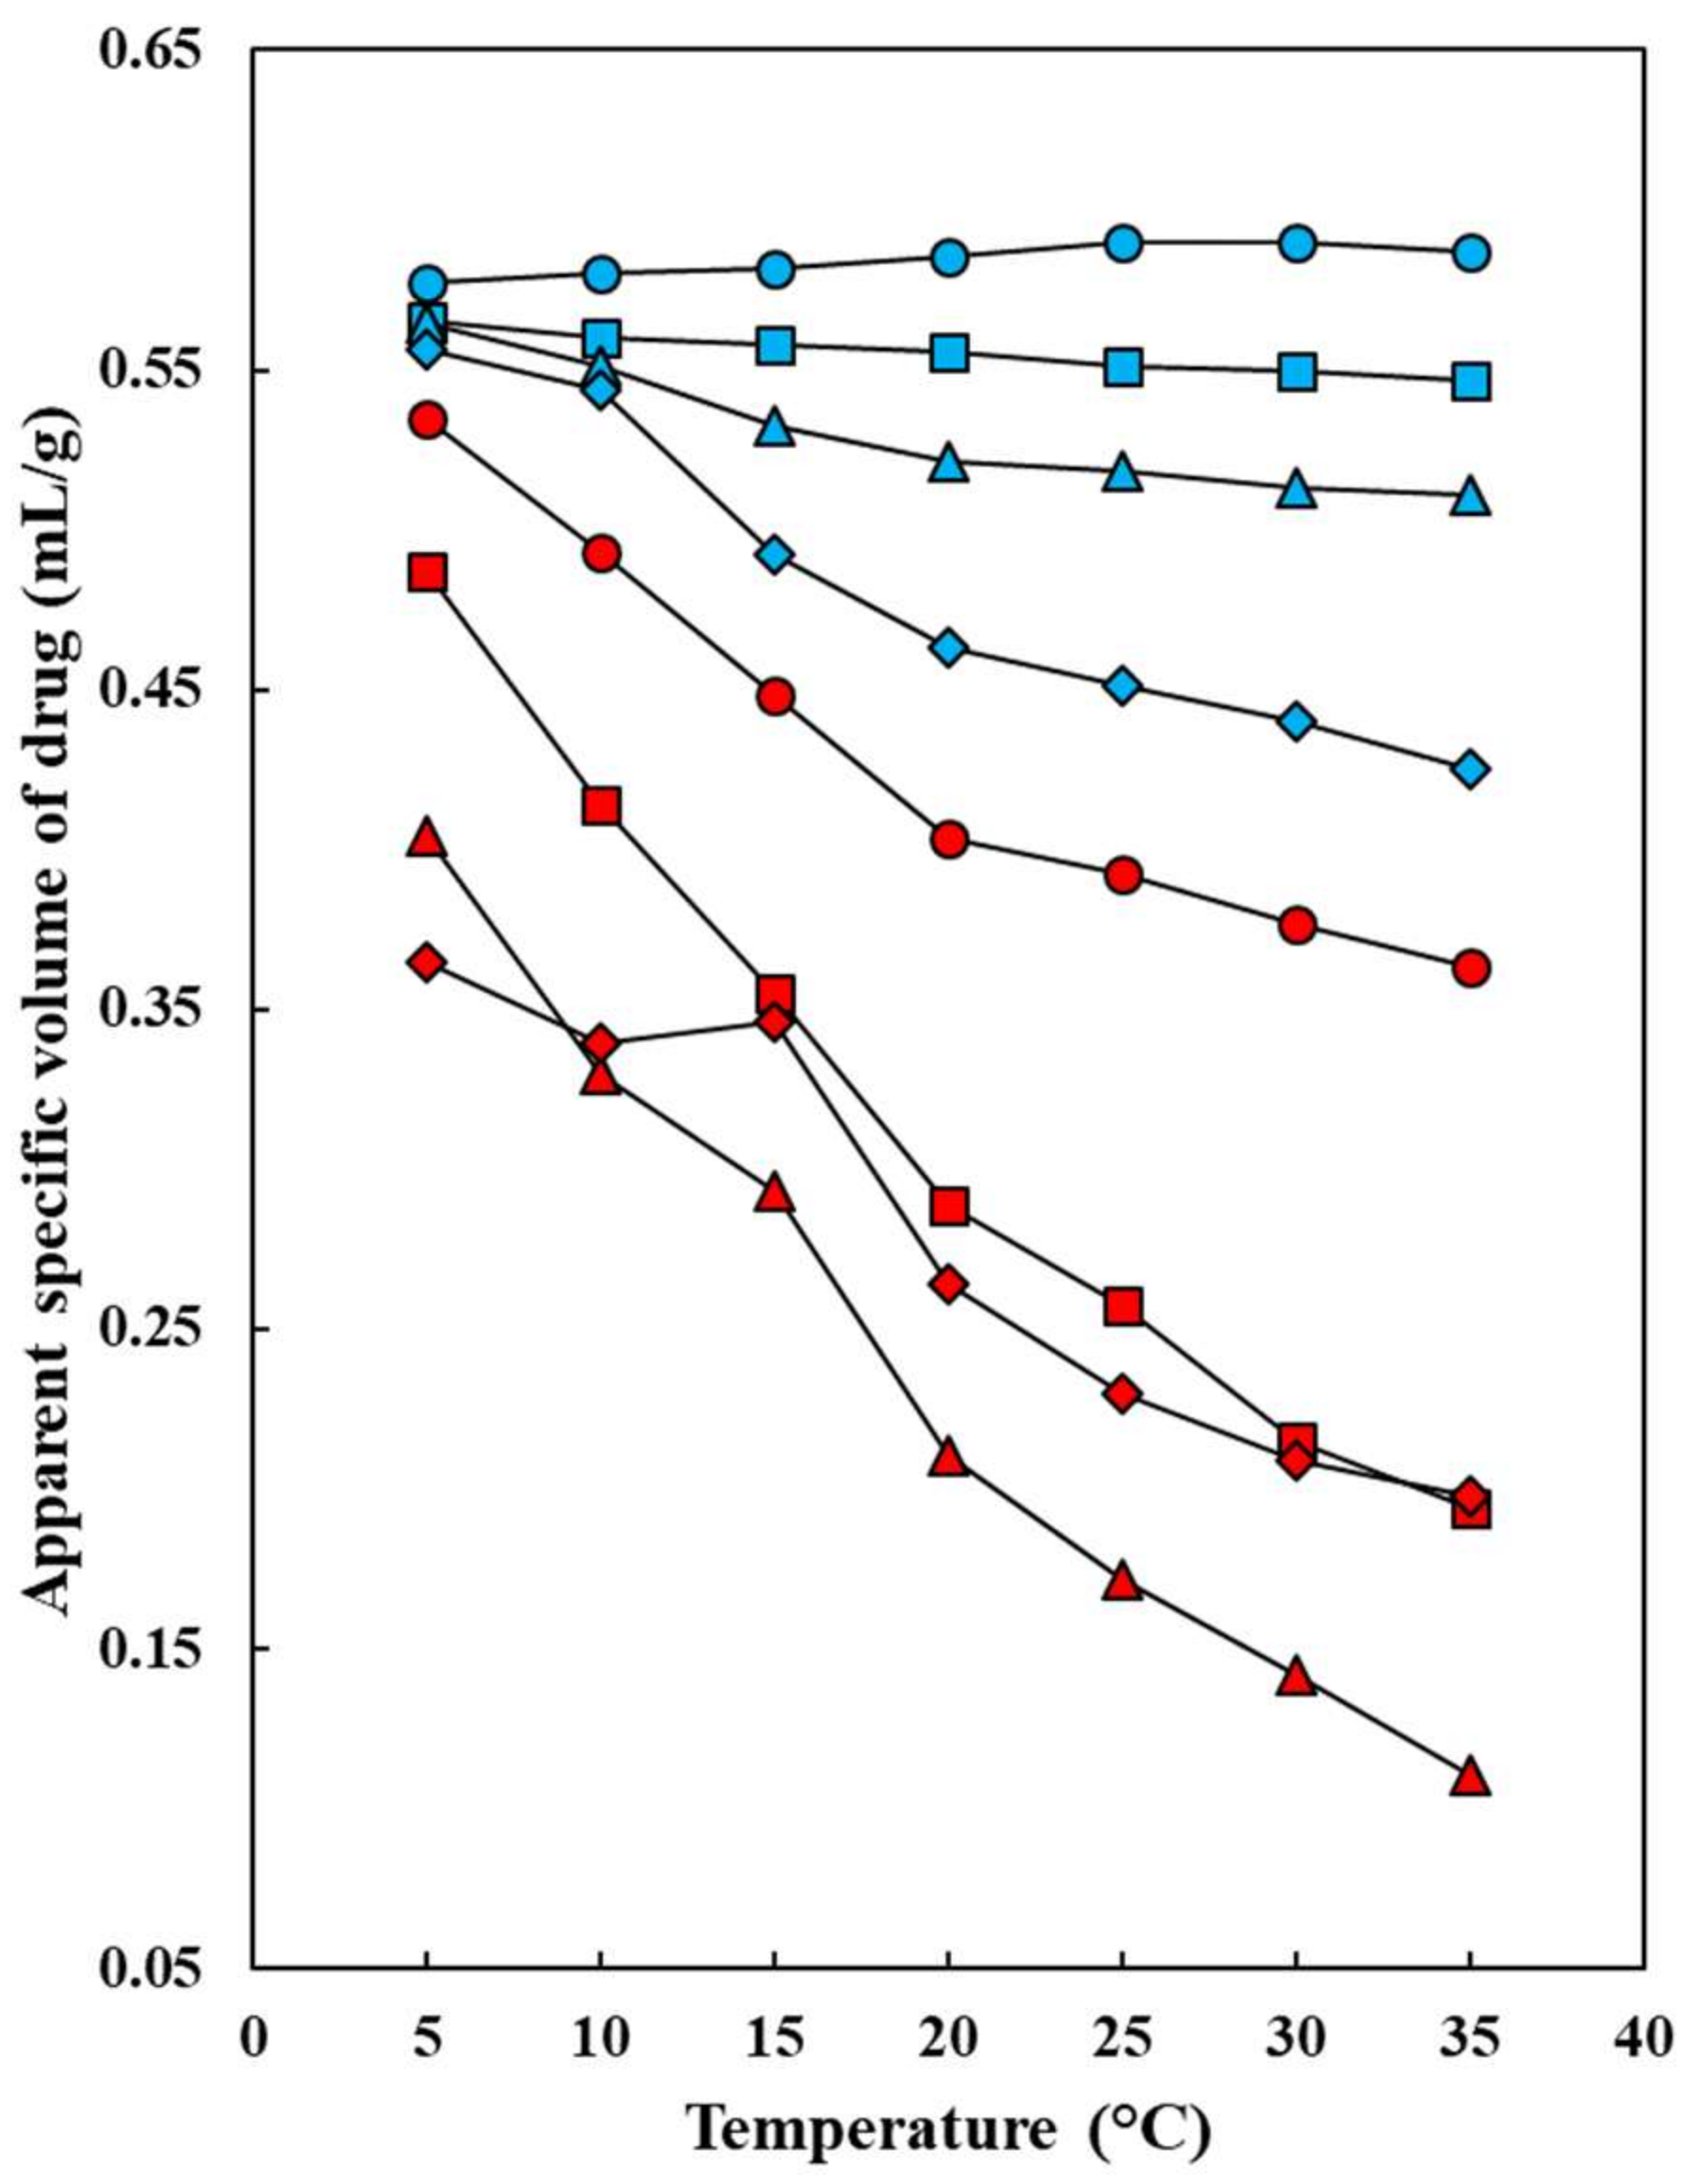
Otherwise, the calculated apparent specific volumes of NaSD at saturation ( φ V sp ) as functions of mixture composition and temperature are summarized in Table 6. Moreover, as visual help Figure 9 and Figure 10 depict this property as a function of (EtOH + water) mixture composition and temperature, respectively. It is important to note that significant φ V sp values are obtained from pure water to the mixture of w1 = 0.70, while from w1 = 0.80 to pure EtOH, negative φ V sp values are observed, some of them being too high, like −6.40 mL/g. For this reason, only the first φ V sp values are considered for discussion.
As observed, φ V sp values diminish as the EtOH proportion decreases in the mixtures from 0.590 mL/g in pure water to 0.171 mL/g in the mixture of w1 = 0.60, but it increases again to 0.230 mL/g in the mixture of w1 = 0.70. Moreover, φ V sp values apparently increase with the temperature rising in pure water, but these values decrease in the composition interval 0.10 ≤ w1 ≤ 0.70.
The main technological purpose of determining the φ V sp values of drugs and excipients is to verify if this property is almost constantly independent of temperature and mixture composition. However, in this ternary (or binary in the case of pure solvents) system, it is observed that in the interval of 0.20 ≤ w1 ≤ 0.70, the φ V sp values change significantly with temperature. In this way, only in the cases of pure water and the mixture of w1 = 0.10 no significant changes with temperature are obtained as follows: φ V sp = 0.584 (±0.005) mL/g (with relative standard deviation, RSD = 0.83%) in pure water and φ V sp = 0.555 (±0.007) mL/g (with RSD = 1.20%).
Regarding reported literature φ V sp values of NaSD in some other aqueous cosolvent binary solvent systems, our present φ V sp values in {ethanol (1) + water (2)} at 25.0 °C are significantly lower. In particular, if considering that the following mean φ V sp values were reported earlier: 0.617 (±0.013) mL/g (RSD = 2.06%) in {dimethyl sulfoxide (1) + water (2)} mixtures, 0.591 (±0.009) mL/g (RSD = 1.54%) in {methanol (1) + water (2)} mixtures, 0.598 (±0.009) mL/g (RSD = 1.51%) in {N-methyl-2-pyrrolidone (1) + water (2)} mixtures, 0.588 (±0.011) mL/g (RSD = 1.82%) in {1,4-dioxane (1) + water (2)} mixtures, 0.705 (±0.024) mL/g (RSD = 3.45%) in {formamide (1) + water (2)} mixtures, 0.668 (±0.012) mL/g (RSD = 1.76%) in {N-methylformamide (1) + water (2)} mixtures, and 0.659 (±0.015) mL/g (RSD = 2.22%) in {N,N-dimethylformamide (1) + water (2)} mixtures, respectively, when considering all the possible mixtures in almost all the binary systems [12].
As it is clearly observed, the relative deviations are higher than 1.0% in almost all binary solvent mixtures but lower than 2.50%, which is commonly accepted during the different stages associated with research and development of homogeneous liquid pharmaceutical dosage forms [69,70,71,72].

4. Conclusions

From all topics discussed previously, it can be concluded that the NaSD solubility in (EtOH + water) mixtures is strongly dependent on temperature and the cosolvent mixture composition. NaSD equilibrium solubility increases with temperature rising, but diminishes with the EtOH proportion increasing in the mixtures at all temperatures studied. Mass/volume percentage logarithmic solubility is adequately correlated with a multivariate model involving a linear effect of temperature and a polynomial effect of mixture composition. Furthermore, the apparent specific volume ( φ V sp ) of NaSD at saturation is also dependent on temperature and ethanol proportion in the mixtures. Thus, φ V sp values diminish as the EtOH proportion decreases in the mixtures from 0.590 mL/g in pure water to 0.171 mL/g in the mixture of w1 = 0.60, but it increases again to 0.230 mL/g in the mixture of w1 = 0.70. Moreover, φ V sp values apparently increase with the temperature rising in pure water, but these values decrease in the composition interval 0.10 ≤ w1 ≤ 0.70. Further, it can be said that the solubility and volumetric data presented in this report expand the physicochemical information about the behavior of saline drugs in mixed aqueous solutions. As described deeply in the literature, this information is highly in demand in the pharmaceutical and chemical laboratories where drug solubilization and/or desolubilization and volumetric contributions toward dissolution processes are required in many industrial processes.

Author Contributions

Conceptualization, D.R.D., F.M., M.Á.P., A.J. and W.E.A.; methodology, D.R.D.; software, D.R.D., F.M. and A.J.; validation, D.R.D., F.M., M.Á.P., A.J. and W.E.A.; formal analysis, D.R.D., F.M., M.Á.P., A.J. and W.E.A.; investigation, D.R.D., F.M., M.Á.P., A.J. and W.E.A.; resources, F.M.; data curation, D.R.D., F.M. and A.J.; writing—original draft preparation, D.R.D., F.M. and A.J.; writing—review and editing, D.R.D., F.M., M.Á.P., A.J. and W.E.A.; visualization, F.M.; supervision, F.M., A.J. and W.E.A.; project administration, F.M.; funding acquisition, F.M. All authors have read and agreed to the published version of the manuscript.

Funding

This research received no external funding.

Institutional Review Board Statement

Not applicable.

Informed Consent Statement

Not applicable.

Data Availability Statement

All generated and required physicochemical data are reported in this manuscript.

Acknowledgments

We thank the Department of Pharmacy of the Universidad Nacional de Colombia for providing us the reagents, equipment, and laboratories used in this research.

Conflicts of Interest

The authors declare no conflicts of interest.

Abbreviations

The following abbreviations are used in this manuscript:
CASChemical Abstract Service
EtOHEthanol
MPD%Mean percentage deviation
NaSDSodium sulfadiazine
RSDRelative standard deviation
% m/mMass/mass percentage
% m/vMass/volume percentage
φ V sp Apparent specific volume

References

  1. Rubino, J.T. Cosolvents and cosolvency. In Encyclopedia of Pharmaceutical Technology; Swarbrick, J.C., Boylan, J., Eds.; Marcel Dekker: New York, NY, USA, 1988; Volume 3, pp. 375–398. [Google Scholar]
  2. Martin, A.; Bustamante, P.; Chun, A.H.C. Physical Pharmacy: Physical Chemical Principles in the Pharmaceutical Sciences, 4th ed.; Lea & Febiger: Philadelphia, PA, USA, 1993; pp. 221–235. [Google Scholar]
  3. Yalkowsky, S.H. Solubility and Solubilization in Aqueous Media; American Chemical Society and Oxford University Press: New York, NY, USA, 1999; pp. 180–235. [Google Scholar]
  4. Florence, A.T.; Attwood, D. Physicochemical Principles of Pharmacy, 5th ed.; Pharmaceutical Press: London, UK, 2011; pp. 53–88. [Google Scholar]
  5. Budavari, S.; O’Neil, M.J.; Smith, A.; Heckelman, P.E.; Obenchain, J.R., Jr.; Gallipeau, J.A.R.; D’Arecea, M.A. The Merck Index: An Encyclopedia of Chemicals, Drugs, and Biologicals, 13th ed.; Merck & Co., Inc.: Whitehouse Station, NJ, USA, 2001; p. 1586. [Google Scholar]
  6. Gelone, S.; O’Donell, J.A. Anti-Infectives. In Remington: The Science and Practice of Pharmacy, 21st ed.; Gennaro, A.R., Ed.; Lippincott Williams & Wilkins: Philadelphia, PA, USA, 2005; pp. 1630–1633. [Google Scholar]
  7. MacDougall, C. Sulfonamides, trimethoprim-sulfamethoxazole, quinolones, and agents for urinary tract infections. In Goodman & Gilman's The Pharmacological Basis of Therapeutics, 13th ed.; Brunton, L.L., Hilal-Dandan, R., Knollmann, B.C., Eds.; McGraw-Hill: New York, NY, USA, 2017; pp. 1011–1021. [Google Scholar]
  8. Delgado, D.R.; Martínez, F. Thermodynamic study of the solubility of sodium sulfadiazine in some ethanol + water cosolvent mixtures. Vitae 2010, 17, 191–198. [Google Scholar]
  9. Delgado, D.R.; Martínez, F.; Fakhree, M.A.A.; Jouyban, A. Study of the solubility of some sodium sulfonamides in ethanol + water cosolvent mixtures and correlation with the Jouyban-Acree model. Biomed. Int. 2011, 2, 5–11. [Google Scholar]
  10. Delgado, D.R.; Vargas, E.F.; Martínez, F. Thermodynamics of mixing of some sodium sulfonamides in ethanol + water cosolvent mixtures. Vitae 2011, 18, 192–200. [Google Scholar] [CrossRef]
  11. Muñoz, M.M.; Rodríguez, C.J.; Delgado, D.R.; Peña, M.Á.; Jouyban, A.; Martínez, F. Solubility and saturation apparent specific volume of some sodium sulfonamides in propylene glycol + water mixtures at 298.15 K. J. Mol. Liq. 2015, 211, 192–196. [Google Scholar] [CrossRef]
  12. Muñoz, M.M.; Martinez, F.; Delgado, D.R.; Jouyban, A.; Acree, W.E., Jr. Equilibrium solubility and apparent specific volume at saturation of sodium sulfadiazine in some aqueous cosolvent mixtures at 298.2 K. Phys. Chem. Liq. 2021, 59, 40–52. [Google Scholar] [CrossRef]
  13. Delgado, D.R.; Vargas, E.F.; Martínez, F. Apparent molar volumes of some sodium sulfonamides in water at several concentrations and temperatures. J. Solution Chem. 2011, 40, 1955–1963. [Google Scholar] [CrossRef]
  14. Rodríguez, G.A.; Martínez, F.; Vargas, E.F. Volumetric and acoustic properties of some sodium sulfonamides in dilute aqueous solutions at several temperatures. J. Chem. Thermodyn. 2018, 118, 159–164. [Google Scholar] [CrossRef]
  15. Galindres, D.M.; Rodríguez, G.A.; Martínez, F.; Vargas, E.F. Molar electrical conductivity of sodium sulfonamides in aqueous solution at several temperatures. J. Mol. Liq. 2019, 287, 110984. [Google Scholar] [CrossRef]
  16. Gong, Y.; Grant, D.J.W.; Brittain, H.G. Principles of Solubility. In Solvent Systems and Their Selection in Pharmaceutics and Biopharmaceutics; Augustijns, P., Brewster, M.E., Eds.; American Association of Pharmaceutical Scientists; Springer: New York, NY, USA, 2007; pp. 1–27. [Google Scholar]
  17. Jouyban, A. Handbook of Solubility Data for Pharmaceuticals; CRC Press: Boca Raton, FL, USA, 2010; pp. 69–505. [Google Scholar]
  18. Farhadieh, B. Determination of CMC and partial specific volume of Polysorbates 20, 60, and 80 from densities of their aqueous solutions. J. Pharm. Sci. 1973, 62, 1685–1688. [Google Scholar] [CrossRef]
  19. Yalkowsky, S.H.; Zografi, G. Calculation of partial molal volume in micellar systems. J. Pharm. Sci. 1972, 61, 793–795. [Google Scholar] [CrossRef]
  20. Sommer, C.; Pedersen, J.S.; Stein, P.C. Apparent specific volume measurements of poly(ethylene oxide), poly(butylene oxide), poly(propylene oxide), and octadecyl chains in the micellar state as a function of temperature. J. Phys. Chem. B 2004, 108, 6242–6249. [Google Scholar] [CrossRef] [PubMed]
  21. Sarazin, D.; Francois, J. Apparent specific volumes of polymers in dilute solutions. Polymer 1983, 24, 547–552. [Google Scholar] [CrossRef]
  22. Ford, T.F.; Ramsdell, G.A.; Alexander, T.G. Apparent specific volume of the calcium caseinate–calcium phosphate complex in milk. J. Dairy Sci. 1959, 42, 397–408. [Google Scholar] [CrossRef]
  23. DeMoll, E.; Cox, D.J.; Daniel, E.; Riggs, A.F. Apparent specific volume of human hemoglobin: Effect of ligand state and contribution of heme. Anal. Biochem. 2007, 363, 196–203. [Google Scholar] [CrossRef] [PubMed]
  24. Hildebrand, J.H.; Prausnitz, J.M.; Scott, R.L. Regular and Related Solutions; Van Nostrand Reinhold: New York, NY, USA, 1970; pp. 142–165. [Google Scholar]
  25. Martin, A.; Bustamante, P. El parámetro de solubilidad en las ciencias farmacéuticas. Anal. Real Acad. Farm. 1989, 55, 175–202. [Google Scholar]
  26. Liron, Z.; Cohen, S. Densitometric determination of the solubility parameter and molal volume of compounds of medicinal relevance. J. Pharm. Sci. 1983, 72, 499–504. [Google Scholar] [CrossRef]
  27. Pardo, A.; Shiri, Y.; Cohen, S. Partial molal volumes and solubilities of physostigmine in isopropanol:isopropyl myristate solvents in relation to skin penetrability. J. Pharm. Sci. 1991, 80, 567–572. [Google Scholar] [CrossRef]
  28. Liron, Z.; Cohen, S. Percutaneous absorption of alkanoic acids II: Application of regular solution theory. J. Pharm. Sci. 1984, 73, 538–542. [Google Scholar] [CrossRef]
  29. Kadir, R.; Stempler, D.; Liron, Z.; Cohen, S. Delivery of theophylline into excised human skin from alkanoic acid solutions: A “push-pull” mechanism. J. Pharm. Sci. 1987, 76, 774–779. [Google Scholar] [CrossRef]
  30. Kadir, R.; Stempler, D.; Liron, Z.; Cohen, S. Penetration of theophylline and adenosine into excised human skin from binary and ternary vehicles: Effect of a nonionic surfactant. J. Pharm. Sci. 1989, 78, 149–153. [Google Scholar] [CrossRef]
  31. Cohen, S.; Goldschmid, A.; Shtacher, G.; Srebrenik, S. Non-specific inhalation stimulants as a special case in the theory of anesthesia. In Molecular and Quantum Pharmacology; Bergmann, E., Pullman, B., Eds.; D. Keidel Publishing Company: Dordrecht, Holland, 1974; pp. 537–548. [Google Scholar]
  32. Fukushima, K.; Kamaya, H.; Ueda, I. High pressure and anesthesia: Compressibility, molal volume, and partial molal volume of volatile anesthetics. J. Pharm. Sci. 1990, 79, 893–896. [Google Scholar] [CrossRef] [PubMed]
  33. Iqbal, M.; Jamal, M.A.; Ahmed, M.; Ahmed, B. Partial molar volumes of some drugs in water and ethanol at 35 °C. Can. J. Chem. 1994, 72, 1076–1079. [Google Scholar] [CrossRef]
  34. Iqbal, M.; Verall, R.E. Apparent molar volume and adiabatic compressibility studies of aqueous solutions of some drug compounds at 25 °C. Can. J. Chem. 1989, 67, 727–735. [Google Scholar] [CrossRef]
  35. Pandey, J.D.; Mishra, K.; Shukla, A.; Rai, R.D. Ultrasonic and thermodynamic studies of tetracyclines in solutions. Can. J. Chem. 1987, 65, 303–306. [Google Scholar] [CrossRef]
  36. Shahidi, F. Partial molar volumes of phenalkylamines and their physiologically active derivatives in water. Can. J. Chem. 1987, 65, 1924–1926. [Google Scholar] [CrossRef]
  37. Leduc, P.A.; Fortier, J.L.; Desnoyers, J.E. Apparent molal volumes, heat capacities, and excess enthalpies of n-alkylamine hydrobromides in water as a function of temperature. J. Phys. Chem. 1974, 78, 1217–1225. [Google Scholar] [CrossRef]
  38. Rodríguez, H.; Soto, A.; Arce, A.; Khoshkbarchi, M.K. Apparent molar volume, isentropic compressibility, refractive index, and viscosity of DL-Alanine in aqueous NaCl solutions. J. Solution Chem. 2003, 32, 53–63. [Google Scholar] [CrossRef]
  39. Ruso, J.M.; Gonzalez-Perez, A.; Prieto, G.; Sarmiento, F.A. Volumetric study of two related amphiphilic beta-blockers as a function of temperature and electrolyte concentration. Colloids Surf. B Biointerfaces 2004, 11, 165–175. [Google Scholar] [CrossRef]
  40. Sadeghi, R.; Ziamajidi, F. Volumetric and isentropic compressibility behavior of aqueous solutions of (polyvinylpyrrolidone + sodium citrate) at T = (283.15 to 308.15) K. J. Chem. Thermodyn. 2007, 39, 1118–1124. [Google Scholar] [CrossRef]
  41. Banipal, T.S.; Singh, H.; Banipal, P.K. Volumetric and viscometric properties of some sulfa drugs in aqueous solutions of sodium chloride at T = (288.15 to 318.15) K. J. Chem. Eng. Data 2010, 55, 3872–3881. [Google Scholar] [CrossRef]
  42. Birch, G.G.; Kemp, S.E. Apparent specific volumes and tastes of amino acids. Chem. Senses 1989, 14, 249–258. [Google Scholar] [CrossRef]
  43. Spillane, W.J.; Morini, G.; Birch, G.G. Determination of apparent molar volumes (AMV) and capacity factors (kw) for sweet and non-sweet sulphamates, correlation between AMV values, and Corey-Pauling-Koltun volumes and relative sweetness correlations. Food Chem. 1992, 44, 337–342. [Google Scholar] [CrossRef]
  44. Birch, G.G.; Karim, R.; Lopez, A. Novel aspects of structure-activity relationships in sweet taste chemoreception. Food Qual. Prefer. 1994, 5, 87–93. [Google Scholar] [CrossRef]
  45. Birch, G.G.; Parke, S.; Siertsema, R.; Westwell, J.M. Specific volumes and sweet taste. Food Chem. 1996, 56, 223–230. [Google Scholar] [CrossRef]
  46. Birch, G.G.; Parke, S.; Siertsema, R.; Westwell, J.M. Importance of molar volumes and related parameters in sweet taste chemoreception. Pure Appl. Chem. 1997, 69, 685–692. [Google Scholar] [CrossRef]
  47. Lopez-Chavez, A.; Birch, G.G. The hydrostatic and hydrodynamic volumes of polyols in aqueous solutions and their sweet taste. Chem. Senses 1997, 22, 149–161. [Google Scholar] [CrossRef] [PubMed]
  48. Birch, G.G.; Haywood, K.A.; Hanniffy, G.G.; Coyle, C.M.; Spillane, W.J. Apparent specific volumes and tastes of cyclamates, other sulfamates, saccharins and acesulfame sweeteners. Food Chem. 2004, 84, 429–435. [Google Scholar] [CrossRef]
  49. Cárdenas, Z.J.; Jiménez, D.M.; Martínez, F. Solubility and saturation apparent volume of Propranolol Hydrochloride in some binary aqueous cosolvent mixtures at 298.15 K. J. Chem. Eng. Data 2015, 60, 1520–1525. [Google Scholar] [CrossRef]
  50. Jiménez, D.M.; Cárdenas, Z.J.; Martínez, F. Solubility and apparent specific volume of some pharmaceutical salts in propylene glycol + water mixtures at 298.15 K. Chem. Eng. Commun. 2016, 203, 1013–1019. [Google Scholar] [CrossRef]
  51. Muñoz, M.M.; Almanza, O.A.; Peña, M.Á.; Jouyban, A.; Martínez, F.; Acree, W.E., Jr. Solubility and apparent specific volume at saturation of some pharmaceutical salts in methanol + water mixtures at 298.15 K. J. Mol. Liq. 2016, 220, 842–847. [Google Scholar] [CrossRef]
  52. Echeverry, L.C.; Muñoz, M.M.; Tinjacá, D.A.; Martinez, F.; Peña, M.A.; Rahimpour, E.; Jouyban, A.; Acree, W.E., Jr. Equilibrium solubility and apparent specific volume of lidocaine.HCl.H2O in some {cosolvent (1) + water (2)} mixtures at 298.2 K. Phys. Chem. Liq. 2019, 57, 679–688. [Google Scholar] [CrossRef]
  53. Muñoz, M.M.; Romdhani, A.; Tinjacá, D.A.; Martinez, F.; Echeverry, L.C.; Peña, M.A.; Rahimpour, E.; Jouyban, A.; Acree, W.E., Jr. Equilibrium solubility and apparent specific volume at saturation of sodium diclofenac in {formamide (1)/N-methylformamide (1)/or N,N,-dimethylformamide (1) + water (2)} mixtures at 298.2 K. Phys. Chem. Liq. 2019, 58, 446–455. [Google Scholar] [CrossRef]
  54. Nail, S.; Hem, S.L. Physical-chemical principles. In Pharmaceutics and Pharmacy Practice; Banker, G.S., Chalmers, R.K., Eds.; Lippincott: Philadelphia, PA, USA, 1982; pp. 47–84. [Google Scholar]
  55. Wells, J.I. Pharmaceutical Preformulation: The Physicochemical Properties of Drug Substances; Ellis Horwood, Ltd.: Chichester, UK, 1988; pp. 21–102. [Google Scholar]
  56. Higuchi, T.; Connors, K. Advances in Analytical Chemistry and Instrumentation; Interscience Publishers, Inc.: New York, NY, USA, 1965. [Google Scholar]
  57. Mader, W.J.; Higuchi, T. Phase solubility analysis. C R C Crit. Rev. Anal. Chem. 1970, 1, 193–215. [Google Scholar] [CrossRef]
  58. Ansel, H.C.; Stoklosa, M.J. Pharmaceutical Calculations, 12th ed.; Lippincott, Williams & Wilkins: Baltimore, MD, USA, 2006; pp. 79–98. [Google Scholar]
  59. Bevington, P.R. Data Reduction and Error Analysis for the Physical Sciences; McGraw-Hill Book, Co.: New York, NY, USA, 1969. [Google Scholar]
  60. Carstensen, J.T. Modeling and Data Treatment in the Pharmaceutical Sciences; Technomic Publishing Co., Inc.: Lancaster, PA, USA, 1996. [Google Scholar]
  61. Barrante, J.R. Applied Mathematics for Physical Chemistry, 2nd ed.; Prentice Hall, Inc.: Upper Saddle River, NJ, USA, 1998. [Google Scholar]
  62. Palatnik, L.S.; Landau, A.I. Phase Equilibria in Multicomponent Systems; Holt, Rinehart and Winston, Inc.: New York, NY, USA, 1964; pp. 2–3. [Google Scholar]
  63. Gamboa, R. Diagramas Ternarios: Teoría y Ejercicios; Dextra Editorial S.L.: Madrid, Spain, 2018. [Google Scholar]
  64. Rahimpour, E.; Alvani-Alamdari, S.; Acree, W.E., Jr.; Jouyban, A. Drug solubility correlation using the Jouyban–Acree model: Effects of concentration units and error criteria. Molecules 2022, 27, 1998. [Google Scholar] [CrossRef] [PubMed]
  65. Jiménez, J.; Manrique, J.; Martínez, F. Effect of temperature on some volumetric properties for ethanol + water mixtures. Rev. Colomb. Cienc. Quím. Farm. 2004, 33, 145–155. [Google Scholar]
  66. Rodríguez, G.A.; Delgado, D.R.; Martínez, F.; Khoubnasabjafari, M.; Jouyban, A. Volumetric properties of some pharmaceutical binary mixtures at low temperatures and correlation with the Jouyban-Acree model. Rev. Colomb. Cienc. Quím. Farm. 2011, 40, 222–239. [Google Scholar]
  67. Parke, S.A.; Birch, G.G. Solution properties of ethanol in water. Food Chem. 1999, 67, 241–246. [Google Scholar] [CrossRef]
  68. Jouyban, A.; Acree, W.E., Jr. A single model to represent physico-chemical properties of liquid mixtures at various temperatures. J. Mol. Liq. 2011, 323, 115054. [Google Scholar] [CrossRef]
  69. Carstensen, J.T. Theory of Pharmaceutical Systems. I. General Principles; Academic Press, Inc.: New York, NY, USA, 1972; pp. 1–55. [Google Scholar]
  70. Allen, L.V., Jr.; Ansel, H.C. Ansel’s Pharmaceutical Dosage Forms and Drug Delivery Systems, 10th ed.; Wolters Kluwer: Philadelphia, PA, USA, 2014; pp. 396–444. [Google Scholar]
  71. Álvarez-Lorenzo, C.; Concheiro-Nine, Á. Aseguramiento de la calidad. In Tratado de Tecnología Farmacéutica. Volumen III: Formas de Dosificación; Martínez-Pacheco, R., Ed.; Editorial Sintesis: Madrid, Spain, 2017; pp. 369–439. [Google Scholar]
  72. Murdan, S. Solutions. In Aulton’s Pharmaceutics: The Design and Manufacture of Medicines, 6th ed.; Taylor, K.M.G., Aulton, M.E., Eds.; Elsevier Ltd.: Amsterdam, The Netherlands, 2022; pp. 386–396. [Google Scholar]
Figure 1. Molecular structure of sodium sulfadiazine (NaSD).
Jpbi 02 00005 g001
Figure 2. Equilibrium solubility of sodium sulfadiazine expressed in mass/volume percentage in some aqueous alcoholic mixtures as a function of the ethanol mass fraction at different temperatures. Trends from top to bottom: 35.0 °C, 30.0 °C, 25.0 °C, 20.0 °C, 15.0 °C, 10.0 °C, and 5.0 °C.
Jpbi 02 00005 g002
Figure 3. Equilibrium solubility of sodium sulfadiazine in some aqueous alcoholic mixtures as a function of temperature expressed in mass/volume percentage. Jpbi 02 00005 i001: neat water; Jpbi 02 00005 i002: w1 = 0.10; Jpbi 02 00005 i003: w2 = 0.20; Jpbi 02 00005 i004: w1 = 0.30; Jpbi 02 00005 i005: w1 = 0.40; Jpbi 02 00005 i006: w1 = 0.50; Jpbi 02 00005 i007: w2 = 0.60; Jpbi 02 00005 i008: w1 = 0.70; Jpbi 02 00005 i009: w1 = 0.80; Jpbi 02 00005 i010: w1 = 0.90; Jpbi 02 00005 i011: neat ethanol.
Jpbi 02 00005 g003
Figure 4. Equilibrium solubility of sodium sulfadiazine expressed in mass/mass percentage in some aqueous alcoholic mixtures as a function of the mixture composition at different temperatures. Trends from top to bottom: 35.0 °C, 25.0 °C, 15.0 °C, and 5.0 °C.
Jpbi 02 00005 g004
Figure 5. Density of saturated solutions of sodium sulfadiazine in some aqueous alcoholic mixtures as a function of temperature. Jpbi 02 00005 i001: neat water; Jpbi 02 00005 i002: w1 = 0.10; Jpbi 02 00005 i003: w2 = 0.20; Jpbi 02 00005 i004: w1 = 0.30; Jpbi 02 00005 i005: w1 = 0.40; Jpbi 02 00005 i006: w1 = 0.50; Jpbi 02 00005 i007: w2 = 0.60; Jpbi 02 00005 i008: w1 = 0.70; Jpbi 02 00005 i009: w1 = 0.80; Jpbi 02 00005 i010: w1 = 0.90; Jpbi 02 00005 i011: neat ethanol.
Jpbi 02 00005 g005
Figure 6. Density of some aqueous alcoholic mixtures free of sodium sulfadiazine as a function of temperature. Jpbi 02 00005 i001: neat water; Jpbi 02 00005 i002: w1 = 0.10; Jpbi 02 00005 i003: w2 = 0.20; Jpbi 02 00005 i004: w1 = 0.30; Jpbi 02 00005 i005: w1 = 0.40; Jpbi 02 00005 i006: w1 = 0.50; Jpbi 02 00005 i007: w2 = 0.60; Jpbi 02 00005 i008: w1 = 0.70; Jpbi 02 00005 i009: w1 = 0.80; Jpbi 02 00005 i010: w1 = 0.90; Jpbi 02 00005 i011: neat ethanol.
Jpbi 02 00005 g006
Figure 7. Density of saturated solutions of sodium sulfadiazine (○) and density of aqueous alcoholic mixtures free of drug (□) in some aqueous alcoholic mixtures as a function of the mixtures composition at 25.0 °C.
Jpbi 02 00005 g007
Figure 8. Density of saturated solutions of sodium sulfadiazine in pure water (○) and density of pure water free of drug (□) as a function of temperature.
Jpbi 02 00005 g008
Figure 9. Apparent specific volume of sodium sulfadiazine at saturation in aqueous alcoholic mixtures as a function of ethanol mass fraction at several temperatures. Jpbi 02 00005 i005: 5.0 °C; Jpbi 02 00005 i006: 10.0 °C; Jpbi 02 00005 i007: 15.0 °C; Jpbi 02 00005 i008: 20.0 °C; Jpbi 02 00005 i009: 25.0 °C; Jpbi 02 00005 i010: 30.0 °C; Jpbi 02 00005 i011: 35.0 °C.
Jpbi 02 00005 g009
Figure 10. Apparent specific volume of sodium sulfadiazine at saturation in aqueous alcoholic mixtures as a function of temperature. Jpbi 02 00005 i005: neat water; Jpbi 02 00005 i006: w1 = 0.10; Jpbi 02 00005 i007: w2 = 0.20; Jpbi 02 00005 i008: w1 = 0.30; Jpbi 02 00005 i009: w1 = 0.40; Jpbi 02 00005 i010: w1 = 0.50; Jpbi 02 00005 i011: w1 = 0.60; Jpbi 02 00005 i012: w1 = 0.70.
Jpbi 02 00005 g010
Table 1. Equilibrium solubility of sodium sulfadiazine in aqueous alcoholic mixtures at different temperatures expressed in mass/volume percentage (% m/v).
w1 aTemperature (°C) b
5.010.015.020.025.030.035.0
0.0046.9048.3349.7351.0652.2953.7255.15
0.1037.0538.6640.2441.7243.2844.7446.14
0.2027.5329.1430.8432.3934.1435.7237.35
0.3018.9220.1921.6323.0624.3425.8127.30
0.4012.8913.8914.9315.8917.0618.2119.22
0.507.828.359.089.7910.5011.1511.92
0.604.434.795.155.495.926.336.73
0.702.352.522.692.883.053.233.42
0.800.9040.9541.011.051.101.151.19
0.900.2480.2600.2720.2820.2930.3040.312
1.000.0360.0370.0380.0390.0400.0410.043
a w1 is the mass fraction of ethanol in the binary mixtures free of sodium sulfadiazine. b Mean relative uncertainty in mass/volume percentage solubility is 2.0%.
Table 2. Equilibrium solubility of sodium sulfadiazine in aqueous alcoholic mixtures at different temperatures expressed in mass/mass percentage (% m/m).
w1 aTemperature (°C) b
5.010.015.020.025.030.035.0
0.0039.1440.1841.1942.1843.1344.1245.07
0.1032.2233.3834.5335.6136.7037.7438.72
0.2025.0826.3027.5428.6930.0331.2132.44
0.3018.0119.1120.1821.3022.3323.5124.65
0.4012.7713.6614.5615.3716.4017.4118.28
0.508.078.589.279.9310.6011.2011.92
0.604.755.135.515.876.316.747.16
0.702.622.823.013.243.433.653.87
0.801.041.111.171.221.291.361.42
0.900.2970.3130.3290.3430.3580.3740.386
1.000.0440.0460.0480.0500.0510.0530.055
a w1 is the mass fraction of ethanol in the binary mixtures free of sodium sulfadiazine. b Mean relative standard deviation in mass percentage solubility is 2.0%.
Table 3. Jouyban–Acree and Jouyban–Acree–van’t Hoff models parameters for equilibrium solubility of sodium sulfadiazine in aqueous alcoholic mixtures at different temperatures.
Jouyban–Acree Model
Scale J0J1J2MPD%
Molar 2251.5231343.278912.1847.1
Mole fraction 1951.1671365.791966.5196.9
% mass/volume 2261.9261362.768939.0248.1
% mass/mass 2257.0241395.509937.1517.3
Jouyban–Acree–van’t Hoff Model
ScaleA1B1A2B2J0J1J2MPD%
Molar−3.893−770.6762.191−457.9962251.2061342.885911.3917.1
Mole fraction−7.346−598.184−0.816−662.8261950.8411365.970965.7036.9
% mass/volume−1.595−482.3875.495−457.9902262.1161363.003939.4978.1
% mass/mass−0.885−621.2865.114−402.2092256.7571395.700936.4837.3
MPD, mean percentage deviation.
Table 4. Density of saturated solutions of sodium sulfadiazine in aqueous alcoholic mixtures (ρ1+2/g/mL) at different temperatures.
w1 aTemperature (°C) b
5.010.015.020.025.030.035.0
0.001.19831.20281.20741.21061.21241.21751.2236
0.101.14981.15831.16521.17141.17931.18551.1918
0.201.09791.10781.11971.12891.13691.14461.1513
0.301.05071.05651.07161.08261.08981.09801.1074
0.401.00971.01721.02571.03411.04031.04621.0518
0.500.96860.97380.97960.98580.99040.99571.0001
0.600.93210.93370.93470.93570.93740.93820.9401
0.700.89670.89450.89240.88990.88810.88570.8831
0.800.86690.86290.85830.85450.85000.84940.8410
0.900.83590.83210.82690.82210.81730.81220.8073
1.000.80350.79900.79460.79100.78730.78350.7793
a w1 is the mass fraction of ethanol in the binary mixtures free of sodium sulfadiazine. b Mean uncertainty in density of saturated solutions is 0.0010 g/mL.
Table 5. Difference in density of saturated solutions of sodium sulfadiazine and aqueous alcoholic mixtures free of drug (Δρ/g/mL) at different temperatures.
w1 aTemperature (°C) b
5.010.015.020.025.030.035.0
0.000.19830.20300.20820.21240.21540.22180.2296
0.100.16380.17330.18160.18960.19910.20680.2151
0.200.12390.13520.14890.16030.17030.18070.1901
0.300.08790.09650.11440.12880.13890.15060.1633
0.400.06370.07440.08640.09890.10820.11850.1277
0.500.04290.05160.06120.07200.08040.08980.0984
0.600.02810.03370.03790.04460.05020.05530.0608
0.700.01590.01770.01880.02220.02440.02650.0284
0.800.01000.01040.00900.01100.01080.01470.0099
0.900.00440.00500.00310.00410.00410.00280.0015
1.000.00110.0007−0.00060.00150.00200.00240.0026
a w1 is the mass fraction of ethanol in the binary mixtures free of sodium sulfadiazine. b Mean uncertainty in density differences is 0.0015 g/mL.
Table 6. Apparent specific volume of sodium sulfadiazine at saturation ( φ V sp /mL/g) in several aqueous alcoholic mixtures at several temperatures.
w1 aTemperature (°C) b
5101520253035
0.000.5770.5800.5820.5850.5900.5900.587
0.100.5660.5600.5580.5560.5510.5500.547
0.200.5650.5510.5330.5210.5180.5130.511
0.300.5560.5440.4920.4630.4520.4400.425
0.400.5350.4930.4480.4040.3920.3760.363
0.500.4870.4140.3550.2890.2580.2150.194
0.600.4040.3300.2930.2110.1710.1420.110
0.700.3650.3390.3460.2640.2300.2090.198
0.80 c−0.120−0.1020.127−0.0600.013−0.3330.209
0.90 c−0.915−1.129−0.170−0.553−0.5060.1110.657
1.00 c−2.483−1.2433.243−3.582−5.040−6.136−6.430
a w1 is the mass fraction of ethanol in the binary mixtures free of sodium sulfadiazine. b Mean uncertainty in the apparent specific volume of sodium sulfadiazine is 0.009 mL/g. c Values in italics are not considered for analysis owing negative or low values.
Disclaimer/Publisher’s Note: The statements, opinions and data contained in all publications are solely those of the individual author(s) and contributor(s) and not of MDPI and/or the editor(s). MDPI and/or the editor(s) disclaim responsibility for any injury to people or property resulting from any ideas, methods, instructions or products referred to in the content.