Abstract
This study aimed to compare the efficiency of two methods for airborne surface decontamination: hydrogen peroxide vapor (HPV) and aerosolized hydrogen peroxide (aHP). Spores of G. stearothermophilus and B. atrophaeus were exposed to a 35% hydrogen peroxide solution under controlled laboratory conditions, including specific concentrations, exposure durations, humidity levels, and temperatures. Following each decontamination procedure, the spores were incubated for 7 days to evaluate bacterial growth and assess the efficacy of each method. The results indicate that the aHP method achieved biocidal rates of 84.76% for G. stearothermophilus and 89.52% for B. atrophaeus, while the HPV method demonstrated respective rates of 90.95% and 90.48%. These findings suggest that both the aHP and HPV methods are highly effective for microbial decontamination, with HPV showing a slight edge in overall efficacy. However, despite its comparable effectiveness, the HPV method has raised concerns regarding technical and economic factors. Observations highlighted issues such as fluctuations in humidity levels causing surface damage, a problem not encountered with the aHP method. Economically, HPV requires specific devices that can cost up to EUR 50,000, whereas aHP equipment costs do not exceed EUR 10,000. These observations emphasize the importance of critically evaluating the pros and cons of each decontamination method, taking into account factors such as biocidal efficacy, technical feasibility, and the associated costs.
Keywords:
hydrogen peroxide; aerosol; vapor; decontamination; G. stearothermophilus; B. atrophaeus; spores 1. Introduction
Airborne surface decontamination (ASD) is a crucial practice for minimizing the risk of infections, particularly in areas such as human and animal health, food industry, research, and any field where potentially harmful microorganisms are present [1,2,3,4,5]. This process aims to eliminate microorganisms and prevent cross-contamination. ASD is applied in specific scenarios such as (i) before the scheduled maintenance of a laboratory; (ii) before entering or exiting large equipment requiring handling; (iii) before the on-site maintenance of contaminated devices or systems; or (iv) after the accidental spillage of infectious material. Additionally, ASD is applied in clean rooms to maintain sterility and prevent contamination [6]. It is crucial to recognize that ASD primarily targets surface decontamination rather than air decontamination. The NF EN 17272:2020 European standard for Disinfection Methods by Air and Automated Processes partially supersedes the NF T 72281 standard approved in November 2014. It provides guidelines for evaluating the microbiological effectiveness of ASD, simulating real-world conditions, and considering various environmental factors [7].
There are two types of ASD processes: manual processes conducted in the presence of staff, where decontaminating agents are specifically applied to a defined zone, and automated processes carried out without direct human intervention, where decontaminating agents are dispersed throughout the environment to reach all surfaces [8,9]. The ASD automated cycle comprises several stages: optional preconditioning, product dispersion, a contact phase to ensure decontamination efficacy, and finally, an extraction phase to remove residues before reoccupying the area [10]. Formaldehyde, historically employed for automated ASD because of its wide-ranging effectiveness and cost, has been reclassified in Europe as a class 1B carcinogen and class 2 mutagen [11]. These changes, along with worries about extended exposure times and the presence of residues linked to formaldehyde emissions, have initiated the search for a safer and more effective substitute. Hydrogen peroxide (H2O2) decontamination presents robust antimicrobial properties and environmental compatibility. Its oxidative nature renders its effectiveness against a broad spectrum of microorganisms, from bacteria to spores. Furthermore, the decomposition by-products of hydrogen peroxide are non-toxic, positioning it as a safer substitute for conventional decontaminants.
Two primary automated ASD methods based on hydrogen peroxide, aerosolized hydrogen peroxide (aHP), and hydrogen peroxide vapor (HPV) are commonly employed for comprehensive decontamination [8,9,12,13,14]. There are several differences between the two approaches. Firstly, there is a significant difference in the concentration of the products used. Vapors are generated from a 20% to 55% H2O2 solution, whereas in aerosols, the active solution consists of a 5% to 12% H2O2 solution. Additionally, HPV generators operate at high temperatures, where the solution passes through a heating plate at over 140 °C, allowing it to transform into vapor, while aerosol generators operate at cold pressures. HPV generators produce a more or less homogeneous, condensing, or micro-condensing vapor, with particle sizes of about 0.1 to 1 μm, whereas aerosol generators produce a non-homogeneous dry mist of particles ranging from 0.5 to 10 μm in size. Regarding efficacy, the sporicidal concentrations required with hydrogen peroxide vapors range from 150 to 750 ppm (0.2 to 1 mg/L), but higher concentrations are commonly used. When aerosolized hydrogen peroxide systems are used, the final concentration of decontaminants is much lower, between 2 and 160 ppm depending on the experimental system [8,9].
Previous studies have been conducted but under different operational conditions of the hydrogen peroxide concentration [12,13]. Our study aimed to compare the biocidal efficacy of aHP and HPV processes under similar experimental conditions. By utilizing a standardized 35% H2O2 solution, we assessed the effectiveness of each method in eradicating biological spores of G. stearothermophilus and B. atrophaeus, which are crucial indicators of microbial contamination. By providing scientific evidence on the comparative performance of these decontamination techniques, our study seeks to inform decision making and enhance best practices in surface decontamination protocols.
2. Materials and Methods
2.1. Preparation of Laboratory
All experiments were conducted in a biosafety level 3 (BSL3) laboratory with an internal volume of 37 m3. The laboratory was equipped with a class II biosafety cabinet (BCCII), which operated by recirculating air in the laboratory through a double HEPA filter, a double-door autoclave, a benchtop, electronic equipment, and other essential laboratory equipment. The facility included 20 sampling points for both biological and chemical indicators (Table 1). The aerosolized hydrogen peroxide process (aHP) was carried out using the aerosolizer device, operating with a peristaltic pump, while the hydrogen peroxide vapor process (HPV) was generated by a vaporizer operating at a hot pressure. Each device was positioned at the same position inside the laboratory during the decontamination cycles (DCs). A 35% solution of hydrogen peroxide was dispersed at a concentration of 4.5 ± 1 g/m3. The DCs consisted of four phases: 20 min of conditioning, 8 min of dispersion, 120 min of contact, and approximately 60 or 90 min of extraction, depending on the specific DCs. The extraction phase was facilitated using the air-handling system. Throughout the decontamination cycles, all doors of the BSL3 laboratory remained closed, and the biological safety cabinet remained open and powered on to monitor the dispersibility of H2O2. The decontamination cycle was considered complete when the readings on the electrochemical sensor were less than or equal to 1 ppm within the room. Prior to the decontamination cycles (DCs), the ventilation zone was set at rest, and we monitored the temperature and relative humidity (RH). If the relative humidity (RH) exceeded 50%, it was reduced to a range of 45 to 50% using a dehumidifier. If the RH was below 50%, it was increased using a device loaded with distilled water, a process that typically took an average of 20 min.

Table 1.
Biological and chemical indicators’ positions.
2.2. Biological Indicators (IBs)
The microbiological effectiveness of the processes was evaluated using two commercially available spore strains commonly employed to validate decontamination cycles: Geobacillus stearothermophilus (ATCC 12980, MesaLabs Apex Discs) and Bacillus atrophaeus (ATCC 9372, MesaLabs Apex Discs), each at a concentration of 106 spores per disc, housed in Tyvek® envelopes. After each DC, the biological indicators were aseptically collected and removed from the Tyvek envelopes. Subsequently, they were transferred into 10 mL of tryptic soy broth (TSB, Biomérieux, France) and incubated at 56 °C for G. stearothermophilus spores and at 37 °C for B. atrophaeus spores. The positive (c +) and negative (c −) controls comprised culture media with and without coupons exposed to DCs, respectively. The cultures were monitored for bacterial growth for 7 days, with turbidity indicating the growth of the biological indicators.
2.3. Chemical Indicators
The HPV-CI chemical indicator (Room CI—Ref L617307—Bioquell, Champigny-sur-Marne, France) was utilized to assess the uniform distribution of hydrogen peroxide vapor (H2O2) throughout the environment and to validate the biocidal efficacy of the decontamination cycles. This indicator is a single-use device specifically designed for compatibility with Bioquell hydrogen peroxide vapor (HPV) bio-decontamination systems. It provides a visual confirmation that sufficient exposure to H2O2 has occurred, ensuring effective decontamination. The indicator consists of a card infused with a color-changing reagent that reacts upon contact with hydrogen peroxide vapor. Upon completion of the decontamination cycle, the resultant color change is compared with the pre-printed reference colors on the card. These reference colors correlate with different levels of bioburden reduction, providing a visual indication of the decontamination efficacy, ranging from 2-log to greater than 6-log reductions. For simplified interpretation, the results were categorized by color: red indicating a 2-log reduction, yellow indicating a reduction below 6 log, and green representing a reduction exceeding 6 log.
2.4. Monitoring of Humidity, Temperature, and Hydrogen Peroxide Levels
The temperature and relative humidity values were monitored using electronic measuring probes (LABGUARD, Biomérieux, France), which recorded the information in real time and transmitted it to the LAB-GUARD 3D software 3. The H2O2 concentration (ppm) was recorded for the HPV device and by electrochemical capture (Dräger Sensor H2O2 HC) at the conclusion of the DCs before allowing the entry of workers.
3. Results
3.1. DC Parameters
Six decontamination cycles were conducted: three for aerosolized hydrogen peroxide (aHP) and three for vaporized hydrogen peroxide (HPV) (Figure 1). Each cycle lasted from 4 to 5 h for aHP and 3 to 4 h for HPV. The humidity level ranged from 48.19% to 49.78% during the dispersion phase, from 91.36% to 93.09% during contact, and from 66.3% to 65.72% during aeration. The temperature fluctuated between 25.13 °C and 24.82 °C during dispersion, between 23.78 °C and 25.79 °C during contact, and between 28.11 °C and 30.01 °C during aeration, peaking at 30 °C for the HPV cycles. The HPV system enabled the measurement of H2O2 concentrations in ppm; however, only the HPV cycles provided values for this parameter. The H2O2 concentration was 562.33 ± 19.6 ppm during dispersion, decreasing to 123.33 ppm during the contact phase. At the end of aeration, the H2O2 level reached approximately 0 ppm.
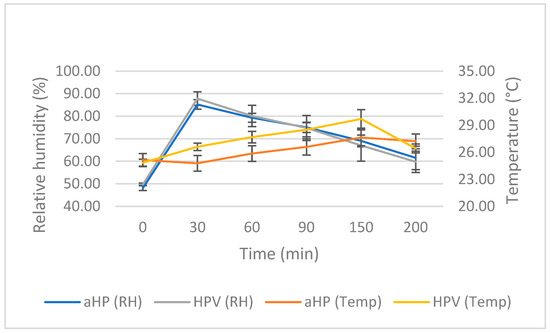
Figure 1.
Analysis of data acquired from three DCs of aerosolized hydrogen peroxide (aHP) and three DCs of hydrogen peroxide vapor (HPV). “RH” and “Temp” represent relative humidity and temperature, respectively. Error bars depict one standard deviation.
3.2. Chemical Indicators
The chemical indicators, positioned at various locations, provided results presented in logarithmic reduction, ranging from 2 log to over 6 log (Figure 2). The cards were arranged according to their height from the ground, their distance from the devices, and logarithmic reduction, utilizing a color code. Based on the results of two out of three trials, the reference colors were defined as follows: green indicated a reduction of more than 6 log, yellow indicated a reduction of less than 6 log, and red indicated a reduction of less than 2 log.
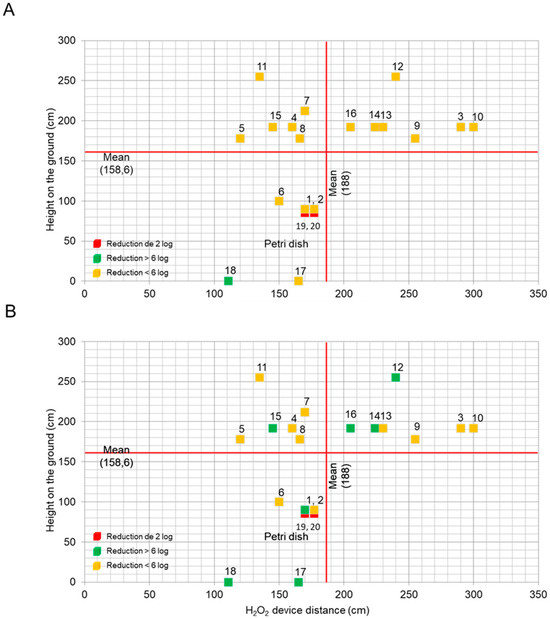
Figure 2.
The average logarithmic reduction achieved by the hydrogen peroxide chemical indicators across 20 positions relative to the device distance and ground height during the three trials of (A) aHP and the three trials of (B) HPV. Post-DCs, the indicator color was compared with the pre-printed reference card, providing visual cues for the progressive reduction in bioburden (2 log, <6 log, and >6 log). To visualize the results, each point was categorized: red for a reduction of 2 log, yellow for a reduction of <6 log, and green for a reduction of >6 log.
After the aHP cycles, reductions of less than 6 log were observed at positions 1 to 17, and a reduction of greater than 6 log was noted at position 18 (Figure 2A). For the HPV cycles, reductions of less than 6 log were observed at positions 1 to 11 and position 13 (Figure 2B). Reductions of greater than 6 log were recorded at positions 1, 12, and from 14 to 18. At positions 19 and 20, 2-log reductions were recorded in each cycle. In all aHP and HPV trials, reductions of less than 6 log were observed at positions 3 to 11 and position 13. Only the HPV trials showed reductions of greater than 6 log for positions 1, 12, 14, 15, 16, and 17, with a reduction greater than 6 at position 18 for both aHP and HPV.
Taken together, this indicates that HPV consistently achieved reductions exceeding 6 log across various positions and trials, demonstrating a very high decontamination efficacy compared with aHP.
3.3. Biological Indicators
The assessment of biocidal efficacy relied on two parameters. Firstly, it entailed evaluating the effectiveness of the biocide over a seven-day period, with a minimum efficacy threshold of 90%. This evaluation involved observing the absence of bacterial growth at positions 1 to 18 and the presence of growth at positions 19 and 20, as illustrated in Figure 3. Secondly, it involved examining the diffusion and uniformity of H2O2 in the decontamination zone, as depicted in Figure 4. The objective was to enhance diffusion at positions 1 to 18 while minimizing it at positions 6 and 19 (using a spore disc within the BCCII with laminar flow in the Petri dish for position 19) and at position 20 (using a spore disc in the Petri dish).
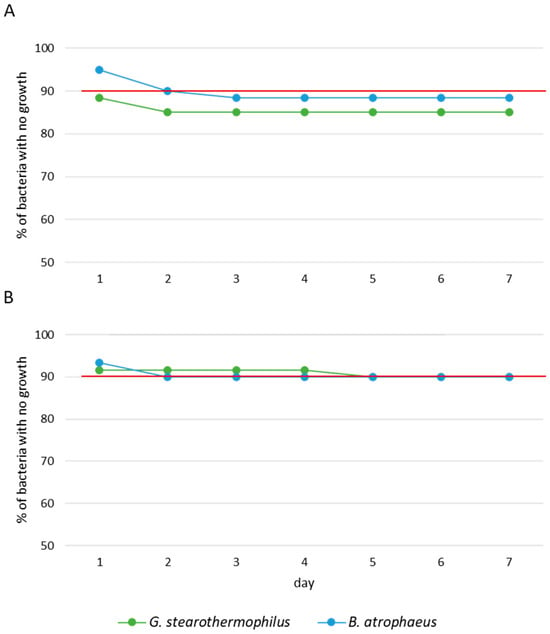
Figure 3.
Survival analysis of G. stearothermophilus and B. atrophaeus exposed to (A) aHP and (B) HPV during 7 days of incubation. Red line represents the average efficiency of DCs. Each trial was performed three times.
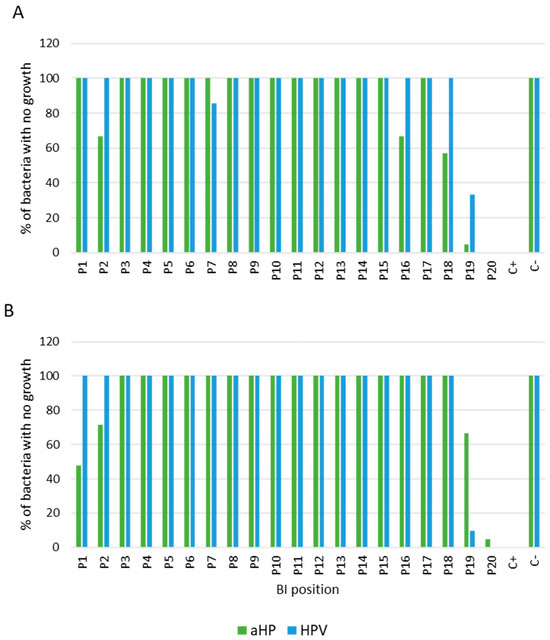
Figure 4.
Survival analysis of (A) G. stearothermophilus and (B) B. atrophaeus exposed to aHP and HPV, as functions of positions, during 7 days of incubation with data from triplicate trials. Positive “+” and negative “−” controls correspond to culture media with and without coupons exposed to DCs, respectively.
The results obtained from the percentage of biocidal efficacy of aHP and HPV over a seven-day incubation period, as seen in Figure 3, reveal a difference between the two DCs. At 24 h of incubation, the efficacy of aHP was shown at 88.33% for G. stearothermophilus and 95.00% for B. atrophaeus (Figure 3A), whereas that of HPV was 91.67% for G. stearothermophilus and 93.33% for B. atrophaeus (Figure 3B). By 72 h of incubation, the efficacy of aHP decreased to 85.00% for G. stearothermophilus and 88.33% for B. atrophaeus, while that of HPV remained at or above 90%.
Figure 4 displays the percentage of biocidal efficacy of the aHP and HPV systems according to the BIs’ positions. The results highlight a divergence between the two systems, particularly at positions 1, 2, 7, 16, 18, 19, and 20. For G. stearothermophilus (Figure 4A), HPV demonstrated 100% efficacy at positions 2, 16, and 18, while aHP showed efficacies of 67% and 57%, respectively. The only position where aHP exhibited higher efficacy was position 7, with 100% efficacy, compared with 86% for HPV. For positions 19 and 20 (coupons placed in the Petri dish), HPV demonstrated better diffusion compared with aHP, with efficacies of 33% and 5%, respectively, for position 19. As for position 20, there was no difference for both DCs.
For B. atrophaeus (Figure 4B), HPV demonstrated greater efficacy than aHP, achieving 100% efficacy compared with 48% and 71% for aHP at positions 1 and 2, respectively. In contrast, positions 19 and 20 exhibited higher biocidal efficacy for aHP compared with HPV, with percentages of 67% and 10% for position 19, and 5% and 0% for position 20, respectively. However, position 6 provided evidence supporting the hypothesis that the active laminar flow of the BCCII enabled the diffusion of H2O2 inside the BCCII enclosure.
In conclusion, aHP showed a biocidal efficacy of 84.76% for G. stearothermophilus and 89.52% for B. atrophaeus, whereas HPV decontamination achieved 90.95% and 90.48% effectiveness, respectively. These findings align with our anticipated outcomes, affirming the superior biocidal efficacy of HPV compared with aHP.
4. Discussion
Hydrogen peroxide, a potent biocidal agent, acts by permeating bacterial cell walls through passive diffusion, leading to alterations in internal components. Its decomposition into water and oxygen makes it environmentally friendly without residues [15,16]. Two main decontamination methods, “aHP” and “HPV”, apply hydrogen peroxide through aerosolized microdroplet diffusion and condensation-phase vaporization, respectively [8,9,12,13]. Efficacy relies on factors like hydroxyl radical formation, homogenous spreading, environmental conditions, biocide concentration, and microorganism characteristics. Despite the existence of numerous studies that have demonstrated the effectiveness of HPV compared with aHP, most of these studies did not compare the two forms under common conditions, especially regarding the concentration of hydrogen peroxide used. Holmdahl et al. (2011) compared the two processes, aHP and HPV, for the inactivation of G. stearothermophilus. The decontamination conditions included a 5% and 30% H2O2 solution for aHP and HPV, respectively, with a dispersion rate of 6 g/m3. All biological indicators (90%) were inactivated for the three HPV tests, compared with only 10% in the first aHP test and 79% in the other two aHP tests [13]. Similarly, Fu et al. (2012) compared aHP (5% H2O2) and HPV (30% H2O2) at a dispersion rate of 10 g/m3 for the inactivation of G. stearothermophilus and B. atrophaeus under two different concentration (4 and 6 log) conditions and various environmental condition (wrapped or unwrapped in Tyvek® envelopes) [12]. HPV inactivated more than 90% of BIs at 6 log and over 95% of BIs at 4 log. In contrast, the aHP inactivated less than 10% of wrapped BIs at 6 log, less than 15% of unwrapped BIs at 6 log, and approximately 33% of BIs at 4 log, whether wrapped or unwrapped [12]. In our study, the comparison was performed using a hydrogen peroxide concentration of 35%, set at 4.5 g/m3. This concentration was determined during a preliminary phase aimed at identifying the minimum biocidal level necessary to achieve comparable results, though it was not intended to completely eliminate exposed microorganisms.
According to the NF EN 17272:2020 European standard for Disinfection Methods by Air and Automated Processes [7], two microorganisms are commonly used to validate airborne DCs, G. stearothermophilus and B. atrophaeus spores. The results of various trials assessing the biocidal efficacy of hydrogen peroxide reveal differences between the two processes depending on the types of spores studied. For the aHP process, the data indicate a relatively low sensitivity of both spore types, with an efficacy of 88.33% for G. stearothermophilus and 95.00% for B. atrophaeus. It should be noted that after 3 days of incubation, an apparent decrease in efficacy was observed, although this is more accurately attributed to a reduction in the number of viable bacteria capable of germination, rather than a true loss of efficacy. These findings highlight the importance of a prolonged incubation period of 5 to 7 days for an accurate assessment using this method. Conversely, for all HPV cycles, the biocidal efficacy remained above 90% for both spore types throughout the 7 days of incubation, indicating a lower sensitivity of the spores to the aHP cycles compared with the HPV cycles.
The diffusion testing at position P20 indicated that HPV failed to eradicate bacterial spores, whereas aHP induced a delay in the growth of B. atrophaeus, implying the protection of the spores from H2O2. This underscores the limited extent of H2O2 diffusion within Petri dishes, effectively shielding microorganisms. Conversely, in (P19), neither HPV nor aHP exhibited spore germination, indicating the successful infiltration of the product into the Petri dish. These findings suggest that the laminar flow within the BCCII facilitated the superior diffusion of H2O2 into the Petri dish compared with other conditions. Consequently, this outcome illustrates the heightened biocidal effectiveness of hydrogen peroxide under BCCII conditions relative to external conditions (P20), establishing it as a proficient method for decontaminating the interior of a functional BCCII during decontamination cycles (DCs).
This study highlights technical constraints. The HPV system allowed for a detailed exploration of factors like humidity, temperature, and H2O2 concentration in ppm, with precise control over how and when H2O2 was dispersed. In contrast, the aHP system offered less flexibility in examining these parameters. The HPV cycles tended to be shorter, typically lasting between 3 and 4 h, while the aHP cycles were longer, often exceeding 5 h. In terms of safety, following HPV exposure, an active extrication system catalyzes the decomposition of the HPV into oxygen and water vapor. Despite the advantages of the HPV system in terms of decontamination, operation, and safety, precautions are necessary to prevent potential damage to the decontamination areas (Figure 5).
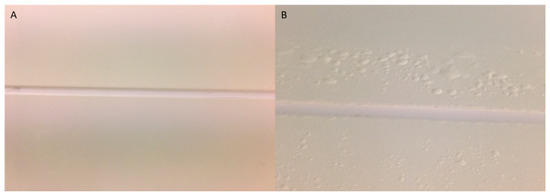
Figure 5.
Photographs of a partition junction before (A) and after (B) an HPV test. (A) Partition with a smooth coating (RH < 100%); (B) partition with a blistered coating (RH > 100%).
Scientific discussions highlight disagreements regarding the influence of humidity levels and condensation on the efficacy of biocides [10,14,15,17]. Hydrogen peroxide vapor (HPV) systems can lead to condensation or micro-condensation on surfaces [9,18,19], potentially enhancing the biocide efficacy but also damaging coatings [10]. In the context of H2O2 vapor decontamination, it is crucial to understand the different phases of hydrogen peroxide and concepts like dew point, relative saturation, and condensation [18,19,20,21]. Relative saturation indicates the humidity content in the air due to the simultaneous presence of hydrogen peroxide and water vapor. When the humidity reaches 100% (Figure 5), water begins to condense. In other words, at a given temperature, air can hold only a certain amount of water vapor and hydrogen peroxide, known as the dew point. As water evaporates more easily than hydrogen peroxide, the reverse is true during condensation. If a vapor mixture becomes too concentrated (saturated) or cooled to the dew point, hydrogen peroxide will be the first to condense, reducing its vapor phase concentration and forming small droplets of concentrated peroxide on surfaces, causing coating damage (Figure 5). When condensation is avoided, it is termed a “dry process”. In this study, initial tests indicated the presence of micro-condensation during the HPV cycles, leading to surface coating detachment. To address this issue, a pre-dehumidification step lowering the humidity to below 50% was introduced before each HPV cycle and was also consistently applied to the aHP DCs. Watling et al. (2002) recommended pre-dehumidifying before introducing the hydrogen peroxide vapor in order to reduce the humidity and, thus, avoid the excessive condensation of hydrogen peroxide [17]. This method aims to achieve high concentrations of H2O2 in the gas phase and prevent condensation, considering microbial inactivation as a dry process, thereby avoiding potential problems related to condensation, such as material corrosion, extended aeration time, and uneven decontamination [17].
In addition to this issue of material damage, there is another cost-related concern. HPV devices can reach costs of up to EUR 50,000, while aHP devices generally do not exceed EUR 10,000. These data underline the importance of conducting a comprehensive evaluation of the advantages and disadvantages associated with each decontamination method. Such an evaluation should consider various factors, including biocide effectiveness, the technical feasibility of implementation, and the total cost of ownership, which also includes ongoing maintenance costs. HPV devices incorporate electronic components that can also be expensive. Thus, the aHP approach may emerge as a preferable option for surface decontamination via aerial means. Its biocide effectiveness, along with the operation mode of aHP devices that generate liquid hydrogen peroxide without reaching high levels of humidity or condensation, combined with its lower initial costs, make it an attractive choice for many applications.
5. Conclusions
In conclusion, our study highlights the effectiveness of hydrogen peroxide vapor (HPV) and aerosol (aHP) in eliminating Geobacillus stearothermophilus and Bacillus atrophaeus spores. While HPV has proven more effective in deactivating spores over extended periods, aHP also offers notable advantages, including no damage to coatings and lower costs. However, our study underscores the technical limitations of aerosolized hydrogen peroxide (aHP) systems, as well as the need to effectively manage variations in humidity and condensation rates in HPV decontamination chambers. Overall, aerosolized hydrogen peroxide, or aHP, emerges as a promising solution for surface decontamination using air-borne methods. This strategy not only ensures effective decontamination but also preserves the integrity of treated surfaces, owing to the cold-pressure operation mode of aHP devices. Additionally, aHP has potential cost savings compared with alternative methods. These advantages make it a compelling choice for surface decontamination.
Author Contributions
Conceptualization, methodology, software, and validation by I.C. and S.A.; writing—original draft preparation and review and editing by I.C.; project administration and funding acquisition by S.A. All authors have read and agreed to the published version of the manuscript.
Funding
This work was conducted and funded as part of a Master’s degree in biosafety at the Animal Health Laboratory (Maisons-Alfort) at the French Agency for Food, Environmental and Occupational Health & Safety (ANSES).
Institutional Review Board Statement
Not applicable.
Informed Consent Statement
Not applicable.
Data Availability Statement
Data is contained within the article; further inquiries can be directed to the corresponding author.
Acknowledgments
We thank Pascal Boireau, Director of the Animal Health Laboratory (Maisons-Alfort) at the French Agency for Food, Environmental and Occupational Health & Safety (ANSES), for his review and the suggestions provided for this article.
Conflicts of Interest
The authors declare no conflicts of interest.
References
- Browne, K.; Mitchell, B.G. Multimodal Environmental Cleaning Strategies to Prevent Healthcare-Associated Infections. Antimicrob. Resist. Infect. Control 2023, 12, 83. [Google Scholar] [CrossRef] [PubMed]
- Doll, M.; Stevens, M.; Bearman, G. Environmental Cleaning and Disinfection of Patient Areas. Int. J. Infect. Dis. 2018, 67, 52–57. [Google Scholar] [CrossRef] [PubMed]
- Griffith, C. Surface Sampling and the Detection of Contamination. In Handbook of Hygiene Control in the Food Industry, 2nd ed.; Elsevier Inc.: Amsterdam, The Netherlands, 2016; pp. 673–696. [Google Scholar] [CrossRef]
- Lesho, E.; Newhart, D.; Reno, L.; Sleeper, S.; Nary, J.; Gutowski, J.; Yu, S.; Walsh, E.; Vargas, R.; Riedy, D.; et al. Effectiveness of Various Cleaning Strategies in Acute and Long-Term Care Facilities during Novel Corona Virus 2019 Disease Pandemicrelated Staff Shortages. PLoS ONE 2022, 17, e0261365. [Google Scholar] [CrossRef] [PubMed]
- Vandini, A.; Temmerman, R.; Frabetti, A.; Caselli, E.; Antonioli, P.; Balboni, P.G.; Platano, D.; Branchini, A.; Mazzacane, S. Hard Surface Biocontrol in Hospitals Using Microbial-Based Cleaning Products. PLoS ONE 2014, 9, e108598. [Google Scholar] [CrossRef] [PubMed]
- Pastorino, B.; de Lamballerie, X.; Charrel, R. Biosafety and Biosecurity in European Containment Level 3 Laboratories: Focus on French Recent Progress and Essential Requirements. Front. Public Health 2017, 5, 121. [Google Scholar] [CrossRef] [PubMed]
- NF EN 17 272; Method of Disinfection by Air, Automated Processes. AFNOR: Saint-Denis, France, 2020.
- Otter, J.A.; Yezli, S.; Perl, T.M.; Barbut, F.; French, G.L. The Role of “no-Touch” Automated Room Disinfection Systems in Infection Prevention and Control. J. Hosp. Infect. 2013, 83, 1–13. [Google Scholar] [CrossRef] [PubMed]
- Otter, J.A.; Yezli, S.; Barbut, F.; Perl, T.M. An Overview of Automated Room Disinfection Systems: When to Use Them. In Decontamination in Hospitals and Healthcare; Elsevier: Amsterdam, The Netherlands, 2019; pp. 323–369. [Google Scholar] [CrossRef]
- Unger-Bimczok, B.; Kottke, V.; Hertel, C.; Rauschnabel, J. The Influence of Humidity, Hydrogen Peroxide Concentration, and Condensation on the Inactivation of Geobacillus Stearothermophilus Spores with Hydrogen Peroxide Vapor. J. Pharm. Innov. 2008, 3, 123–133. [Google Scholar] [CrossRef]
- Kaspari, O.; Lemmer, K.; Becker, S.; Lochau, P.; Howaldt, S.; Nattermann, H.; Grunow, R. Decontamination of a BSL3 Laboratory by Hydrogen Peroxide Fumigation Using Three Different Surrogates for Bacillus Anthracis Spores. J. Appl. Microbiol. 2014, 117, 1095–1103. [Google Scholar] [CrossRef] [PubMed]
- Fu, T.Y.; Gent, P.; Kumar, V. Efficacy, Efficiency and Safety Aspects of Hydrogen Peroxide Vapour and Aerosolized Hydrogen Peroxide Room Disinfection Systems. J. Hosp. Infect. 2012, 80, 199–205. [Google Scholar] [CrossRef] [PubMed]
- Holmdahl, T.; Lanbeck, P.; Wullt, M.; Walder, M.H. A Head-to-Head Comparison of Hydrogen Peroxide Vapor and Aerosol Room Decontamination Systems. Infect. Control Hosp. Epidemiol. 2011, 32, 831–836. [Google Scholar] [CrossRef] [PubMed]
- Johnston, M.D.; Lawson, S.; Otter, J.A. Evaluation of Hydrogen Peroxide Vapour as a Method for the Decontamination of Surfaces Contaminated with Clostridium Botulinum Spores. J. Microbiol. Methods 2005, 60, 403–411. [Google Scholar] [CrossRef] [PubMed]
- Arunwuttipong, A.; Jangtawee, P.; Vchirawongkwin, V.; Kangwansupamonkon, W.; Asavanant, K.; Ekgasit, S. Public Buses Decontamination by Automated Hydrogen Peroxide Aerosolization System. Open Access Maced. J. Med. Sci. 2021, 9, 847–856. [Google Scholar] [CrossRef]
- Falaise, C.; Bouvattier, C.; Larigauderie, G.; Lafontaine, V.; Berchebru, L.; Marangon, A.; Vaude-Lauthier, V.; Raynaud, F.; Taysse, L. Hydrogen Peroxide Vapor Decontamination of Hazard Group 3 Bacteria and Viruses in a Biosafety Level 3 Laboratory. Appl. Biosaf. 2022, 27, 15–22. [Google Scholar] [CrossRef] [PubMed]
- Watling, D.; Ryle, C.; Parks, M.; Christopher, M. Theoretical Analysis of the Condensation of Hydrogen Peroxide Gas and Water Vapour as Used in Surface Decontamination. PDA J. Pharm. Sci. Technol. 2002, 56, 291–299. [Google Scholar] [PubMed]
- Pottage, T.; Macken, S.; Giri, K.; Walker, J.T.; Bennett, A.M. Low-Temperature Decontamination with Hydrogen Peroxide or Chlorine Dioxide for Space Applications. Appl. Environ. Microbiol. 2012, 78, 4169–4174. [Google Scholar] [CrossRef] [PubMed]
- Pottage, T.; Richardson, C.; Parks, S.; Walker, J.T.; Bennett, A.M. Evaluation of Hydrogen Peroxide Gaseous Disinfection Systems to Decontaminate Viruses. J. Hosp. Infect. 2010, 74, 55–61. [Google Scholar] [CrossRef] [PubMed]
- Kyoo Lee, J.; Soo Han, H.; Chaikasetsin, S.; Marron, D.P.; Waymouth, R.M.; Prinz, F.B.; Zare, R.N. Condensing Water Vapor to Droplets Generates Hydrogen Peroxide. Proc. Natl. Acad. Sci. USA 2020, 117, 30934–30941. [Google Scholar] [CrossRef]
- Vaisala. Understanding Dew Point in Vaporized Hydrogen Peroxide Applications; Vaisala: Vantaa, Finland, 2020. [Google Scholar]
Disclaimer/Publisher’s Note: The statements, opinions and data contained in all publications are solely those of the individual author(s) and contributor(s) and not of MDPI and/or the editor(s). MDPI and/or the editor(s) disclaim responsibility for any injury to people or property resulting from any ideas, methods, instructions or products referred to in the content. |
© 2024 by the authors. Licensee MDPI, Basel, Switzerland. This article is an open access article distributed under the terms and conditions of the Creative Commons Attribution (CC BY) license (https://creativecommons.org/licenses/by/4.0/).