Article

How Do Climate Change and Deglaciation Affect Runoff Formation Mechanisms in the High-Mountain River Basin of the North Caucasus?

by
Ekaterina D. Pavlyukevich
1,2,*,
Inna N. Krylenko
1,2,
Yuri G. Motovilov
1,
Ekaterina P. Rets
1,
Irina A. Korneva
3,
Taisiya N. Postnikova
1 and
Oleg O. Rybak
1
1
Water Problems Institute of the Russian Academy of Sciences, 119333 Moscow, Russia
2
Faculty of Geography, Lomonosov Moscow State University, 119991 Moscow, Russia
3
Institute of Geography of the Russian Academy of Sciences, 119017 Moscow, Russia
*
Author to whom correspondence should be addressed.
Glacies 2025, 2(3), 10; https://doi.org/10.3390/glacies2030010
Submission received: 26 June 2025 / Revised: 5 August 2025 / Accepted: 29 August 2025 / Published: 3 September 2025

Abstract

This study assesses the impact of climate change and glacier retreat on river runoff in the high-altitude Terek River Basin using the physically based ECOMAG hydrological model. Sensitivity experiments examined the influence of glaciation, precipitation, and air temperature on runoff variability. Results indicate that glacier retreat primarily affects streamflow in upper reaches during peak melt (July–October), while precipitation changes influence both annual runoff and peak flows (May–October). Rising temperatures shift snowmelt to earlier periods, increasing runoff in spring and autumn but reducing it in summer. The increase in autumn runoff is also due to the shift between solid and liquid precipitation, as warmer temperatures cause more precipitation to fall as rain, rather than snow. Scenario-based modeling incorporated projected glacier area changes (GloGEMflow-DD) and regional climate data (CORDEX) under RCP2.6 and RCP8.5 scenarios. Simulated runoff changes by the end of the 21st century (2070–2099) compared to the historical period (1977–2005) ranged from −2% to +5% under RCP2.6 and from −8% to +14% under RCP8.5. Analysis of runoff components (snowmelt, rainfall, and glacier melt) revealed that changes in river flow are largely determined by the elevation of snow and glacier accumulation zones and the rate of their degradation. The projected trends are consistent with current observations and emphasize the need for adaptive water resource management and risk mitigation strategies in glacier-fed catchments under climate change.

1. Introduction

Global climate change has led to serious changes in the conditions of runoff formation in mountainous regions [1,2]. These changes are expected to have a significant impact on glaciers and snow cover, causing a transformation in the water regime [3]. Therefore, effective management of water resources, such as hydropower and the water supply, requires a thorough understanding of how climate change impacts hydrological processes in high-altitude areas.
The expected consequence of glacier melting is an increase in river flow. However, the negative mass balance of glaciers leads to a decrease in the volume and area of glaciation, which ultimately leads to a decrease in the total volume of meltwater. Thus, climate change and deglaciation have ambiguous effects on high-elevation river basins around the world [4]: climate warming can lead to both an increase and a decrease in river flow, depending on the rate and state of glacier retreat [5]. In addition to global warming, background changes in precipitation also contribute to runoff alterations. This may lead to episodic increases in peak river discharge associated with outburst floods from proglacial lakes, whose number is expected to rise [6,7,8]. These factors highlight the necessity of conducting detailed regional studies in populated mountainous areas using up-to-date information on glaciation and projected glacier retreat under changing climatic conditions.
Between 2000 and 2019, glaciers worldwide lost a mass of 267 ± 16 gigatonnes per year, highlighting their rapid decline. Additionally, researchers have reported a mass loss acceleration of 48 ± 16 gigatonnes per year per decade, indicating an increasing impact of climate change on glacial retreat [9]. The area of glaciers in the Greater Caucasus decreased by an average of 0.44% per year from 1960 to 1986 and by 0.69% per year from 1986 to 2014. In 1960, the total glacier surface area was 1674.9 ± 70.4 km2. By 1986, glacier surface area had decreased to 1482.1 ± 64.4 km2, and by 2014, to 1193.2 ± 54.0 km2 [10]. If we extrapolate these rates of deglaciation for the next 30 or 70 years, the glacier area of the Caucasus could decrease by 25% or 50%, respectively. According to forecasting models, it is possible that the glacier cover of the Caucasus will decrease by 60–90% at the end of this century, depending on climate scenarios [11]. Recent estimates suggest that ongoing climate change [12,13] and the degradation of glaciers in the North Caucasus [14,15,16] have already caused significant changes in river flow volume and regime [17].
A typical example of a river that can serve as a case study for studying the effects of climate change on hydrological processes is the Terek River. The upper part of its basin includes glaciers from the Greater Caucasus, where these processes can be observed most clearly. The North Caucasus is one of the most densely populated and agriculturally developed regions of the Russian Federation. During low-water periods, the water supply of the region mainly depends on high-altitude areas, and may be insufficient during dry seasons [18].
Mathematical modeling methods are widely used in modern research in various high-altitude basins worldwide [19,20,21]. Moreover, hydrological modeling has become a crucial tool for forecasting streamflow in the face of climate variability and deglaciation [22,23,24,25]. Studies across the Himalayas, Andes, Alps, and other mountainous regions [26,27,28,29,30] have applied a variety of models—from physically based to semi-distributed approaches—to capture complex snow and glacier dynamics. However, few detailed models of runoff formation have been adapted for the Caucasus highlands. Among the published studies, the Baksan River basin (a tributary of the Terek River) was previously modeled via the HBV model up to the closing gauge near the town of Tyrnyauz [31]. However, this study relied solely on meteorological data from the Terskol station up to the year 2000, which is clearly insufficient for assessing the combined effects of climate change and deglaciation within the high-altitude part of the basin. In contrast, our study provides a comprehensive assessment of potential changes in the volume and regime of river discharge in the Terek River basin by modeling approaches that account for glacier retreat and climate change, thereby highlighting the relevance of this research.
The purpose of this study is to assess the impact of climate change and glaciation on river runoff and the transformation of its formation mechanisms in the Terek River Basin on the basis of mathematical modeling. To achieve this goal, it was necessary to solve the following tasks: creating an information base for modeling; adapting, calibrating, and validating the flow formation model; conducting numerical experiments to assess the sensitivity of water regime characteristics to changes in input conditions; developing schemes for assimilating data from a climatic and glaciological model into a runoff formation model; and performing scenario calculations of changes in runoff and its genetic components (snowmelt, rainfall, glacier-melt) [32] on the basis of the runoff formation model and data from glaciological and climatic modeling.
The practical significance of this research lies in the fact that the developed runoff formation model can be used to establish a monitoring system for hazardous hydrological processes in high-mountain catchments. The findings of this study may also contribute to the development of long-term strategies for the efficient use of water resources in the North Caucasus. The projected estimates of changes in river discharge volume and regime obtained in this work enable the advance planning of measures to improve the reliability and efficiency of hydraulic infrastructure and mitigate potential risks to populations and economic assets through to the end of the 21st century.

2. Study Area

The high-altitude part of the Terek River basin is located within the Central Caucasus, where the most massive glaciation area of the Caucasus is located. The area of the studied basin is 20,600 km2. A significant part of the area is covered by permanent snow, firn and ice at altitudes above 2500 m. The area covered by glaciers in the region is approximately 684 square kilometers [33]. Approximately 10% of this total area is occupied by glaciers on Mount Elbrus (Figure 1).
The average annual precipitation in the study area is 683 mm, and the average annual air temperature is 6.5 °C. The complex topography of the North Caucasus region, which consists of hills and valleys of varying heights and a wide range of elevations, significantly influences the radiation regime and air mass circulation. In particular, orography affects the distributions of temperature and precipitation, depending on the altitude of the area.
The Terek River is characterized by a typical flow regime of a mountain river with high spring–summer high water, which is complicated by overlapping peaks of rain floods and low autumn–winter low water. Monitoring observations of discharge at hydrometric gauges in the high-altitude area of the Terek River basin began primarily in the 1950s and 1970s. Data from 15 gauges were used in this work, 12 of which are currently working. However, owing to the peculiarities of runoff formation in the mountains, the coverage of the area with hydrometric data remains insufficient.
To identify current trends in the main hydrological and meteorological characteristics, we used Student’s t test [34] and the Mann-Kendall test [35], with a 5% significance level. On the basis of the analysis of actual weather station data, we found that there was a widespread increase in average annual air temperatures in the high-altitude part of the Terek River basin, with an average rate of up to 0.7 °C per decade for the period 1977–2014. However, statistically significant trends in annual precipitation were not detected, according to the meteorological station data (Figure 2). On the basis of actual data from 15 monitoring stations for the period from 1970 to 2018, we also found that the average annual discharge increased by 2–7% per decade. The maximum annual discharges, on the other hand, at most stations, are reduced by 2–10% per 10 years. This is especially evident at hydrological gauges in the high-altitude parts of the basin, such as the Baksan River (Tyrnyauz), the Cherek Balkarsky River (Babugent) and the Tseya River (Buron).
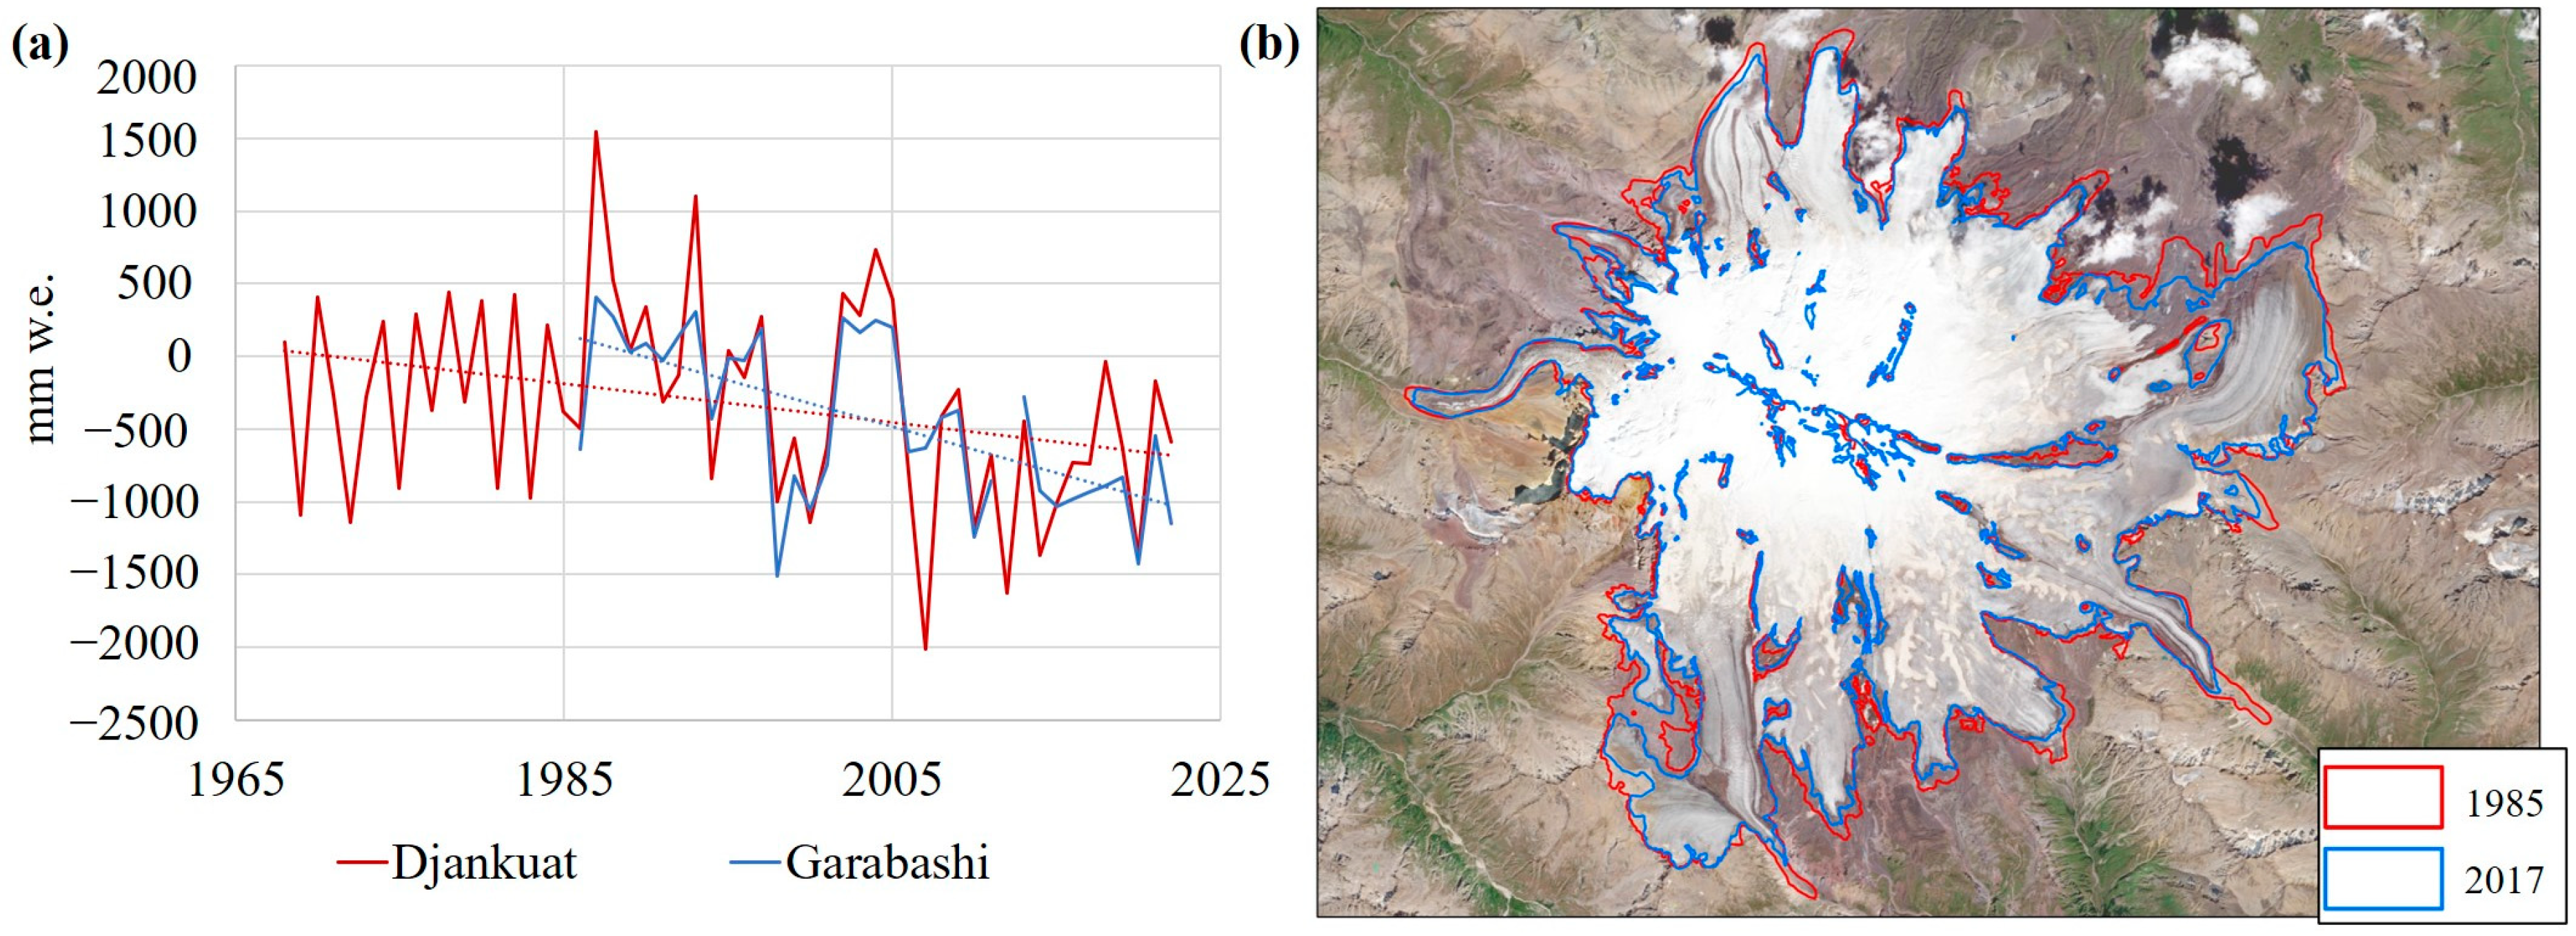
The glaciers of the Central Caucasus decreased by 4.6% between 2001 and 2010 [36]. The smallest area loss occurred at the Elbrus glaciers, with a total change of 2.8%. Two representative glaciers within the study area, Djankuat and Garabashi, are part of the World Glacier Monitoring Service (WGMS) [37]. The data from the WGMS show a decrease in both the mass balance and area of glaciers over time (Figure 3).

3. Materials and Methods

3.1. ECOMAG Runoff Formation Model

Mathematical modeling of the processes of runoff formation was performed on the basis of the process-based semi-distributed regional hydrological model ECOMAG (ECOlogical Model for Applied Geophysics) [40]. Earlier, ECOMAG-based hydrological models were widely applied to river basins located under different natural conditions [41].
The ECOMAG model describes spatially variable processes of snow accumulation and snowmelt; heat and water transfer within the vegetation–soil system; evapotranspiration; infiltration into frozen and unfrozen soil; soil freezing and thawing; surface, subsurface, and groundwater flow; and river channel flow with a daily time step. The governing equations describing these processes are derived from the integration of the basic hydrodynamic and thermodynamic equations of water and heat vertical transfer in snowpack, frozen/unfrozen soil, horizontal water flow under and over catchment slopes, etc.
It is a distributed model in which the river basin is schematized into landscape elements known as elementary catchments. For this study, the basin was divided into 2050 elementary catchments with an average area of 9.9 km2. Information about the underlying surface, including topographic, soil, and landscape maps, as well as glaciation data, was obtained for every elementary catchment. The models’ inputs include daily precipitation, air temperature, and air humidity deficit. The model interpolates meteorological characteristics for each elementary catchment, taking into account inversely weighted distances from weather stations to the center of the elementary catchment and taking into account altitudinal gradients of air temperature and precipitation. An additional glacial module has been added to the ECOMAG model to account for regional features. A simplified glacier module based on the simple temperature index approach assumes that ice and snow melting occurs during periods of positive temperatures [42].

3.2. Numerical Experiments to Assess the Sensitivity of Water Regime Characteristics to Changes in Input Conditions

Numerical experiments make it possible to identify the contributions of various factors, such as glaciation, precipitation, and air temperature, to changes in flow characteristics and the possible range of these factors. The calculation was performed on the basis of data for the period from 2010 to 2020, taking into account the modification of various input conditions via the “delta-change” method. In this method, we introduce permanent corrections to the input conditions for the calculation period and assess the change in the simulation results (in this case, discharges). This method was first proposed by Kuchment et al. [43] to analyze the sensitivity of a hydrological system via physical and mathematical models. The main advantage of the “delta-change” method is the possibility of reducing the uncertainty of the calculated data of climate models by setting transformed actual observations as boundary conditions in the hydrological model.
The high-altitude part of the Baksan River basin, which is characterized by the greatest glaciation (glaciers on the slopes of Mount Elbrus and of the Main Caucasian Ridge), was chosen as the experimental test site. We assessed changes in discharges at the Baksan–Tyrnyauz and Baksan–Zayukovo gauges when the following input data were changed:
  • Reduction in the modern glacier area (scenario led): 75%, 50%, and 25% of the current glaciation area (scenarios ice75, ice50, and ice25), and the absence of glaciers (scenario ice0);
  • Change in actual daily precipitation (scenario pre): pre+5%, pre+10%, and pre+20% is an increase in precipitation of 5, 10, and 20%, and pre-5%, pre-10%, and pre-20% is a decrease in precipitation of 5, 10, and 20%, respectively;
  • Changes in the actual air temperature (scenario temp): temp+2, temp+4, and temp+6 is an increase in air temperature by 2, 4, and 6 °C, respectively.

3.3. Scenario Modeling of Runoff Considering Climatic and Glacial Changes

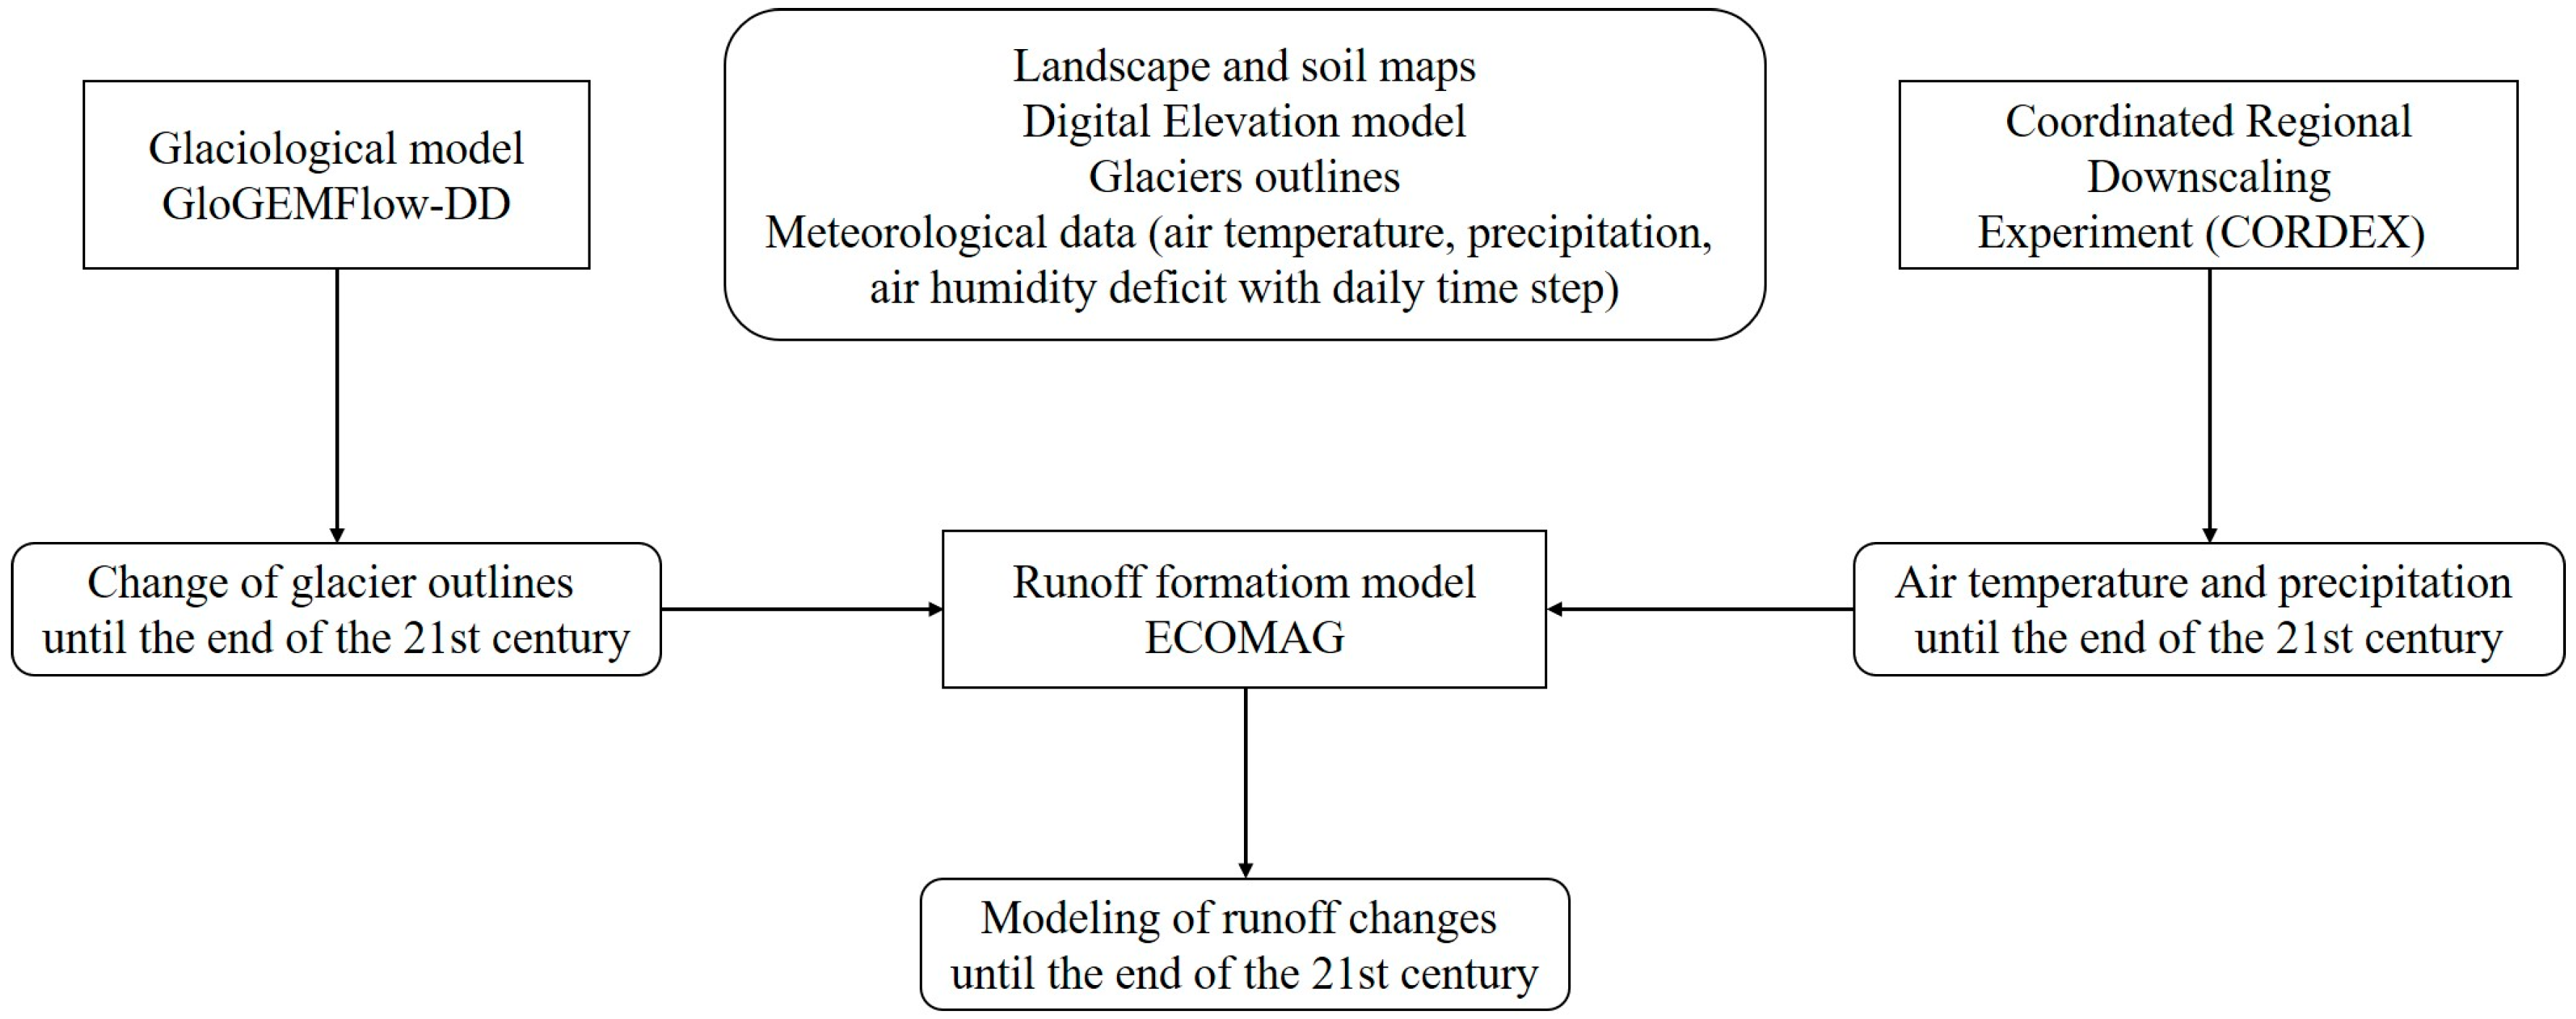
The assessment of probable changes in the flow of the Terek River in the 21st century, taking into account climate changes and glaciation in the basin, was carried out on the basis of a set of hydrometeorological models. A framework of the assimilation of climatic and glaciological modeling data and the ECOMAG runoff formation model is shown in Figure 4. To account for climate change and deglaciation, the input data for the ECOMAG model include calculated changes in glaciation areas (based on the global glaciological model GloGEMflow-DD) and regional climate changes (data from the CORDEX project) (Table 1).

3.4. CORDEX Project

Mesoscale climate modeling data were obtained from the CORDEX project [47]. The results of mesoscale climate modeling under CORDEX have been widely used in hydrological applications [48,49,50]. The CORDEX projections up to the end of the 21st century were calculated on different climate models. The unique aspect of the approach used in the project is that it combines global climate models, which calculate global climate fields with a low spatial resolution (between 1° and 5°, depending on the specific model) and set the boundary conditions for regional (mesoscale) models that operate at a much higher spatial resolution (11–50 km).
The article [45] details the correction and regionalization procedures for model climate data from the CORDEX project using station meteorological observations from 22 weather stations in the Central Caucasus. The air temperature was corrected via the linear method with dispersion. The mean absolute errors for the average air temperature between the initial model data and observations for the region were 3.41 °C (MPI model), 4.38 °C (NCC-NorESM1 model) and 3.82 °C (CNRM-CERFACS), and after correction, the corresponding values were 0.73 °C, 0.74 °C and 0.76 °C, respectively. The initial model precipitation data contained wet bias, due to the “drizzle” effect (the unrealistically large number of wet days in the model data) and the wrong annual course. The delta method (the mean difference between observations and the model) was successfully used for precipitation correction. The process of regionalizing the data involved downscaling from a model grid with a 25 km resolution to a spatial grid with an approximately 1 km resolution, via the values of vertical gradients in air temperature and precipitation. The ECOMAG model uses grid data on surface temperature and daily precipitation with a spatial resolution of 1 × 1 km as inputs. The historical dataset includes daily records of precipitation and air temperature from 1977 to 2005, while the prognostic period extends from 2006 to 2099.
To transition from modeling based on meteorological station data to climate model data, we performed additional calibrations of several ECOMAG model parameters related to critical melting and precipitation temperatures and evaporation. We used CORDEX data for the period 1995–2005 to calibrate the runoff formation parameters, and validated the model for the entire historical period from 1977 to 2005. On the basis of the validation results, the ECOMAG model successfully reproduces both hydrographs and annual runoff volumes when climate modeling data are used.

3.5. GloGEMflow-DD Model

Data on changes in the glaciation area within the Terek watershed were obtained via a modified version of the GloGEMflow model [51]. This model, named GloGEMflow-DD (debris dynamics), includes a new module for calculating the debris cover transformation over time [46]. GloGEMflow is a glacier model that uses the continuity equation to simulate glacier evolution along central flowlines. The mass balance is calculated following the positive degree-day approach, and takes meltwater refreezing into account. Ice deformation is calculated from the shallow ice approximation [52]. The main formulas, parameterization schemes, and calibration and validation results of the GloGEMflow-DD model are elaborately described in [46].
The input data of the GloGEMflow-DD model include glacier outlines, which in this study are taken from the Randolph Glacier Inventory version 6.0 (RGI6.0), and ice thickness estimates are based on the method of Huss and Farinotti (2012, updated in 2019) [53]. On average, glaciers in the studied region exhibit an area-weighted mean ice thickness of approximately 58.6 m. The maximum ice thickness reaches 257 m, based on elevation-band-averaged data. For model calibration, we use manually mapped debris cover outlines for the year 2001, debris thickness data from Rounce et al. [54], and glacier elevation changes between 2000 and 2019 from Hugonnet et al. [9], to calibrate the mass balance component. For validation, we use manually mapped debris cover outlines for 2018, as well as glacier surface velocity data from Millan et al. [55], which are used to validate the dynamic module. The model operates via 10 m elevation bands, into which each glacier is vertically divided. These elevation band data are then interpolated onto a horizontal grid, with the spatial resolution adjusted according to each glacier’s length and geometry.
We chose GloGEMflow-DD as an instrument for our study since, thus far, it is one of the most advanced regional-scale glacier models, with explicit representations of glacier dynamics coupled with debris cover evolution. The glacier area change simulated by GloGEMflow-DD fits the historical observations better than the results available from other glacier models (e.g., [56]), which has been shown in [57] for glaciers on Elbrus. The glaciation proportion for each elementary catchment of the ECOMAG model is configured on the basis of the outcomes of numerical simulations from the GloGEMflow-DD model, which are updated every 10 model years.

4. Results

4.1. Calibration and Validation of the Runoff Formation Model

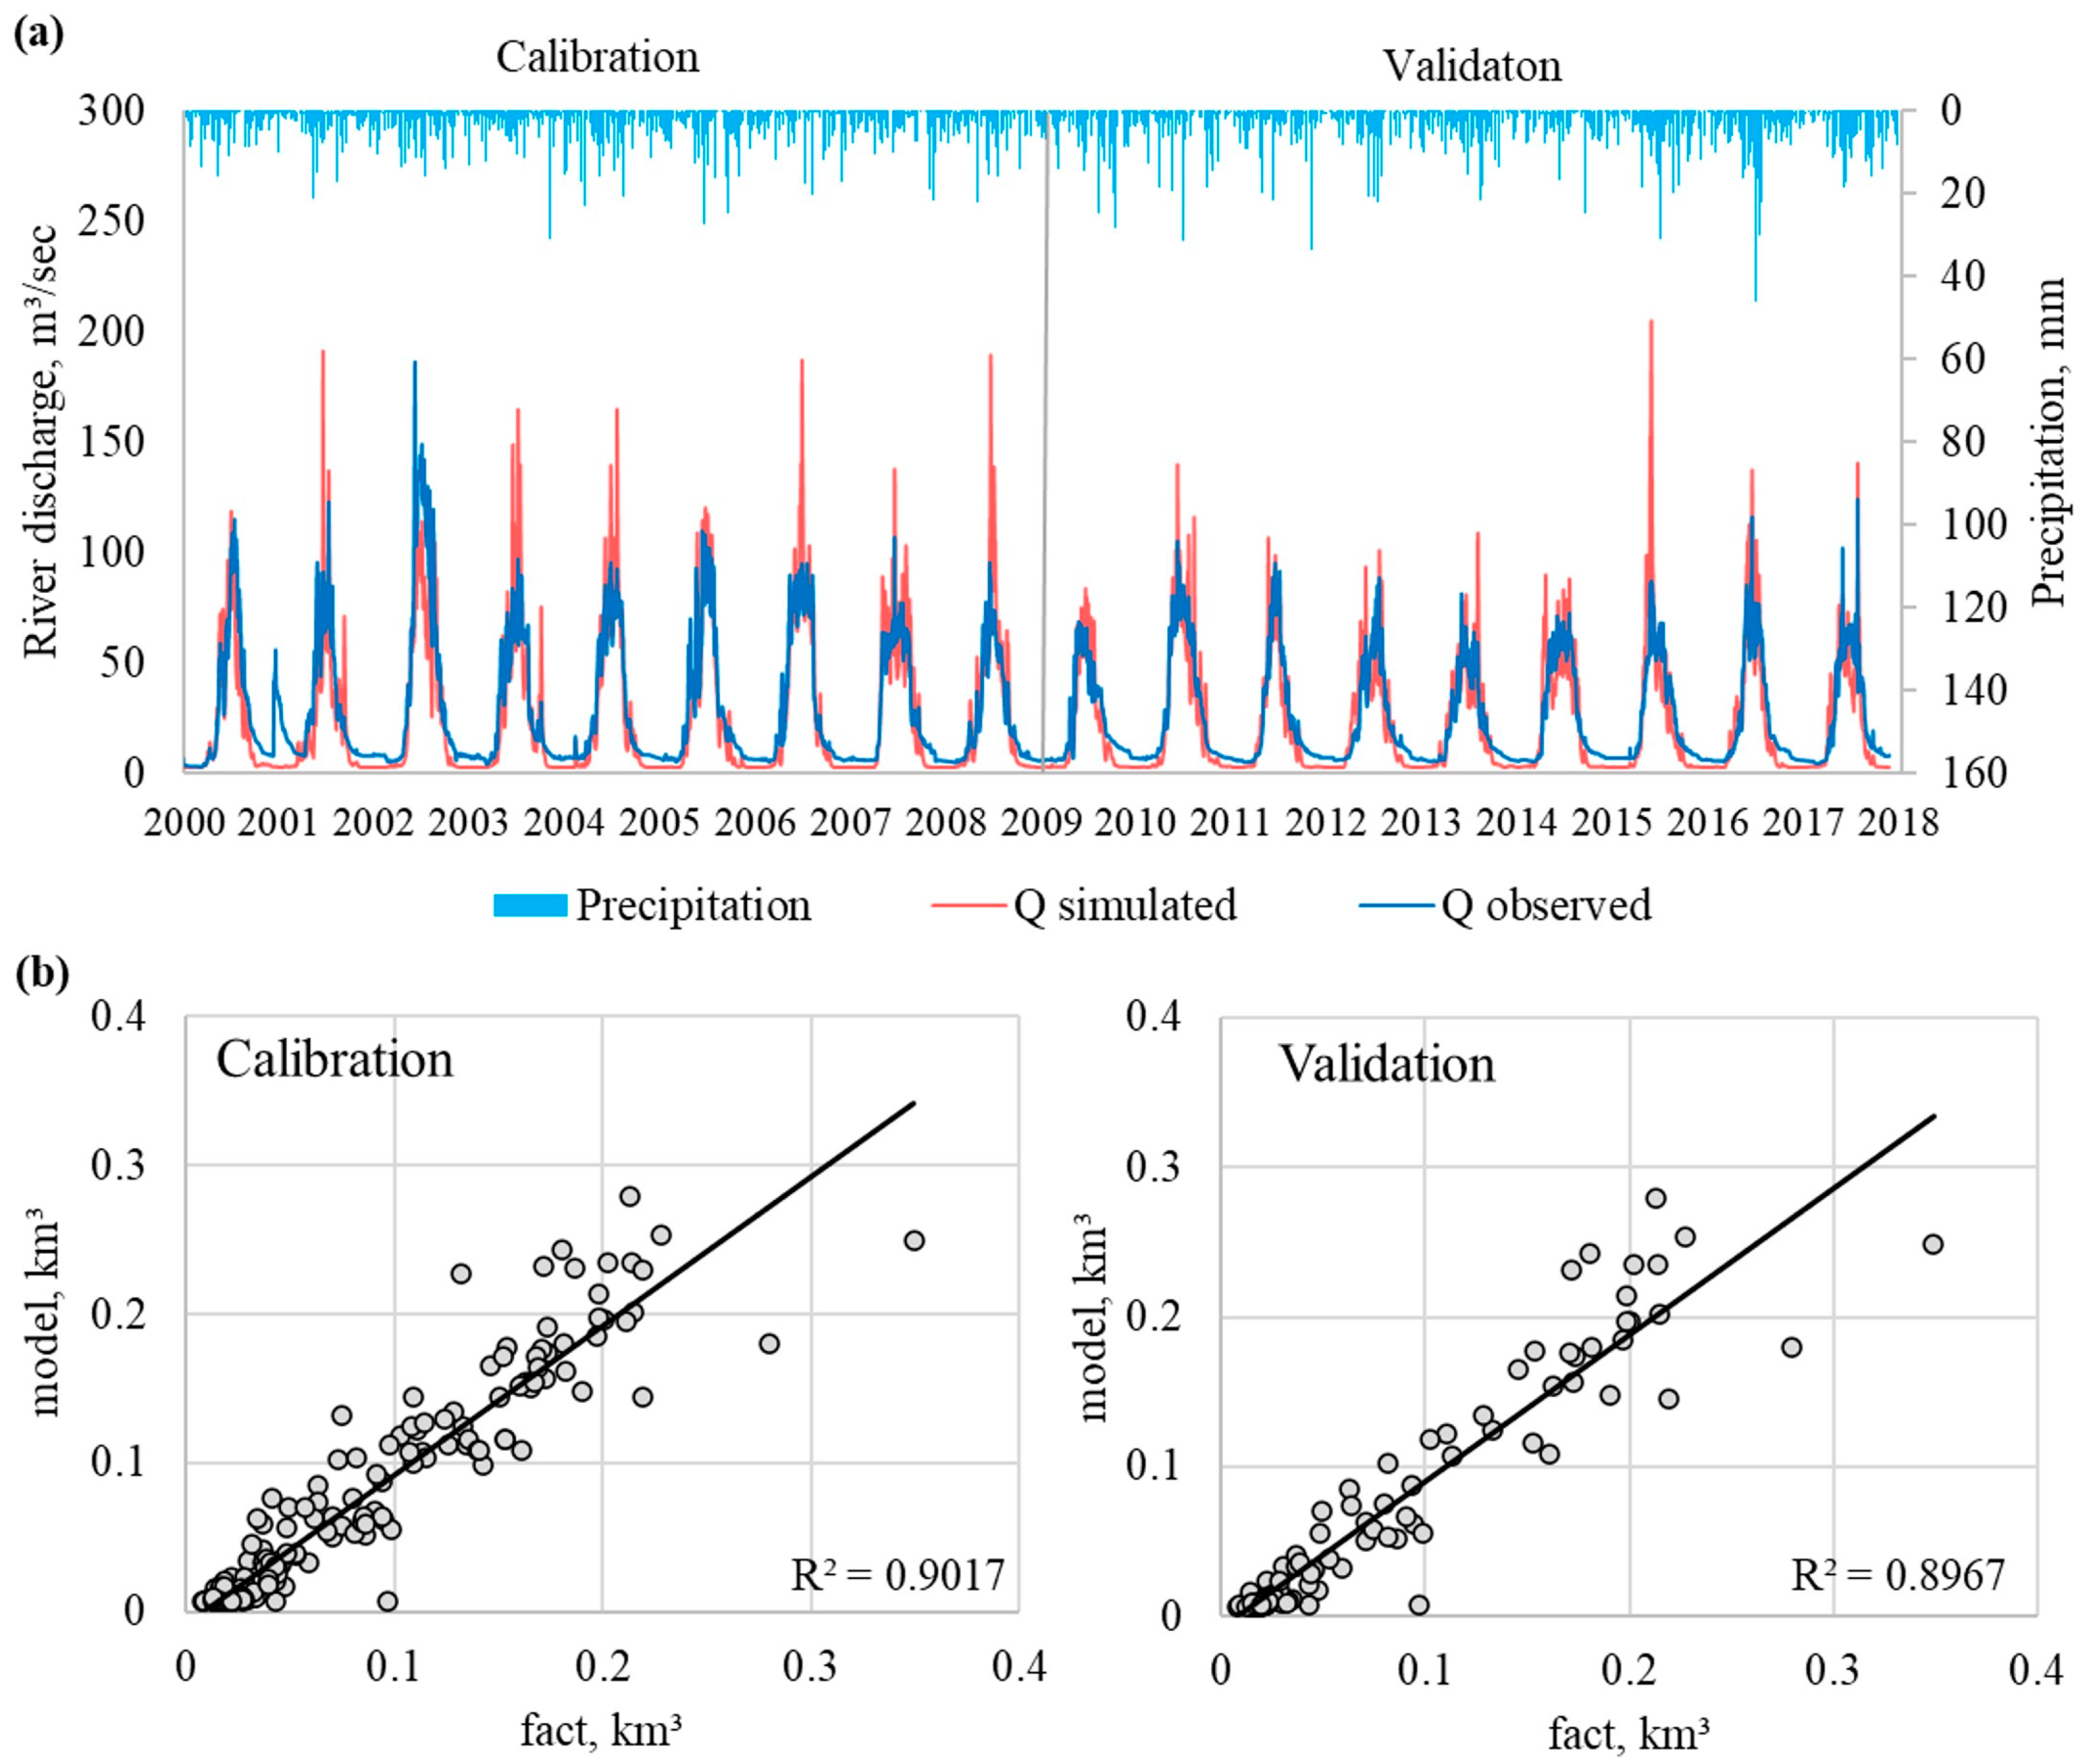
The runoff formation model was adapted to the basin under study by calibrating the model parameters. The entire time interval with an acceptable coverage by hydrometeorological data on the Terek River basin was divided into calibration and validation periods. We used criteria generally accepted in hydrological calculations, such as the evaluation criterion (BIAS, %) and the Nash–Sutcliffe efficiency (NSE), to assess the quality of modeling (Table 2). According to the calibration and validation results, the ECOMAG model satisfactorily reproduces both hydrographs and annual runoff volumes. The results of the model performance on the example of the Baksan River at the Tyrnyauz gauge are shown in Figure 5.
The parameters to which the model is most sensitive were identified by their sequential search and assigning them various values within the physically reasonable range, at the first step of the model calibration. After the determination of key parameters, the calibration was focused on the search of their individual values which yielded the best results in terms of modeling quality estimates. For the high-mountain basin of the Terek River, modelled runoff is more sensitive to the following parameters: factors for the evaporation coefficient, melting, snow water-retaining capacity, the critical temperature of snow cover melting, fresh snow density, the gradient of air temperature, and the gradient of precipitation (Table 3).
Traditional validation approaches that rely solely on observed runoff are often insufficient in mountainous regions because of the limited number of monitoring stations and complex hydrological processes. To improve model reliability, we applied a multi-objective validation strategy, using different datasets. The ECOMAG model was validated via MODIS-derived snow cover maps, stable isotope hydrograph separation and glacier mass balance observations. Our previous paper provides a step-by-step description of the model multi-objective validation process performed during our study. The main results of the multi-objective validation of the ECOMAG model are presented in Table 4.

4.2. Numerical Experiments to Assess the Sensitivity of Water Regime Characteristics to Changes in Input Conditions

4.2.1. Sensitivity of Water Regime Characteristics to Changes in Glaciation

In this experiment, we accepted that the relative changes in the glacier ratio are the same for all the elementary catchments. The general position of the snow line was determined by the initial conditions in 2010. That is, we estimated only a decrease in glacier melting due to changes in glacier area during the experiment.
The simulation results show that changes in the glaciation area have a greater effect on runoff in the high-altitude part of the basin, whereas the influence weakens downstream. For example, with a decrease in glaciation by −50% (ice50 scenario), the total flow volume in Tyrnyauz decreased by −5.1%, whereas in Zayukovo, the change was −3.1% over the estimated period. In the absence of glaciers (ice0 scenario), the runoff decreased by −9.9% and −6.0% in Tyrnyauz and Zayukovo, respectively.
The change in glaciation mainly affects discharges in July–October, because this is the period of intensive melting of glaciers that are already exposed to snow (Figure 6a). The greatest impact of glaciation is observed in August and September. For example, under the ice50 scenario, the average monthly discharge of the Baksan River decreased by −13% and −9% in August and by −12% and −8% in September, according to the Tyrnyauz and Zayukovo gauges, respectively. In the absence of glaciation (ice0 scenario), runoff from August to September decreases on average by −25% and −16%, according to the Tyrnyauz and Zayukovo gauges, respectively.

4.2.2. Sensitivity of Water Regime Characteristics to Changes in Precipitation

Changes in precipitation also lead to significant changes in runoff volume. According to the results of the numerical experiment, runoff will respond equally to an increase in precipitation at both gauges, regardless of their location, and its change will be proportional to the change in precipitation. For example, with an increase in precipitation of +10%, the flow volume will also increase by +9.5–10% at both gauges. However, the change in maximum discharge over the period will be slightly greater than the change in precipitation. Therefore, the maximum discharge increases by +25% at both gauges, with an increase in precipitation of +20%. This is because the maximum flow is usually formed by the overlap of rain floods on the main wave of high water (snowmelt). That is, in this case, there is a combination of two factors—a change in winter and summer precipitation, both of which increased by +20%. On the one hand, snow formed by winter solid precipitation is melting intensively; on the other hand, liquid summer precipitation is falling.
Notably, the greatest changes in runoff volume are observed in the period from May to October, which is a period of intense snowmelt and floods (Figure 6b). In the summer months, the change in average monthly water consumption can reach 20–30% under the pre+(–)20% scenario, whereas in winter, the change in runoff is close to zero, because precipitation falls in a solid aggregate state. In the summer months, the change in the average monthly discharge can reach 20–30% under the pre+(–)20% scenario, whereas in winter, the change in runoff is close to zero, because precipitation falls in a solid aggregate state.

4.2.3. Sensitivity of Water Regime Characteristics to Changes in Air Temperature

The dynamics of air temperature, according to current trends, affect not only the change in annual runoff, but also the intra-annual runoff distribution. The results of the numerical experiment show that the impact of changes in air temperature on the downstream flow decreases. For example, the total runoff volume increases by +15% and +8% with increasing air temperature of +4 °C at the Tyrnyauz and Zayukovo gauges, respectively. The reason is that an increase in air temperature affects snow melting, which is mainly located in the high-altitude part of the basin.
However, the maximum discharge decreases as the air temperature increases. Therefore, the maximum flow decreases by −19.9% and −14.8% under the temp+4 °C scenario at the Tyrnyauz and Zayukovo gauges, respectively. The increase in air temperature leads not only to earlier snowmelt and increased glacier melting, but also to a decrease in solid precipitation, as well as snow melting in winter.
As a result of an increase in air temperature, there is a shift in high water to earlier periods, a decrease in runoff in summer and, conversely, an increase in runoff in autumn (Figure 6c). The change in runoff under the temp+6 °C scenario in the spring months in Tyrnyauz can reach +200–300%, whereas in Zayukovo, the changes under the same conditions are slightly above +100%. Runoff decreases in the summer months because evaporation increases and snowmelt shifts in high-altitude zones earlier in the year. In autumn, an increase in air temperature leads to the melting of permanent snow cover and an increase in liquid precipitation. This, in turn, caused an increase in runoff in Tyrnyauz by +150% and up to +60% in Zayukovo, under the temp+6 °C scenario.
However, in reality, all of the above factors affect river flow at the same time and in parallel, making it necessary to simulate runoff formation based on climate change scenarios.

4.3. Modeling Results on the Transformation of Flow Formation Mechanisms

We selected two ultimate climate scenarios, RCP2.6 and RCP8.5, to evaluate the potential variations in streamflow within the upper reaches of the Terek River basin. We computed the anomalies in hydrometeorological characteristics, averaging them over three future periods: 2006–2039, 2040–2069, and 2070–2099. These metrics were compared against corresponding metrics derived from the historical baseline period of 1977–2005.

4.3.1. Air Temperature

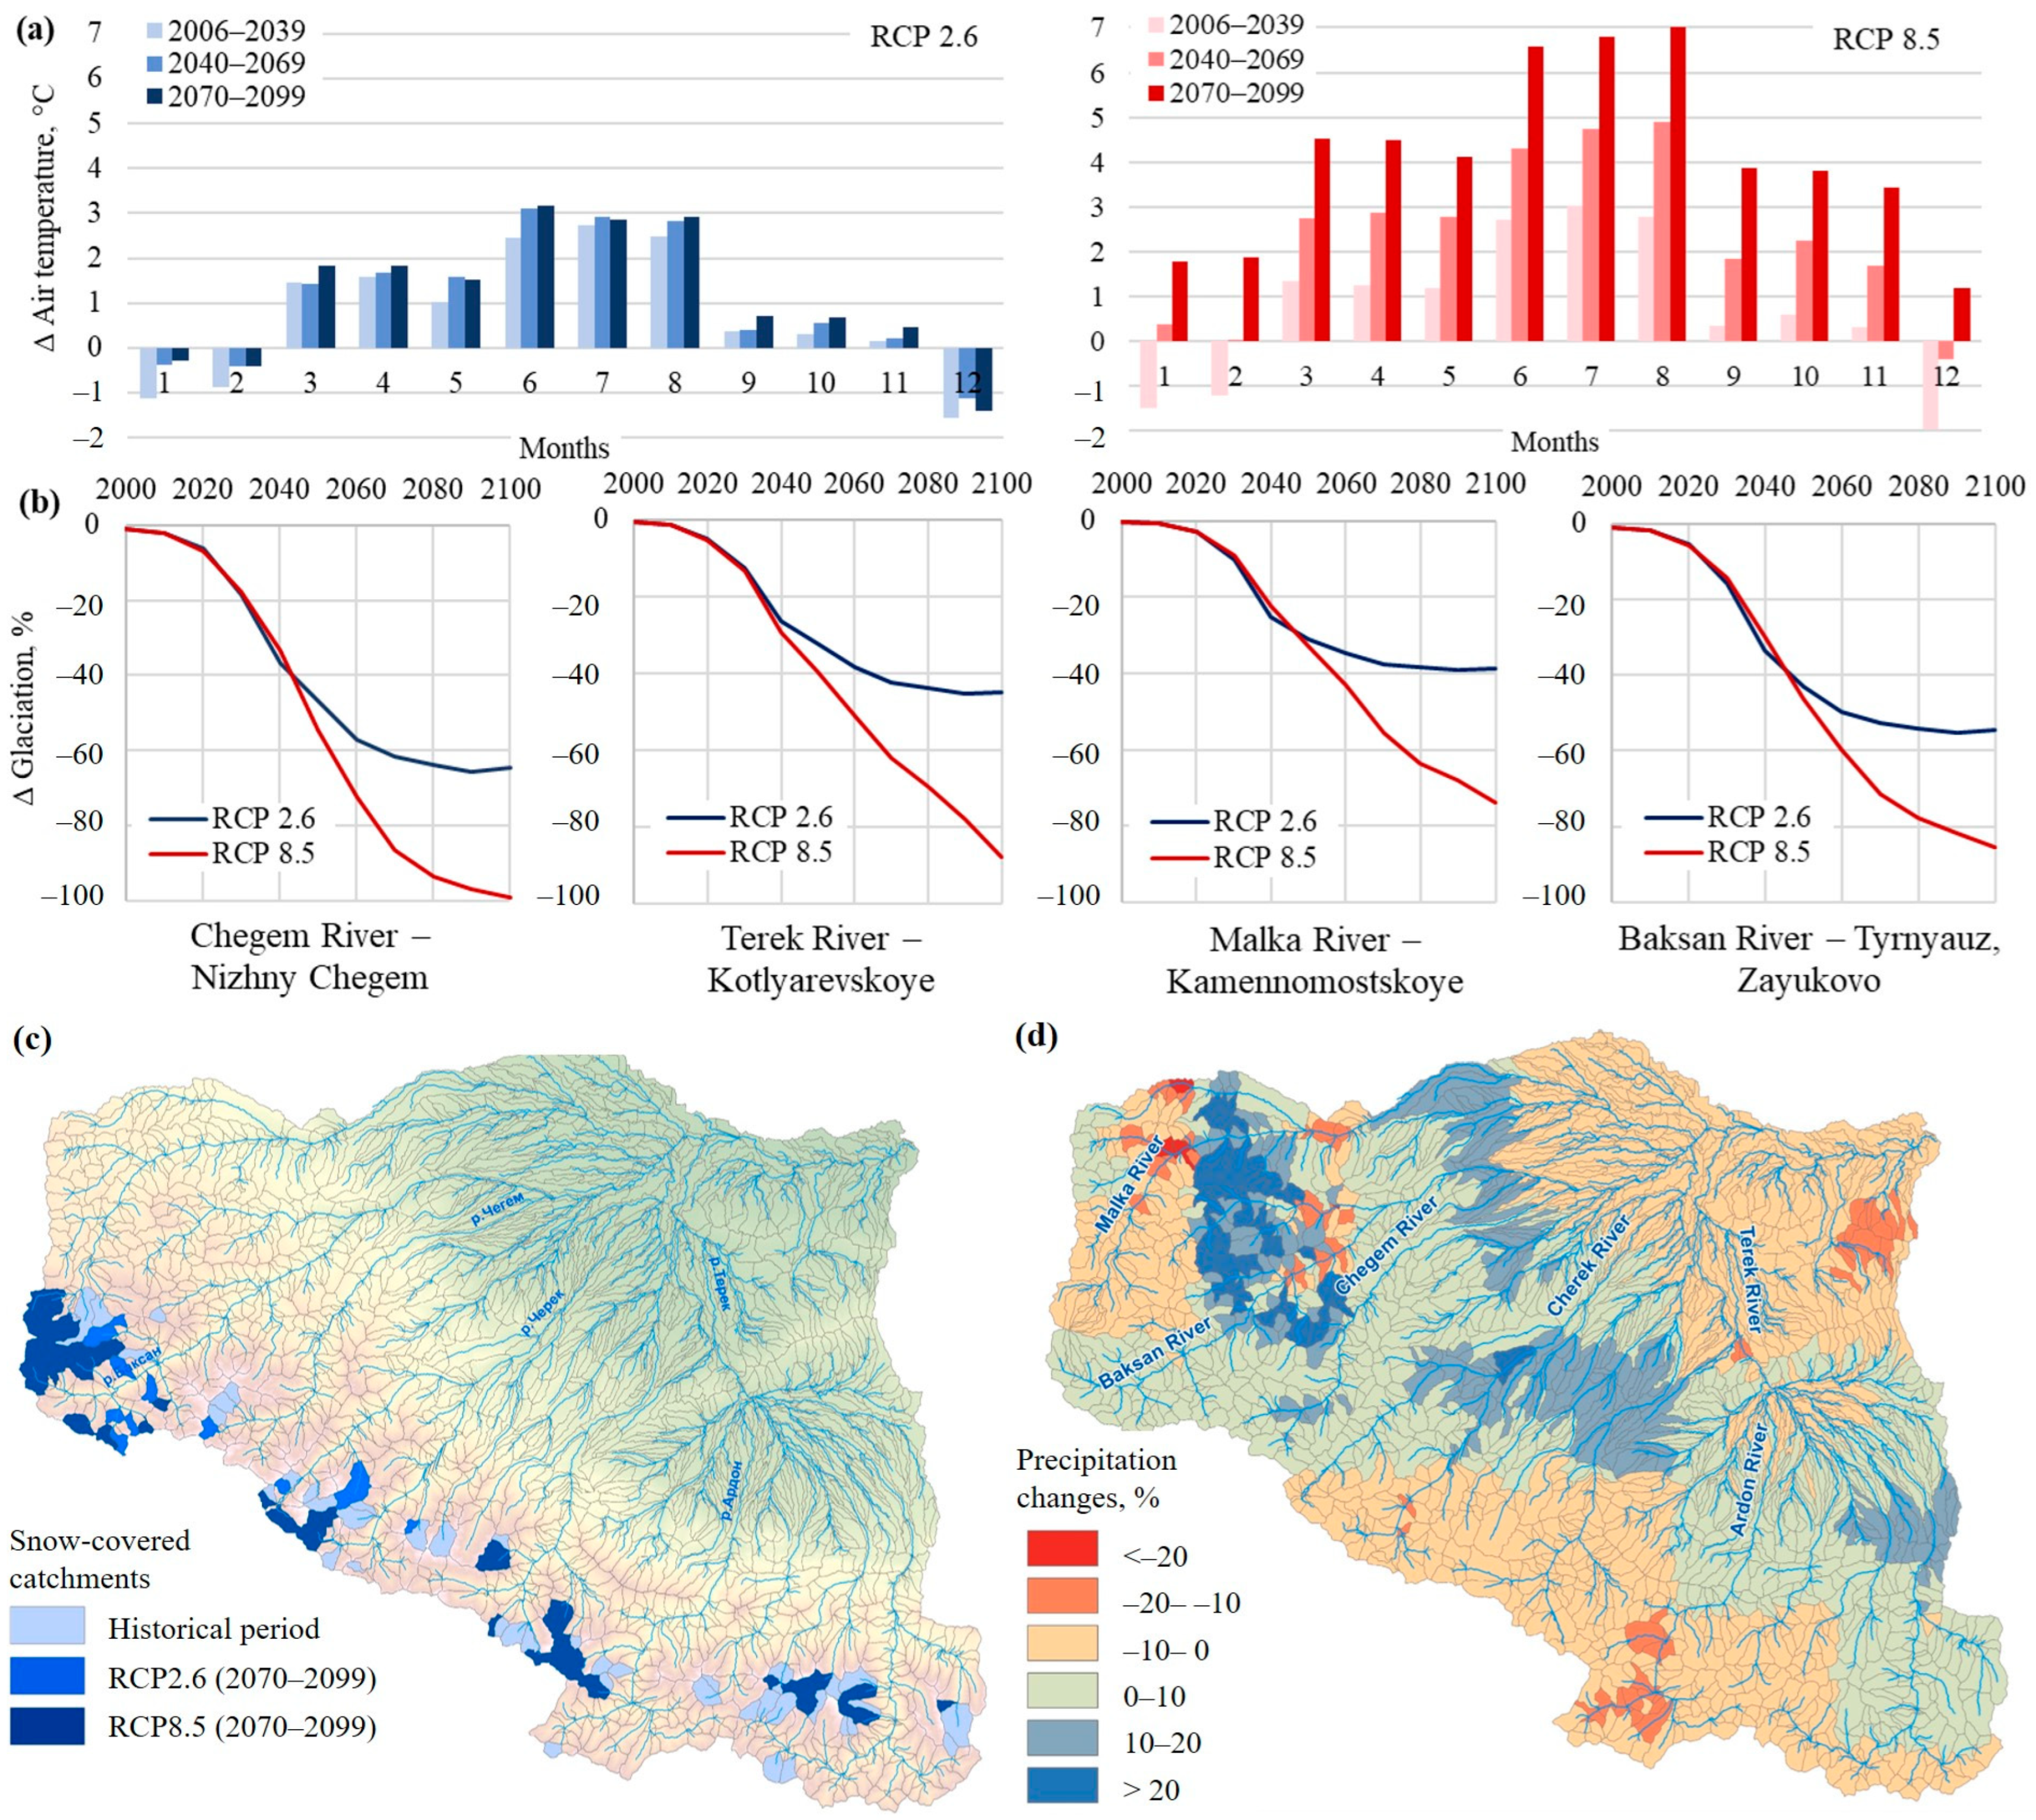
According to CORDEX climate modeling data, the average annual air temperature in the Terek River basin is projected to increase by 2 °C by the middle of the century (2040–2069) and by 4 °C by the end of the century (2070–2099) under the RCP8.5 scenario. For the RCP2.6 scenario, temperature increases are expected to be between 0.8 and 1.2 °C from 2040 to 2069 and between 1 and 1.2 °C from 2070 to 2099 (see Figure 7a). Under the RCP2.6 scenario, the regional climate is expected to stabilize in the latter half of the century, unlike under the RCP8.5 scenario. Analysis of the annual temperature distribution indicates that summer temperatures from 2070 to 2099 could increase by 2–3 °C under RCP2.6 and by 6–7 °C under RCP8.5, relative to the historical baseline of 1977–2006. At the same time, there are smaller air temperature anomalies in the winter months, including negative anomalies. These trends are expected to contribute to increased snow accumulation in the winter and more active melting in the summer.
Following the temperature increase, evaporation from the surface of the studied Terek River basin also rises. Under the RCP2.6 scenario, evaporation is projected to increase by 8% by the last third of the 21st century, while under the RCP8.5 scenario, it will rise by more than 25%.

4.3.2. Glaciation

The glaciation area in the high-altitude parts of the Terek River basin is projected to decrease significantly by 2100: by 55% under the RCP2.6 scenario and by 90% under the RCP8.5 scenario. However, due to the varying altitudinal locations of glaciers, their responses to climate change differ. For example, in the Malka River watershed, which is fed primarily by glaciers and snow from the northern and northeastern slopes of Mount Elbrus, the glaciation area under the RCP8.5 scenario is expected to decrease by 75% by the end of the century. In contrast, in the Chegem River watershed, which receives meltwater from glaciers on the northern slope of the Greater Caucasus Range, glaciation is projected to decrease by nearly 100%. Thus, the degree of glacial retreat varies, depending on the specific subbasin (see Figure 7b).

4.3.3. Precipitation

Under the RCP2.6 scenario, the annual precipitation in most parts of the study area is projected to increase by up to 10%. Conversely, in the RCP8.5 scenario, precipitation is expected to decrease by up to 20%, primarily in the high-altitude parts and the lowland areas of the watershed. However, regardless of the climate change scenario, precipitation is anticipated to increase by 10–20% in foothill regions, particularly in the river valleys of Baksan and Malka (Figure 7d).
The intra-annual distribution of precipitation is more sensitive to climatic changes, with an increase in winter precipitation from October to March and, conversely, a significant decrease during the rest of the period. The largest increase in precipitation is possible in December, with 15% and 23% in the 2070–2099 period in the RCP2.6 and RCP8.5 scenarios, respectively, which favors snow accumulation. In January and February, the increase in precipitation will be 5–10% for both scenarios. During the summer months, precipitation is expected to decrease, especially under the ‘hard’ scenario from 2070 to 2099, and will range from 8% in June to 25% in August.
Other studies [58] also confirmed the projected precipitation patterns for the Caucasus region. During winter, both the global and regional climate models consistently indicate a general increase in total precipitation. In contrast, summer projections show a substantial decline in average precipitation. While there is an overall tendency toward a decrease in heavy precipitation events during the winter season, certain areas exhibit localized increases. In summer, under the RCP8.5 scenario, a pronounced intensification of extreme precipitation is projected, affecting most of the region. Consequently, this scenario suggests that future reductions in total rainfall will be accompanied by less frequent but more intense precipitation episodes across much of the Caucasus.

4.3.4. Snowline

In addition, due to changes in meteorological conditions, the average annual position of the snowline in the high-altitude part of the basin varies (Figure 7c). To compare the snowline positions, snow cover data for elementary catchments, as of 1 September, were used. Over the last thirty years of the 21st century, fewer catchments were covered by snow at the end of the melting season. According to modeling based on historical data, on 1 September, an average of 222 catchments were snow-covered during the period. In the last third of the 21st century, this number decreased to 89 catchments for the RCP2.6 scenario and 50 for the RCP8.5 scenario. The average height of snow-covered catchments also increased, amounting to 3356 m on the basis of historical data. For the RCP2.6 scenario, this figure was 3598 m, and for RCP8.5, it was 3757 m. An increase in the average annual snowline height also indicates that the increase in air temperature has not been compensated for by an increase in winter precipitation.

4.3.5. Annual Runoff

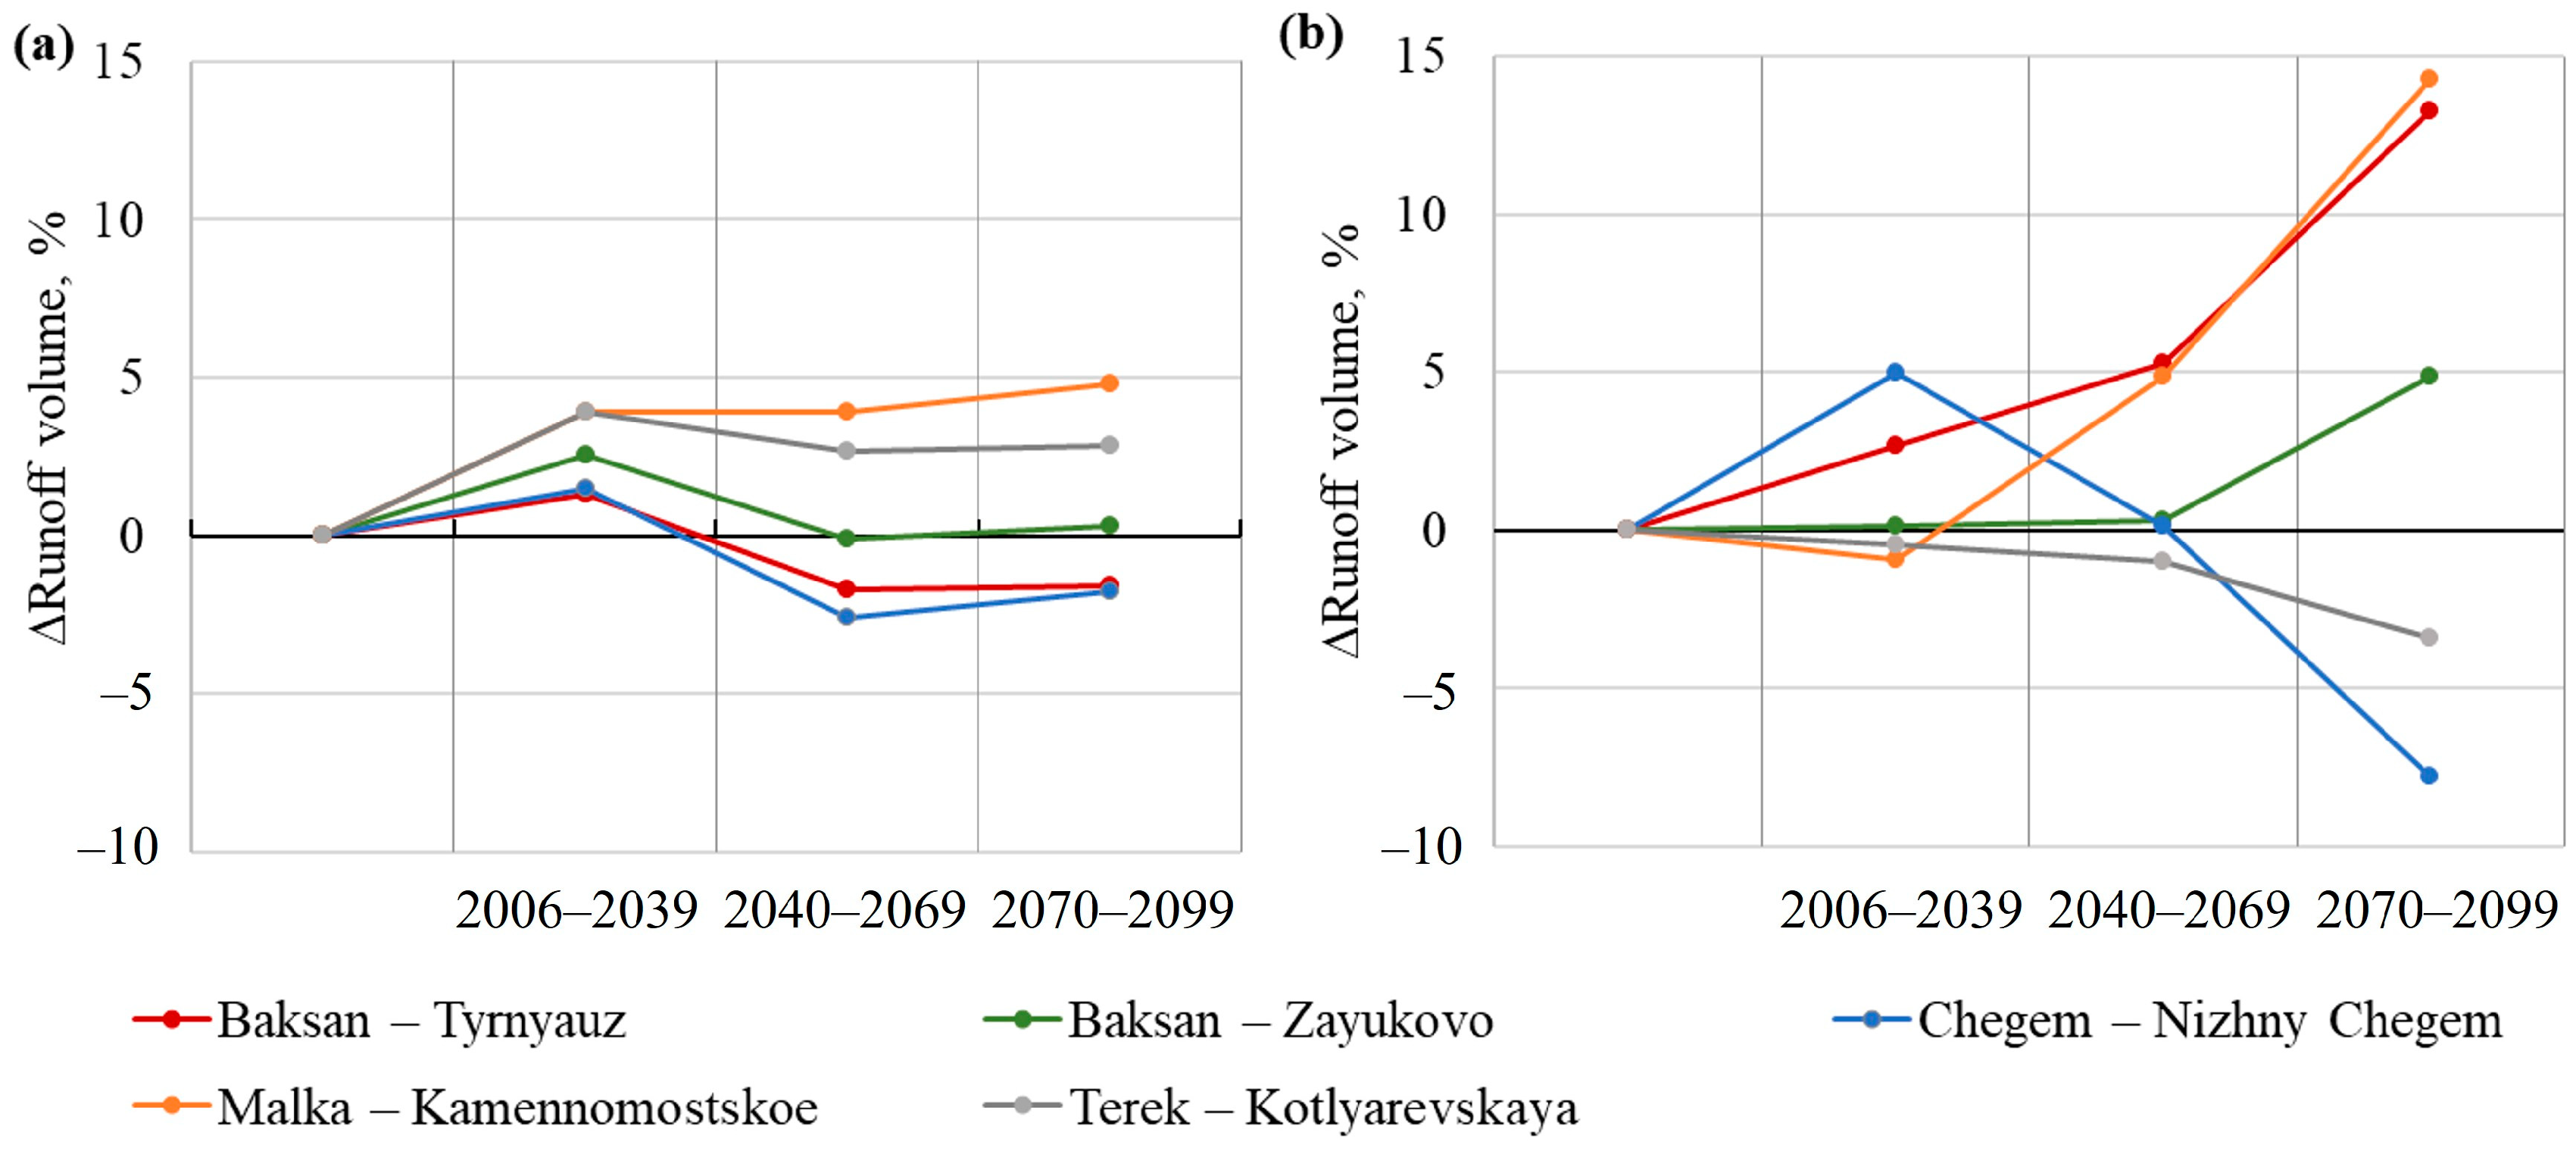
According to runoff formation modeling, the high-altitude part of the Terek River basin may experience both decreases and increases in runoff throughout the 21st century, influenced by a combination of climate change and deglaciation. The direction of these changes will depend primarily on the conditions and rates of glacier melting, as well as the locations of the snow and glacial feeding zones (Figure 8).
Under the RCP2.6 scenario, the changes in river flow are less dramatic than those projected under RCP8.5. Initially, an increase in runoff volume of 1–4% was expected across all gauges from 2006 to 2039. This will be followed by a decrease in flow from 2040 to 2069, with stabilization expected in the final third of the 21st century, aligning with the stabilization of temperatures and glaciers. From 2070 to 2099, runoff from the Malka River at the Kamennomostskoye and the Terek River at the Kotlyarevskoye gauges, which are both fed by the melting glaciers and permanent snow of the Elbrus and Kazbek mountains, is expected to continue increasing slightly. Runoff in the Baksan River at the Zayukovo gauge is also expected to increase modestly, due to a greater proportion of rainfall-fed water than that at the upstream Tyrnyauz gauge.
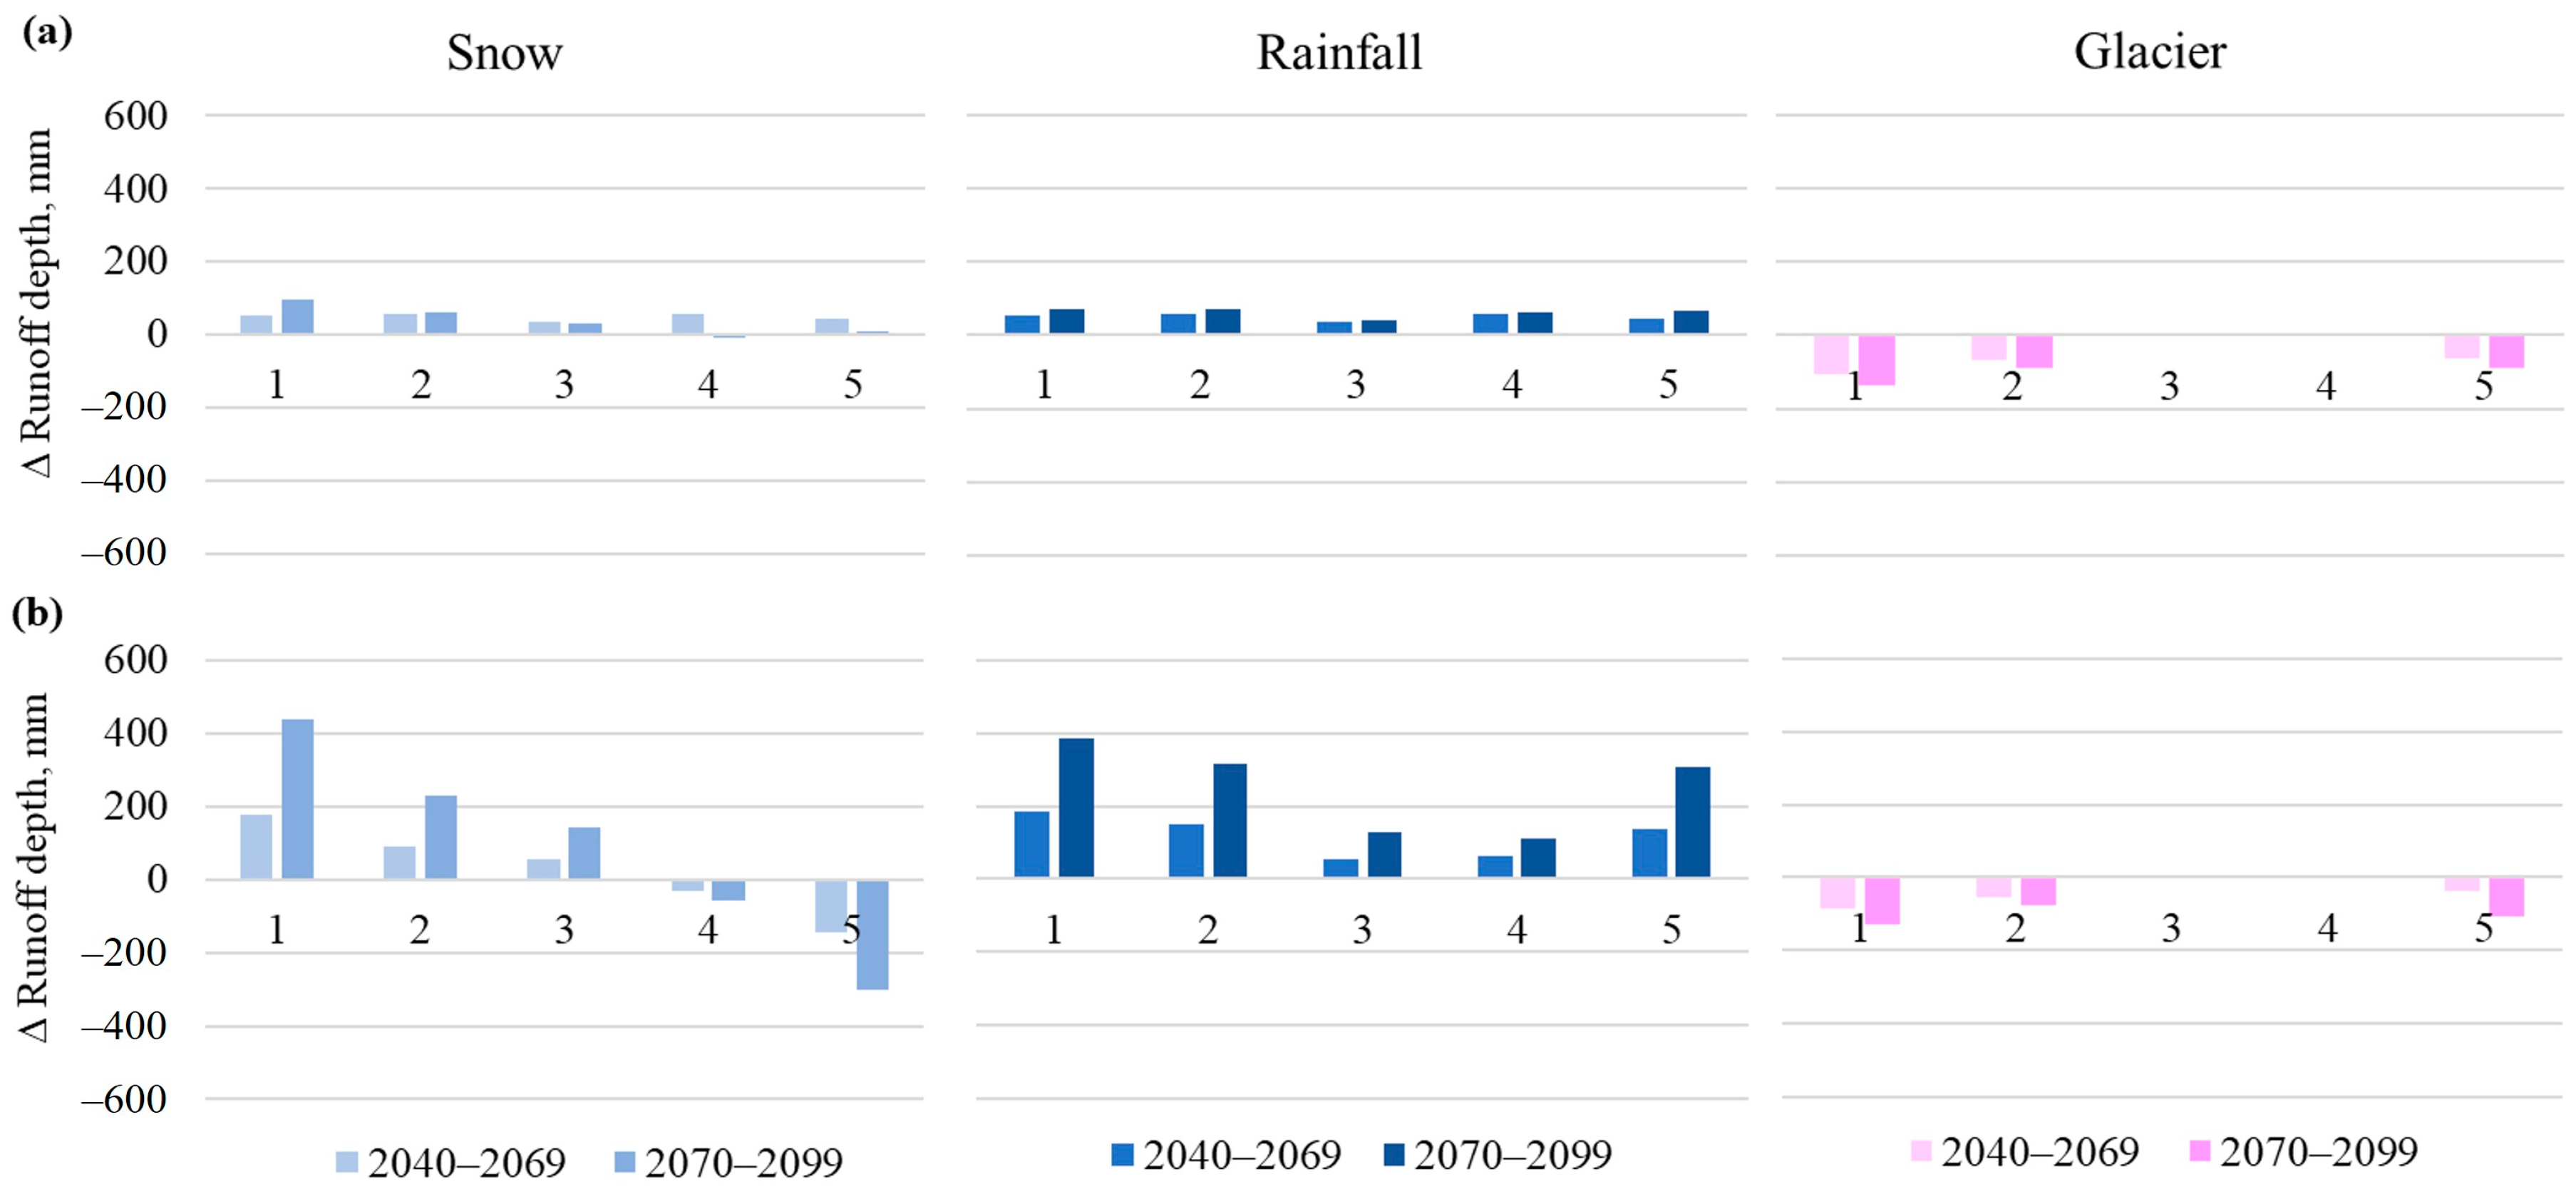
By the last third of the 21st century, under the RCP2.6 scenario, minor changes in annual snow and rainfall runoff (up to 70–80 mm) are anticipated (Figure 9a). However, in the context of rising temperatures and accelerated glacier degradation, annual glacial runoff is expected to decrease significantly, ranging from 150 to 400 mm. This degradation of glaciers will play the most critical role, leading to reduced runoff in the high-altitude areas of the Baksan River (Tyrnyauz) and Chegem River (Nizhny Chegem) basins. Nonetheless, an underlying increase in precipitation is projected to increase flow in larger basins that have a greater proportion of rainfall runoff.
Under the RCP8.5 scenario, changes in flow volume are more pronounced than those under the RCP2.6 scenario, particularly in the basins of the Baksan and Malka Rivers (Tyrnyauz–Baksan River, Zayukovo–Baksan River, and Kamennomostskoe–Malka River), where a significant portion of the runoff originates from glacial and snow melting on the slopes of Elbrus. These changes are predominantly positive, and are associated with an increase in snow yield ranging from 100 to 400 mm toward the end of this century (Figure 9b). The most substantial increases in runoff by the end of the 21st century under the RCP8.5 scenario are expected at the Malka River—Kamennomostskoye gauge (14%) and the Baksan River—Tyrnyauz gauge (13%).
Downstream flow changes depend on the proportion of snow and glacial melt in the total flow volume. For example, the RCP8.5 scenario projects a flow increase of 5% at the downstream gauge of the Baksan River, Zayukovo, and 4% at the Terek River, Kotlyarevskaya gauge, which is close to the Ossetian part of the Terek River basin. This scenario also predicts a significant increase in precipitation, alongside a decrease in glacial runoff.
Focusing on the Chegem River, the direction of flow changes at specific gauges is heavily influenced by the altitude of the sub-basin, which affects the intensity of glacier and permanent snow melting. Thus, under the RCP8.5 scenario, the flow volume of the Chegem River is expected to increase by up to 5% until the middle of this century, followed by a substantial decrease, reaching a decline of 8% in the last third of the century. Conversely, the flows of the Malka and Baksan Rivers are anticipated to continue increasing until the century’s end. A similar trend is expected in high-altitude river basins whose feeding zones are situated on the slopes of Mount Kazbek.

4.3.6. Flow Regime

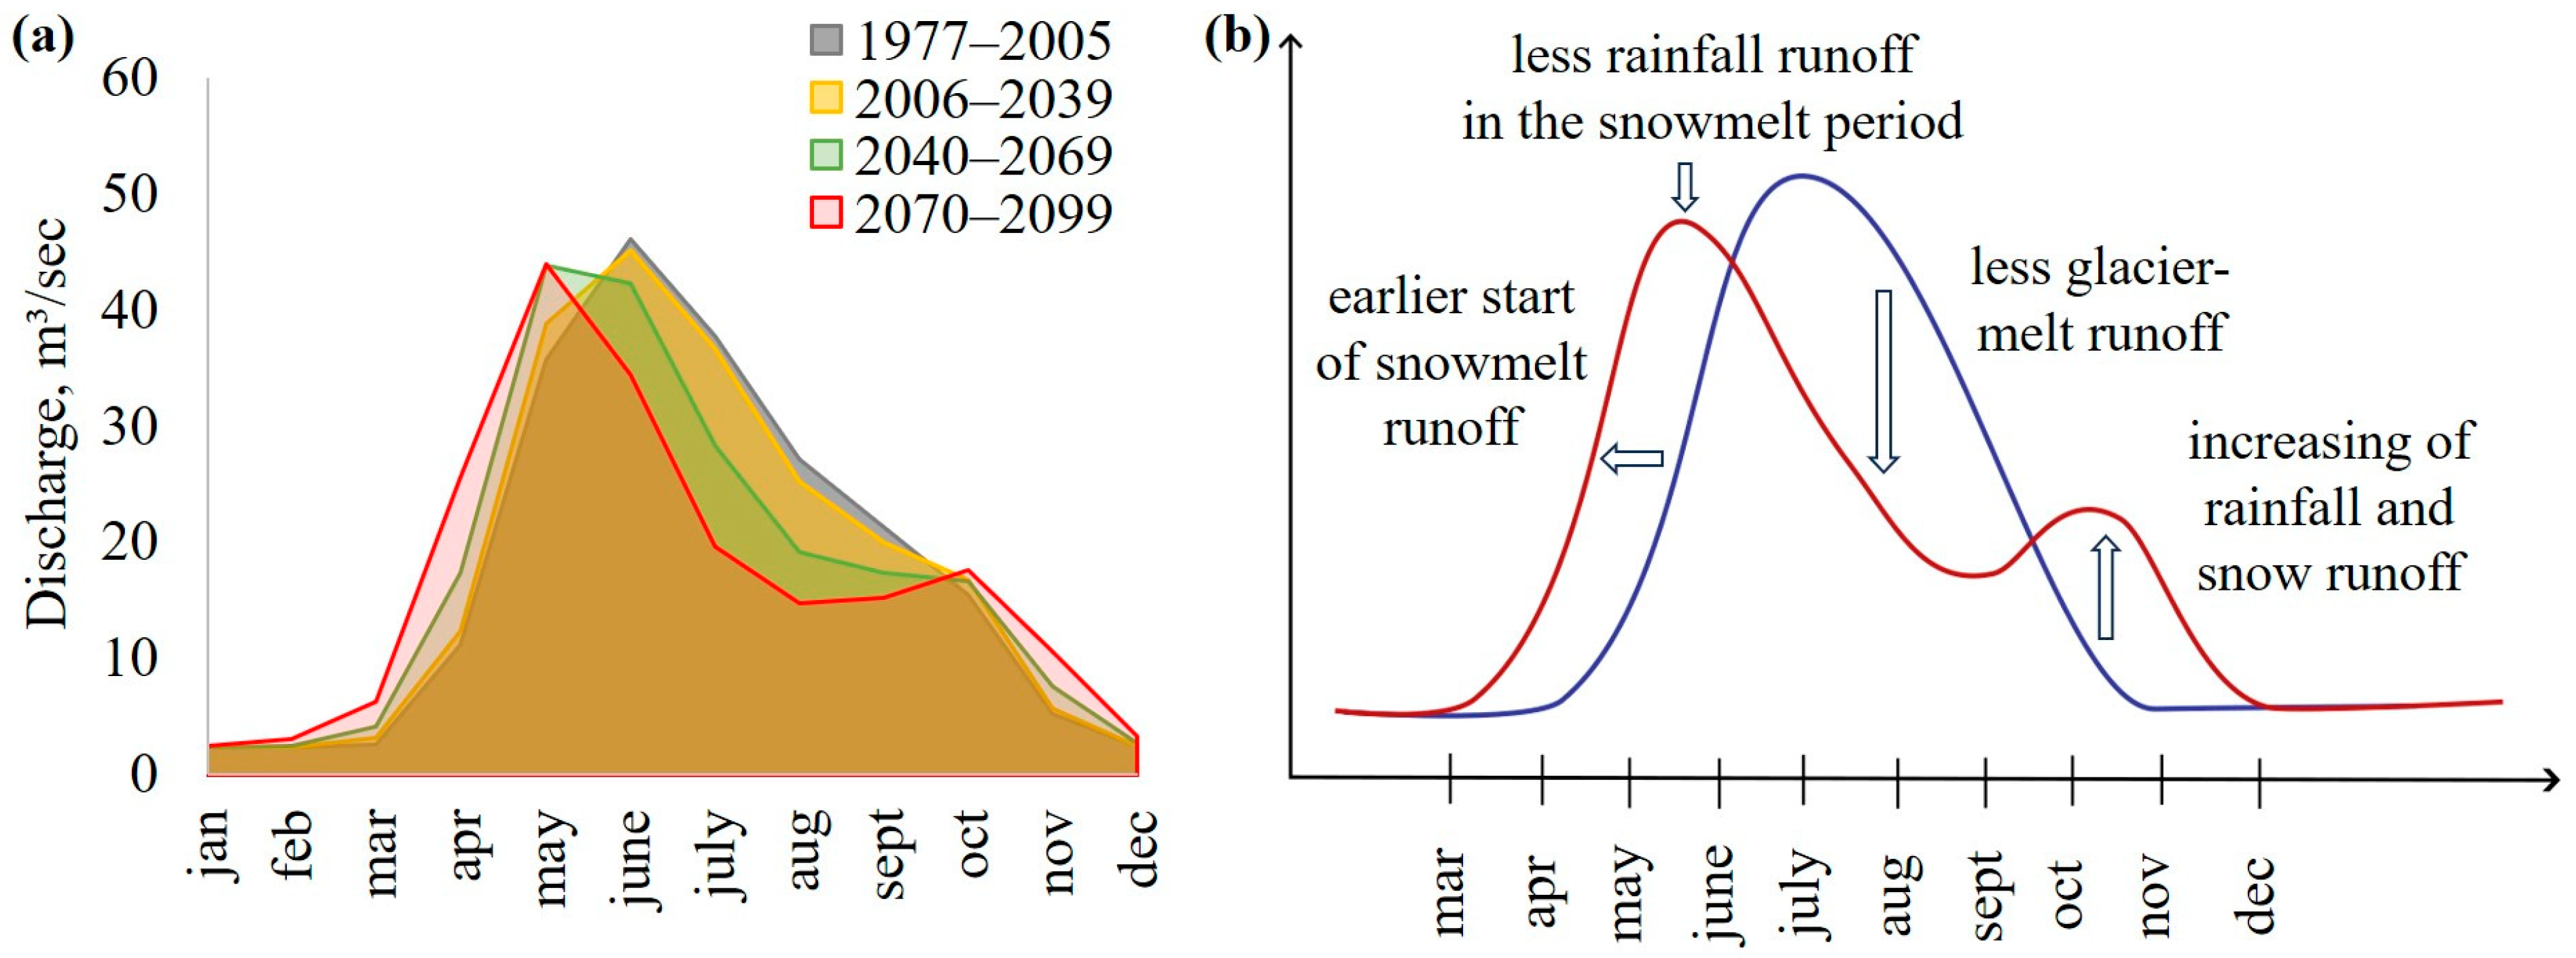
In both the RCP2.6 and RCP8.5 climate scenarios, it is anticipated that the hydrographs at all the studied gauges will undergo significant transformation, characterized by an earlier onset of the high-water period and reduced discharges in the summer months of June, July, and August, aligning with current trends. The changes are more pronounced under the RCP8.5 scenario, where the intra-annual runoff distribution clearly shows “spreading out” of the hydrograph. By the last third of the 21st century, the start of the high-water period is predicted to shift to March, with the peak water period moving to May and June, and a notable decrease in summer discharge. Additionally, an increase in flow volume during autumn is expected, driven by the melting of fresh snow, the ongoing melting of permanent snow, and an increase in liquid precipitation. This increase in autumn rainfall is likely to lead to more frequent and intense flooding events (Figure 10).
Under the RCP8.5 scenario, the most significant relative changes in monthly runoff volumes are projected for the spring and autumn periods by the end of this century. These changes correlate with the peak variations in precipitation, air temperature, and the volume of snowmelt. For example, the average monthly discharge at the Baksan River–Tyrnyauz gauge is expected to increase by 80–210% from April–May and October–November. Similarly, at the Chegem River–Nizhny Chegem gauge, the increase will range from 90–150% in March–April and November. Conversely, summer runoff is expected to decline across high-altitude gauges. Specifically, the Baksan and Malka Rivers might experience a decrease of 5–15% in runoff, whereas more pronounced reductions of up to 40% could occur in the gauges of the Chegem and Terek Rivers, where the most extensive deglaciation is anticipated. This substantial deglaciation will lead to the most marked changes in summer runoff under the RCP8.5 scenario.
The model’s estimates for the climate forecast period corroborate existing trends in the intra-annual distribution of runoff, highlighting a shift in the start of the high-water period to an earlier date, a decrease in summer runoff volumes, and an increase during the autumn months. These alterations could result in a scarcity of water resources during the summer, a critical period for agriculture and water supply. Additionally, the increased rainfall during the autumn months may trigger extreme events, such as lake outbursts, debris flows, and landslides in mountainous areas. This heightened activity increases the risk of flooding in river valleys during the autumn, posing significant challenges to disaster management and mitigation strategies in the region. These findings underscore the importance of revising water management and emergency response plans to accommodate these shifts in runoff patterns and their potential impacts.

5. Discussion

Runoff trends in different mountain regions are strongly influenced by the timing of peak water, which is significantly positively correlated with the glacierized area, current ice cover fraction, and basin latitude [59]. In catchments where peak water has not yet occurred, glacier contributions to runoff are expected to continue increasing in the near future, because of ongoing glacier mass loss. Conversely, in basins that have already surpassed the peak water phase, a gradual decline in glacier-fed runoff is anticipated, reflecting diminishing ice reserves. Studies in high-alpine catchments of the Swiss Alps [60] demonstrate a consistent pattern in glacierized basins: an initial phase of increased annual discharge is followed by a decline, primarily driven by progressive glacier retreat. In addition to glacier dynamics, long-term precipitation trends are also highly important. By the end of the century, a larger fraction of precipitation is expected to occur in liquid form, while the contribution of snowmelt to total runoff will decrease. Similar findings are reported for Himalayan watersheds [61], where increased runoff has been observed in both highly and moderately glacierized basins, although for different reasons. In more glacierized basins, runoff growth is driven by intensified glacier melt, whereas in less glacierized areas, increased precipitation plays a dominant role. In the Tien Shan–Pamir–Karakoram region, which encompasses the southern slopes of the Karakoram region and extends into the Himalayas, runoff is projected to increase continuously until the 2050s, because of a combination of glacier melt and rising precipitation [62]. According to the research [63] on the interior of Tien-Shan, glacier retreat and snow cover reduction in response to warming have already led to changes in the seasonal structure of runoff, with higher summer-autumn discharge due to glacial melt, and reduced spring runoff, traditionally driven by snowmelt.
According to [17], many rivers in the Caucasus have already passed the phase of peak water, and the ongoing changes primarily reflect an intra-annual redistribution of streamflow driven by continued glacier degradation. Hagg et al. [31] also projected a further decrease in glacial runoff in July, August, and September for the Baksan River, by 2050 and 2090. This includes a decrease in meltwater volume caused by the reduction in glaciated area, as well as a shift in the timing of peak runoff to earlier times in the year. However, other studies [64] suggest that for rivers fed by the Elbrus glacier system, the peak has not yet occurred. For example, Malka River glacier runoff continues to increase, which can be explained by glaciers on Mount Elbrus accounting for approximately 60% of the total glaciation in the Malka River Basin. In contrast, Elbrus glaciation represents only approximately 20% of the total glaciation in the Baksan River basin, where most glaciers are smaller and located outside the Elbrus massif. Similarly, our findings indicate an increase in annual discharge in catchments, with a substantial contribution from Elbrus-related glacier melt.
Despite the application of multi-objective validation for the ECOMAG model, which includes hydrometric observations, satellite-based snow coverage, hydrograph isotope separation, and glacier mass balance data, the modeling approach still has several limitations.
The temperature-index melt model used in the simulations [42] is too simple and does not account for several key processes influencing glacial melt. Glaciologists are developing more advanced methods of accounting for glacier dynamics on the basis of energy balance, but it is difficult to apply these methods on a regional scale because of the large amount of input data needed. For example, the JULES [65] or GLIMB [66] models use an energy-balance method in contrast to the index-temperature method. These models require more detailed meteorological data, such as long- and shortwave radiation balance, wind speed, air humidity, and atmospheric pressure data, as inputs. Therefore, simpler approaches are used for regional runoff modeling in large basins [67,68,69]. To improve accuracy, coupling complex energy-balance glacial and hydrological models that can help predict future discharge changes more reliably is essential, especially in large glacier-fed rivers, where meltwater plays a crucial role. A better representation of glaciers is particularly important for assessing the impact of climate change, especially during warm and extreme years.
Recent studies [70,71,72] emphasize that landscapes and soil characteristics are not static. but evolve under the combined influence of climate change and anthropogenic pressures. These dynamic changes, such as shifts in land use, vegetation cover, and soil properties, can significantly affect hydrological processes. and should be incorporated into long-term modeling strategies. In international practice, modeling approaches that account for changes in landscape and soil properties exist, especially in the context of long-term climate and anthropogenic impacts. These methods include dynamic updates of land use and soil parameters within hydrological models, as well as scenario-based modeling of landscape transformation [73,74,75,76]. In our future research, we plan to incorporate this factor to improve runoff modeling in high-mountain regions via the ECOMAG hydrological model, adapted to account for changes in landscape and soil characteristics.
One more limitation of the current modeling framework is the lack of explicit consideration of the probability and potential impact of extreme hydrometeorological events, such as heavy precipitation or glacial lake outburst floods (GLOFs). This becomes particularly relevant under the RCP8.5 scenario, which projects an intensification of autumn rainfall that could trigger such hazards. Coupling runoff formation models with hydrodynamic models has become a common practice in hydrological forecasting [77,78]. A similar methodology was previously applied by Kornilova et al. [79], where a glacial lake outburst scenario from Lake Bashkara and its downstream impact on the Baksan River under present and future climatic conditions were simulated. Future research should focus on embedding modules capable of estimating the likelihood and intensity of extreme events, particularly flash floods, GLOFs, and debris flows, into the model structure. Special attention must be given to the autumn period (September–November), when increasing liquid precipitation and the melting of persistent snow cover are expected to increase hydrological risk.

6. Conclusions

In this study, we utilized meteorological data from the CORDEX climate experiment and glacier retreat assessments from the GloGEMFlow-DD glaciological model to evaluate changes in flow within the Terek River Basin through to the end of the 21st century. We integrated these data into the ECOMAG runoff formation model by developing schemes for assimilating climatic and glacial modeling data. The input data included average daily air temperatures, daily precipitation, and the glacier area within each elementary watershed, with the glacier melting coefficients adjusted every 10 years.
The numerical experiments revealed that changes in glacier area primarily affect streamflow in the high-mountain part of the basin, particularly during the peak melt season (July–October), but this influence weakens downstream, with minimal impact on peak discharges, due to flood wave superposition. Precipitation changes proportionally alter annual runoff, most noticeably from May to October, and significantly influence peak flows. Rising air temperatures shift snowmelt peaks earlier, reduce summer flows, and increase spring and autumn runoff, although their effect diminishes downstream as snow and glacier contributions decrease.
Our model projected changes in river flow on the basis of climate forecasts and glacial changes over the century. We anticipate a decline in glacial runoff. However, despite this, the projected increase in rainfall suggests that both increases and decreases in annual runoff could occur, varying with the altitude of the sub-basin and the proportions of glacier- and snow-feeding areas. Under the RCP8.5 scenario, substantial increases in air temperatures are expected to accelerate glacier and snow melt in high-altitude areas. In contrast, under the RCP2.6 scenario, changes in flow are less pronounced. We also noted variations in the intra-annual runoff distribution, including an earlier shift in the high-water period and increased autumn runoff, associated with continued melting of permanent snow and greater liquid precipitation.
This study confirms the effectiveness of the applied models in assessing changes in river flow in high-altitude regions. These findings are crucial for establishing a monitoring system for potentially dangerous hydrological processes in mountain basins and enhancing water supply management in the North Caucasus. This approach provides valuable insights for adapting water resource management and planning, in response to changing climatic conditions.

Author Contributions

Conceptualization, E.D.P. and I.N.K.; methodology, E.D.P., I.N.K., Y.G.M., I.A.K., T.N.P. and O.O.R.; software, Y.G.M.; formal analysis and investigation, E.D.P., I.N.K., Y.G.M. and E.P.R.; writing—original draft preparation, E.D.P. and I.N.K.; writing—review and editing, E.D.P., I.N.K., I.A.K. and T.N.P.; visualization, E.D.P.; supervision, I.N.K., Y.G.M., E.P.R. and O.O.R.; project administration, O.O.R.; funding acquisition, Y.G.M., E.P.R. and O.O.R. All authors have read and agreed to the published version of the manuscript.

Funding

The study was carried out under the Governmental Order to Water Problems Institute, Russian Academy of Sciences (subject no. FMWZ-2025-0003—adaptation of the ECOMAG model, calculation), under the state assignment of the Hydrology Department, Faculty of Geography, Lomonosov Moscow State University (CITIS 121051400038-1—collection and analysis of actual data on the Terek River basin).

Institutional Review Board Statement

Not Applicable.

Informed Consent Statement

Not Applicable.

Data Availability Statement

The data presented in this study are available upon request from the corresponding author.

Conflicts of Interest

The authors declare no conflicts of interest.

References

  1. Jones, J.A. Hydrologic responses to climate change: Considering geographic context and alternative hypotheses. Hydrol. Process. 2011, 25, 5. [Google Scholar] [CrossRef]
  2. Adler, C.; Huggel, C.; Orlove, B.; Nolin, A. Climate change in the mountain cryosphere: Impacts and responses. Reg. Environ. Change 2019, 19, 1225–1228. [Google Scholar] [CrossRef]
  3. Milner, A.M.; Khamis, K.; Battin, T.J.; Brittain, J.E.; Barrand, N.E.; Füreder, L.; Cauvy-Fraunié, S.; Gíslason, G.M.; Jacobsen, D.; Hannah, D.M.; et al. Glacier shrinkage driving global changes in downstream systems. Proc. Natl. Acad. Sci. USA 2017, 114, 9770–9778. [Google Scholar] [CrossRef]
  4. Bliss, A.; Hock, R.; Radić, V. Global response of glacier runoff to twenty-first century climate change. J. Geophys. Res. Earth Surf. 2014, 119, 717–730. [Google Scholar] [CrossRef]
  5. Pellicciotti, F.; Bauder, A.; Parola, M. Effect of glaciers on streamflow trends in the Swiss Alps. Water Resour. Res. 2010, 46. [Google Scholar] [CrossRef]
  6. Carrivick, J.L.; Tweed, F.S. A global assessment of the societal impacts of glacier outburst floods. Glob. Planet. Change 2016, 144, 1–16. [Google Scholar] [CrossRef]
  7. Harrison, S.; Kargel, J.S.; Huggel, C.; Reynolds, J.; Shugar, D.H.; Betts, R.A.; Emmer, A.; Glasser, N.; Haritashya, U.K.; Klimeš, J.; et al. Climate change and the global pattern of moraine-dammed glacial lake outburst floods. Cryosph 2018, 12, 1195–1209. [Google Scholar] [CrossRef]
  8. Tielidze, L.G.; Bolch, T.; Wheate, R.D.; Kutuzov, S.S.; Lavrentiev, I.I.; Zemp, M. Supra-glacial debris cover changes in the Greater Caucasus from 1986 to 2014. Cryosphere 2020, 14, 585–598. [Google Scholar] [CrossRef]
  9. Hugonnet, R.; McNabb, R.; Berthier, E.; Menounos, B.; Nuth, C.; Girod, L.; Farinotti, D.; Huss, M.; Dussaillant, I.; Brun, F.; et al. Accelerated global glacier mass loss in the early twenty-first century. Nature 2021, 592, 726–731. [Google Scholar] [CrossRef] [PubMed]
  10. Tielidze, L.G.; Wheate, R.D. The Greater Caucasus Glacier Inventory (Russia, Georgia and Azerbaijan). Cryosphere 2018, 12, 81–94. [Google Scholar] [CrossRef]
  11. Marzeion, B.; Hock, R.; Anderson, B.; Bliss, A.; Champollion, N.; Fujita, K.; Huss, M.; Immerzeel, W.W.; Kraaijenbrink, P.; Malles, J.H.; et al. Partitioning the Uncertainty of Ensemble Projections of Global Glacier Mass Change. Earth’s Futur. 2020, 8, e2019EF001470. [Google Scholar] [CrossRef]
  12. Shahgedanova, M.; Hagg, W.; Zacios, M.; Popovnin, V. An Assessment of the Recent Past and Future Climate Change, Glacier Retreat, and Runoff in the Caucasus Region Using Dynamical and Statistical Downscaling and HBV-ETH Hydrological Model. In Regional Aspects of Climate-Terrestrial-Hydrologic Interactions in Non-boreal Eastern Europe; Springer: Dordrecht, The Netherlands, 2009; pp. 63–72. [Google Scholar]
  13. Tashilova, A.; Ashabokov, B.; Kesheva, L.; Teunova, N. Analysis of Climate Change in the Caucasus Region: End of the 20th–Beginning of the 21st Century. Climate 2019, 7, 11. [Google Scholar] [CrossRef]
  14. Zolotarev, E.; Kharkovets, E. Development of glaciers of mount Elbrus after the Little Ice Age. Ice Snow 2015, 52, 15. [Google Scholar] [CrossRef]
  15. Kutuzov, S.; Legrand, M.; Preunkert, S.; Ginot, P.; Mikhalenko, V.; Shukurov, K.; Poliukhov, A.; Toropov, P. The Elbrus (Caucasus, Russia) ice core record-Part 2: History of desert dust deposition. Atmos. Chem. Phys. 2019, 19, 14133–14148. [Google Scholar] [CrossRef]
  16. Toropov, P.A.; Aleshina, M.A.; Grachev, A.M. Large-scale climatic factors driving glacier recession in the Greater Caucasus, 20th–21st century. Int. J. Climatol. 2019, 39, 4703–4720. [Google Scholar] [CrossRef]
  17. Rets, E.P.; Durmanov, I.N.; Kireeva, M.B.; Smirnov, A.M.; Popovnin, V.V. Past ‘peak water’ in the North Caucasus: Deglaciation drives a reduction in glacial runoff impacting summer river runoff and peak discharges. Clim. Change 2020, 163, 2135–2151. [Google Scholar] [CrossRef]
  18. Rets, E.; Kireeva, M. Hazardous hydrological processes in mountainous areas under the impact of recent climate change: Case study of Terek River basin. IAHS-AISH Publ. 2010, 340, 126–134. [Google Scholar]
  19. Rahman, K.; Maringanti, C.; Beniston, M.; Widmer, F.; Abbaspour, K.; Lehmann, A. Streamflow Modeling in a Highly Managed Mountainous Glacier Watershed Using SWAT: The Upper Rhone River Watershed Case in Switzerland. Water Resour. Manag. 2013, 27, 323–339. [Google Scholar] [CrossRef]
  20. Omani, N.; Srinivasan, R.; Karthikeyan, R.; Smith, P. Hydrological Modeling of Highly Glacierized Basins (Andes, Alps, and Central Asia). Water 2017, 9, 111. [Google Scholar] [CrossRef]
  21. Singh, V.; Jain, S.K.; Shukla, S. Glacier change and glacier runoff variation in the Himalayan Baspa river basin. J. Hydrol. 2021, 593, 125918. [Google Scholar] [CrossRef]
  22. Duethmann, D.; Bolch, T.; Farinotti, D.; Kriegel, D.; Vorogushyn, S.; Merz, B.; Pieczonka, T.; Jiang, T.; Su, B.; Güntner, A. Attribution of streamflow trends in snow and glacier melt-dominated catchments of the Tarim River, Central Asia. Water Resour. Res. 2015, 51. [Google Scholar] [CrossRef]
  23. Huss, M.; Fischer, M. Sensitivity of very small glaciers in the swiss alps to future climate change. Front. Earth Sci. 2016, 4, 34. [Google Scholar] [CrossRef]
  24. Wiersma, P.; Aerts, J.; Zekollari, H.; Hrachowitz, M.; Drost, N.; Huss, M.; Sutanudjaja, E.H.; Hut, R. Coupling a global glacier model to a global hydrological model prevents underestimation of glacier runoff. Hydrol. Earth Syst. Sci. 2022, 26, 5971–5986. [Google Scholar] [CrossRef]
  25. Yin, Z.; Feng, Q.; Liu, S.; Zou, S.; Li, J.; Yang, L.; Deo, R.C. The spatial and temporal contribution of glacier runoffto watershed discharge in the Yarkant River Basin, Northwest China. Water 2017, 9, 159. [Google Scholar] [CrossRef]
  26. Burger, F.; Ayala, A.; Farias, D.; Shaw, T.E.; MacDonell, S.; Brock, B.; McPhee, J.; Pellicciotti, F. Interannual variability in glacier contribution to runoff from a high-elevation Andean catchment: Understanding the role of debris cover in glacier hydrology. Hydrol. Process. 2019, 33, 214–229. [Google Scholar] [CrossRef]
  27. Mohammadi, B.; Gao, H.; Feng, Z.; Pilesjö, P.; Cheraghalizadeh, M.; Duan, Z. Simulating glacier mass balance and its contribution to runoff in Northern Sweden. J. Hydrol. 2023, 620, 129404. [Google Scholar] [CrossRef]
  28. Chen, L.; Zhang, Z.; Liu, C.; Xiong, S.; Zhang, W.; Gao, H.; Yi, Y. Incorporating glacier processes into hydrological simulations in the headwaters of the Yangtze and yellow Rivers. Sci. Total Environ. 2024, 951, 175474. [Google Scholar] [CrossRef] [PubMed]
  29. Toum, E.; Villalba, R.; Masiokas, M.H. Snow and Glacier Contributions to the Mendoza River in the Semiarid Central Andes of Argentina. Hydrol. Process. 2025, 39, e70132. [Google Scholar] [CrossRef]
  30. Muelchi, R.; Rössler, O.; Schwanbeck, J.; Weingartner, R.; Martius, O. River runoff in Switzerland in a changing climate-runoff regime changes and their time of emergence. Hydrol. Earth Syst. Sci. 2021, 25, 3071–3086. [Google Scholar] [CrossRef]
  31. Hagg, W.; Shahgedanova, M.; Mayer, C.; Lambrecht, A.; Popovnin, V. A sensitivity study for water availability in the Northern Caucasus based on climate projections. Glob. Planet. Change 2010, 73, 161–171. [Google Scholar] [CrossRef]
  32. Rets, E.; Khomiakova, V.; Kornilova, E.; Ekaykin, A.; Kozachek, A.; Mikhalenko, V. How and when glacial runoff is important: Tracing dynamics of meltwater and rainfall contribution to river runoff from headwaters to lowland in the Caucasus Mountains. Sci. Total Environ. 2024, 927, 172201. [Google Scholar] [CrossRef] [PubMed]
  33. RGI Consortium. RGI Consortium Randolph Glacier Inventory—A Dataset of Global Glacier Outlines: Version 6.0: Technical Report, Global Land Ice Measurements from Space; RGI Consortium: Boulder, CO, USA, 2017. [Google Scholar]
  34. Santer, B.D.; Wigley, T.M.L.; Boyle, J.S.; Gaffen, D.J.; Hnilo, J.J.; Nychka, D.; Parker, D.E.; Taylor, K.E. Statistical significance of trends and trend differences in layer-average atmospheric temperature time series. J. Geophys. Res. Atmos. 2000, 105, 7337–7356. [Google Scholar] [CrossRef]
  35. Hamed, K.H.; Ramachandra Rao, A. A modified Mann-Kendall trend test for autocorrelated data. J. Hydrol. 1998, 204, 182–196. [Google Scholar] [CrossRef]
  36. Shahgedanova, M.; Nosenko, G.; Kutuzov, S.; Rototaeva, O.; Khromova, T. Deglaciation of the Caucasus Mountains, Russia/Georgia, in the 21st century observed with ASTER satellite imagery and aerial photography. Cryosphere 2014, 8, 2367–2379. [Google Scholar] [CrossRef]
  37. Zemp, M.; Frey, H.; Gärtner-Roer, I.; Nussbaumer, S.U.; Hoelzle, M.; Paul, F.; Haeberli, W.; Denzinger, F.; Ahlstrøm, A.P.; Anderson, B.; et al. Historically unprecedented global glacier decline in the early 21st century. J. Glaciol. 2015, 61, 745–762. [Google Scholar] [CrossRef]
  38. Popovnin, V.; Gubanov, A.; Lisak, V.; Toropov, P. Recent Mass Balance Anomalies on the Djankuat Glacier, Northern Caucasus. Atmosphere 2024, 15, 107. [Google Scholar] [CrossRef]
  39. Rototaeva, O.V.; Nosenko, G.A.; Kerimov, A.M.; Kutuzov, S.S.; Lavrentiev, I.I.; Kerimov, A.A.; Nikitin, S.A.; Tarasova, L.N. Changes in the mass balance of the Garabashi glacier (Mt. Elbrus) at the turn of the XX-XXI centuries. Ice Snow 2019, 59, 5–22. [Google Scholar] [CrossRef]
  40. Motovilov, Y.G.; Gottschalk, L.; Engeland, K.; Belokurov, A. ECOMAG—Regional Model of Hydrological Cycle; Application to the NOPEX Region; Institute Report Series no.105; Department of Geophysics, University of Oslo: Oslo, Norway, 1999; 88p. [Google Scholar]
  41. Motovilov, Y.G. Hydrological simulation of river basins at different spatial scales: 1. Generalization and averaging algorithms. Water Resour. 2016, 43, 429–437. [Google Scholar] [CrossRef]
  42. Hock, R. Temperature index melt modelling in mountain areas. J. Hydrol. 2003, 282, 104–115. [Google Scholar] [CrossRef]
  43. Kuchment, L.; Motovilov, Y.; Nazarov, N. Sensitivity of Hydrological Systems; Nauka: Moscow, Russia, 1990. [Google Scholar]
  44. Pfeffer, W.T.; Arendt, A.A.; Bliss, A.; Bolch, T.; Cogley, J.G.; Gardner, A.S.; Hagen, J.O.; Hock, R.; Kaser, G.; Kienholz, C.; et al. The randolph glacier inventory: A globally complete inventory of glaciers. J. Glaciol. 2014, 60, 537–552. [Google Scholar] [CrossRef]
  45. Korneva, I.; Rybak, O.; Rybak, E. Correction of the model climatic data for simulation of the Central Caucasus mountain glaciers. Environ. Control Syst. 2024, 1, 9–22. [Google Scholar]
  46. Postnikova, T.; Rybak, O.; Gubanov, A.; Zekollari, H.; Huss, M.; Shahgedanova, M. Debris cover effect on the evolution of Northern Caucasus glaciers in the 21st century. Front. Earth Sci. 2023, 11, 1256696. [Google Scholar] [CrossRef]
  47. Giorgi, F.; Coppola, E.; Jacob, D.; Teichmann, C.; Abba Omar, S.; Ashfaq, M.; Ban, N.; Bülow, K.; Bukovsky, M.; Buntemeyer, L.; et al. The CORDEX-CORE EXP-I Initiative: Description and Highlight Results from the Initial Analysis. Bull. Am. Meteorol. Soc. 2022, 103, E293–E310. [Google Scholar] [CrossRef]
  48. Smiatek, G.; Kunstmann, H. Simulating future runoff in a complex terrain alpine catchment with EURO-CORDEX data. J. Hydrometeorol. 2019, 20, 1925–1940. [Google Scholar] [CrossRef]
  49. Sperna Weiland, F.C.; Visser, R.D.; Greve, P.; Bisselink, B.; Brunner, L.; Weerts, A.H. Estimating Regionalized Hydrological Impacts of Climate Change Over Europe by Performance-Based Weighting of CORDEX Projections. Front. Water 2021, 3, 713537. [Google Scholar] [CrossRef]
  50. Gao, Y.; Zhou, M.; Yu, Z.; Ju, Q.; Jin, J.; Zhang, D. Climate change impacts on seasonal runoff in the source region of the Yellow River: Insights from CORDEX experiments with uncertainty analysis. J. Hydrol. 2024, 645, 132132. [Google Scholar] [CrossRef]
  51. Zekollari, H.; Huss, M.; Farinotti, D. Modelling the future evolution of glaciers in the European Alps under the EURO-CORDEX RCM ensemble. Cryosph. 2019, 13, 1125–1146. [Google Scholar] [CrossRef]
  52. Hutter, K.; Hughes, T.J. Theoretical Glaciology. J. Appl. Mech. 1983, 51, 948. [Google Scholar] [CrossRef]
  53. Huss, M.; Farinotti, D. Distributed ice thickness and volume of all glaciers around the globe. J. Geophys. Res. Earth Surf. 2012, 117. [Google Scholar] [CrossRef]
  54. Rounce, D.R.; Hock, R.; McNabb, R.W.; Millan, R.; Sommer, C.; Braun, M.H.; Malz, P.; Maussion, F.; Mouginot, J.; Seehaus, T.C.; et al. Distributed Global Debris Thickness Estimates Reveal Debris Significantly Impacts Glacier Mass Balance. Geophys. Res. Lett. 2021, 48, e2020GL091311. [Google Scholar] [CrossRef]
  55. Millan, R.; Mouginot, J.; Rabatel, A.; Morlighem, M. Ice velocity and thickness of the world’s glaciers. Nat. Geosci. 2022, 15, 124–129. [Google Scholar] [CrossRef]
  56. Rounce, D.R.; Hock, R.; Maussion, F.; Hugonnet, R.; Kochtitzky, W.; Huss, M.; Berthier, E.; Brinkerhoff, D.; Compagno, L.; Copland, L.; et al. Global glacier change in the 21st century: Every increase in temperature matters. Science 2023, 379, 78–83. [Google Scholar] [CrossRef]
  57. Postnikova, T.N.; Rybak, O.O.; Gubanov, A.S.; Zekollari, H.; Huss, M. Mathematical Modeling of Elbrus Glaciers in the 21st Century: Part 2. Projections of Glacier Dynamics and Lake Formation under Various SSP Scenarios. Izv. Atmos. Ocean. Phys. 2024, 60, S169–S184. [Google Scholar] [CrossRef]
  58. Limareva, N.S.; David, W.; Narvaez, C.; Sein, D.V. The climate change of the Caucasus as a result of the global warming. Mod. Sci. Innov. 2017, 2, 15–26. [Google Scholar]
  59. Huss, M.; Hock, R. Global-scale hydrological response to future glacier mass loss. Nat. Clim. Chang. 2018, 8, 135–140. [Google Scholar] [CrossRef]
  60. Farinotti, D.; Usselmann, S.; Huss, M.; Bauder, A.; Funk, M. Runoff evolution in the Swiss Alps: Projections for selected high-alpine catchments based on ENSEMBLES scenarios. Hydrol. Process. 2012, 26, 1909–1924. [Google Scholar] [CrossRef]
  61. Immerzeel, W.W.; Pellicciotti, F.; Bierkens, M.F.P. Rising river flows throughout the twenty-first century in two Himalayan glacierized watersheds. Nat. Geosci. 2013, 6, 742–745. [Google Scholar] [CrossRef]
  62. Luo, Y.; Wang, X.; Piao, S.; Sun, L.; Ciais, P.; Zhang, Y.; Ma, C.; Gan, R.; He, C. Contrasting streamflow regimes induced by melting glaciers across the Tien Shan—Pamir—North Karakoram. Sci. Rep. 2018, 8, 16470. [Google Scholar] [CrossRef]
  63. Sadyrov, S.; Tanaka, K.; Satylkanov, R.; Khujanazarov, T.; Touge, Y.; Fujita, K. Modelling runoff components and hydrological processes in glaciated catchments of the inner Tien-Shan, Kyrgyzstan. Front. Earth Sci. 2024, 11, 1306476. [Google Scholar] [CrossRef]
  64. Elagina, N.; Rets, E.; Korneva, I.; Toropov, P.; Lavrentiev, I. Simulation of mass balance and glacial runoff of Mount Elbrus from 1984 to 2022. Hydrol. Sci. J. 2025, 18, 189–200. [Google Scholar] [CrossRef]
  65. Shannon, S.; Smith, R.; Wiltshire, A.; Payne, T.; Huss, M.; Betts, R.; Caesar, J.; Koutroulis, A.; Jones, D.; Harrison, S. Global glacier volume projections under high-end climate change scenarios. Cryosphere 2019, 13, 325–350. [Google Scholar] [CrossRef]
  66. Sakai, A.; Fujita, K. Contrasting glacier responses to recent climate change in high-mountain Asia. Sci. Rep. 2017, 7, 1–8. [Google Scholar] [CrossRef]
  67. Addor, N.; Rössler, O.; Köplin, N.; Huss, M.; Weingartner, R.; Seibert, J. Robust changes and sources of uncertainty in the projected hydrological regimes of Swiss catchments. Water Resour. Res. 2014, 50, 7541–7562. [Google Scholar] [CrossRef]
  68. Finger, D.; Vis, M.; Huss, M.; Seibert, J. The value of multiple data set calibration versus model complexity for improving the performance of hydrological models in mountain catchments. Water Resour. Res. 2015, 51, 1939–1958. [Google Scholar] [CrossRef]
  69. Etter, S.; Addor, N.; Huss, M.; Finger, D. Climate change impacts on future snow, ice and rain runoff in a Swiss mountain catchment using multi-dataset calibration. J. Hydrol. Reg. Stud. 2017, 13, 222–239. [Google Scholar] [CrossRef]
  70. Beniston, M. Climatic change in mountain regions: A review of possible impacts. Clim. Change 2003, 59, 5–31. [Google Scholar] [CrossRef]
  71. Tasser, E.; Leitinger, G.; Tappeiner, U. Climate change versus land-use change—What affects the mountain landscapes more? Land Use Policy 2017, 60, 60–72. [Google Scholar] [CrossRef]
  72. Jiménez-Olivencia, Y.; Ibáñez-Jiménez, Á.; Porcel-Rodríguez, L.; Zimmerer, K. Land use change dynamics in Euro-mediterranean mountain regions: Driving forces and consequences for the landscape. Land Use Policy 2021, 109, 105721. [Google Scholar] [CrossRef]
  73. Raihan, F.; Ondrasek, G.; Islam, M.S.; Maina, J.M.; Beaumont, L.J. Combined impacts of climate and land use changes on long-term streamflow in the upper halda basin, Bangladesh. Sustainability 2021, 13, 12067. [Google Scholar] [CrossRef]
  74. Polong, F.; Deng, K.; Pham, Q.B.; Linh, N.T.T.; Abba, S.I.; Ahmed, A.N.; Anh, D.T.; Khedher, K.M.; El-Shafie, A. Separation and attribution of impacts of changes in land use and climate on hydrological processes. Theor. Appl. Climatol. 2023, 151, 1337–1353. [Google Scholar] [CrossRef]
  75. Sharma, A.; Khare, R.; Choudhary, M.K.; Prasad, V. Hydrologic Impact Evaluation of Land Use and Land Cover Change in Subbasins of Tapi River Using SWAT Model. In Hydrology and Hydrologic Modelling, Proceedings of the 26th International Conference on Hydraulics, Water Resources and Coastal Engineering (HYDRO 2021), Surat, India, 23–25 December 2021; Lecture Notes in Civil Engineering; Springer Nature: Singapore, 2023; Volume 312. [Google Scholar]
  76. Jin, Z.; Zhao, Q.; Qin, X.; Zhang, J.; Zhang, H.; Qin, J.; Qin, Y.; Li, H.; Chen, J.; Liu, Y.; et al. Quantifying the impact of landscape changes on hydrological variables in the alpine and cold region using hydrological model and remote sensing data. Hydrol. Process. 2021, 35, e14392. [Google Scholar] [CrossRef]
  77. Osei, J.D.; Anyemedu, F.O.K.; Osei, D.K. Integrating 2D hydrodynamic, SWAT, GIS and satellite remote sensing models in open channel design to control flooding within road service areas in the Odaw river basin of Accra, Ghana. Model. Earth Syst. Environ. 2023, 9, 4183–4221. [Google Scholar] [CrossRef]
  78. Rai, P.K.; Dhanya, C.T.; Chahar, B.R. Coupling of 1D models (SWAT and SWMM) with 2D model (iRIC) for mapping inundation in Brahmani and Baitarani river delta. Nat. Hazards 2018, 92, 1821–1840. [Google Scholar] [CrossRef]
  79. Kornilova, E.D.; Krylenko, I.N.; Rets, E.P.; Motovilov, Y.G.; Bogachenko, E.M.; Krylenko, I.V.; Petrakov, D.A. Modeling of Extreme Hydrological Events in the Baksan River Basin, the Central Caucasus, Russia. Hydrology 2021, 8, 24. [Google Scholar] [CrossRef]
Figure 1. The Terek River basin to the Mozdok outlet.
Glacies 02 00010 g001
Figure 2. Trends (Student’s t test p values at the 5% significance level) in average annual temperature (a) and annual precipitation (b), according to actual data from meteorological stations (1977–2014) and average annual (c) and maximum (d) annual discharges, according to actual data from hydrological gauges in the Terek River Basin (1977–2018).
Glacies 02 00010 g002
Figure 3. Mass balance dynamics of representative glaciers (Djankuat [38] and Garabashi [39]) within the study area (a), and change in the area of glaciation of the Elbrus glacier system (b), satellite image Sentinel-2 30 August 2022 (contours of the glaciers of Elbrus in 1985 and 2017 provided by the Institute of Geography of the Russian Academy of Sciences).
Glacies 02 00010 g003
Figure 4. The scheme for assimilating data from climatic and glaciological models into the runoff formation model ECOMAG.
Glacies 02 00010 g004
Figure 5. Model performance at the Tyrnyauz gauge during the calibration (2000–2008) and validation (2009–2018) periods (a); scatter plots of the observed and simulated monthly flow volumes at the gauge during the calibration period and validation period (b).
Glacies 02 00010 g005
Figure 6. Average monthly hydrographs for the period from 2010 to 2020, based on the results of a numerical experiment with changes in glaciation (a), precipitation (b), and air temperature (c).
Glacies 02 00010 g006
Figure 7. Predicted changes in the Terek River basin: (a) average monthly air temperature, (b) glaciation area, (c) snow line position (snow-covered catchments as of 1 September) and (d) average precipitation for 2070–2099 in the RCP8.5 scenario, relative to the base historical period for elementary catchments.
Glacies 02 00010 g007
Figure 8. Runoff volume anomalies (%) under the climatic scenarios RCP2.6 (a) and RCP8.5 (b) relative to the base historical period for various gauges in the high-altitude part of the Terek River basin.
Glacies 02 00010 g008
Figure 9. Anomalies of the genetic runoff components for various outlets (1—Tyrnyauz, 2—Zayukovo, 3—Kamennomostskoye, 4—Kotlyarevskaya, 5—Nizhny Chegem) under the scenarios RCP2.6 (a) and RCP8.5 (b).
Glacies 02 00010 g009
Figure 10. Transformation of the intra-annual flow distribution in the Chegem River at the Nizhny Chegem gauge under the RCP8.5 scenario (a), schematic of the changes in the intra-annual runoff distribution (b).
Glacies 02 00010 g010
Table 1. Inputs to the ECOMAG model in the Terek River basin.
Data TypePeriod/Date of Publication of the DataSpatial/Temporal
Resolution
Source
Physical characteristics of the basin
Digital Elevation
Model (SRTM)
200090 m × 90 mConsultative Group for International Agriculture Research Consortium for Spatial Information (CGIAR-CSI: http://srtm.csi.cgiar.org/ (accessed on 10 November 2023)
Land use1990 (Republic of North Ossetia), 1997 (Kabardino-Balkarian Republic)1:750,000Atlas of the Kabardino-Balkarian Republic and Republic of North Ossetia
Soil1990 (Republic of North Ossetia), 1997 (Kabardino-Balkarian Republic)1:750,000Atlas of the Kabardino-Balkarian Republic and Republic of North Ossetia
Glaciation area2001–2003 гг.10 m × 10 mRGI 6.0 [44]
Hydrometeorological and glaciological data
River discharge1977–2018 (observed data)DailyHydrology annual
Precipitation,
temperature
1977–2018 (observed data)DailyMeteorological base of the IWP RAS
1977–2099 (historical and projected according RCP2.6 and RCP8.5)DailyCORDEX project [45]
Glaciation area1990–209910 yearsGloGEMflow-DD [46]
Table 2. Results of calibration and validation of the runoff formation model on the basis of water discharge data.
Gauging StationGlaciation, %Watershed Area, km2Calibration
2000–2008
Validation
2009–2017
DayMonthYearDayMonthYear
NSENSEBIASNSENSEBIAS
Baksan River—Tyrnyauz17.58380.760.87−12.80.740.86−10.0
Baksan River—Zayukovo7.421000.660.8015.20.530.6219.9
Chegem River—Nizhny Chegem7.37390.730.81−12.40.620.78−1.7
Malka River—Kamennomostskoye3.415400.420.615.10.480.685.3
Terek River—Kotlyarevskaya2.989200.560.72−7.00.450.68−9.4
Table 3. List of calibration parameters and their optimized values.
ParameterDescriptionRangeOptimized Value
EKOPTFactor for evaporation coefficient (dimensionless)0.4–0.70.7
ALFOPTFactor for melting factor, mm/day °C0.4–0.80.4
UlmaxSnow water-retaining capacity (dimensionless)0.1–0.70.1
TCRstCoefficient for the critical temperature of snow cover thawing (dimensionless)−2–+2+2
RnewDensity of fresh snow, g/cm30.01–0.20.04
GradTTemperature gradient, °C/m−0.005−0.007−0.0047
GradPPrecipitation gradient, m/m−0.0003–0.00070.00043
Table 4. Results of multi-objective validation of the ECOMAG model.
DataValuesDistributionR2pBIAS, %
Snow data (MODIS)Snow cover (%)Daily0.72+19%
Monthly0.85+20%
Isotopic hydrograph separationMeltwater runoff (m3/s)Monthly0.81−18%
Rainfall runoff (m3/s)Monthly0.86+20%
Mass balance glacier observations (WGMS)Garabashi ablation (mm)Yearly0.20−15%
Djankuat ablation (mm)Yearly0.18−55%
Disclaimer/Publisher’s Note: The statements, opinions and data contained in all publications are solely those of the individual author(s) and contributor(s) and not of MDPI and/or the editor(s). MDPI and/or the editor(s) disclaim responsibility for any injury to people or property resulting from any ideas, methods, instructions or products referred to in the content.