
Effect of Fatty Acid Mixture on the Hyperplastic and Hypertrophic Growth of Subcutaneous Bovine Stromal Vascular Fraction Cells In Vitro


Abstract
1. Introduction
2. Materials and Methods
2.1. Stromal Vascular Fraction Isolation
2.2. Experiment 1—Hyperplasia
2.3. Experiment 2—Hypertrophy
2.4. mRNA qPCR
2.5. Fatty Acid Analysis
2.6. Statistical Analysis
3. Results
3.1. Hyperplasia
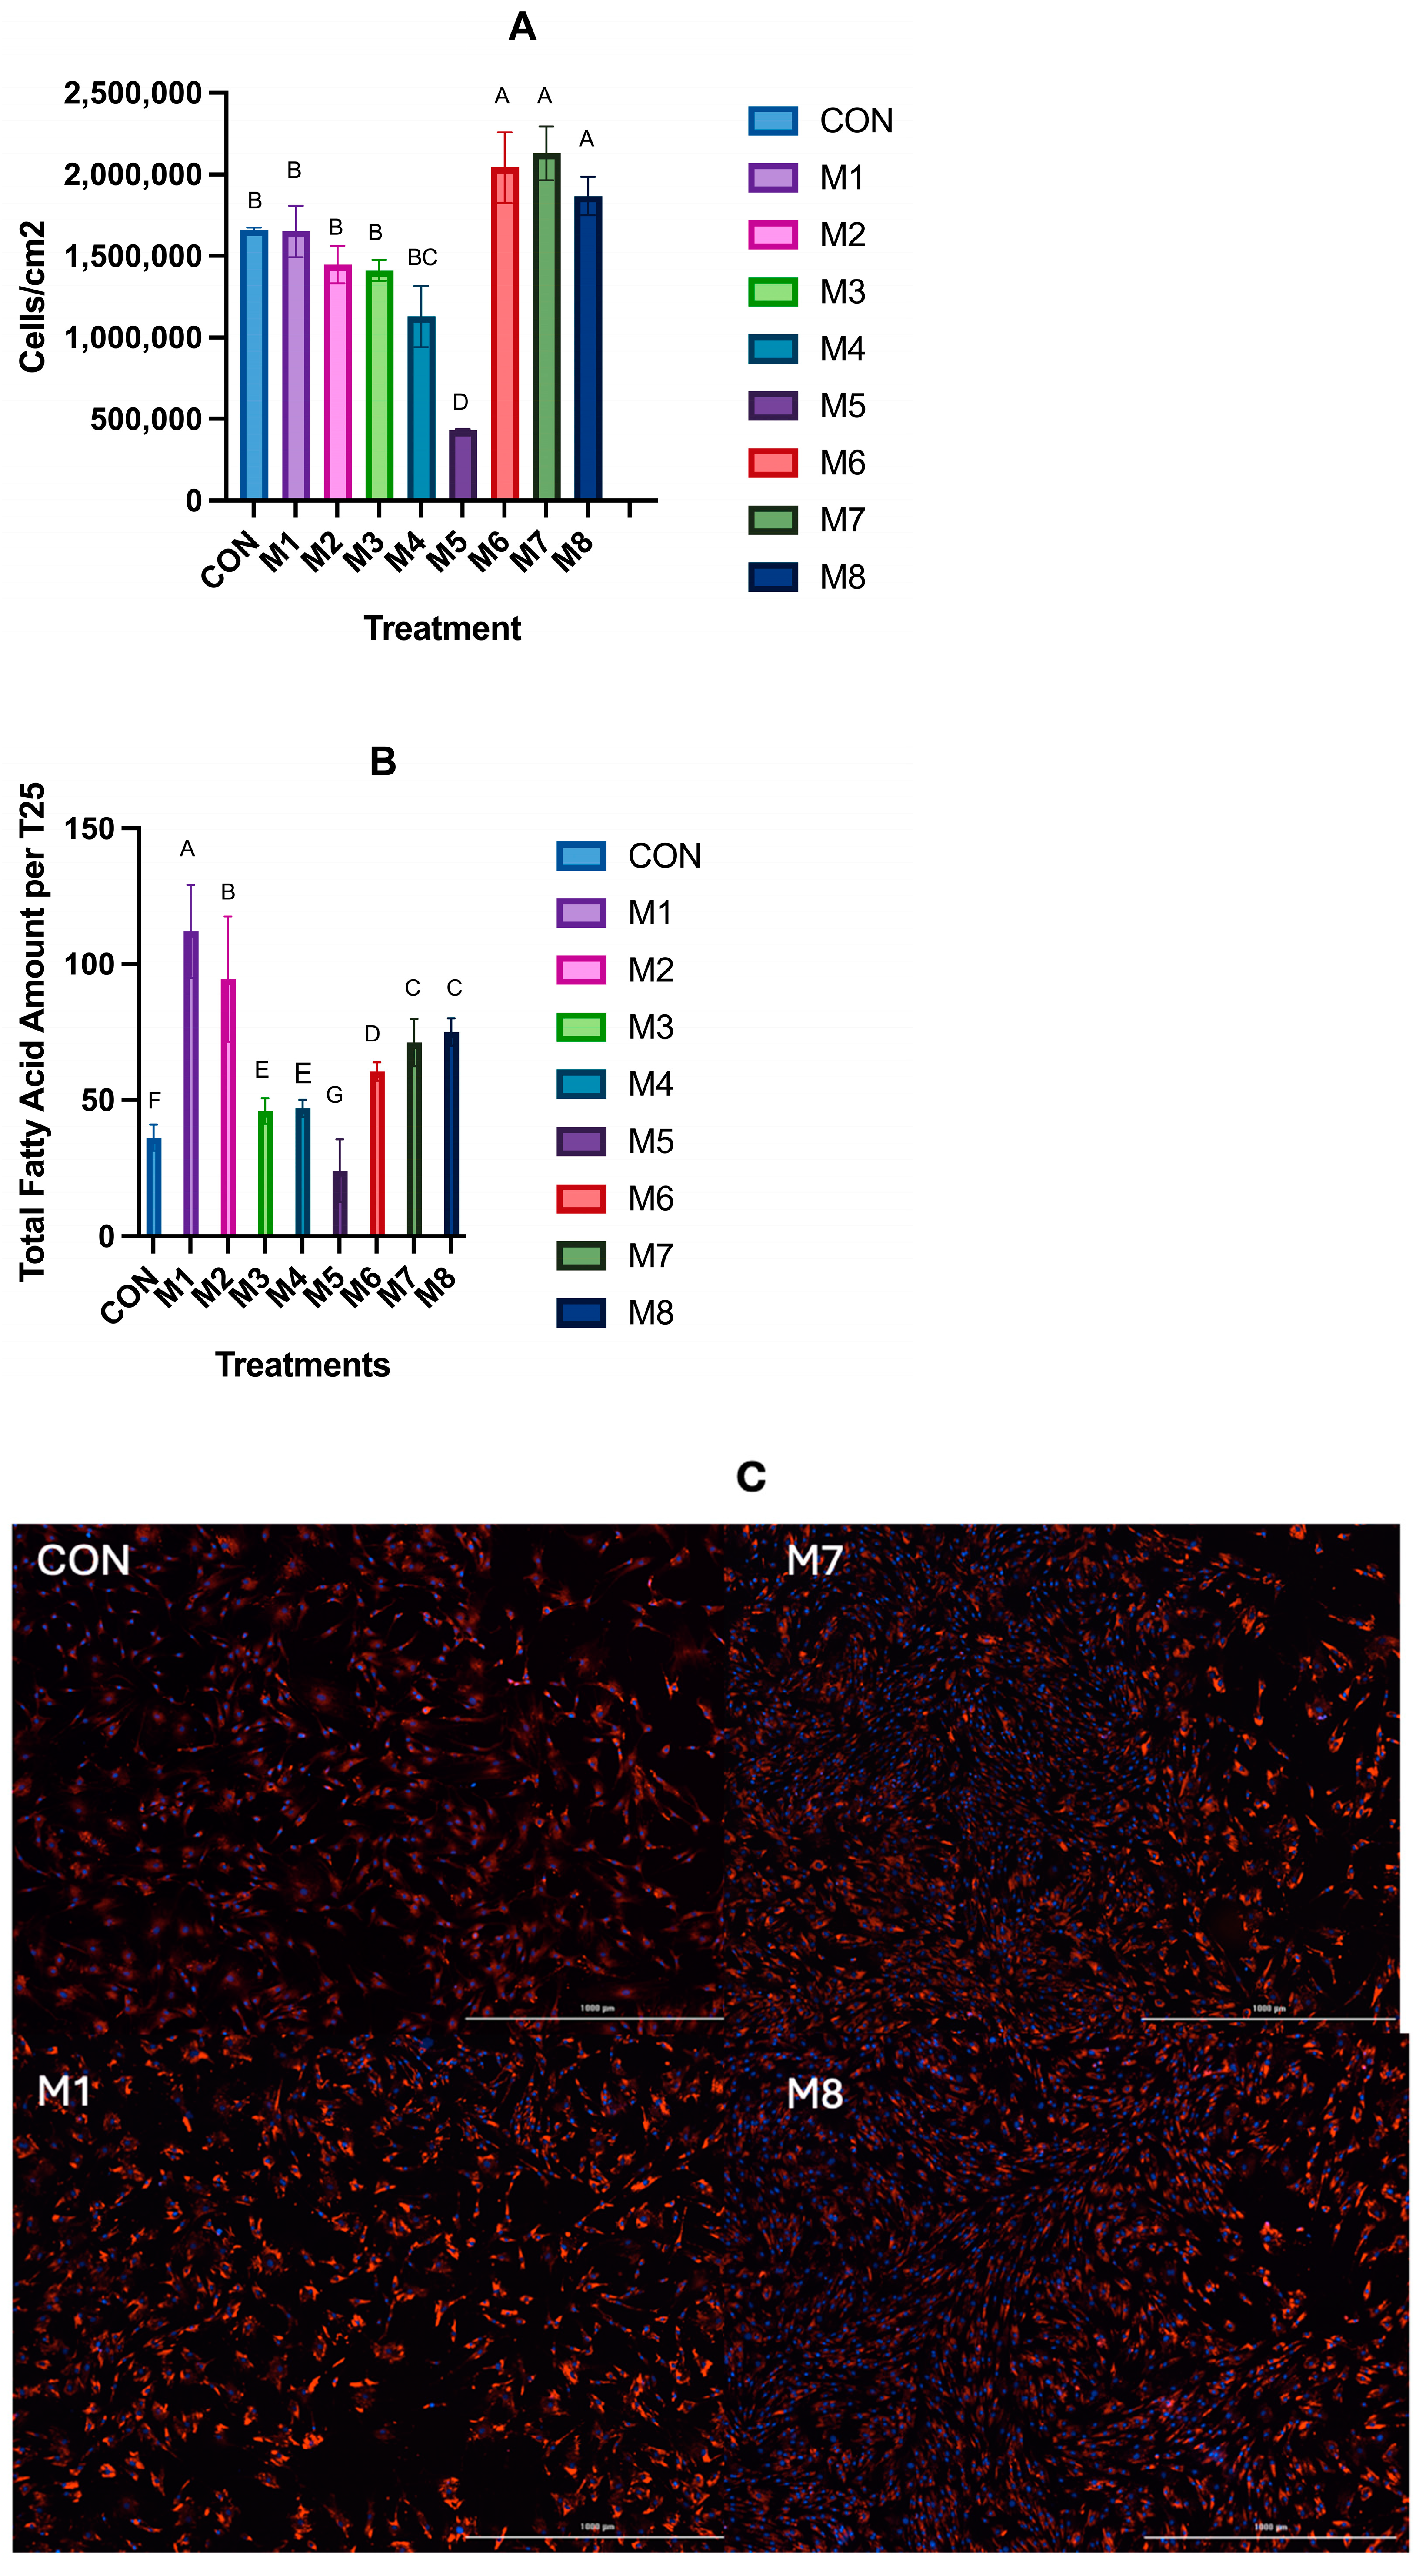
3.2. Hypertrophy
4. Discussion
5. Conclusions
Author Contributions
Funding
Institutional Review Board Statement
Informed Consent Statement
Data Availability Statement
Conflicts of Interest
Abbreviations
| AB/AM | antibiotic and antimycotic |
| Ct | cycle threshold |
| DMEM | Dulbecco’s Modified Eagle Medium |
| EIF3K | eukaryotic translation initiation factor 3 subunit K |
| FABP4 | fatty acid binding protein 4 |
| FAME | fatty acid methyl esters |
| FASN | fatty acid synthase |
| GAPDH | Glyceraldehyde-3-phosphate dehydrogenase |
| GLUT4 | Glucose transporter type 4 |
| HBSS | Hanks Balanced Salt Solution |
| HEPES | 4-(2-hydroxyethyl)piperazine-1-ethane-sulfonic acid |
| LM | longissimus muscle |
| mRNA | messenger RNA |
| PBS | phosphate-buffered saline |
| PDGFRA | platelet-derived growth factor receptor alpha |
| PGC-1a | peroxisome proliferator-activated receptor gamma coactivator 1-alpha |
| PPARy | peroxisome proliferator-activated receptor gamma |
| RT-qPCR | quantitative reverse transcription polymerase chain reaction |
| SCAP | sterol regulatory element-binding protein cleavage-activating protein |
| SCD1 | stearoyl coA desaturase |
| SREBP-1c | sterol regulatory element-binding protein 1c |
| SV | stromal vascular |
| SVF | stromal vascular fraction |
| UXT | ubiquitously expressed prefoldin-like chaperone |
| WAT | white adipose tissue |
References
- Jacobi, S.K.; Gabler, N.K.; Ajuwon, K.M.; Davis, J.E.; Spurlock, M.E. Adipocytes, myofibers, and cytokine biology: New horizons in the regulation of growth and body composition. J. Anim. Sci. 2006, 84 (Suppl. S13), E140–E149. [Google Scholar] [CrossRef]
- Fernyhough, M.E.; Okine, E.; Hausman, G.; Vierck, J.L.; Dodson, M.V. PPARγ and GLUT-4 expression as developmental regulators/markers for preadipocyte differentiation into an adipocyte. Domest. Anim. Endocrinol. 2007, 33, 367–378. [Google Scholar] [CrossRef]
- Dryden, F.D.; Maechello, J.A. Influence of total lipid and fatty acid composition upon the palatability of three bovine muscles. J. Anim. Sci. 1970, 31, 36–41. [Google Scholar] [CrossRef]
- Tatum, J.D.; Smith, G.C.; Berry, B.W.; Murphey, C.E.; Williams, F.L.; Carpenter, Z.L. Carcass characteristics, time on feed, and cooked beef palatability attributes. J. Anim. Sci. 1980, 50, 833–840. [Google Scholar] [CrossRef]
- Gorocica-Buenfil, M.A.; Fluharty, F.L.; Reynolds, C.K.; Loerch, S.C. Effect of dietary vitamin A concentration and roasted soybean inclusion on marbling, adipose cellularity, and fatty acid composition of beef. J. Anim. Sci. 2007, 85, 2230–2242. [Google Scholar] [CrossRef]
- Gorocica-Buenfil, M.A.; Fluharty, F.L.; Bohn, T.; Schwartz, S.J.; Loerch, S.C. Effect of dietary vitamin A restriction on marbling and conjugated linoleic acid content in Holstein steers. J. Anim. Sci. 2007, 85, 2243–2255. [Google Scholar] [CrossRef]
- Givens, D.I.; Gibbs, R.A. Very long chain n-3 polyunsaturated fatty acids in the food chain in the UK and the potential of animal-derived foods to increase intake. Nutr. Bull. 2006, 31, 104–110. [Google Scholar] [CrossRef]
- Givens, D.I.; Kliem, K.E.; Gibbs, R.A. The role of meat as a source of n-3 polyunsaturated fatty acids in the human diet. Meat Sci. 2006, 74, 209–218. [Google Scholar] [CrossRef]
- Polan, C.E.; McNeill, J.J.; Tove, S.B. Biohydrogenation of unsaturated fatty acids by rumen bacteria. J. Bacteriol. 1964, 88, 1056–1064. [Google Scholar] [CrossRef]
- Moate, P.J.; Chalupa, W.; Jenkins, T.C.; Boston, R.C. A model to describe ruminal metabolism and intestinal absorption of long chain fatty acids. Anim. Feed Sci. Technol. 2004, 112, 79–105. [Google Scholar] [CrossRef]
- Lohrenz, A.K.; Duske, K.; Schneider, F.; Nürnberg, K.; Losand, B.; Seyfert, H.M.; Metges, C.C.; Hammon, H.M. Milk performance and glucose metabolism in dairy cows fed rumen-protected fat during mid-lactation. J. Dairy Sci. 2010, 93, 5867–5876. [Google Scholar] [CrossRef] [PubMed]
- Manriquez, D.; Chen, L.; Melendez, P.; Pinedo, P. The effect of an organic rumen-protected fat supplement on performance, metabolic status, and health of dairy cows. BMC Vet. Res. 2019, 15, 450. [Google Scholar] [CrossRef]
- Scollan, N.D.; Enser, M.; Gulati, S.K.; Richardson, I.; Wood, J.D. Effects of including a ruminally protected lipid supplement in the diet on the fatty acid composition of beef muscle. Br. J. Nutr. 2003, 90, 709–716. [Google Scholar] [CrossRef] [PubMed]
- Bakker, C.E.; Blair, A.D.; Grubbs, J.K.; Taylor, A.R.; Brake, D.W.; Long, N.M.; Underwood, K.R. Effects of rumen-protected long-chain fatty acid supplementation during the finishing phase of beef steers on live performance, carcass characteristics, beef quality, and serum fatty acid profile. Transl. Anim. Sci. 2019, 3, 1585–1592. [Google Scholar] [CrossRef]
- Hausman, G.J.; Dodson, M.V.; Ajuwon, K.; Azain, M.; Barnes, K.M.; Guan, L.L.; Jiang, Z.; Poulos, S.P.; Sainz, R.D.; Smith, S.; et al. Board-invited review: The biology and regulation of preadipocyte and adipocytes in meat animals. J. Anim. Sci. 2009, 87, 1218–1246. [Google Scholar] [CrossRef]
- Yanting, C.; Yang, Q.Y.; Ma, G.L.; Du, M.; Harrison, J.H.; Block, E. Dose- and type-dependent effects of long-chain fatty acids on adipogenesis and lipogenesis of bovine adipocytes. J. Dairy Sci. 2018, 101, 1601–1615. [Google Scholar] [CrossRef]
- Burns, T.A.; Kadegowda, A.K.G.; Duckett, S.K.; Pratt, S.L.; Jenkins, T.C. Palmitoleic (16:1 cis-9) and cis-vaccenic (18:1 cis-11) acid alter lipogenesis in bovine adipocyte cultures. Lipids 2012, 47, 1143–1153. [Google Scholar] [CrossRef]
- Chung, K.Y.; Smith, S.B.; Choi, S.H.; Johnson, B.J. Oleic acid enhances G-protein coupled receptor 43 expression in bovine intramuscular adipocytes but not in subcutaneous adipocytes. J. Anim. Sci. 2016, 94, 1875–1883. [Google Scholar] [CrossRef]
- Hirai, S.; Matsumoto, H.; Hino, N.; Kawachi, H.; Matsui, T.; Yano, H. Myostatin inhibits differentiation of bovine preadipocyte. Domest. Anim. Endocrinol. 2007, 32, 1–14. [Google Scholar] [CrossRef]
- Oliveira, A.F.; Cunha, D.A.; Ladriere, L.; Igoillo-Esteve, M.; Bugliani, M.; Marchetti, P.; Cnop, M. In vitro use of free fatty acids bound to albumin: A comparison of protocols. BioTechniques 2015, 58, 228–233. [Google Scholar] [CrossRef]
- Liu, X.; Long, X.; Gao, Y.; Liu, W.; Hayashi, T.; Mizuno, K.; Hattori, S.; Fujisaki, H.; Ogura, T.; Onodera, S.; et al. Type I collagen inhibits adipogenic differentiation via YAP activation in vitro. J. Cell. Physiol. 2020, 235, 1821–1837. [Google Scholar] [PubMed]
- Livak, K.J.; Schmittgen, T.D. Analysis of relative gene expression data using real-time quantitative PCR and the 2−ΔΔCT method. Methods 2001, 25, 402–408. [Google Scholar] [CrossRef] [PubMed]
- Folch, J.; Lees, M.; Stanley, G.H.S. A simple method for the isolation and purification of total lipides from animal tissues. J. Biol. Chem. 1957, 226, 497–509. [Google Scholar] [CrossRef]
- Park, P.W.; Goins, R.E. In situ preparation of fatty acid methyl esters for analysis of fatty acid composition in foods. J. Food Sci. 1994, 59, 1262–1266. [Google Scholar] [CrossRef]
- Madsen, L.; Petersen, R.K.; Kristiansen, K. Regulation of adipocyte differentiation and function by polyunsaturated fatty acids. Biochim. Biophys. Acta (BBA)-Mol. Basis Dis. 2005, 1740, 266–286. [Google Scholar] [CrossRef]
- Hutley, L.J.; Newell, F.M.; Joyner, J.M.; Suchting, S.J.; Herington, A.C.; Cameron, D.P.; Prins, J.B. Effects of rosiglitazone and linoleic acid on human preadipocyte differentiation. Eur. J. Clin. Investig. 2003, 33, 574–581. [Google Scholar] [CrossRef]
- Shin, S.; Pang, Y.; Park, J.; Liu, L.; Lukas, B.E.; Kim, S.H.; Kim, K.-W.; Xu, P.; Berry, D.C.; Jiang, Y. Dynamic control of adipose tissue development and adult tissue homeostasis by platelet-derived growth factor receptor alpha. eLife 2020, 9, e56189. [Google Scholar] [CrossRef]
- Dodson, M.V.; Hausman, G.J.; Guan, L.; Du, M.; Jiang, Z. Potential impact of mature adipocyte dedifferentiation in terms of cell numbers. Int. J. Stem Cells 2011, 4, 76–78. [Google Scholar] [CrossRef]
- Wei, S.; Bergen, W.G.; Hausman, G.J.; Zan, L.; Dodson, M.V. Cell culture purity issues and DFAT cells. Biochem. Biophys. Res. Commun. 2013, 433, 273–275. [Google Scholar] [CrossRef]
- Tian, W.; Xiang, H.; Li, Q.; Wang, Y.; Zhu, J.; Lin, Y. Oleic acid, independent of insulin, promotes differentiation of goat primary preadipocytes in vitro. Anim. Prod. Sci. 2021, 63, 113–119. [Google Scholar] [CrossRef]
- Tian, W.; Zhang, W.; Zhang, Y.; Zhu, T.; Hua, Y.; Li, H.; Zhang, Q.; Xia, M. FABP4 promotes invasion and metastasis of colon cancer by regulating fatty acid transport. Cancer Cell Int. 2020, 20, 512. [Google Scholar] [CrossRef] [PubMed]
- Zhou, J.; Deng, Z.; Chen, Y.; Gao, Y.; Wu, D.; Zhu, G.; Li, L.; Song, W.; Wang, X.; Wu, K.; et al. Overexpression of FABP4 promotes cell growth and predicts poor prognosis of clear cell renal cell carcinoma. Urol. Oncol. Semin. Orig. Investig. 2015, 33, 113.e9. [Google Scholar] [CrossRef]
- Zhang, L.; Zhao, Y.; Ning, Y.; Wang, H.; Zan, L. Ectopical expression of FABP4 gene can induce bovine muscle-derived stem cells adipogenesis. Biochem. Biophys. Res. Commun. 2017, 482, 352–358. [Google Scholar] [CrossRef]
- Berger, E.; Geloen, A. FABP4 controls fat mass expandability (Adipocyte size and number) through inhibition of CD36/SR-B2 Signalling. Int. J. Mol. Sci. 2023, 24, 1032. [Google Scholar] [CrossRef] [PubMed]
- Hotamisligil, G.S.; Arner, P.; Atkinson, R.L.; Spiegelman, B.M. Uncoupling of obesity from insulin resistance through a targeted mutation in AP2, the adipocyte fatty acid binding protein. Science 1996, 274, 1377–1379. [Google Scholar] [CrossRef] [PubMed]
- Maeda, K.; Uysal, K.T.; Makowski, L.; Gorgun, C.Z.; Atsumi, G.; Parker, R.A.; Bruning, J.; Hertzel, A.V.; Bernlohr, D.A.; Hotamisligil, G.S. Role of the fatty acid binding protein mal1 in obesity and insulin resistance. Diabetes 2003, 52, 300–307. [Google Scholar] [CrossRef]
- Makowski, L.; Hotamisligil, G.S. Fatty acid binding proteins—The evolutionary crossroads of inflammatory and metabolic responses. J. Nutr. 2004, 134, 2464S–2468S. [Google Scholar] [CrossRef]
- Collins, J.M.; Neville, M.J.; Hoppa, M.B.; Frayn, K.N. De novo lipogenesis and stearoyl-CoA desaturase are coordinately regulated in the human adipocyte and protect against palmitate-induced cell injury. J. Biol. Chem. 2010, 285, 6044–6052. [Google Scholar] [CrossRef]
- Das, S.K.; Mondal, A.K.; Elbein, S.C. Distinct gene expression profiles characterize cellular responses to palmitate and oleate. J. Lipid Res. 2010, 51, 2121–2131. [Google Scholar] [CrossRef]
- Guo, W.; Wong, S.; Xie, W.; Lei, T.; Luo, Z. Palmitate modulates intracellular signaling, induces endoplasmic reticulum stress, and causes apoptosis in mouse 3T3-L1 and rat primary preadipocytes. Am. J. Physiol. -Endocrinol. Metab. 2007, 293, E576–E586. [Google Scholar] [CrossRef]
- Berndt, J.; Kovacs, P.; Ruschke, K.; Klöting, N.; Fasshauer, M.; Schön, M.R.; Körner, A.; Stumvoll, M.; Blüher, M. Fatty acid synthase gene expression in human adipose tissue: Association with obesity and type 2 diabetes. Diabetologia 2007, 50, 1472–1480. [Google Scholar] [CrossRef] [PubMed]


| Treatment | C16:0 | C18:0 | C18:1 cis-9 | C18:2 cis-9,12 |
|---|---|---|---|---|
| CON | 0% | 0% | 0% | 0% |
| M1 | 50% | 0% | 50% | 0% |
| M2 | 0% | 50% | 50% | 0% |
| M3 | 75% | 0% | 25% | 0% |
| M4 | 0% | 75% | 25% | 0% |
| M5 | 50% | 50% | 0% | 0% |
| M6 | 75% | 0% | 0% | 25% |
| M7 | 50% | 0% | 0% | 50% |
| M8 | 0% | 0% | 75% | 25% |
| Treatment | CON | M1 | M2 | M3 | M4 | M5 | M6 | M7 | M8 | SE | p Value |
|---|---|---|---|---|---|---|---|---|---|---|---|
| C16:0 | 4.95 a | 27.03 b | 4.03 a | 29.17 b | 5.74 a | 5.42 a | 29.87 b | 32.30 b | 8.96 a | 3.79 | 0.0093 |
| C18:0 | 5.33 a | 7.68 a | 19.93 b | 6.61 a | 22.32 b | 7.56 a | 6.95 a | 6.97 a | 22.75 b | 2.77 | 0.0153 |
| C18:1 cis-9 | 2.44 a | 20.93 c | 22.66 c | 9.80 b | 10.44 b | 0.92 a | 2.21 a | 2.55 a | 46.73 d | 1.69 | 0.0001 |
| C18:2 | 0.25 a | 0.54 a | 0.54 a | 0.55 a | 0.45 a | 0.12 a | 13.79 b | 33.57 d | 24.19 c | 0.68 | <0.0001 |
| Treatment | CON | M1 | M2 | M3 | M4 | M5 | M6 | M7 | M8 | SE | p Value |
|---|---|---|---|---|---|---|---|---|---|---|---|
| C16:0 | 16.67 a | 57.56 c | 13.40 a | 30.98 b | 9.63 a | 12.74 a | 36.82 b | 31.27 b | 9.05 a | 3.36 | <0.0001 |
| C16:1 | 0.42 a | 0.33 a | 0.61 a | 0.19 a | 0.09 a | 0 a | 0.23 a | 0.33 a | 0.34 a | 0.21 | 0.6547 |
| C18:0 | 11.46 ab | 15.26 b | 33.61 d | 5.49 a | 23.42 c | 9.49 ab | 8.40 ab | 10.08 ab | 6.08 a | 2.28 | 0.0002 |
| C18:1 cis-9 | 5.82 ab | 38.09 c | 45.87 c | 8.79 ab | 13.29 b | 1.67 a | 2.39 a | 4.15 ab | 38.52 c | 3.22 | <0.0001 |
| C18:2 | 1.18 a | 0.81 a | 0.94 a | 0.47 a | 0.48 a | 0.11 a | 12.62 b | 25.29 d | 21.03 c | 0.28 | <0.0001 |
Disclaimer/Publisher’s Note: The statements, opinions and data contained in all publications are solely those of the individual author(s) and contributor(s) and not of MDPI and/or the editor(s). MDPI and/or the editor(s) disclaim responsibility for any injury to people or property resulting from any ideas, methods, instructions or products referred to in the content. |
© 2025 by the authors. Licensee MDPI, Basel, Switzerland. This article is an open access article distributed under the terms and conditions of the Creative Commons Attribution (CC BY) license (https://creativecommons.org/licenses/by/4.0/).
Share and Cite
Udoka, A.N.S.; Duckett, S.K. Effect of Fatty Acid Mixture on the Hyperplastic and Hypertrophic Growth of Subcutaneous Bovine Stromal Vascular Fraction Cells In Vitro. Lipidology 2025, 2, 8. https://doi.org/10.3390/lipidology2020008
Udoka ANS, Duckett SK. Effect of Fatty Acid Mixture on the Hyperplastic and Hypertrophic Growth of Subcutaneous Bovine Stromal Vascular Fraction Cells In Vitro. Lipidology. 2025; 2(2):8. https://doi.org/10.3390/lipidology2020008
Chicago/Turabian StyleUdoka, Aliute N. S., and Susan K. Duckett. 2025. "Effect of Fatty Acid Mixture on the Hyperplastic and Hypertrophic Growth of Subcutaneous Bovine Stromal Vascular Fraction Cells In Vitro" Lipidology 2, no. 2: 8. https://doi.org/10.3390/lipidology2020008
APA StyleUdoka, A. N. S., & Duckett, S. K. (2025). Effect of Fatty Acid Mixture on the Hyperplastic and Hypertrophic Growth of Subcutaneous Bovine Stromal Vascular Fraction Cells In Vitro. Lipidology, 2(2), 8. https://doi.org/10.3390/lipidology2020008