Article

Neem Oil: A Comprehensive Analysis of Quality and Identity Parameters

by
Vitor Emanuel de Souza Gomes
1,
Paula Fernanda Janetti Bócoli
1,2,
Julia Guirardello Iamarino
1,
Renato Grimaldi
1,
Ana Paula Badan Ribeiro
1 and
Luís Marangoni Júnior
1,*
1
Department of Food Engineering and Technology, School of Food Engineering (FEA), State University of Campinas (UNICAMP), Campinas 13083-865, SP, Brazil
2
Packaging Technology Center, Institute of Food Technology, Campinas 13083-862, SP, Brazil
*
Author to whom correspondence should be addressed.
Lipidology 2025, 2(2), 9; https://doi.org/10.3390/lipidology2020009
Submission received: 26 February 2025 / Revised: 3 May 2025 / Accepted: 4 May 2025 / Published: 7 May 2025
(This article belongs to the Special Issue Technologies and Quality Control of Lipid-Based Foods)

Abstract

:
Background: Neem seed oil (Azadirachta indica A. Juss) is widely used in the pharmaceutical, agricultural, and food industries due to its antiseptic, fungicidal, pesticidal, and antioxidant properties, attributed to over 300 bioactive compounds and a high content of unsaturated fatty acids. Methods: This study aimed to characterize a commercial sample of neem oil regarding its physicochemical properties and identity profile, using official methodologies from the American Oil Chemists’ Society (AOCS), and to compare the results with literature data. Results: The sample exhibited the following parameters: free fatty acids (2.0 ± 0.02%), acidity index (3.9 ± 0.04 mg KOH/g), peroxide value (3.2 ± 0.1 mEq/kg), iodine value (116 ± 12 g I2/100 g), and saponification index (198 ± 8 mg KOH/g). The predominant coloration was yellowish, with total chlorophyll and carotenoid levels below the equipment’s quantification limits. Fatty acid composition was mainly long-chain (C16–C18), with notable levels of linoleic acid (46%), oleic acid (28%), palmitic acid (12%), linolenic acid (5.5%), and stearic acid (4.1%). The triacylglycerol profile showed a predominance of triunsaturated (51%) and diunsaturated species (41%). Differential scanning calorimetry (DSC) analysis revealed crystallization events between −6 °C and −57 °C and fusion events between −44 °C and −1 °C, consistent with the high unsaturation level of the lipids. Conclusions: The analyzed neem oil sample meets quality and identity criteria, making it suitable for various industrial applications. The characterization confirms its potential and aligns with literature data, emphasizing its relevance for industrial use.

1. Introduction

Azadirachta indica A. Juss, commonly known as the neem tree, belongs to the Meliaceae family and is extensively cultivated in Southern Asia and Africa [1]. The oil extracted from its seeds has been the focus of research for many years due to its numerous benefits and is widely utilized in various fields. In medicine, neem oil is renowned for its antipyretic, fungicidal, antihistamine, and antiseptic properties, as well as its anti-inflammatory and antioxidant actions. These properties help reduce bodily damage caused by reactive oxygen species and demonstrate anticancer and antidiabetic effects [2].
In agriculture, neem oil is highly valued as a natural insecticide, fungicide, and pesticide, effectively controlling pests and diseases in crops [1]. Its applications are also significant in the food industry, particularly in paper and cardboard-based packaging, where it serves as an antioxidant and antimicrobial agent [3]. Furthermore, neem oil is utilized in the development of biodegradable and/or edible films and coatings [3,4,5]. In addition to its widespread use in food preservation, it serves as a natural preservative with various applications in products, noted for its antibacterial and antifungal properties that effectively combat microbial deterioration [6,7].
These effects can be attributed to the biologically active volatile organic compounds found in neem oil, which include over 300 components such as alcohols, acids, esters, triterpenes, flavonoids, saponins, catechins, and nimbins [3]. Azadirachtin is a key compound responsible for the antibacterial and antifungal properties of the oil, as it acts by inhibiting the respiratory chain through uncoupling mitochondrial oxidative phosphorylation [8]. In addition to its bioactive properties, neem oil is a significant source of fatty acids, predominantly oleic, stearic, palmitic, and linoleic acids, which are essential for the proper functioning of the human body and are highly relevant for various industrial applications [9,10,11,12,13]. The bioactive properties previously described in the literature provide a relevant foundation for investigating other physicochemical parameters of the oil. In this context, the present study focuses primarily on the characterization of the lipid fraction of the sample.
The physicochemical composition of neem-derived products can exhibit considerable variations, influenced by a series of factors. Aspects related to pre-processing, such as geographic origin, agricultural practices, pesticide application, and cultivation characteristics, as well as post-harvest factors, such as drying, preservation, and storage conditions, directly impact the properties of the extracted oil [14]. These variations are reflected in the efficacy and applicability [15]. In light of the growing interest in the functional properties and applications of neem oil, especially in the context of its extraction and commercialization, it becomes essential to conduct analyses that ensure its quality and identity. In this regard, the present study aimed to characterize a commercial sample of neem oil by evaluating its composition and physicochemical properties.

2. Materials and Methods

2.1. Materials

A high-quality pure neem oil sample was analyzed, produced by Destilaria Bauru (Catanduva, SP, Brazil), using cold pressing methods. The sample, identified as batch 24A25, was manufactured on 6 October 2023 and is valid until 6 October 2025. After receipt, the sample was stored in a well-ventilated environment with temperatures ranging between 20 and 25 °C, protected from light exposure, and subsequently analyzed between April and May 2024.

2.2. Methods

The neem oil was characterized in terms of identity and physical and chemical properties (quality tests) using official methodologies, as described below.

2.2.1. Free Fatty Acids (FFAs) and Acidity Value

FFA determination was carried out according to the AOCS CA 5a-40 methodology [16], involving titration of the sample with 0.1 N NaOH. The percentage of FFA was expressed as oleic acid. The acidity value was calculated based on the FFA results and expressed in mg KOH per sample.

2.2.2. Peroxide Value (Acetic Acid–Isooctane Method) and Oil Stability Index

The tests were conducted according to the AOCS Cd 8b-90 and AOCS Cd 12b-92 methodologies [16] with some adaptations. For the peroxide value, the sample was titrated with 0.01 N sodium thiosulfate, and the result was expressed in milliequivalents of peroxides per kg of sample. Oxidative stability was assessed using Rancimat equipment (model 873 Professional Biodiesel Rancimat). Approximately 5 g of sample was prepared and the test was carried out according to the official method at 110 °C and adapted to 70 °C, with a flow rate of 10 L/h. The results were expressed in hours.

2.2.3. Calculated Iodine Value and Calculated Saponification Value of Fats and Oils

The iodine value was determined based on the fatty acid composition, following the AOCS Cd 1c–85 method [16]. Similarly, the saponification value was calculated according to the fatty acid composition, according to the AOCS Cd 3a–94 method [16].

2.2.4. Chlorophyll Pigments and Total Carotenoids

Chlorophyll pigments were quantified using the AOCS Cc 13k-13 method [16] with a spectrophotometer (Metash, model UV-5100, Shanghai, China). Direct readings of the sample (without prior preparation) were taken at wavelengths of 630, 670, and 710 nm, using an empty quartz cuvette as a blank. Three readings were recorded for each wavelength. Total carotenoids were determined using the Rodriguez-Amaya method (1999) with the same spectrophotometer. A 0.2 g sample was diluted in hexane, and the resulting solution was placed in a quartz cuvette for measurement at a fixed wavelength of 653 nm. Three readings were conducted to ensure accuracy.

2.2.5. Color of Fats and Oils—Automated Method

The sample was analyzed according to the Lovibond RYNB method (AOCS Cc 13j-97) [16]. An aliquot of the sample was placed in a 2” quartz cuvette and analyzed using the Lovibond PFX995 Tintometer for quantification (in %) of the colors red (R), yellow (Y), white/neutral (N), and blue (B). All readings were performed in triplicate.

2.2.6. Lipid Classes

The determination of lipid classes was performed using the methodology outlined by [17], employing high-performance liquid chromatography by exclusion (HPSEC) on Perkin Elmer Series 250 equipment. The setup included a Sicon Analytic refractive index detector and two columns in series (500 Å, 300 × 7.8 mm and 100 Å, 300 × 7.8 mm), along with a Phenogel guard column (50 Å, 7.8 × 5 mm). The mobile phase consisted of HPLC-grade tetrahydrofuran (THF) with a flow rate of 1 mL/min, and the sample was prepared at dilution of 1:100 (v/v) in THF. A 20 µL volume was injected for analysis. All assays were conducted in duplicate.

2.2.7. Fatty Acid Composition

The fatty acid composition was determined using the method [18] for the esterification of the raw material, followed by quantification according to AOCS Ce 1f-96 [16]. Quantification was conducted using a GC Agilent 6850 Series GC System gas chromatograph with a DB-23 Agilent capillary column (50% cyanopropyl-methylpolysioxane), measuring 60 m in length, with an internal diameter of 0.25 mm and film thickness of 0.25 µm. Injections were performed using a 1:50 split ratio, with an injected volume of 1.0 µL. The analysis included a detector temperature set at 280 °C and a column temperature ramp starting of 110 °C for 5 min, then increasing from 110 °C to 215 °C at a rate of 5 °C/min and holding at 215 °C for an additional 24 min, with helium used as the carrier gas. The experiment was conducted in duplicate. Qualitative composition was determined by comparing the retention times of the peaks to those of the corresponding fatty acid standards, while the quantitative composition was ascertained through area normalization and expressed as a percentage by mass.

2.2.8. Triacylglycerol Composition

The triacylglycerol composition was determined by interpreting the chromatograms obtained from analyses conducted on a gas chromatograph equipped with a capillary column—specifically, the CGC Agilent 6850 Series GC System with a DB-17HT capillary column (Agilent Catalog 122-1811), which contains 50% phenylmethylpolysiloxane. The column measures 15 m in length and has an internal diameter of 0.25 mm and a film thickness of 0.15 µm. Injections were performed using a split ratio of 1:100 with an injected volume of 1.0 µL. The analysis was programmed with a detector temperature of 375 °C, an injector temperature of 360 °C, and a column temperature ramp from 250 °C to 350 °C at a rate of 5 °C/min, utilizing helium as the carrier gas at a flow rate of 1.0 mL/min. All tests were performed in duplicate, and the identification of triacylglycerols groups and individual triacylglycerols was based on real percentage comparisons and the composition assessment, which utilized estimated percentages of triacylglycerols derived from the previously obtained fatty acid composition. This was accomplished using the Lames software, developed by the Laboratory of Extraction and Separation Methods at the Federal University of Goiás, following the procedures outlined by [19].

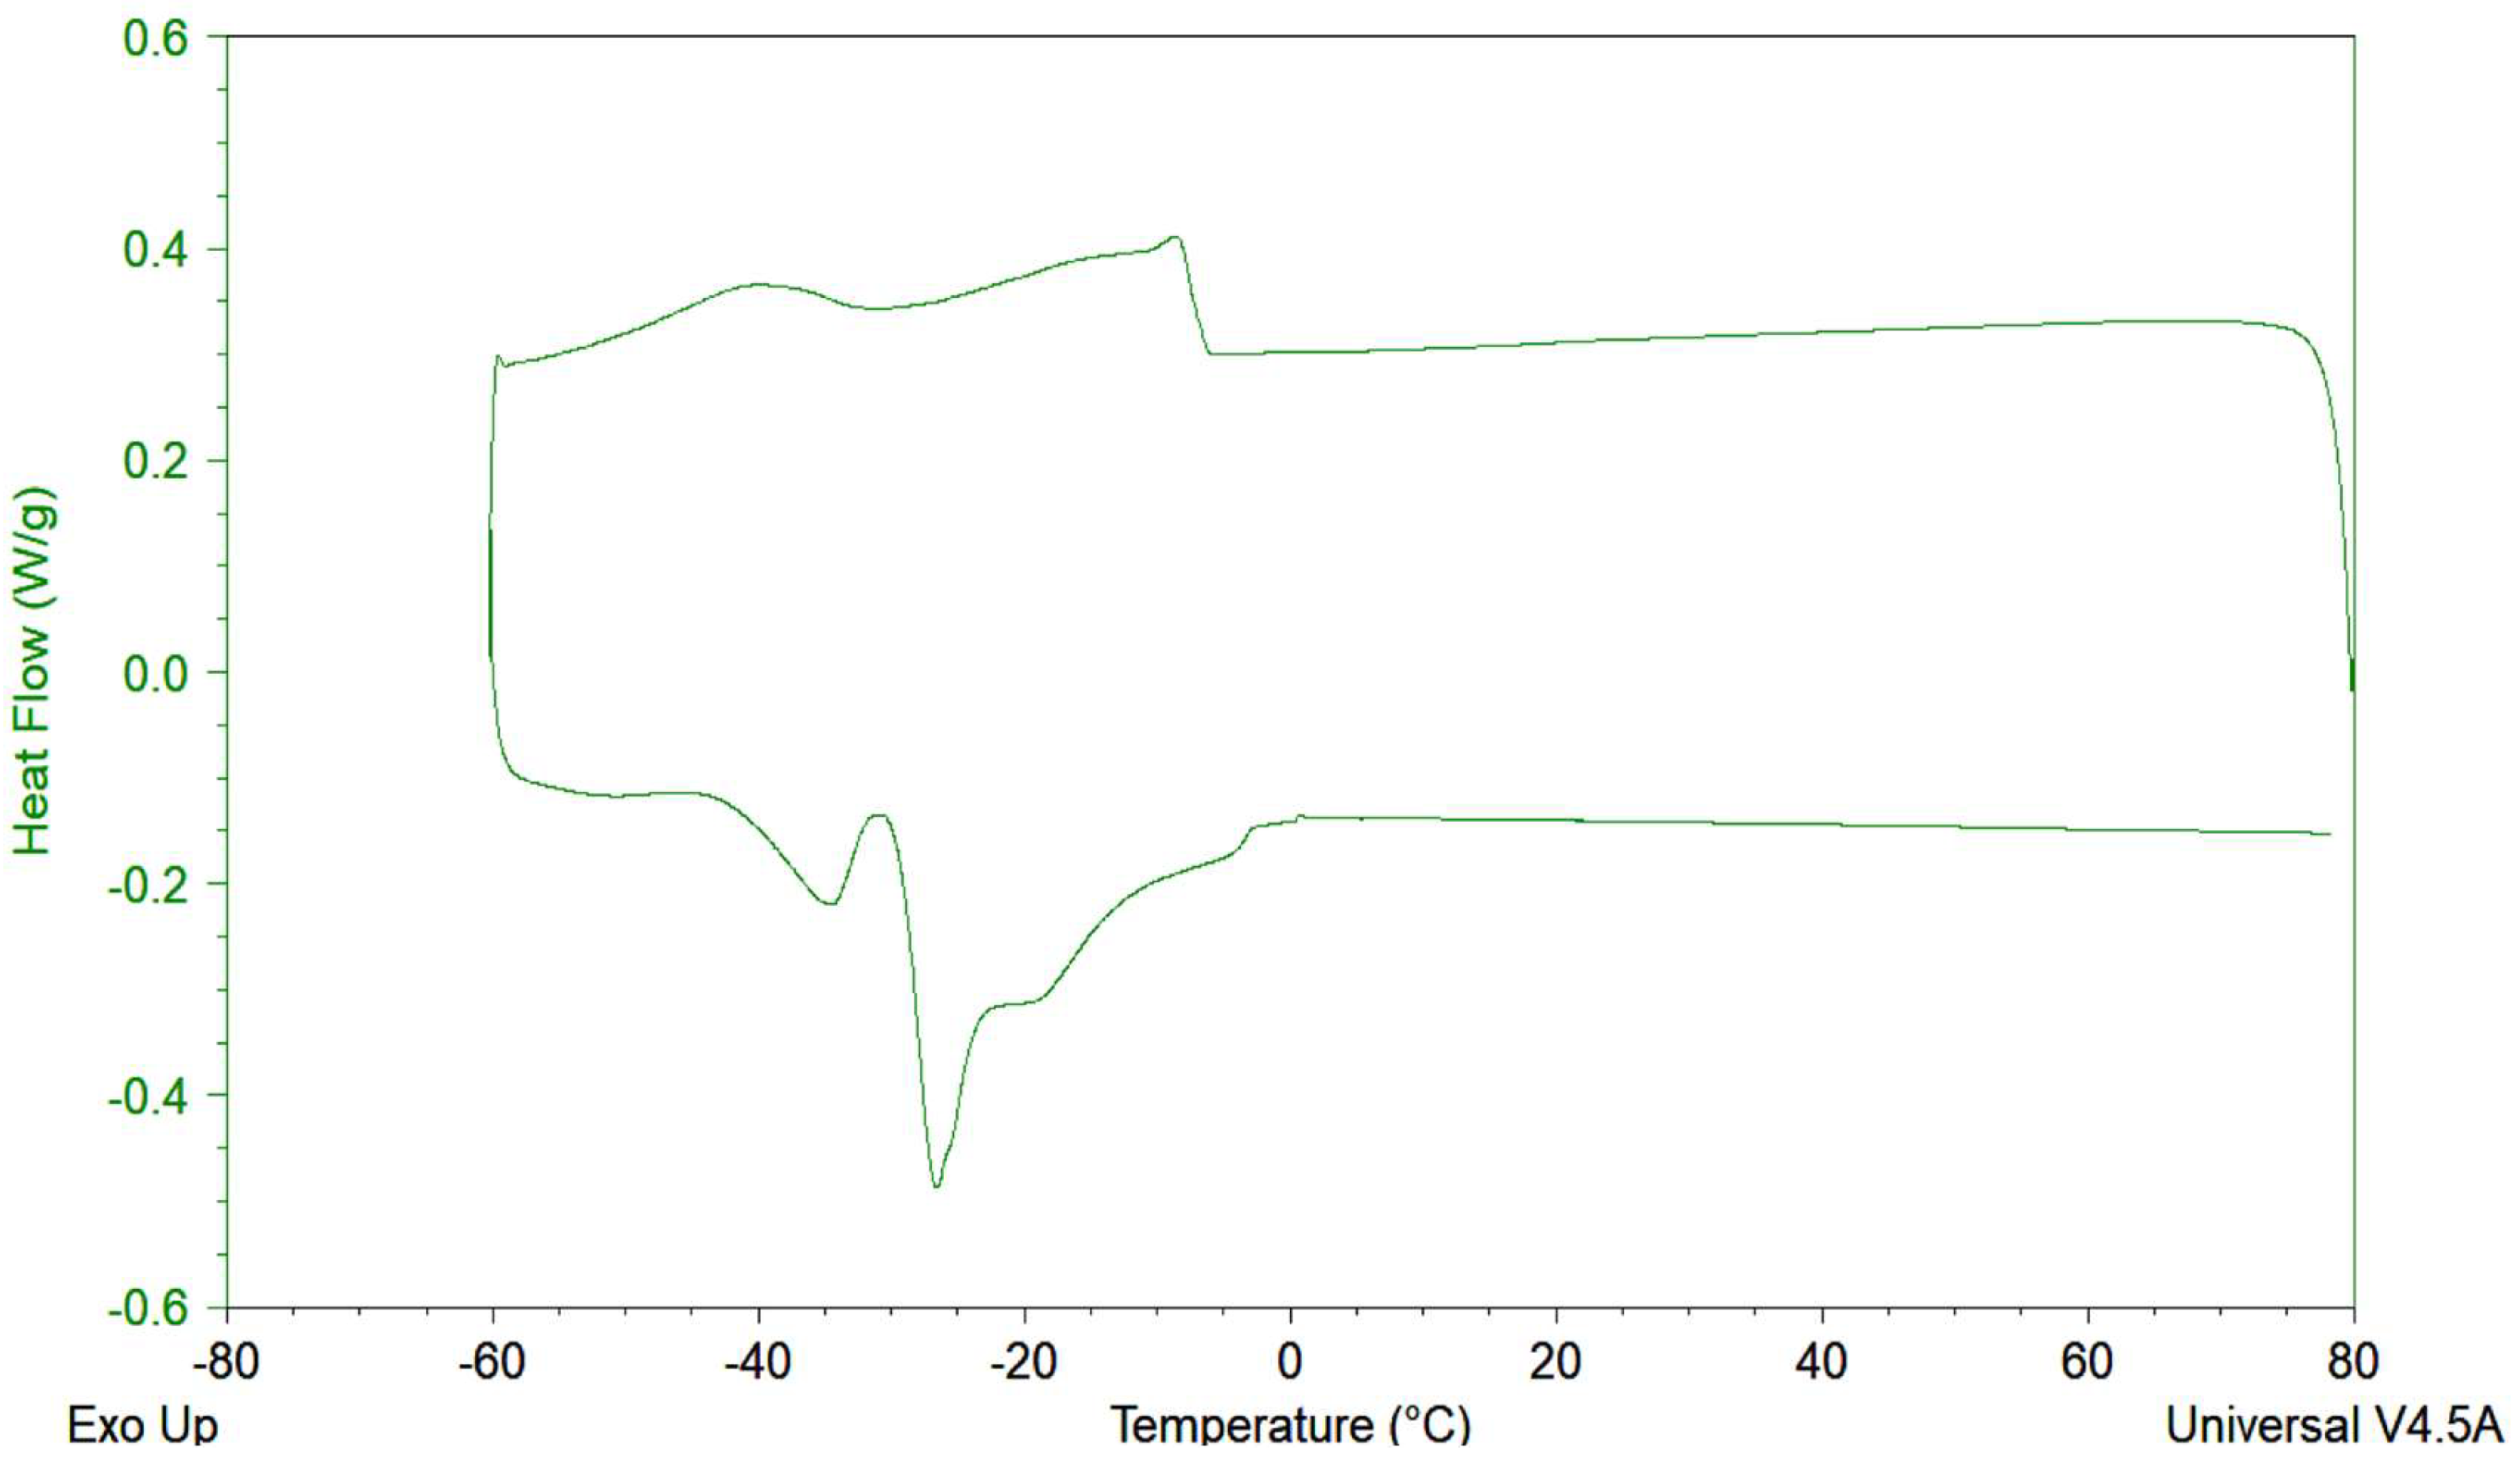
2.2.9. Thermal Behavior (Differential Scanning Calorimeter (DSC))

The DSC technique serves as an instrumental analysis for lipids, aiming to provide information about the thermal characteristics of the sample, including melting onset, crystallization, polymorphic behavior, and oxidation. Approximately 8 mg of neem oil was weighed in an aluminum crucible and analyzed using a DSC TA Instruments model Q-2000, coupled with the RCS90 Refrigerated Cooling System, according to the AOCS Cj 1-94 methodology [16]. The crystallization events included maintaining the sample at 80 °C for 10 min, followed by cooling from 80 °C to −60 °C at a rate of 10 °C/min. The melting events involved holding the sample at −60 °C for 30 min and then warming it from −60 °C to 80 °C at a rate of 5 °C/min. Parameters used for evaluating the results included initial crystallization and melting temperatures, peak crystallization and melting temperatures, crystallization and melting enthalpies, and final crystallization and melting temperatures [20]. All tests were performed in duplicate, and the resulting thermograms were analyzed using Universal V4.7 A software (TA Instruments, Waters LLC, New Castle, DE, USA).

2.3. Statistical Analysis

Statistical analyses were conducted based on repeated measurements. The results were expressed as the mean of the repetitions, accompanied by the standard deviation, which indicates the variability of the data relative to the mean. This approach facilitates the identification of patterns and validates the consistency of the analyzed sample.

3. Results and Discussion

Table 1 presents the results of the physicochemical properties of the analyzed sample, including free fatty acids, acidity value, peroxide value, calculated iodine value, saponification value, color of fats and oils, chlorophyll pigments, and classes of glyceride compounds. For the free fatty acid (FFA) parameter, the result obtained for the sample was higher than the value reported by Ismaila et al. [21] (1.22%). Regarding the acidity value, the neem sample exhibited a lower value than those referenced by Djibril et al. [22] and Chaudhary et al. [1], both of which were 10.2 mg/g. An intermediate peroxide value was observed in relation to the literature: Mulla et al. [23] reported 5.20 mEq/1000 g, while Ismaila et al. [21] and Djibril et al. [22] found values of 1.88 and 1.49 mEq/1000 g, respectively. According to Chaudhary et al. [1], an increase in acidity, peroxide, and saponification indices, along with a decrease in the iodine index, generally indicates a loss of quality in neem oil. This decline in quality may be associated with both hydrolysis reactions, which lead to the breakdown of triacylglycerols and the subsequent release of free fatty acids, and lipid oxidation, where oxidation products such as hydroperoxides are formed, signaling the initial stages of oxidation [24,25,26]. The results for the iodine index (116 g/100 g) and saponification index (198.4 mg/g) were consistent with values found in the literature [1,22]. Furthermore, the analyzed oil falls within the parameters established by Normative Instruction No. 87 of 15 March 2021, which sets a maximum of 4 mg KOH/g for acidity and 15 mEq/kg for peroxide index [27].

Results of Two Determinations

Regarding oxidative stability, we were unable to obtain satisfactory results despite various adaptations, including temperature reductions, as the official AOCS methodology specifies testing at 110 °C. One notable characteristic of neem oil is its rich and diverse composition of organic volatile compounds, which includes over 300 compounds such as alcohols, acids, esters, phenols, flavonoids, sulfates, aldehydes, hydrocarbons, and terpenes. These compounds contribute to the oil’s distinctive aroma and provide various antioxidant, antiviral, antibacterial, and antifungal properties [1,10]. Given this complex profile, the determination of oxidative stability using Rancimat equipment was compromised, as the curve did not exhibit the characteristics of an oil sample, with an abrupt increase in conductivity (μS/cm) within a few minutes of analysis. This likely occurred because this method measured not only the volatile compounds generated from the oxidation of the sample but also the volatiles that were inherently present in the crude oils.
In terms of color analysis (Table 1), the results indicate that the sample exhibits a predominantly yellowish hue. Some authors report a wide range of colors for neem oil, including pale yellow, yellow, olive yellow, light olive brown, dark reddish brown, and deep brown. These variations may be attributed to the presence of chlorophyll and other components, such as anthocyanin [23]. According to Jessinta et al. [28], the intensity of neem oil’s color is largely due to the presence of various pigments like chlorophyll, with the green color of the seeds fading as they mature, which retains these pigments in the final product. The authors further note that increased humidity levels can elevate chlorophyll content, thereby affecting color, along with oxidation processes that can induce color changes in the oil at different stages of maturation.
The results for total chlorophyll and carotenes in the studied sample were below the equipment’s quantification limits (0.2–0.8 mg/kg oil), even after adapting the method and increasing the sample size. These findings suggest a likely absence of these pigments in the oil; however, it is important to acknowledge the limitations of the analytical method in detecting low pigment levels, which may impact the completeness of the pigment profile. In this context, the observed color may be attributed to other pigments present in the oil that were not identified by the methods employed. Thus, the coloration of neem oil observed in this study is not directly related to carotenoid levels, as previously assumed. The results also indicated low levels of chlorophyll, which reinforces the hypothesis that the characteristic coloration of the analyzed sample is predominantly associated with the presence of phenolic compounds. These compounds, widely described in the literature [29,30], are known to significantly influence the sensory characteristics of vegetable oils [31]. The coloration of neem oil can be partially attributed to the presence of phenolic compounds in its composition, such as vanillic acid, caffeic acid, ferulic acid, luteolin, and aglycone oleuropein [32]. In addition to providing antioxidant activity, these compounds act as natural chromophores, enhancing the color intensity and resulting in darker hues in the final product.
Regarding the classes of glyceride compounds in the sample (Table 1), it is evident that triacylglycerols constitute the majority, accounting for 98% of its composition, which aligns with expected values for vegetable oils. Additionally, the sample contains only 2% diacylglycerols and 0.1% monoacylglycerols and free fatty acids, which is consistent with the findings reported by [22]. These results reflect a significant proportion of the saponifiable fraction in the oil and affirm the good quality of neem oil, as a high content of triacylglycerols coupled with low levels of mono- and diacylglycerols and free fatty acids suggests that the raw material did not undergo hydrolysis.
Table 2 and Table 3 present the results obtained for the fatty acid composition and the triacylglycerol composition, respectively.
Based on the results of the fatty acid composition shown in Table 2, the analyzed samples exhibit a predominance of long-chain fatty acids, including linoleic (46%), oleic (28%), palmitic (12%), linolenic (5.5%), and stearic (4.1%) acids. This oil is not specified in the Codex Alimentarius CXS 210-1999 (Standard for named vegetable oils) and, therefore, should be compared with the results available in the literature. These findings are similar in part to the composition of commercial neem oil reported by Cabral et al. [10], which also showed higher concentrations of linoleic, oleic, and palmitic acids, however, on the other hand, it showed some differences such as a lower content of stearic acid and a higher content of linolenic acid. When comparing this with the results for neem oil directly extracted from the seed, reported by the same authors, there are minor variations in concentration, with oleic, linoleic, palmitic, and stearic acids being predominant, similar to the outcomes observed results by Mulla et al. [23], Djibril et al. [22], and Awashi and Shikha [32], as presented in Table 4.
As described in Table 2, the C18:3 acid, alpha-linolenic acid (ALA), also known as part of the omega-3 group, is considered a polyunsaturated fatty acid (PUFA), and, in addition, starting from the third carbon atom counted from the terminal methyl, it has a long chain separated by methylene. Due to the particular biological activity of this type of compound, with a significant role in various physiological biochemical processes, its adequate and regular consumption presents health benefits for humans, such as the inhibition of ulcerative colitis, inflammation, diabetes, arthritis, and cardiovascular diseases [33].
These fatty acids are of extreme importance to the body, considered essential fatty acids, meaning they cannot be synthesized by the body and must be ingested through the diet. Therefore, omega-3 is commonly found in marine sources, such as fish oil, which contains significant amounts of C20:5, eicosapentaenoic acid (EPA), and C22:6, docosahexaenoic acid (DHA), 0.2–11.6% and 5.9–26.2%, respectively, along with other acids from the omega-3 group [34,35].
As mentioned previously, the analyzed neem oil shows higher levels of linolenic acid compared to the other studies presented (Table 4), distinguishing itself, in part, from these and being a promising source of omega-3. However, omega-3 derived from ALA, after ingestion, is endogenously metabolized and converted to EPA (5–12%) and DHA (<1%), which have limited efficiency, indicating that its supplementation in the human diet has few positive effects and that direct intake of EPA and DHA, the active forms, is more advised. Despite this indication, ALA still shows significant effects on glycoregulation, blood pressure, adiposity, inflammation, hepatic lipid accumulation, and triglycerides and, in addition, researchers have found unique effects of this fatty acid on the glycoregulation of monocytes and on bioenergetics [36].
Environmental and geographic factors can significantly influence the quality of the oil, highlighting the importance of studies aimed at verifying and ensuring its purity and properties for various applications. The total saturated fatty acids (SFAs) and unsaturated fatty acids (UFAs) recorded at 16% and 84%, respectively, are comparable to the values presented by Cabral et al. [10], which reported 23% SFAs and 77% UFAs.
By correlating the occurrence of fatty acids in the sample, presented in Table 2, with the triacylglycerol (TAG) composition shown in Table 3, we observe a low content of saturated fatty acids (C16:0 at 12% and C18:0 at 4.3%), which consequently results in a low presence of predominantly saturated TAGs, such as trisaturated (SSS). Conversely, there is a predominance of diunsaturated (SUU) TAGs, representing 41 ± 0.4%, and triunsaturated (UUU) TAGs, accounting for 51 ± 0.3%. Additionally, monounsaturated (SSU) TAGs are present in smaller quantities, at 7.8 ± 0.1%.
Different thermal behaviors can be observed, reflecting the triacylglycerol profile of the sample. Generally, fats and oils exhibit complex thermal behaviors that are heavily influenced by their chemical composition. Analyzing the thermal behavior obtained from the DSC thermogram (Figure 1), it is evident that the characteristic crystallization of neem oil begins at very low temperatures, around −6 °C, and concludes at −57 °C. In terms of the melting range, it starts approximately at −44 °C and concludes at 1 °C. This profile of significantly low crystallization and melting temperatures is associated with the higher content of unsaturated fatty acids, which contributes to the liquid state of the sample at room temperature. It is suggested that the initial portion of the crystallization peak, represented by the upper sections of the thermogram curve in Figure 1, is related to the SUU triacylglycerol group, which accounts for 46% of the oil composition. The subsequent part of the peak may correspond to the UUU group, which represents 48% of the sample’s triacylglycerol composition and appears after the SUU peak since it is entirely unsaturated. Regarding melting, as depicted in the lower section of the thermogram curve, it is proposed that the first peak, moving from right to left, is associated with the UUU group, while the second peak is linked to the SUU group, as the latter includes a saturated fatty acid that raises the melting point.

4. Conclusions

Based on the results obtained from the characterization of the analyzed commercial neem oil, it can be concluded that it meets the expected identity and quality standards. The composition of fatty acids and triacylglycerols aligns well with previously published literature, as do the results from the physicochemical analyses. Despite the similarity of fatty acid composition to literature values, the oil presents significantly higher levels of linolenic acid (C18:3), indicating a high nutraceutical value of this raw material and its potential as an omega-3 source for human health. The small variations observed, particularly in the levels of free fatty acids (FFAs), the acidity index, and the percentages of the fatty acid profile, may be attributed to a mixture of oil sourced from the seeds, bark, and flowers of the neem, the extraction method employed, or characteristics related to the time and/or region of cultivation of the raw material. The crystallization and melting temperatures determined by DSC revealed thermal phenomena at low temperatures (crystallization between −6 °C and −57 °C and melting between −44 °C and 1 °C), which are consistent with the unsaturated profile of the triacylglycerols present in the sample. This lipid behavior confirms that the oil remains in a completely liquid state at room temperature, posing no risk of partial crystallization under typical application conditions. In summary, the data obtained in this study indicate that the commercial neem oil evaluated adheres to the quality and identity standards necessary for its use in various applications.

Author Contributions

All authors contributed to the study conception and design (V.E.d.S.G., P.F.J.B., J.G.I., R.G., A.P.B.R. and L.M.J.). Material preparation, data collection, and analysis were performed by V.E.d.S.G., P.F.J.B. and J.G.I. The first draft of the manuscript was written by V.E.d.S.G., P.F.J.B. and J.G.I. and all authors commented on previous versions of the manuscript. All authors have read and agreed to the published version of the manuscript.

Funding

The authors would like to thank the Fundo de Apoio ao Ensino, Pesquisa e Extensão (FAEPEX) of UNICAMP for the Early Career Grant No. 2978/24. This study was partly financed by the Coordination for the Improvement of Higher Education Personnel, Brazil (CAPES)—Financial Code 001.

Institutional Review Board Statement

Not applicable.

Informed Consent Statement

Not applicable.

Data Availability Statement

Data will be made available upon request.

Acknowledgments

Not applicable.

Conflicts of Interest

The authors declare no conflict of interest.

References

  1. Chaudhary, M.F.; Ashraf, A.; Waseem, M.; Hayat, S.; Nadeem, H.U.; Siddique, M.H.; Muzammil, A.; Afzal, M.; Muzammil, S. Neem oil. In Green Sustainable Process for Chemical and Environmental Engineering and Science; Elsevier: Amsterdam, The Netherlands, 2021; pp. 57–73. [Google Scholar] [CrossRef]
  2. Loganathan, T.; Barathinivas, A.; Soorya, C.; Balamurugan, S.; Nagajothi, T.G.; Ramya, S.; Jayakumararaj, R. Physicochemical, Druggable, ADMET Pharmacoinformatics and Therapeutic Potentials of Azadirachtin—A Prenol Lipid (Triterpenoid) from Seed Oil Extracts of Azadirachta indica A. Juss. J. Drug Deliv. Ther. 2021, 11, 33–46. [Google Scholar] [CrossRef]
  3. Kumar, S.; Singh, N.; Devi, L.S.; Kumar, S.; Kamle, M.; Kumar, P.; Mukherjee, A. Neem oil and its nanoemulsion in sustainable food preservation and packaging: Current status and future prospects. J. Agric. Food Res. 2022, 7, 100254. [Google Scholar] [CrossRef]
  4. Achutha, S.; Nisha, S.K.; Pushpa, S.B.; Andrews, S. Antimicrobial polyvinyl alcohol/neem oil flexible film for food packaging applications. Mater. Today Proc. 2023. [Google Scholar] [CrossRef]
  5. Sanuja, S.; Agalya, A.; Umapathy, M. Synthesis and characterization of zinc oxide–neem oil–chitosan bionanocomposite for food packaging application. Int. J. Biol. Macromol. 2015, 74, 76–84. [Google Scholar] [CrossRef] [PubMed]
  6. Khan, M.R.; Chonhenchob, V.; Huang, C.; Suwanamornlert, P. Antifungal Activity of Propyl Disulfide from Neem (Azadirachta indica) in Vapor and Agar Diffusion Assays against Anthracnose Pathogens (Colletotrichum gloeosporioides and Colletotrichum acutatum) in Mango Fruit. Microorganisms 2021, 9, 839. [Google Scholar] [CrossRef]
  7. Del Serrone, P.; Toniolo, C.; Nicoletti, M. Neem (Azadirachta indica A. Juss) Oil: A Natural Preservative to Control Meat Spoilage. Foods 2015, 4, 3–14. [Google Scholar] [CrossRef]
  8. Islas, J.F.; Acosta, E.; G-Buentello, Z.; Delgado-Gallegos, J.L.; Moreno-Treviño, M.G.; Escalante, B.; Moreno-Cuevas, J.E. An overview of Neem (Azadirachta indica) and its potential impact on health. J. Funct. Foods 2020, 74, 104171. [Google Scholar] [CrossRef]
  9. Gopinath, H.; Karthikeyan, K. Neem in Dermatology. Indian J. Dermatol. 2021, 66, 706. [Google Scholar] [CrossRef]
  10. Cabral, S.M.; Silva, F.L.D.N.; Rodrigues, P.J.; Rambo, M.K.D.; Santos, J.R.; Chaves, M.H.; Pinto, B.F. Extraction and chemical characterization of neem seed oil (Azadirachta indica). J. Biotechnol. Biodivers. 2023, 11, 170–181. [Google Scholar] [CrossRef]
  11. Ghosh, S.; Mali, S.N.; Bhowmick, D.; Pratap, A.P. Neem oil as natural pesticide: Pseudo ternary diagram and computational study. J. Indian Chem. Soc. 2021, 98, 100088. [Google Scholar] [CrossRef]
  12. Adusei, S.; Azupio, S. Neem: A Novel Biocide for Pest and Disease Control of Plants. J. Chem. 2022, 2022, 6778554. [Google Scholar] [CrossRef]
  13. Saha, J.; Ara, M.R.; Pranta, A.D.; Hossain, S. Antimicrobial and antioxidant functionalization of cellulosic fabric via mushroom and neem oil treatment: A step toward sustainable textiles. J. Vinyl. Addit. Technol. 2024, 30, 1659–1671. [Google Scholar] [CrossRef]
  14. Benelli, G.; Canale, A.; Toniolo, C.; Higuchi, A.; Murugan, K.; Pavela, R.; Nicoletti, M. Neem (Azadirachta indica): Towards the ideal insecticide? Nat. Prod. Res. 2017, 31, 369–386. [Google Scholar] [CrossRef] [PubMed]
  15. Ratna, K.N.P.; Afifah, F.N.; Kartika, T.; Prianto, A.H. Neem Oil (Azadirachta indica A. juss) as a Potential Natural Active Compound in Cosmetic Properties Title. In Biomass-Based Cosmetics; Springer: Singapore, 2024; pp. 325–350. [Google Scholar] [CrossRef]
  16. AOCS. Official Methods and Recommended Practices of the American Oil Chemists’ Society, 6th ed.; AOCS: Urbana, IL, USA, 2009. [Google Scholar]
  17. Dobarganes, M.C.; Velasco, J.; Dieffenbacher, A. Determination of polar compounds, polymerized and oxidized triacylglycerols, and diacylglycerols in oils and fats: Results of collaborative studies and the standardized method (Technical report). Pure Appl. Chem. 2000, 72, 1563–1575. [Google Scholar] [CrossRef]
  18. Hartman, L.; Lago, R.C.A. Rapid preparation of fatty acid methyl esters from lipids. Lab. Pract. 1973, 22, 475–494. [Google Scholar] [PubMed]
  19. Filho, N.R.A.; Mendes, O.L.; Lanças, F.M. Computer prediction of triacylglycerol composition of vegetable oils by HRGC. Chromatographia 1995, 40, 557–562. [Google Scholar] [CrossRef]
  20. Campos, R. Experimental Methodology. In Fat Crystal Networks; CRC Press: Boca Raton, FL, USA, 2004. [Google Scholar]
  21. Ismaila, S.S.; Sani, Y.; Sani, A.A.; Yakasai, S.M.; Momoh, H.; Mohammed, S.E. Determination of fatty acids and physicochemical properties of neem (Azadrachta indica L.) seed oil extracts. Dutse J. Pure Appl. Sci. 2022, 8, 149–160. [Google Scholar] [CrossRef]
  22. Djibril, D.; Mamadou, F.; Gérard, V.; Geuye, M.-D.C.; Oumar, S.; Luc, R. Physical characteristics, Chemical composition and Distribution of constituents of the Neem seeds (Azadirachta indica A. Juss) collected in Senegal. Res. J. Chem. Sci. 2015, 5, 52–58. [Google Scholar]
  23. Mulla, M.; Ahmed, J.; Alagarsamy, S.; Habeebullah, S.F.K. Utilization of novel and rapid techniques for characterization of neem Azadirachta indica seed oil and palm oil blends. Int. J. Food Eng. 2020, 16, 20200047. [Google Scholar] [CrossRef]
  24. Ribeiro, M.C.; de Barros Vilas Boas, E.V.; Riul, T.R.; Pantoja, L.; Marinho, H.A.; dos Santos, A.S. Influence of the extraction method and storage time on the physicochemical properties and carotenoid levels of pequi (Caryocar brasiliense Camb.) oil. Food Sci. Technol. 2012, 32, 386–392. [Google Scholar] [CrossRef]
  25. O’Brien, R.D. Fats and Oils; CRC Press: Boca Raton, FL, USA, 2003. [Google Scholar] [CrossRef]
  26. Shahidi, F. (Ed.) Bailey’s Industrial Oil and Fat Products; Wiley: Hoboken, NJ, USA, 2005. [Google Scholar] [CrossRef]
  27. Brazil. Diretoria Colegiada da Agência Nacional de Vigilância Sanitária. Instrução Normativa IN N° 87, de 15 de Março de 2021. Estabelece a Lista de Espécies Vegetais Autorizadas, as Designações, a Composição de Ácidos Graxos e os Valores Máximos de Acidez e de Índice de Peróxidos para Óleos e Gorduras Vegetais; Diário Oficial da União: Brasília, Brazil, 2021; p. 10. [Google Scholar]
  28. Jessinta, S.; Azhari, H.N.; Saiful, N.T. Impact of geographic variation on physicochemical properties of neem (Azadirachta indica) seed oil. Int. J. Pharm. Sci. Res. 2014, 5, 4406. [Google Scholar]
  29. Nahak, G.; Sahu, R. Evaluation of antioxidant activity of flower and seed oil of Azadirachta indica A. juss. J. Appl. Nat. Sci. 2011, 3, 78–81. [Google Scholar] [CrossRef]
  30. Atta, N.M.; Ismaiel, G.H.; Hashish, A.E.M.S.; Mohamed, E.S. Physical and chemical characteristics of neem oils extracted from seed, whole fruit and flesh. Egypt. J. Agric. Res. 2015, 93, 887–899. [Google Scholar] [CrossRef]
  31. Mikołajczak, N.; Tańska, M.; Ogrodowska, D. Phenolic compounds in plant oils: A review of composition, analytical methods, and effect on oxidative stability. Trends Food Sci. Technol. 2021, 113, 110–138. [Google Scholar] [CrossRef]
  32. Sarkar, S.; Singh, R.P.; Bhattacharya, G. Exploring the role of Azadirachta indica (neem) and its active compounds in the regulation of biological pathways: An update on molecular approach. 3 Biotech 2021, 11, 178. [Google Scholar] [CrossRef]
  33. Awasthi, R.; Shikha, D. Solvent Extraction of Neem Oil from Neem Seed for Development of Ecofriendly Pesticides. Int. J. Trend Sci. Res. Dev. 2019, 3, 119–122. [Google Scholar] [CrossRef]
  34. Venugopalan, V.K.; Gopakumar, L.R.; Kumaran, A.K.; Chatterjee, N.S.; Soman, V.; Peeralil, S.; Mathew, S.; McClements, D.J.; Nagarajarao, R.C. Encapsulation and protection of omega-3-rich fish oils using food-grade delivery systems. Foods 2021, 10, 1566. [Google Scholar] [CrossRef]
  35. DeMan, J.M. Empirical relationships between iodine value and polyunsaturated fatty acid content of fats and oils. J. Am. Oil Chem. Soc. 1977, 54, 314–318. [Google Scholar] [CrossRef]
  36. Takić, M.; Ranković, S.; Girek, Z.; Pavlović, S.; Jovanović, P.; Jovanović, V.; Šarac, I. Current Insights into the Effects of Dietary α-Linolenic Acid Focusing on Alterations of Polyunsaturated Fatty Acid Profiles in Metabolic Syndrome. Int. J. Mol. Sci. 2024, 25, 4909. [Google Scholar] [CrossRef]
Figure 1. DSC melting and crystallization curves of neem oil.
Lipidology 02 00009 g001
Table 1. Physicochemical properties of neem oil.
PropertiesNeem Oil
Free fatty acids (% oleic acid)2.0 ± 0.02
Acidity value (mg KOH/g)3.9 ± 0.04
Peroxide value (mEq/1000 g)3.2 ± 0.1
Oxidation induction period (h)-
Calculated iodine value (g I2/100 g)116 ± 12
Calculated saponification value (mg KOH/g)198 ± 8
R color5.1 ± 0.1
Y color70 ± 0.0
B color0.0 ± 0.0
N color1.1 ± 0.1
Carotenoids (mg carotenoids/kg oil)-
Chlorophyll (mg pheophytin/kg oil)-
Triacylglycerols (% TAG)98 ± 0.01
Diacylglycerols (% DAG)2.0 ± 0.01
Monoacylglycerols + Free fatty acids (% MAG + AGL)0.1 ± 0.00
Table 2. Fatty acid composition of neem oil.
Name/Fatty Acids% (m/m)
Palmitic (C16:0)12 ± 0.00
Stearic (C18:0)4.1 ± 0.00
Oleic (C18:1)28 ± 0.01
Linoleic (C18:2)46 ± 0.00
Linolenic (C18:3)5.5 ± 0.00
Σ saturated fatty acids (SFAs)16 ± 0.00
Σ monounsaturated fatty acids (MUFAs)28 ± 0.01
Σ polyunsaturated fatty acids (PUFAs)51 ± 0.01
Table 3. Triacylglycerol composition of neem oil (1).
Carbon NumberTriacylglycerol% (m/m) (2)
C50POP1.7 ± 0.1
PLP3.3 ± 0.03
C52SOP1.1 ± 0.1
POO4.9 ± 0.3
SLP1.6 ± 0.1
PLO12 ± 0.2
PLnO2.7 ± 0.2
PLL12 ± 0.2
PLnL2.7 ± 0.1
C54SOO1.5 ± 0.1
SLO4.7 ± 0.1
OOO3.0 ± 0.1
OLO12 ± 0.3
SLL1.2 ± 0.1
OLnO1.5 ± 0.4
OLL15 ± 0.6
OLnL4.1 ± 0.2
LLL12 ± 0.1
LLnL3.1 ± 0.04
ClassTriacylglycerol%
SSS (trisaturated)---0.0 ± 0.0
SSU (monounsaturated)POP, PLP, SOP, SLP7.8 ± 0.1
SUU (diunsaturated)POO, PLO, PLnO, PLL, PLnL, SOO, SLO, SLL41 ± 0.4
UUU (triunsaturated)OOO, OLO, OLnO, OLL, OLnL, LLL, LLnL51 ± 0.3
O: Oleic/P: Palmitic/L: Linoleic/S: Stearic/Ln: Linolenic. (1) These results do not consider the presence of stereoisomers. (2) Results of two determinations.
Table 4. Fatty acid composition of neem oil from literature (%m/m).
Name/Fatty AcidsCabral et al. [10]Djibril et al. [20]Mulla et al. [21]Awashi and Shikha [30]
Palmitic (C16:0)18.715.6 ± 0.316.9 ± 0.117.9
Stearic (C 18:0)16.718.7 ± 0.521.3 ± 0.119.4
Oleic (C18:1)43.541.9 ± 0.744.9 ± 0.149.9
Linoleic (C18:2)19.119.6 ± 0.414.8 ± 0.0112.8
Linolenic (C18:3)0.30.5 ± 0.010.3 ± 0.0---
Disclaimer/Publisher’s Note: The statements, opinions and data contained in all publications are solely those of the individual author(s) and contributor(s) and not of MDPI and/or the editor(s). MDPI and/or the editor(s) disclaim responsibility for any injury to people or property resulting from any ideas, methods, instructions or products referred to in the content.

