
Article

Polygons or Points? A Polygon-Based Approach to the Morphometrics of Fossil Human Footprints
School of Life and Environmental Sciences, Faculty of Science and Technology, Bournemouth University, Talbot Campus, Poole BH12 5BB, UK
*
Author to whom correspondence should be addressed.
Foss. Stud. 2026, 4(3), 17; https://doi.org/10.3390/fossils4030017
Submission received: 31 March 2026 / Revised: 4 June 2026 / Accepted: 8 June 2026 / Published: 1 July 2026
(This article belongs to the Special Issue New Directions in the Study of Vertebrate Trace Fossils)

Abstract

Quantitative analysis of footprint shape is central to ichnology, yet the application of geometric morphometrics is often limited by the difficulty of defining homologous landmarks on irregular or variably preserved impressions. Here we present a polygon-based approach to footprint morphometrics in which the footprint margin is digitised as a continuous outline and resampled into a standardised set of boundary points for analysis. Using a combination of simulated perturbation experiments and empirical datasets, we assess the sensitivity of this method to annotation uncertainty and compare it to natural variation within and between trackways. The results demonstrate a clear hierarchy of variance, in which annotation noise is lower than inter-observer variability, intra-trackway variation, and between-trackway differences. These findings suggest that polygon-based representations of footprint shape are robust to realistic levels of digitisation uncertainty. Application of the method to modern and fossil trackways, including the Laetoli footprints, shows that resampled polygon outlines retain meaningful morphological structure and can be used effectively in comparative analyses.

1. Introduction

There has been a rapid rise in the number of sites with fossil human tracks over the last decade with sites across most continents having now been discovered (e.g., [1,2,3,4,5,6,7]). Increased awareness has no doubt driven increased discovery and long may that cycle continue. Human tracks are no longer seen as freak acts of geological preservation but regular occurrence due to the association of humans with moist, fine-grained sedimentary environments whether they be on the shore of lakes, estuaries or in caves.
Berge et al. [8] first attempted to apply geometric morphometrics to the study of fossil human tracks, in their case to those at Laetoli. Bennett et al. [9] develop these ideas during the initial analysis of the 1.5 million year old Homo erectus footprints at Ileret in northern Kenya and there have numerous examples since (e.g., [10] at Le Rozel in Normandy). At the core of this approach is the placement of landmarks either on points of anatomical interest or more generally on reproducible features such as toes, heels and the like. Perhaps the most sophisticated of these analyses is that undertaken by Wiseman et al. [11] who compared a range of footprints from different environments and hominin species.
At a similar time others argued that a “whole foot approach” was superior in the study of fossil human tracks developing methods to co-register footprints and create measures of central tendency [12,13]. The senior authors developed an alternative method of co-registration based on matching points (landmarks) on two or more tracks to create a mean [14].
All these approaches provide different types of analysis and output. Landmark placement is subject to user error and variance [15]. The whole foot approach of Crompton et al. [12] claims to be more objective and probably is for plantar pressure data derived from an experimental treadmill for which it was first developed but complex fossil footprint comparisons are still co-registered by hand and this contains an element of subjectivity. Bennett et al. [16] tried an alternative approached derived from work more common on dinosaur tracks where track outlines are often recorded in the field, or derived from digital elevation models. In this approach a method based on a turning circle was applied to extracted footprint outlines. The additional challenge is that footprint morphology is highly plastic and sensitive to external conditions such as substrate and taphonomy [17,18]. Consequently, the assumption that landmarks capture consistent, homologous features is less secure and their ability to isolate biologically meaningful variation is perhaps more limited than often assumed.
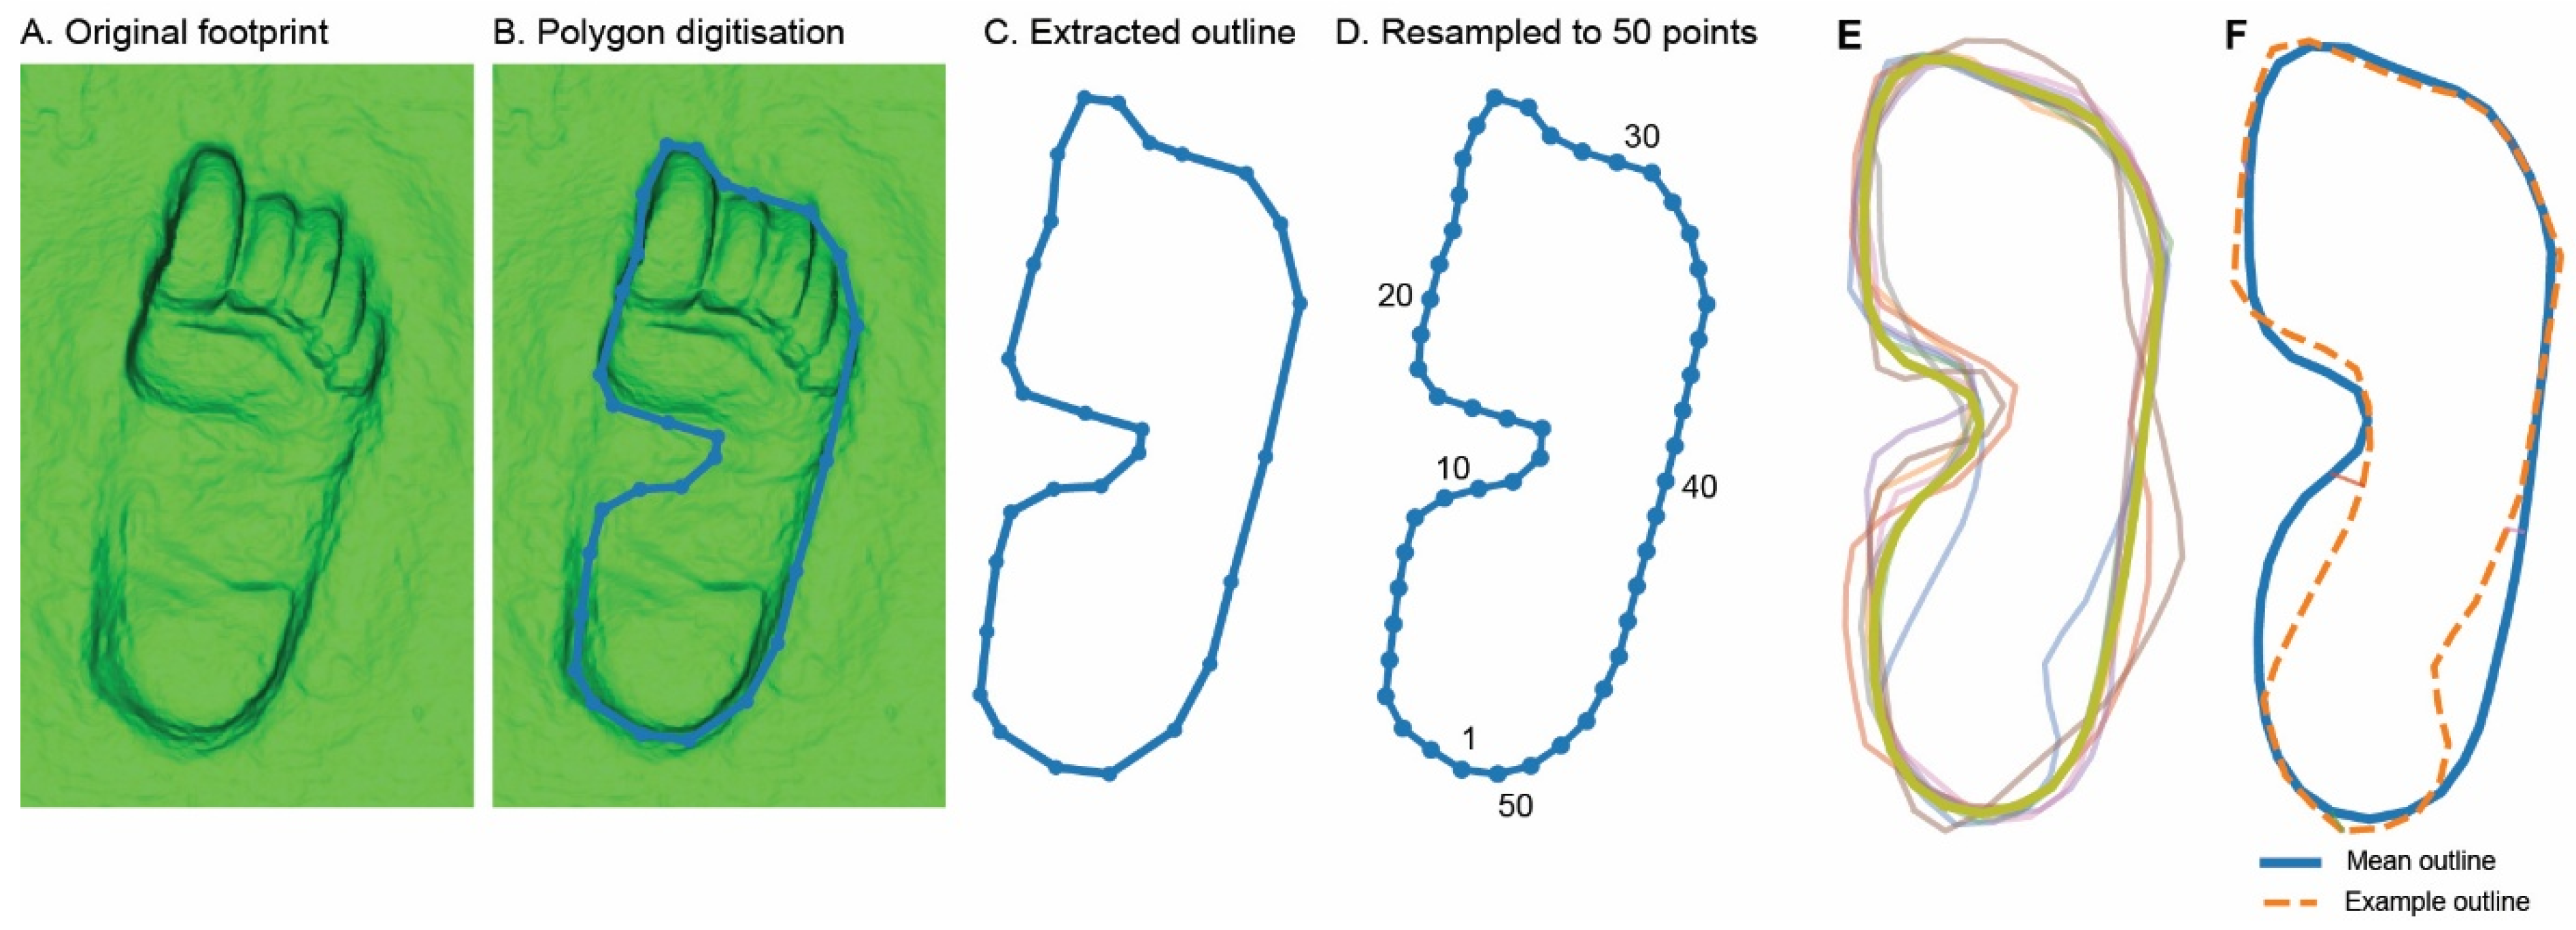
Here we explore a slightly different approach: rather than placing landmarks or extracting closed contours automatically, we manually digitise a closed polyline around the footprint margin (Figure 1). Although technically this is a perimeter representation rather than an area-based polygon analysis, we retain the term polygon here in the practical sense of a closed outline. In theory, placement of this outline requires relatively little training and has the potential to be faster and less arbitrary than the placement of discrete landmarks. Unlike landmark-based approaches, the method presented here does not rely on identifying homologous anatomical points. Instead, it captures overall footprint geometry through perimeter sampling, providing a rapid and reproducible representation of track morphology that can be applied across different preservation states and sedimentary contexts. We do not attempt here to test competing morphometric methods, nor do we advocate unduly for the approach described. Rather, we present it as an additional option within the vertebrate ichnologist’s analytical toolkit.

2. Method

2.1. Foundations for Polygons Analysis

The starting point for the analysis is an orthogonal view of each footprint. These images may be derived from photographs, orthorectified digital elevation models, or colour-rendered three-dimensional surfaces. Images are imported into annotation software capable of exporting polygon coordinates. In this study we used the VGG Image Annotator (VIA), although any annotation environment capable of exporting ordered polygon vertices is suitable.
For each footprint, a polygon is manually drawn around the outer margin of the track impression by the placement of vertices. The number of vertices is at the users digression and can be increased if the shape is more complex. The resulting vertices provide an approximate description of the footprint perimeter and are exported as a set of Cartesian coordinates:
P = { p 0 , p 1 , , p k 1 } , p i = ( x i , y i )
where p i represents the i -th vertex in image coordinate space. Typically between 10 and 15 vertices are placed depending on the complexity of the footprint margin (Figure 1). The polygon is treated as a closed curve by defining p k = p 0 .
The annotated polygon is used directly as the representation of footprint shape. This preserves the observed footprint margin, including anatomical features and substrate-related deformation, and avoids the introduction of artificial smoothing.
Because the number and spacing of vertices vary between footprints, outlines are standardised through arc-length resampling. The cumulative distance along the polygon perimeter is calculated as:
d 0 = 0
d i = j = 1 i x j x j 1 ) 2 + ( y j y j 1 ) 2 , i = 1 , , k
with total perimeter length:
L = d k
The polygon is then resampled at evenly spaced arc-length intervals:
s j = j m L , j = 0 , , m 1
where m is the desired number of vertices describing the standardised outline (here m = 50 ). Each s j is located along the cumulative arc-length function and interpolated linearly between neighbouring vertices such that d i s j < d i + 1 . This yields a resampled polygon:
X = { ( x 0 , y 0 ) , , ( x m 1 , y m 1 ) }
This procedure ensures that each footprint is represented by the same number of evenly distributed perimeter points.
Left and right footprints can either be analysed separately or combined into a single dataset. When combining datasets, left footprints are reflected across the sagittal axis after centring:
x i * = x i *
and the order of vertices is reversed to preserve consistent traversal direction around the polygon.
To remove variation caused by translation, polygons are centred so that their centroid lies at the origin:
x i * = x i x ¯ ,   y i * = y i y ¯
where
x ¯ = 1 m i = 0 m 1 x i , y ¯ = 1 m i = 0 m 1 y i
For shape-only analyses, centred polygons are additionally scaled to unit centroid size:
C S = i = 0 m 1 x i * 2 + y i * 2
x i * * = x i * C S , y i * * = y i * C S
This removes variation due to translation and scale while preserving shape.
Although the vertices defining each polygon are not homologous anatomical landmarks in the traditional sense, their ordered position along the footprint perimeter provides a consistent topological correspondence between specimens. After arc-length resampling, each outline is represented by an identical number of evenly spaced points describing the boundary of the footprint. These points function as semi-landmarks, representing relative positions along a continuous curve rather than discrete anatomical features. Because the points preserve their sequential order around the perimeter, they satisfy the requirements for geometric morphometric analysis and can be compared using methods such as Generalized Procrustes Analysis.
Aligned polygon configurations are obtained using Generalized Procrustes Analysis (GPA). GPA iteratively rotates each configuration to minimise the summed squared distances between corresponding points and the mean configuration. Given a set of configurations X k , the mean configuration X ¯ is computed, and within-sample variability is quantified as:
σ 2 = 1 n k = 1 n X k     X ¯ 2
This provides a measure of dispersion describing variability in footprint shape within a sample.
Because centroid size normalisation removes absolute scale, analyses incorporating footprint size are conducted using a parallel processing pathway in which polygons are centred but not scaled. In this case, size metrics such as footprint length are retained as independent variables and can be analysed alongside shape. This separation ensures that shape comparisons are not confounded by scale, while still allowing biologically meaningful size information to be incorporated where required. All procedures were implemented in Python V 3.11.15 packaged by Anaconda (Austin, TX, USA) and running in JupyterLab Version 4.5.6.
It is important to note that although the resampled vertices do not correspond to discrete homologous anatomical landmarks, their ordered positions along the footprint perimeter provides a consistent and biologically meaningful basis for comparison. Arc-length resampling ensures that each point occupies an equivalent relative position along the outline (e.g., proportion of total perimeter), establishing a one-to-one correspondence between specimens. In this sense, the vertices function as semi-landmarks constrained by the geometry of a continuous curve. Unlike fixed anatomical landmarks, semi-landmarks capture shape information distributed along boundaries where homologous points are not discretely defined but are nevertheless comparable in a geometric and functional sense [19]. This approach is widely used in outline-based geometric morphometrics and is particularly appropriate for footprint data, where shape variation reflects a combination of anatomy, biomechanics, and substrate interaction expressed across the entire margin of the track rather than at a limited set of fixed points.

2.2. Perturbation Experiments

We quantified the sensitivity of footprint shape analyses to annotation uncertainty by comparing empirical within-trackway variability with synthetic perturbations applied to digitised footprint outlines. A two-stage workflow was used: (1) calibration of perturbation models to a common deformation scale, and (2) application of a single equivalent-strength parameter across models to enable direct comparison with empirical variability.
Perturbations are applied to the standardised polygon:
X = { ( x 0 , y 0 ) , , ( x m 1 , y m 1 ) }
represented as an ordered, closed curve. For each vertex, a local outward unit normal vector n i is estimated from neighbouring points along the perimeter. Displacements are applied along these normals so that perturbations modify the shape of the outline without introducing tangential drift along the curve.
Three complementary perturbation models are implemented, representing increasing levels of spatial structure in the deformation: random, elastic, and rubber-band.
In the simplest model, each vertex is displaced independently along its normal direction:
x i = x i + δ i n i
where δ i is drawn from a zero-mean distribution (e.g., Gaussian). This produces spatially uncorrelated noise along the outline and approximates small-scale annotation variability arising from manual digitisation. While computationally simple, this model does not preserve spatial coherence and therefore provides a lower bound on realistic deformation.
To introduce spatial correlation, displacement magnitudes are smoothed along the polygon perimeter. A sequence of random values is first generated for all vertices and then filtered using a smoothing kernel (e.g., Gaussian), producing a continuous displacement field:
x i = x i + δ i s m o o t h n i
where δ i s m o o t h varies gradually along the outline. This model represents diffuse, spatially continuous deformation consistent with sediment compaction or broad annotation bias. Conceptually, this approach is analogous to smooth deformation fields used in geometric morphometrics and image warping, such as thin-plate spline transformations [20].
Deformation is further constrained using a “rubber-band” model in which a contiguous segment of the polygon is displaced smoothly, analogous to pulling or pushing a flexible boundary. A segment is defined by selecting a continuous subset of vertices along the perimeter. Displacement magnitudes within this segment are governed by a smoothly varying weighting function (e.g., Gaussian or cosine window), such that deformation is maximal at the centre of the segment and tapers to zero at its boundaries.
Formally, the perturbed position of each vertex is given by:
x i = x i + δ i n i
where δ i 0 only for vertices within the selected segment. Optional anchor regions (e.g., heel or toe) may be excluded from deformation to preserve key structural features. This model produces localised, spatially coherent distortions that more closely reflect realistic variation in footprint margins arising from systematic annotation differences. Conceptually, the approach is related to elastic curve formulations and active contour (“snake”) models in which boundaries behave as flexible, spatially coupled structures [21], although here deformation is applied in a controlled forward manner rather than through energy minimisation.
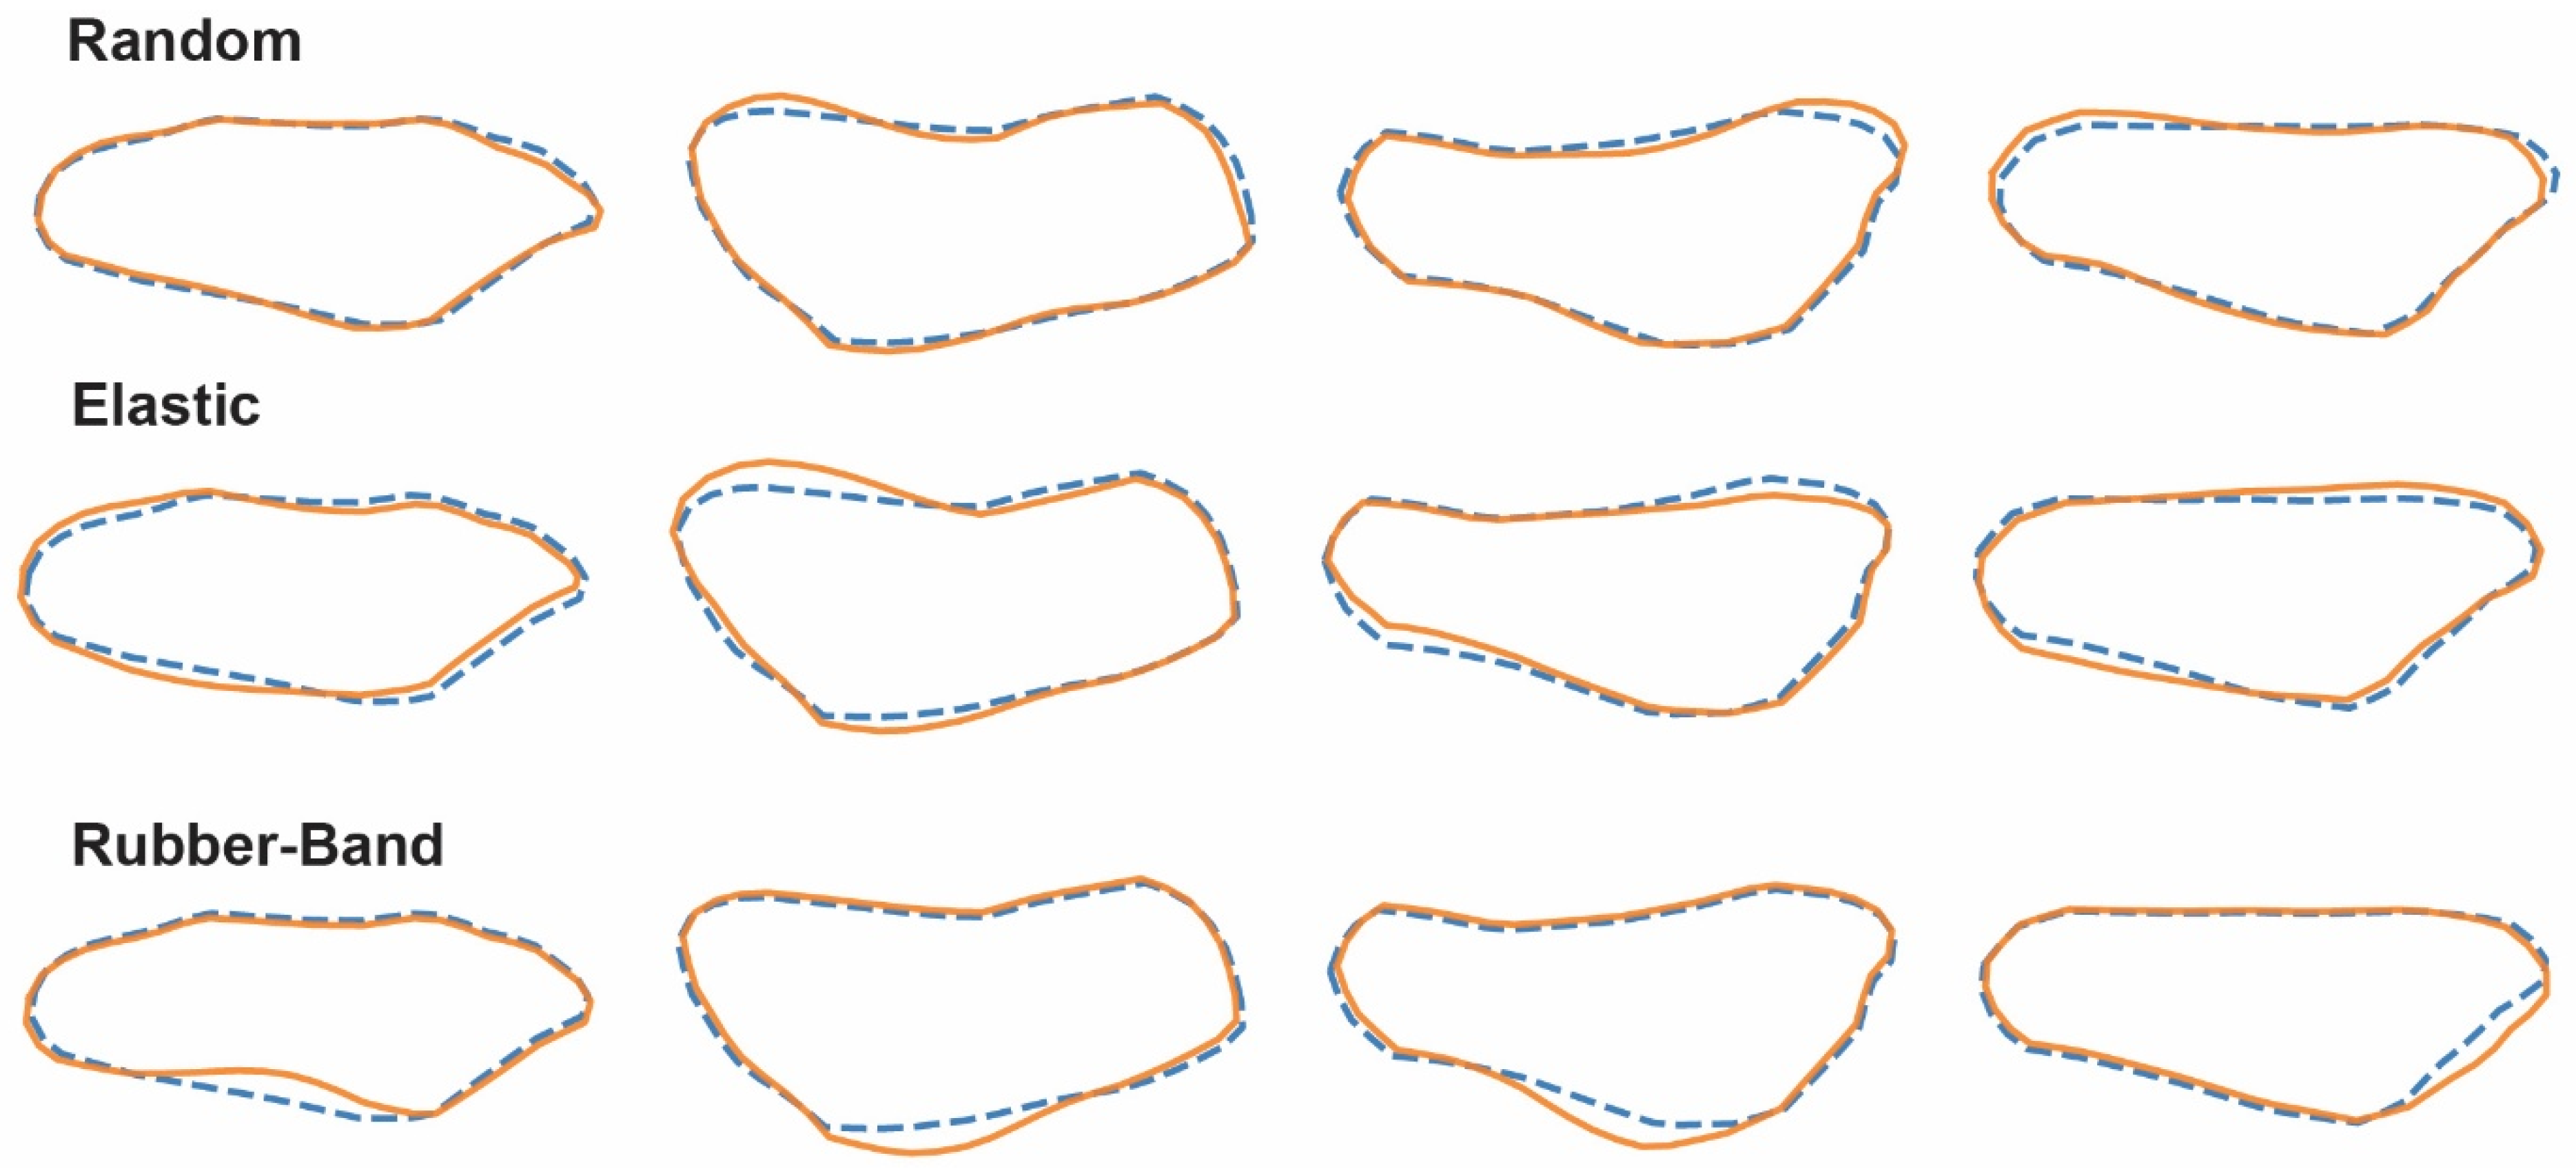
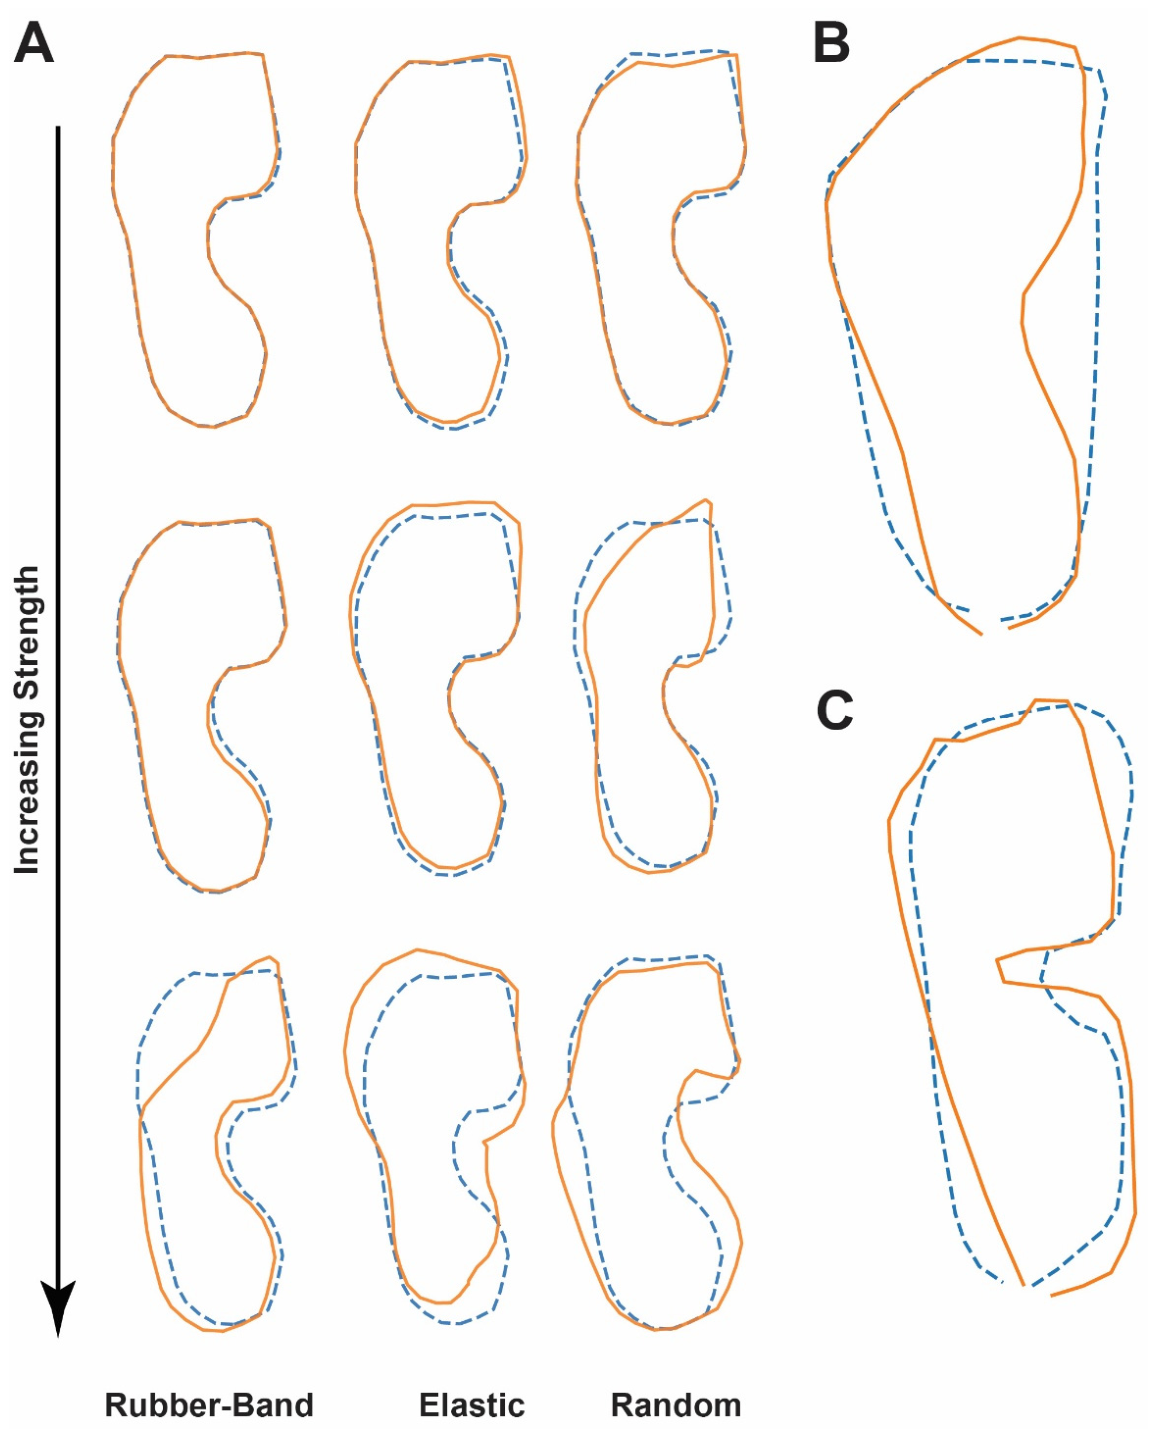
For all perturbation models, deformation magnitude is controlled using a single strength parameter expressed as a percentage of footprint length. This parameter is applied consistently across the random, elastic, and rubber-band models such that the overall amplitude of displacement is directly comparable between methods. In practice, the strength parameter defines the characteristic displacement applied along vertex normals, scaled relative to footprint length. For the random and elastic models, this corresponds to the standard deviation (or equivalent amplitude) of the displacement field, while for the rubber-band model it defines the peak displacement at the centre of the deformed segment. The parameter is calibrated so that the expected magnitude of deformation is equivalent across models, ensuring that differences in resulting shape variation reflect the spatial structure of deformation rather than differences in overall displacement magnitude. Figure 2 shows a series of typical deformations at a strength of 30%. While Figure 3A shows the same footprint across 30, 60 and 90% strengths by each of the deformations used. During multiple runs the style of deformation as observed and Procrustes Distances noted.

2.3. Data Used

Footprint data from various sources have been used in this experiment. A large intra-trackway variance study was conducted under normal walking on a beach (N = 78). Additionally fossil tracks from a single Holocene trackway in Namibia (N = 20) were used (“Old Harry’s Trackway”, [17]). Along with two small inter-user experiments (N = 11 and 12). In the latter case subjects we instructed as to the method of polygon placement via a short video and then given two tracks to annotate themselves. In all cases left prints were mirrored to right and orientations were maintained to a central axis.

3. Results

3.1. Vertices Placement: Robust or Not?

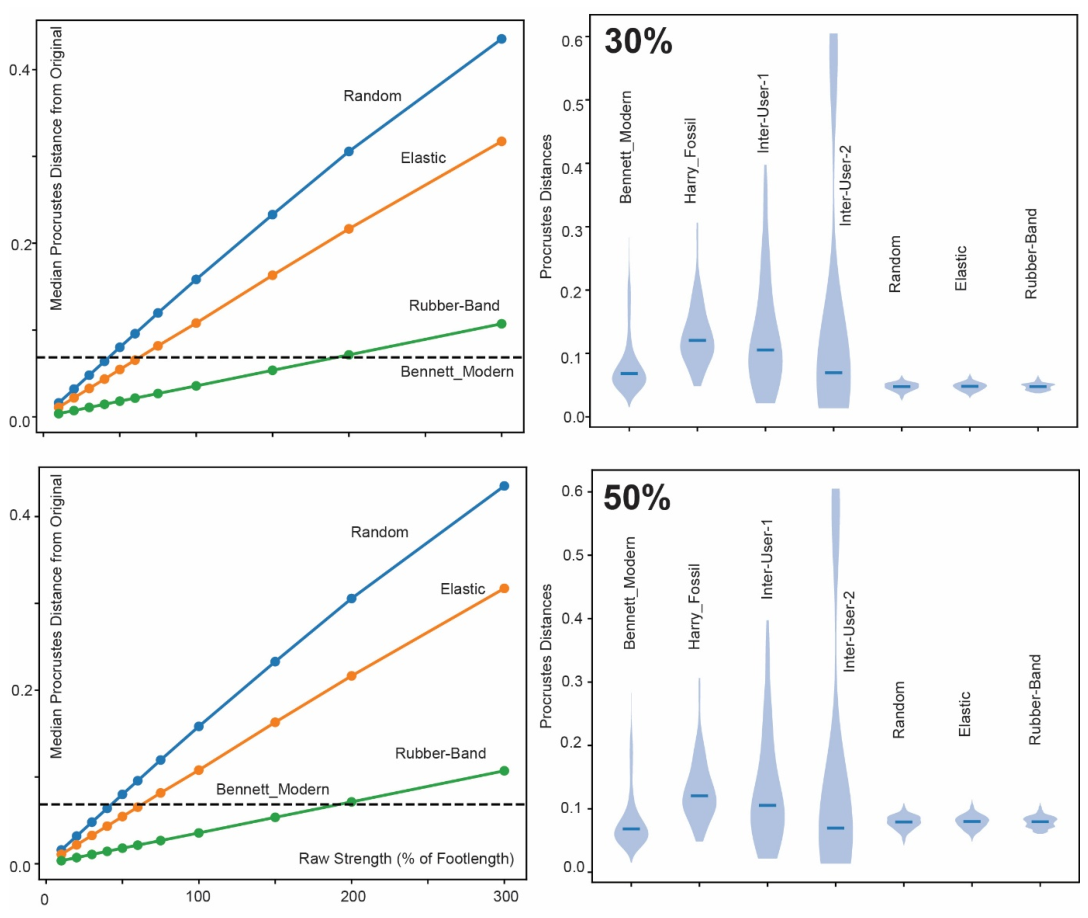
The relationship between perturbation magnitude and realised shape change differed substantially between perturbation models (Figure 4). For a given raw strength, random perturbations produced the largest Procrustes distances, followed by elastic perturbations, while rubber-band perturbations produced substantially smaller shape changes. As a consequence, the raw perturbation magnitude required to match empirical within-trackway variability varied markedly between models. For the reference trackway (Harry_Fossil), the median Procrustes distance (~0.12) was reached at approximately 70% strength for random perturbations, ~100% for elastic perturbations, and ~300% for rubber-band perturbations.
When perturbation models were calibrated to a common equivalent-strength scale, these differences in realised deformation were removed. At 30% equivalent strength, all three perturbation models produced similar distributions of Procrustes Distances by construction. However, these distributions remained substantially narrower than those observed within real trackways (Figure 4). In particular, empirical within-trackway variability consistently exceeded the magnitude of deformation generated by calibrated perturbations at moderate equivalent strengths. At 50% equivalent strength synthetic perturbations exceed intra-trackway variation, for the beach control (Bennett_Modern) and one of the inter-user experiments. But in mud (Harry_Fossil) the intra-trackway variance remains larger as does one of the inter-user data sets. These results remain robust against multiple runs and suggest that intra-trackway variation remains larger than plausible annotation errors. The strength of the random perturbation remains larger than any other and warns users to be aware of the randomly placed vertices caused by inattentive annotation. Such an issue is no different from that associated with traditional landmarks. Overall, the results demonstrate a clear hierarchy of variance over moderate annotation errors: annotation noise is smaller than inter-user variability, which is in turn smaller than within-trackway morphological variation.

3.2. Example Applications

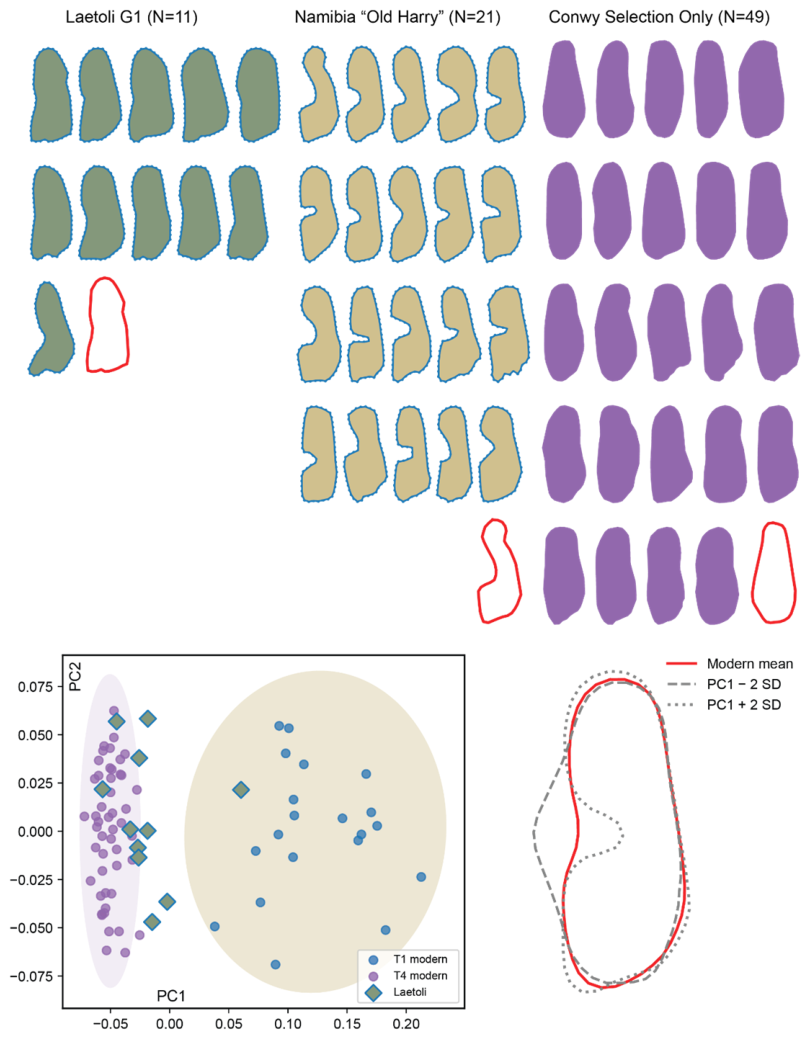
In order to illustrate the method a simple comparison was performed. Eleven footprints from the G1 Laetoli trackway compared to 21 tracks from “Old Harry’s Trackway” in Namibia [15,16,17], with 47 modern tracks made in the Conwy Estuary by a single person [22]. Prior to the analysis left feet were reflect to right. Figure 5 shows the results of a simply PCA based on Procrustes Distances showing separation of two of the populations, with the third overlapping both. The principle morphological element at play is the degree to which the longitudinal lateral arch is developed. This is particularly marked in “Old Harry’s Trackway”. No doubt separation of these population could have been achieved by landmarks placed around the periphery of each footprint, but the use of the polygon makes interpretation clear and we argue that more data is captured via the polygon than by simply placing half a dozen landmarks.

4. Discussion

This study shows that polygon-based representations of human footprint outlines can be used as a robust and practical alternative to landmark-based morphometric approaches. By capturing the entire footprint margin and resampling it into a standardised set of boundary points, the method avoids the need to identify discrete homologous landmarks, which are often ambiguous or absent in footprint data. The results show that this approach not only produces consistent representations of footprint shape, but that it is also resilient to realistic levels of annotation uncertainty.
A key outcome of the sensitivity analysis is the identification of a clear hierarchy of variance. Variation introduced through simulated annotation perturbation is consistently smaller when less than 50% of foot length, than inter-observer variability, which in turn is smaller than intra-trackway variation, and substantially smaller than variation between trackways (Table 1). This hierarchy demonstrates that the signal of biological and behavioural variation preserved in footprint morphology is considerably greater than the noise introduced during polygon digitisation. In practical terms, this provides strong evidence that polygon-based approaches are sufficiently robust for comparative morphometric analysis. The use of polygons provides an alternative to more conventional landmark-based geometric morphometrics of human footprints. The sensitivity experiments indicate that annotation errors of up to 50% of footprint length do not materially affect morphometric outcomes depending on whether they are purely random or effect a chain of points. These findings have important implications for the use of geometric morphometrics in ichnology. Traditional landmark-based approaches rely on the identification of anatomically meaningful points, which can be difficult to define consistently in footprints due to variation in preservation, substrate conditions, and behaviour. The absence of specific landmarks is also an issue. In contrast, polygon-based methods capture the full footprint outline without requiring subjective landmark placement, making them particularly well suited to irregular or poorly defined impressions. Rather than replacing landmark-based methods, polygon-based approaches should be seen as complementary tools, extending the range of tools available in vertebrate ichnology.
To be clear we do not claim that the polygonal approach is better to alternative methods out there, it is simply a robust alternative. Specifically where the key variable being analysed is the external shape rather than internal geometry (i.e., deepest points etc.) then it may be superior. It also has the advantage that multiple users can annotate data quickly without training on specific anatomical landmarks. When considering intra-trackway variance it provides a fast and efficient approach. There is no doubt that more sophisticated landmark based analyses utilising depth information derived from three-dimensional scans will yield more nuanced information (e.g., [6]). The advantage of the approach outlined here is that it can be applied to orthogonal photographs as well as three-dimensional models increasing the range of possible track inputs. In the case of the Happisburgh track site in the UK which was uncovered and lost almost immediately to coast erosion no three-dimensional models were recovered due to inclement weather [23]. An outline based approach is the only realistic option and was used in Wiseman et al. [11]. We would argue that in this type of situation a polygon-based approach provides a alternative methodological option.
Several limitations should be noted. First, the method assumes that the digitised polygon accurately represents the true footprint margin, which may not always be the case in poorly preserved or complex substrates. Second, while resampling standardises point density, it treats all parts of the footprint boundary equally, despite potential differences in anatomical or functional significance. Third, the sensitivity thresholds identified here are based on a limited number of trackways and may vary with footprint morphology, preservation quality, and annotation practice. Further work across a broader range of datasets would help refine these estimates and assess their generality.
More broadly, this study highlights the importance of explicitly quantifying methodological uncertainty in morphometric analyses. Rather than assuming that annotation error is negligible, the approach taken here demonstrates how its effects can be measured and compared directly with biological variation. This provides a framework for evaluating the reliability of morphometric methods and for establishing practical thresholds of acceptable uncertainty. In conclusion, polygon-based morphometric analysis provides a flexible, reproducible, and robust framework for quantifying footprint shape. By combining full-outline representation with explicit assessment of annotation sensitivity, the method offers a practical alternative to landmark-based approaches and has clear potential for wider application in ichnology and related fields.

Author Contributions

Conceptualization, M.R.B.; methodology, M.R.B. and M.E.; software M.R.B. and M.B.; validation, M.R.B.; formal analysis, M.R.B.; investigation, M.R.B. and S.C.R.; resources, M.R.B. and S.C.R.; data curation H.S.; writing—original draft preparation, M.R.B.; writing—review and editing, M.R.B., M.E. and S.C.R.; visualization, M.R.B.; supervision, M.R.B. and S.C.R.; project administration, M.R.B. and S.C.R.; funding acquisition, M.R.B. and S.C.R. All authors have read and agreed to the published version of the manuscript.

Funding

This research was funded by UK Arts and Humanities Research Council AHRC AH/X001326/1.

Data Availability Statement

Data is available on request to the corresponding author.

Acknowledgments

The assistance of Abigail Hunt, Sarah Maryon, Ed Jolie, Dan Odess and David Bustos is gratefully acknowledged along with a number of anonymous students at Bournemouth University. The inter-user study was conducted according to Bournemouth University Ethics Policy (ID 67734).

Conflicts of Interest

The authors declare no conflict of interests.

References

  1. Bustos, D.; Jakeway, J.; Urban, T.M.; Holliday, V.T.; Fenerty, B.; Raichlen, D.A.; Budka, M.; Reynolds, S.C.; Allen, B.D.; Love, D.W.; et al. Footprints preserve terminal Pleistocene hunt? Human-sloth interactions in North America. Sci. Adv. 2018, 4, eaar7621. [Google Scholar] [CrossRef] [PubMed]
  2. McLaren, D.; Fedje, D.; Dyck, A.; Mackie, Q.; Gauvreau, A.; Cohen, J. Terminal Pleistocene epoch human footprints from the Pacific coast of Canada. PLoS ONE 2018, 13, e0193522. [Google Scholar] [CrossRef] [PubMed]
  3. Moreno, K.; Bostelmann, J.E.; Macías, C.; Navarro-Harris, X.; De Pol-Holz, R.; Pino, M. A late Pleistocene human footprint from the Pilauco archaeological site, northern Patagonia, Chile. PLoS ONE 2019, 14, e0213572. [Google Scholar] [CrossRef] [PubMed]
  4. Mayoral, E.; Díaz-Martínez, I.; Duveau, J.; Santos, A.; Ramírez, A.R.; Morales, J.A.; Morales, L.A.; Díaz-Delgado, R. Tracking late Pleistocene Neandertals on the Iberian coast. Sci. Rep. 2021, 11, 4103. [Google Scholar] [CrossRef] [PubMed]
  5. Stewart, M.; Clark-Wilson, R.; Breeze, P.S.; Janulis, K.; Candy, I.; Armitage, S.J.; Ryves, D.B.; Louys, J.; Duval, M.; Price, G.J.; et al. Human footprints provide snapshot of last interglacial ecology in the Arabian interior. Sci. Adv. 2020, 6, eaba8940. [Google Scholar] [CrossRef] [PubMed]
  6. Hatala, K.G.; Roach, N.T.; Behrensmeyer, A.K. Fossil footprints and what they mean for hominin paleobiology. Evol. Anthr. Issues News Rev. 2022, 32, 39–53. [Google Scholar] [CrossRef] [PubMed]
  7. Sedrati, M.; Morales, J.A.; Duveau, J.; El M’rIni, A.; Mayoral, E.; Díaz-Martínez, I.; Anthony, E.J.; Bulot, G.; Sedrati, A.; Le Gall, R.; et al. A Late Pleistocene hominin footprint site on the North African coast of Morocco. Sci. Rep. 2024, 14, 1962. [Google Scholar] [CrossRef] [PubMed]
  8. Berge, C.; Penin, X.; Pellé, É. New interpretation of Laetoli footprints using an experimental approach and Procrustes analysis: Preliminary results. Comptes Rendus Palevol 2006, 5, 561–569. [Google Scholar] [CrossRef]
  9. Bennett, M.R.; Harris, J.W.; Richmond, B.G.; Braun, D.R.; Mbua, E.; Kiura, P.; Olago, D.; Kibunjia, M.; Omuombo, C.; Behrensmeyer, A.K.; et al. Early hominin foot morphology based on 1.5-million-year-old footprints from Ileret, Kenya. Science 2009, 323, 1197–1201. [Google Scholar] [CrossRef] [PubMed]
  10. Duveau, J.; Berillon, G.; Verna, C.; Laisné, G.; Cliquet, D. The composition of a Neandertal social group revealed by the hominin footprints at Le Rozel (Normandy, France). Proc. Natl. Acad. Sci. USA 2019, 116, 19409–19414. [Google Scholar] [CrossRef] [PubMed]
  11. Wiseman, A.L.; Stringer, C.B.; Ashton, N.; Bennett, M.R.; Hatala, K.G.; Duffy, S.; O’Brien, T.; De Groote, I. The morphological affinity of the Early Pleistocene footprints from Happisburgh, England, with other footprints of Pliocene, Pleistocene, and Holocene age. J. Hum. Evol. 2020, 144, 102776. [Google Scholar] [CrossRef] [PubMed]
  12. Crompton, R.H.; Pataky, T.C.; Savage, R.; D’AOût, K.; Bennett, M.R.; Day, M.H.; Bates, K.; Morse, S.; Sellers, W.I. Human-like external function of the foot, and fully upright gait, confirmed in the 3.66 million year old Laetoli hominin footprints by topographic statistics, experimental footprint-formation and computer simulation. J. R. Soc. Interface 2011, 9, 707–719. [Google Scholar] [CrossRef] [PubMed]
  13. Belvedere, M.; Bennett, M.R.; Marty, D.; Budka, M.; Reynolds, S.C.; Bakirov, R. Stat-tracks and mediotypes: Powerful tools for modern ichnology based on 3D models. PeerJ 2018, 6, e4247. [Google Scholar] [CrossRef] [PubMed]
  14. Bennett, M.R.; Reynolds, S.C.; Morse, S.A.; Budka, M. Laetoli’s lost tracks: 3D generated mean shape and missing footprints. Sci. Rep. 2016, 6, 21916. [Google Scholar] [CrossRef] [PubMed]
  15. Bennett, M.R.; Morse, S.A. Fossilised Locomotion; Springer: Cham, Switzerland, 2014. [Google Scholar]
  16. Bennett, M.R.; Bustos, D.; Odess, D.; Urban, T.M.; Lallensack, J.N.; Budka, M.; Santucci, V.L.; Martinez, P.; Wiseman, A.L.; Reynolds, S.C. Walking in mud: Remarkable Pleistocene human trackways from white sands national park (New Mexico). Quat. Sci. Rev. 2020, 249, 106610. [Google Scholar] [CrossRef]
  17. Morse, S.A.; Bennett, M.R.; Liutkus-Pierce, C.; Thackeray, F.; McClymont, J.; Savage, R.; Crompton, R.H. Holocene footprints in Namibia: The influence of substrate on footprint variability. Am. J. Phys. Anthr. 2013, 151, 265–279. [Google Scholar] [CrossRef] [PubMed]
  18. Wiseman, A.L.; De Groote, I. One size fits all? Stature estimation from footprints and the effect of substrate and speed on footprint creation. Anat. Rec. 2022, 305, 1692–1700. [Google Scholar]
  19. Gunz, P.; Mitteroecker, P.; Bookstein, F.L. Semilandmarks in three dimensions. In Modern Morphometrics in Physical Anthropology; Slice, D.E., Ed.; Kluwer Academic/Plenum Publishers: New York, NY, USA, 2005; pp. 73–98. [Google Scholar]
  20. Bookstein, F. Principal warps: Thin-plate splines and the decomposition of deformations. IEEE Trans. Pattern Anal. Mach. Intell. 1989, 11, 567–585. [Google Scholar] [CrossRef]
  21. Kass, M.; Witkin, A.; Terzopoulos, D. Snakes: Active contour models. Int. J. Comput. Vis. 1988, 1, 321–331. [Google Scholar] [CrossRef]
  22. Strehlau, H.; Maryon, S.; Everett, M.; Hunt, A.; Reynolds, S.; Bennett, M.R. The taphonomy of human footprints in an estuarine setting: Implications for Quaternary track-sites in intertidal zones. Quat. Sci. Adv. 2026, 21, 100317. [Google Scholar] [CrossRef]
  23. Ashton, N.; Lewis, S.G.; De Groote, I.; Duffy, S.M.; Bates, M.; Bates, R.; Hoare, P.; Lewis, M.; Parfitt, S.A.; Peglar, S.; et al. Hominin footprints from early Pleistocene deposits at Happisburgh, UK. PLoS ONE 2014, 9, e88329. [Google Scholar] [CrossRef] [PubMed]
Figure 1. Illustration of the polygon approach described here. A footprint is enclosed by a polygon that is then resampled to give a uniform number of points and thereby satisfy the assumptions necessary for a Generalised Procrustes Analysis which is indicated in the later panels. Panel (E) shows the superimposed polygons with each track shown in a different colour while Panel (F) shows the mean outline and an example. The track is a three-dimensional model of a print within the “Old Harry Trackway” described by Morse et al. [17].
Fossstud 04 00017 g001
Figure 2. A selection of footprint polygons that have been subject to artificial noise. Displacement has a strength of 30% effecting 30 vertices. The rubber-band approach simulates user variance where different outlines have been traced. Orange lines are the original outlines while the blue dashes are the deformed polygons.
Fossstud 04 00017 g002
Figure 3. Synthetic and actual footprint deformations. (A) Synthetic deformations against 30%, 60% and 90% strength from top to bottom showing the original footprint polygon and the deformed version. All the deformations illustrated show plausible annotation errors. (B,C) Two footprints showing the empirical range of deformations within each trackway. Upper is modern beach data for a single subject, while the lower example is derived from “Old Harry’s Trackway” from Namibia. Orange lines are the deformed outlines while the blue dashes are the original polygons.
Fossstud 04 00017 g003
Figure 4. Calibration of perturbation models and comparison with empirical trackway variability for strengths of 30 and 50%. (Left) panels show the relationship between raw perturbation strength (expressed as % of mean edge length) and realised shape change (median Procrustes distance) for three perturbation models (random, elastic, rubber-band). The horizontal dashed line indicates the median within-trackway variability for the reference trackway. Substantially different raw perturbation magnitudes are required for each model to reach this empirical threshold. (Right) panels show the distributions of Procrustes distances for empirical within-trackway variability (individual trackways) compared with pooled synthetic perturbations at 30% and 50% equivalent strength. Equivalent strength represents a calibrated scale on which all perturbation models produce comparable median deformation. At this level, all perturbation models generate substantially less variation than observed within trackways.
Fossstud 04 00017 g004
Figure 5. Illustrative PCA comparing three track populations each made by a single individual. The polygons shown in the upper part of the figure are the input polylines, with the red outline being the mean. Laetoli tracks (green) are derived from digital laser scans collected by the senior author (G1-23, -25, -26, -27, -31, -33, -34, -35, -36, -37, -39). The Namibia trackway (beige) is referred to as “Old Harry’s Trackway” and is ~500 years BP [17]. The Conwy data (purple) is taken from Strehlau et al., [22] and the tracks were made by a single individual walking in estuarine mud. Only a selection of Conwy data is shown. Red outlines correspond to mean shapes.
Fossstud 04 00017 g005
Table 1. Results of several simulations showing the relative annotation errors necessary to exceed observed inter and intra trackway variance. The level is shown by the horizontal grey box.
MethodEquiv-Strength (%)Raw-Strength (%)NMeanMedian
Empirical-Within 3314.000.0860.071
Empirical-Between 3946.000.1870.165
Random1010.002340.000.0150.016
Elastic1014.672340.000.0150.016
Rubber-Band1044.492340.000.0150.016
Random2020.002340.000.0310.031
Elastic2029.332340.000.0310.031
Rubber-Band2089.692340.000.0310.031
Random3030.002340.000.0460.047
Elastic3044.152340.000.0460.047
Rubber-Band30134.572340.000.0470.047
Random4040.002340.000.0610.062
Elastic4058.682340.000.0620.062
Rubber-Band40179.012340.000.0620.063
Random5050.002340.000.0760.078
Elastic5073.472340.000.0770.078
Rubber-Band50224.272340.000.0780.079
Random6060.002340.000.0920.094
Elastic6088.382340.000.0930.094
Rubber-Band60268.172340.000.0930.094
Random7575.002340.000.1150.117
Elastic75110.602340.000.1160.117
Rubber-Band75334.852340.000.1160.116
Random100100.002340.000.1530.156
Elastic100145.692340.000.1520.156
Rubber-Band100442.882340.000.1530.154
Disclaimer/Publisher’s Note: The statements, opinions and data contained in all publications are solely those of the individual author(s) and contributor(s) and not of MDPI and/or the editor(s). MDPI and/or the editor(s) disclaim responsibility for any injury to people or property resulting from any ideas, methods, instructions or products referred to in the content.