Article

Ultrasonic Detectability of Planar and Volumetric Weld Defects: A Simulation-Based Signal-Response POD Study

1
LANDTIE Research Lab, Department of Manufacturing Engineering, Georgia Southern University, Statesboro, GA 30458, USA
2
Department of Mechanical Engineering, Georgia Southern University, Statesboro, GA 30458, USA
*
Author to whom correspondence should be addressed.
Submission received: 18 December 2025 / Revised: 1 February 2026 / Accepted: 17 February 2026 / Published: 2 March 2026
(This article belongs to the Topic Advances in Non-Destructive Testing Methods, 3rd Edition)

Abstract

Reliable ultrasonic inspection of welded structures requires a quantitative understanding of how defect morphology and depth influence detectability. In this study, a simulation-based signal-response Probability of Detection (POD) framework is developed to investigate ultrasonic wave interaction with representative planar and volumetric weld defects. Two-dimensional finite-element shear-wave simulations were conducted to model wave propagation and scattering from planar flaws (toe and root cracks) and volumetric flaws (porosity) across defined inspection depth zones. Peak terminal voltage was used as a continuous response metric for regression-based POD analysis. The results demonstrate that defect morphology dominates the influence on ultrasonic detectability. Planar defects produced systematically higher signal responses than volumetric defects of comparable size, resulting in lower characteristic detection limits. The estimated a90 value for planar flaws was 2.96 mm, compared to 5.64 mm for volumetric flaws under identical threshold conditions. Depth-dependent analyses further revealed morphology-specific behavior: planar defects exhibited consistently high detection probabilities across depth zones (POD > 0.98), whereas volumetric defects showed a reduction in detectability with depth, with POD decreasing from approximately 0.32 in shallow zones to 0.16 in deeper regions. The resulting POD trends are interpreted as comparative, trend-based indicators of morphology and depth-dependent ultrasonic detectability under idealized inspection conditions. These findings quantitatively demonstrate how ultrasonic detectability is governed by wave-defect interaction mechanisms associated with defect morphology and inspection depth.

1. Introduction

Welding is a dependable, efficient, and convenient method for building bridges, structures, aircraft, and automobiles. However, welded joints are inherently prone to defects, which cause structural compromise to the welded structures. Planar defects such as cracks and lack of fusion are particularly detrimental under cyclic and dynamic loading, while volumetric defects such as porosity and slag inclusions reduce joint strength and corrosion resistance [1,2,3]. The thermal cycling in the welding process affects the microstructure and mechanical properties of the welded joints. This makes it more susceptible to corrosive media-induced corrosion, which results in piping failures [4]. Welding defects from improper fabrication or repair caused serious structural failures, including cracks in the I-40 Bridge tie girder that made it unusable [5] and the sudden collapse of the Seongsu Bridge in South Korea, resulting in 17 deaths [6]. These incidents confirm that welding defects can significantly compromise structural integrity and safety because internal flaws may expand over time and cause critical damage [5]. That is why reliable detection of internal defects is essential to ensure weld integrity and structural safety. Among all nondestructive evaluation methods, Ultrasonic Testing (UT) has proven effective for detecting internal defects even in two different metal welds. Especially, Phased-Array Ultrasonic Testing (PAUT) enables localized weld quality assessment with improved accuracy and repeatability compared to conventional UT. PAUT also shows a strong correlation between ultrasonic response and weld-region mechanical properties across different welding conditions [7,8]. However, the ultrasonic response from a defect is not only governed solely by its presence but also depends on multiple factors. Flaw morphology (planar versus volumetric), size, orientation, depth, and microstructure play a crucial part. Classical pulse-echo weld inspection recognizes that cracks, lack of fusion, slag inclusions, and porosity do not respond similarly under identical beam conditions, which is reflected in the use of specific acceptance criteria for planar and volumetric flaws in structural codes such as AWS D1.5 [9]. From a wave-physics perspective, each flaw acts as a scatterer whose amplitude, phase, and diffraction behavior depend on its geometry and the local ultrasonic beam field, and these factors make the resulting ultrasonic feedback morphology dependent. Recent reviews on ultrasonic NDT show that accurate signal prediction requires explicit representation of defect class (e.g., flat-bottom holes, side-drilled holes, cracks, and pores), as each class produces distinct scattering and interference mechanisms [10]. A key distinction can be seen between planar and volumetric defects. Planar flaws, such as cracks and lack of fusion typically produce strong specular reflections and edge-diffracted signals. On the other hand, volumetric defects like porosity and slag inclusions act as distributed, low-contrast scatterers. Experimental analysis by Nardoni et al. showed that the ultrasonic amplitude ratio varies systematically with the defect height-to-width aspect ratio, by identifying a transition threshold below which defects exhibit volumetric scattering behavior and above which diffraction-dominated planar responses [11]. This finding verifies that defect morphology controls not only detectability but also the qualitative characteristics of the ultrasonic response.
Volumetric flaws, particularly cluster porosity or slag inclusions show a fundamentally different ultrasonic interaction compared to planar defects. Instead of producing a single coherent reflection, volumes and their detectability depend strongly on their spatial distribution within the ultrasonic beam. Jasiūnienė et al. demonstrated through finite-element and CIVA simulations of aluminothermic rail welds that the reflected amplitude from porosity is highly sensitive to defect depth and position relative to beam focus, even under fixed array configuration and inspection angle [12]. Porosity located within high ultrasonic beam coverage produced detectable indications; on the other hand, similarly sized pores in low-intensity or shadow regions became effectively undetectable [12]. These effects become more relevant for realistic weld geometries, where modeling studies by Roth and colleagues showed that complex weld geometries significantly distort phased-array beam fields and alter sensitivity to crack versus volumetric defects. At the same time, experimental and simulation studies on PAUT for rail inspections showed strong dependence of detection performance on flaw orientation and morphology, with identical transducer configurations demonstrating variable sensitivity across defect types [13]. Experimental analysis by Irtiza et al. also confirmed that PAUT and total focusing method (TFM) show morphology-dependent detectability, with PAUT showing higher reliability for volumetric defects and TFM providing superior sensitivity to planar flaws like cracks [14,15].
The dependence of ultrasonic response on flaw morphology, size, orientation, and depth implies that detection is inherently variable. A flaw that produces a clear indication under one inspection configuration may become weak or undetectable under another, and these phenomena depend on beam-flaw interaction conditions. That is why inspection performance cannot be reliably assessed solely by A-scans or image-based comparisons. Because of that, nondestructive evaluation relies on Probability of Detection (POD) to quantify the likelihood that an inspection system will detect a flaw of a given size or severity [16]. POD provides a statistical framework for characterizing inspection reliability and is widely used to benchmark inspection procedures, compare modalities, and establish qualification criteria in industrial practice. This is very important for weld inspection, where planar flaws (cracks) and volumetric flaws (porosity) provide fundamentally different ultrasonic responses because of distinct scattering mechanisms, which result in morphology-dependent detectability. Regulatory frameworks such as ASTM E2862 and MIL-HDBK-1823A emphasize POD-based quantification to ensure NDE systems meet defined safety and performance requirements [17,18]. On top of that, the growing POD-related research across safety-critical industries further verifies the reliance on statistically validated NDE reliability metrics [19].
Although Probability of Detection (POD) provides a statistical framework for quantifying inspection reliability, its determination traditionally relies on extensive experimental datasets obtained from flaw specimens with controlled morphology, size, and orientation. For welded structures, generating such datasets is costly and often impractical because realistic planar cracks, porosity clusters, and lack-of-fusion defects cannot be repeatedly fabricated with consistent geometry. That is why many researchers have explored physics-based simulation as a complementary approach to POD development. Recent modeling studies have shown that finite-element simulations can reliably reproduce wave-defect interaction behavior and morphology-dependent scattering trends observed experimentally [20], while reviews of advanced NDT methodologies emphasize the value of simulation for understanding how defect geometry influences detectability [21]. Numerical ultrasonic models further provide access to physically meaningful quantities such as scattering fields and terminal voltage-like responses, which are difficult to gather experimentally [22]. For example, Taheri et al. experimentally validated a finite-element ultrasonic wave propagation model for additively manufactured SS 17-4 PH components, demonstrating accurate prediction of focused immersion ultrasound responses from flat-bottom-hole defects while accounting for material properties, porosity, focal depth, and surface roughness effects [23].
Although simulation-based POD cannot replace full experimental validation due to the absence of noise, material heterogeneity, and human variability, it plays a critical role in the early stages of POD framework development. Simulation-driven analyses are effective for identifying flaw classes that are inherently more difficult to detect, guiding the selection of relevant experimental parameter ranges, and reducing the cost and scope of experimental trial and error. Previous studies have also shown that numerical models capture fundamental differences in wave-defect interaction between planar and volumetric flaws, reflecting morphology-dependent scattering mechanisms also reported in experimental ultrasonic investigations [12,13,21,23].
Motivated by these advantages, the present work employs finite-element ultrasonic simulations to investigate how representative planar and volumetric weld defects differ in their simulated responses. These responses are then used to construct signal-response POD trends intended for comparative detectability assessment of different flaw morphologies under controlled, idealized ultrasonic inspection conditions.
The novelty of the present work lies in the development of a physics-driven, simulation-based signal-response Probability of Detection (POD) framework that explicitly links ultrasonic wave-defect interaction mechanisms to detectability trends for welded structures. Previous POD studies in ultrasonic inspection have predominantly relied on experimental hit/miss data or amplitude and image-based response metrics, which are typically treated within classical and model-assisted POD frameworks [24]. In parallel, several finite-element simulation studies have investigated the feasibility of conducting POD analysis through numerical modeling for ultrasonic inspection of structural components [25]; however, these efforts focus on augmenting experimental data or examining specific defect classes without integrating a transducer-level response metric directly into a regression-based POD formulation. In contrast, the present study integrates finite-element ultrasonic simulations directly into a quantitative POD formulation. By maintaining identical inspection parameters and systematically varying only defect morphology, size, and depth, the proposed framework isolates morphology as a governing factor in ultrasonic detectability under controlled conditions. The resulting regression-based POD results and characteristic detection sizes are interpreted in a physics-consistent manner by explicitly relating morphology-dependent detectability trends to diffraction and specular-reflection dominated scattering for planar flaws versus distributed scattering for volumetric defects. Collectively, these contributions extend existing ultrasonic POD methodologies by providing a mechanistic, simulation-driven framework that is intended to support future Model-Assisted Probability of Detection (MAPOD) and experimental POD studies through physics-based characterization of morphology-dependent detectability trends.

2. Methodology

In order to develop a simulation-based POD framework to observe ultrasonic wave interaction with defect types, the following workflows are executed:
  • Development of a finite-element ultrasonic model simulation representing planar and volumetric weld flaw families.
  • Observe the ultrasonic interaction with defect types and extract the ultrasonic response matrices from simulated wave-defect interactions.
  • Construction of POD trends to assess morphology-dependent detectability under idealized inspection conditions.
The following sections describe the simulation setup, flaw size and types, and Probability of Detection modeling that are used to complete the analysis.

2.1. Simulation Setup

Finite-element simulations were performed by using COMSOL Multiphysics software (version 6.3) to model ultrasonic wave propagation and interaction with representative weld flaws. The simulation domain consisted of a two-dimensional steel plate representative of a structural weld specimen, with an overall length of approximately 100 mm and a thickness of approximately 25 mm. These dimensions were selected to be sufficiently large to capture ultrasonic wave propagation and scattering behavior while minimizing interference from boundary reflections. The plate geometry was held constant for all simulations to isolate the influence of flaw morphology on detectability.
An angled wedge of 28 degrees and a piezoelectric transducer assembly were incorporated to generate shear-wave excitation typical of conventional ultrasonic weld inspection. A two-dimensional plane-strain formulation was adopted to efficiently capture transient wave phenomena while maintaining computational tractability. The 2D formulation was selected to enable systematic parametric evaluation of flaw morphology and depth effects while maintaining computational efficiency, consistent with prior simulation-based ultrasonic studies. All materials were modeled as linearly elastic and isotropic. A frequency of 2 MHz was selected to represent a realistic and widely adopted ultrasonic inspection regime for structural weld evaluation, where a balance between penetration capability and sensitivity to millimeter-scale defects is required for medium-thickness steel components (approximately 20–30 mm). In conventional weld inspection practice, frequencies in the range of 1 to 5 MHz are commonly used to balance attenuation, beam divergence, and spatial resolution, with nominal probe frequencies around 2 to 2.25 MHz used for medium-thickness carbon and low-alloy steel welds [26,27]. The selected frequency also places the inspection in a wavelength regime that is well matched to the investigated defect sizes. For mild steel, shear wave velocity is 3230 m/s, which corresponds to a shear wave wavelength of about 1.6 mm at 2 MHz, as given by λ s = v s / f = 3230 / ( 2 × 10 6 ) . This wavelength is comparable to the investigated defect size range (1.5–4 mm), which places the inspection within a regime where wave-defect interaction is strongly influenced by defect morphology rather than purely Rayleigh-type scattering or purely geometric reflection. So, fixing the excitation frequency at 2 MHz enables morphology and depth-dependent detectability trends to be examined under a controlled wavelength-to-defect-size ratio, without conflating these effects with frequency-dependent resolution, attenuation, or penetration trade-offs. The objective of the present study is thus not to optimize inspection frequency, but to isolate fundamental ultrasonic detectability behavior associated with defect morphology and depth under representative weld inspection conditions. The base plate was modeled as structural steel with material properties consistent with values widely reported in ultrasonic NDT literature, including a density of 7850 kg/m3 and a shear-wave velocity of 3230 m/s. The wedge and transducer components were assigned to representative material behavior that is appropriate for shear-wave mode conversion and ultrasonic excitation.
The transducer used a tone-burst excitation to generate a transient ultrasonic wave within the plate. For each inspection configuration, the terminal voltage response was recorded in the time domain over a 3 µs observation window for both a defect-containing model and a corresponding no-defect reference model under identical excitation and boundary conditions. To isolate voltage fluctuations arising specifically from ultrasonic wave-defect interaction, the no-defect terminal voltage waveform was subtracted from the defect waveform, yielding a defect-induced differential signal, Δ V ( t ) = V defect ( t ) V reference ( t ) . The peak terminal voltage was then defined as the maximum absolute excursion of this differential signal within the observation window, V peak = m a x Δ V ( t ) .
This metric represents the strongest coherent voltage response associated with defect-induced ultrasonic backscatter reaching the transducer. Peak terminal voltage was selected as the primary response metric to enable consistent comparison of morphology and depth-dependent detectability across defect classes while minimizing sensitivity to waveform shape variations and late-time reflections. The 3 µs time window was selected to ensure capture of the excitation, wave-defect interaction, and primary scattered response for all simulated cases while excluding late-arriving boundary reflections and secondary numerical artifacts that are not relevant to defect detectability.
Absorbing regions were applied around the computational domain to suppress boundary reflections and ensure that recorded responses were dominated by wave-defect interactions rather than numerical artifacts. Spatial and temporal discretization were selected to ensure numerically stable wave propagation and adequate representation of the dominant ultrasonic wavelengths, consistent with standard finite-element ultrasonic modeling practices.
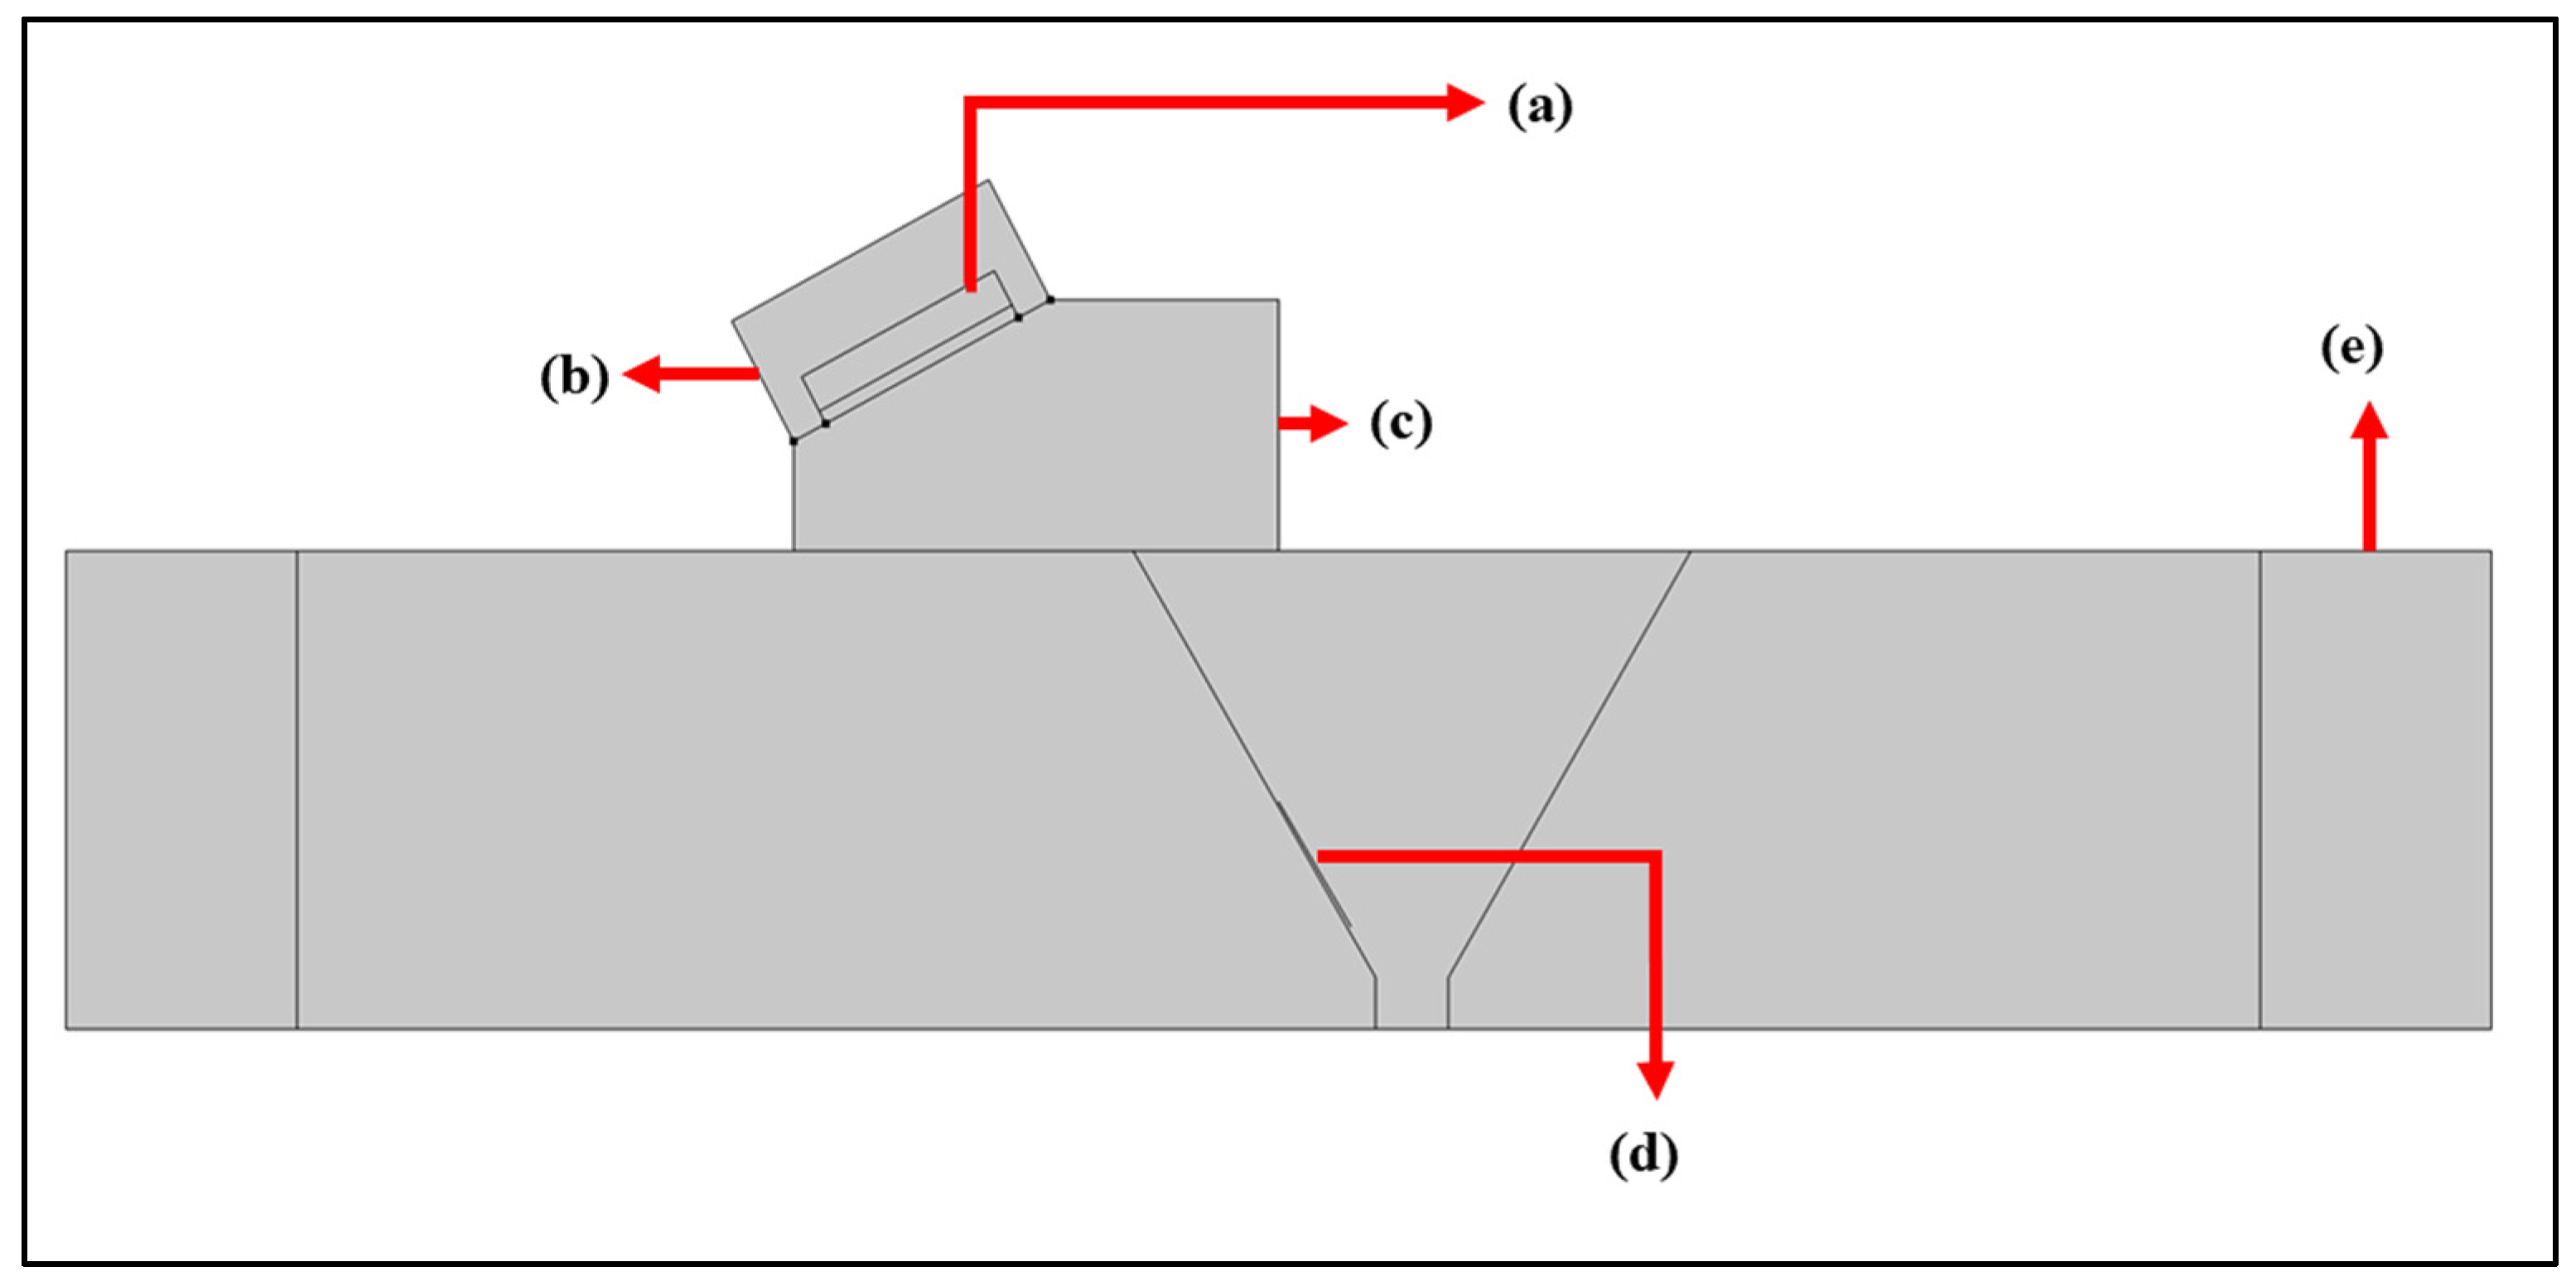
Figure 1 illustrates the 2D simulation configuration, and Table 1 summarizes the important simulation input parameters for a successful UT simulation. The numerical model is presented to convey the overall simulation approach and underlying physical assumptions governing wave–defect interaction. Accordingly, the results are interpreted in terms of relative detectability trends associated with different flaw morphologies.
The ultrasonic simulation in this study is a 2D plane-strain formulation. This modeling approach enables efficient parametric evaluation of defect morphology and depth effects while preserving the essential physics of shear-wave propagation, mode conversion, and wave-defect interaction under controlled conditions. Nevertheless, the 2D framework retains the dominant scattering mechanisms governing relative detectability differences between planar and volumetric defects.
However, a 2D plane-strain model cannot fully capture 3D scattering phenomena associated with realistic weld defects, especially volumetric pore clusters. In the practical welds, porosity may exist as spatially distributed 3D clusters that introduce out-of-plane diffraction, angular energy redistribution, and aperture-dependent scattering effects that cannot be represented in a 2D simulated framework.
Consequently, the present study does not aim to reproduce absolute inspection responses or qualification-level detectability. Instead, the simulations are intended to isolate first-order, morphology-dependent trends in ultrasonic response under idealized conditions. Accordingly, although the absolute POD values may vary under full three-dimensional and experimental conditions, the relative detectability trends with respect to defect morphology and depth are expected to remain qualitatively consistent.

2.2. Flaw Families and Depth Zone Configuration for POD Analysis

To conduct simulation-based Probability of Detection (POD) analysis and investigate morphology-dependent ultrasonic response behavior, representative planar and volumetric weld flaws were modeled within the two-dimensional simulation framework. Planar flaws included toe cracks and root cracks, while volumetric flaws were represented using porosity-type defects.
Nominal flaw sizes were selected within practical ranges relevant to ultrasonic weld inspection. Planar and volumetric flaw sizes spanned approximately 1.5–4 mm. The selected defect size range (1.5–4 mm) corresponds to a critical detectability regime for ultrasonic inspection of structural welds. At the selected excitation frequency of 2 MHz, the corresponding shear-wave wavelength in steel is 1.6 mm, placing the investigated flaw dimensions within a one-to-few-wavelength regime. This wavelength-scale regime is particularly relevant for POD analysis, as it represents the transition between marginal detectability and reliable detection, where ultrasonic response is highly sensitive to defect morphology, depth, and wave-defect interaction mechanisms. Accordingly, the chosen size range was intentionally selected to enable meaningful comparison of morphology-dependent detectability trends rather than to provide coverage of all possible defect dimensions.
From a practical inspection perspective, planar defects such as toe cracks and root cracks commonly initiate at millimeter-scale dimensions in structural welds and become critical to detection reliability before growing to larger, readily detectable sizes, making the investigated size range directly relevant to inspection sensitivity assessment.
For depth-wise analysis, flaws were grouped into two inspection depth zones relative to the scanning surface to reflect typical ultrasonic weld inspection practice and distinct wave-defect interaction regimes. Zone 01 (1–14 mm) represents near-surface and mid-weld regions that are directly insonified during conventional shear-wave inspections and where planar defects such as toe cracks are commonly encountered. Zone 02 (14–25 mm) corresponds to deeper weld and root regions that are inspected at longer sound paths, where increased propagation distance, beam divergence, and material attenuation reduce signal amplitude and inspection sensitivity, particularly for volumetric defects. This depth-based partitioning mirrors how inspection sensitivity varies through the weld thickness in practice. Morphology-dependent comparisons were therefore made between planar and volumetric flaws positioned within the same depth zone to ensure consistent inspection conditions. For planar flaws, depth-associated detectability trends were examined using representative toe-crack and root-crack defects located in different zones, recognizing that both exhibit planar scattering behavior under ultrasonic excitation. The summary of flaw type, their size range, and depth zones is shown in Table 2.

2.3. Probability of Detection Analysis Setup

In order to quantitatively evaluate the ultrasonic signal’s interaction with planar and volumetric defects and the effect of the signal strength of ultrasonic signals in terms of the depth of the defect from the scan surface, signal-response POD analysis was conducted. Unlike hit/miss approaches, the signal-response method relates a continuous metric to flaw characteristics, which enables evaluation of detectability trends under idealized conditions.
For this study, from each simulation case, the maximum terminal voltage recorded at the transducer during the simulation was extracted and used as a measure of ultrasonic response strength. This metric provides a direct representation of wave-defect interaction intensity.
After extracting and sorting the terminal voltage output, the following signal-response POD analysis was performed.
  • Defect Morphology-Dependent POD Analysis: Detectability trends were evaluated by comparing planar and volumetric flaws positioned within the same inspection depth zone. This analysis isolates the influence of flaw morphology on ultrasonic response behavior under similar inspection conditions.
    • In this case, the regression analysis was conducted by following these steps in Minitab (Version 21), summarized in Figure 2.
    • For Linear regression, the terminal voltage was set as the response, and the flaw type was set as the predictor.
    • From the regression equation, the estimated regression coefficients α 0 , α 1 , and standard deviation σ values were extracted, and then these were utilized to calculate the POD values by using the following formula [17,18].
P O D   a = 1 φ   T α 0 + α a σ
where φ  was the standard normal CDF, and T was the detection threshold.
Figure 2. Schematic workflow of the linear regression analysis performed in Minitab using simulated terminal voltage responses and flaw type inputs.
Ndt 04 00009 g002
This analysis provided proper insights into how ultrasonic waves behave change based on flaw types.
  • Defect Depth-Dependent POD Analysis: Depth effects were assessed by comparing terminal-voltage responses for flaws positioned in different depth zones.
    • In this case, the regression analysis was conducted by following the similar steps described in Figure 2.
    • For the linear regression, the terminal voltage response was set as the response, and the flaw depth zones were set as the predictor.
    • After conducting the regression analysis, the estimated regression coefficients α 0 , α 1 , and standard deviation σ value were extracted, and then these were utilized to calculate the POD by using a similar equation mentioned above Defect Morphology-Dependent POD Analysis section.
This analysis provided a clear insight into how the ultrasonic signal response varies with defect depth from the scan surface.
In summary, this study employed a physics-based finite-element ultrasonic simulation framework to investigate morphology and depth-dependent detectability trends for representative planar and volumetric weld flaws. Two-dimensional time-domain simulations were conducted to model shear-wave ultrasonic propagation and wave-defect interactions under controlled inspection conditions. Terminal voltage was used as a quantitative signal-response metric characterizing ultrasonic interaction strength. Representative planar (lack of fusion and root crack) and volumetric (porosity) flaw families were analyzed across defined inspection depth zones and practical size ranges relevant to structural weld inspection. Signal-response POD models were constructed using regression-based formulations to relate ultrasonic signal response to flaw characteristics, from which POD values and characteristic detection metrics (a90 and a90/95) were derived. This methodology enables systematic comparison of ultrasonic detectability trends arising from flaw morphology and depth under idealized simulation conditions, providing insight into fundamental wave-defect interaction behavior.
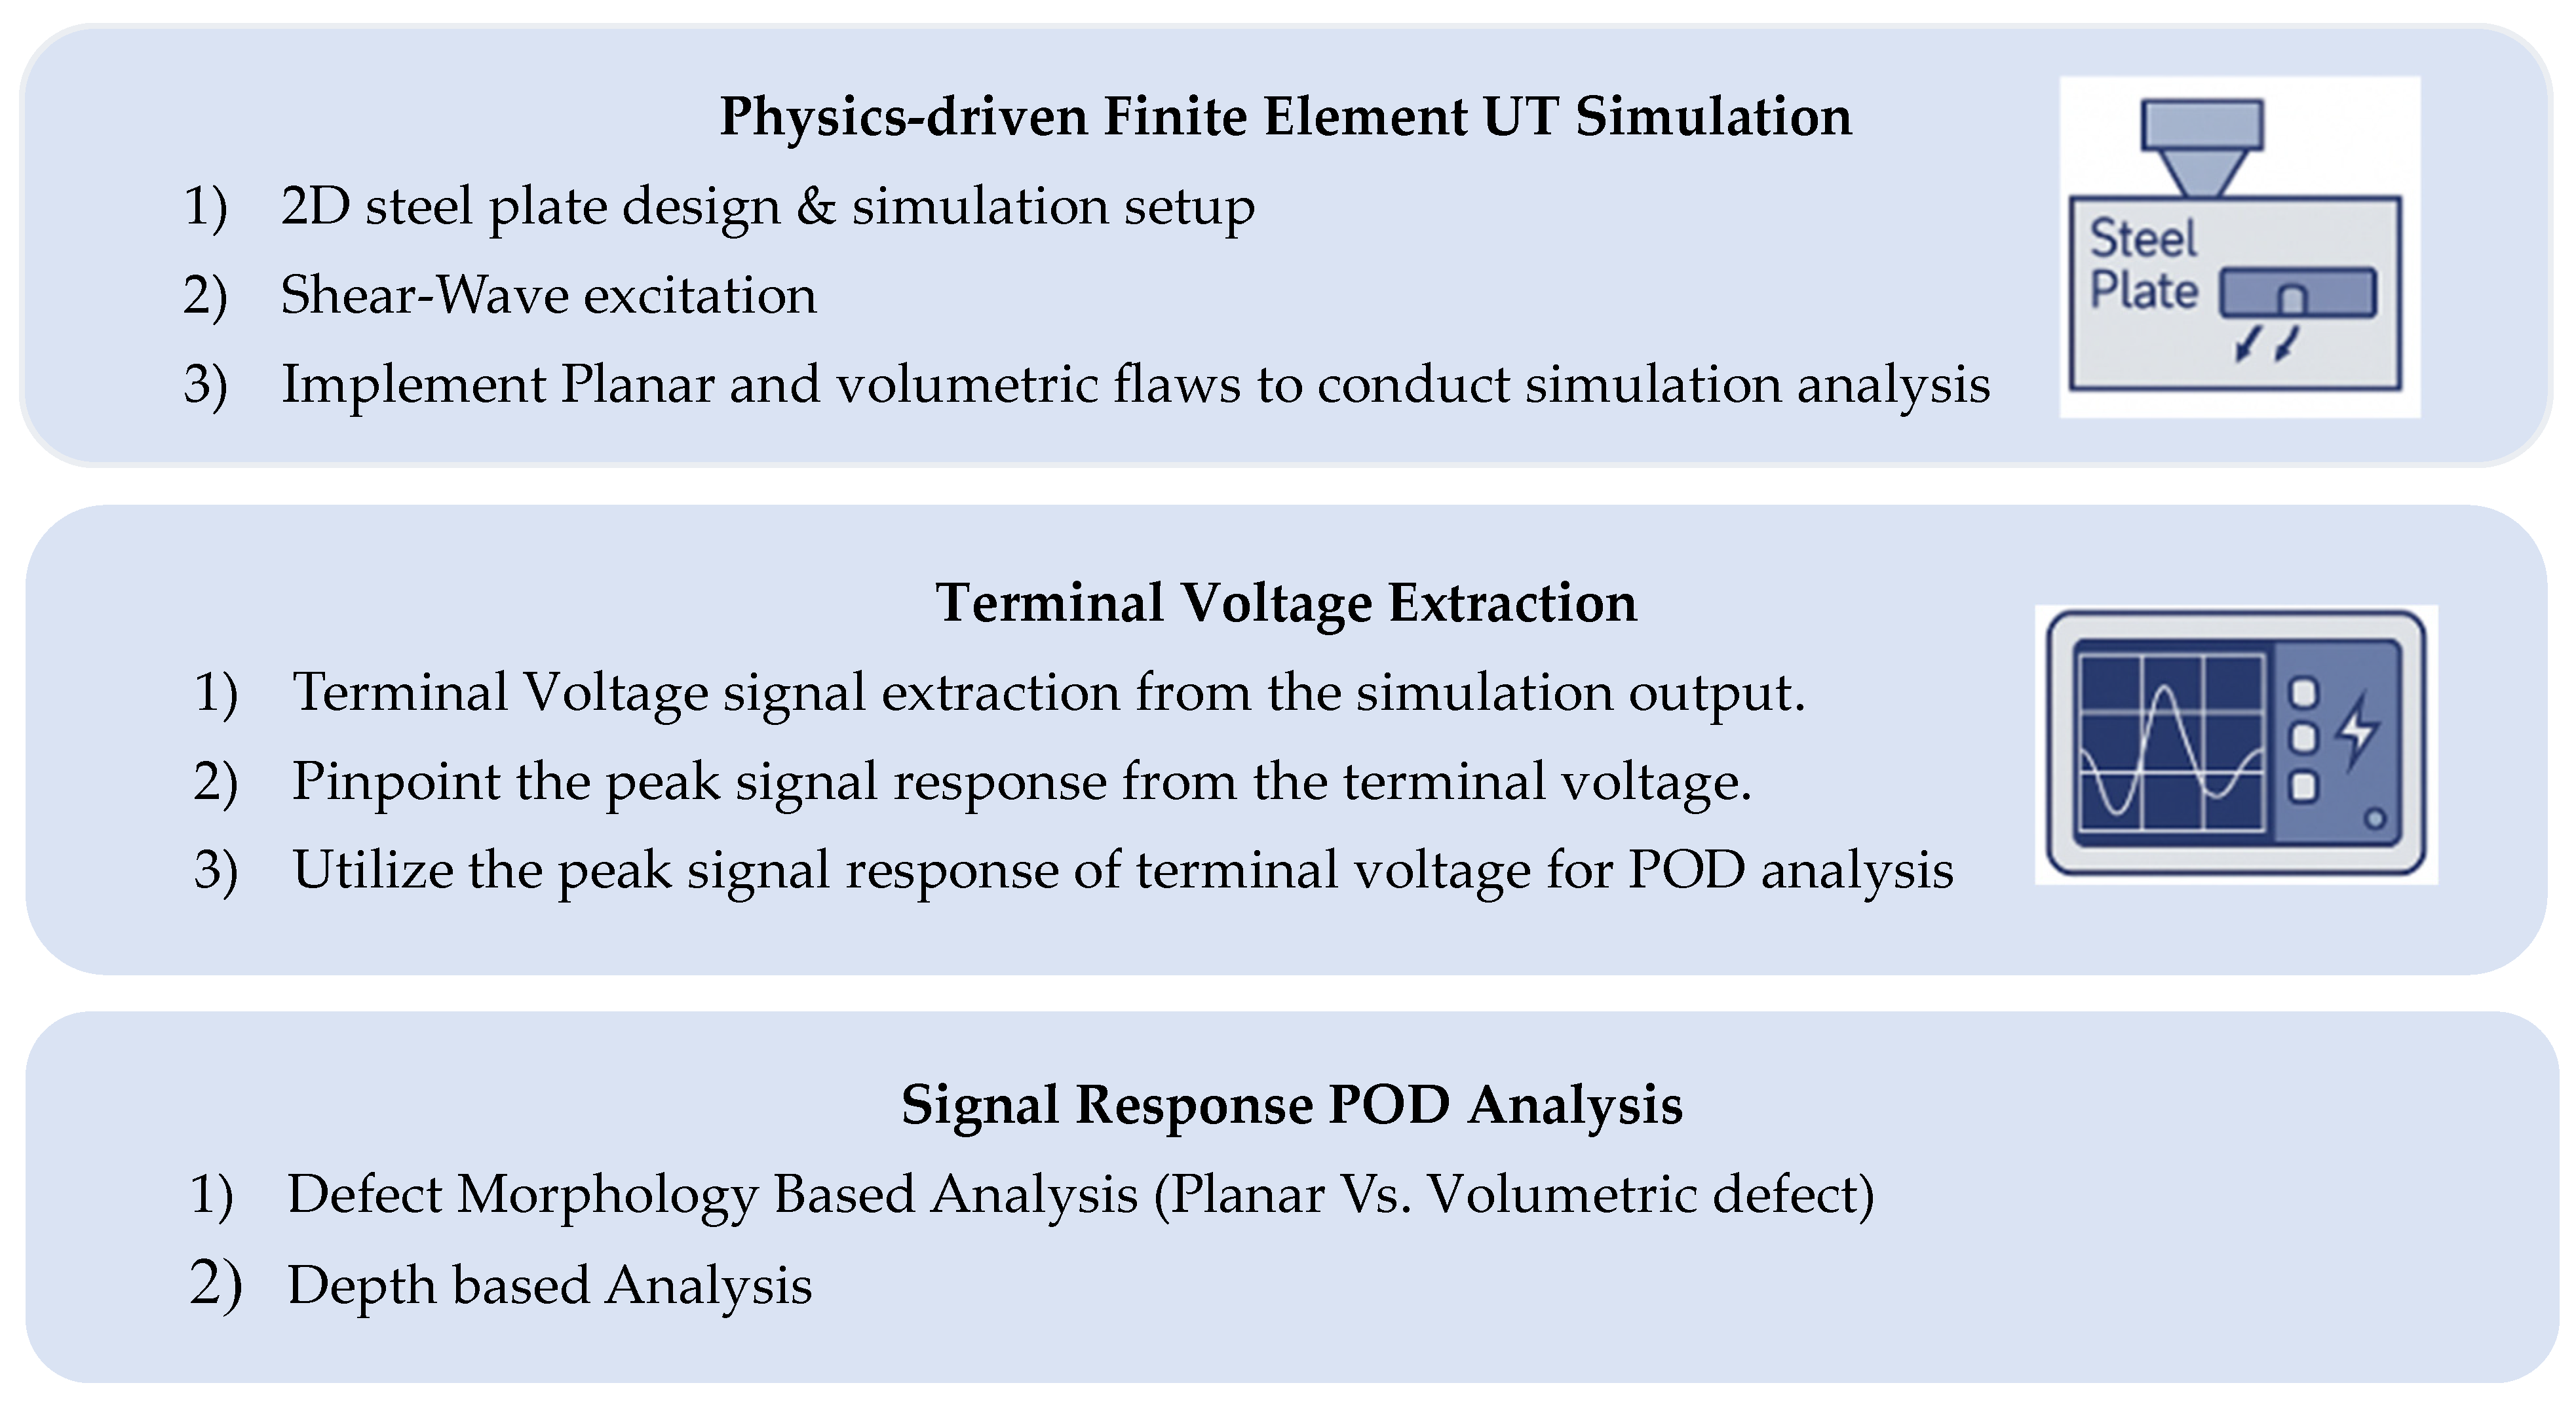
The workflow of the simulation-based POD framework is summarized below in Figure 3.
As illustrated in Figure 3, the simulation-based POD framework is designed to systematically isolate the influence of defect morphology and depth under controlled ultrasonic inspection conditions. The simulation framework resolves shear-wave generation, mode conversion, diffraction, and scattering using material properties, excitation parameters, and boundary treatments consistent with established ultrasonic modeling practices. While the model does not attempt to reproduce absolute inspection, amplitudes observed in field measurements, it is designed to preserve the relative sensitivity of ultrasonic response to defect morphology, size, and depth under identical inspection conditions. This approach enables isolation of first-order detectability trends that are otherwise difficult to decouple experimentally due to noise, material variability, and operator-dependent effects.

3. Results

3.1. Ultrasonic Wave–Defect Interactions Based on Defect Morphology

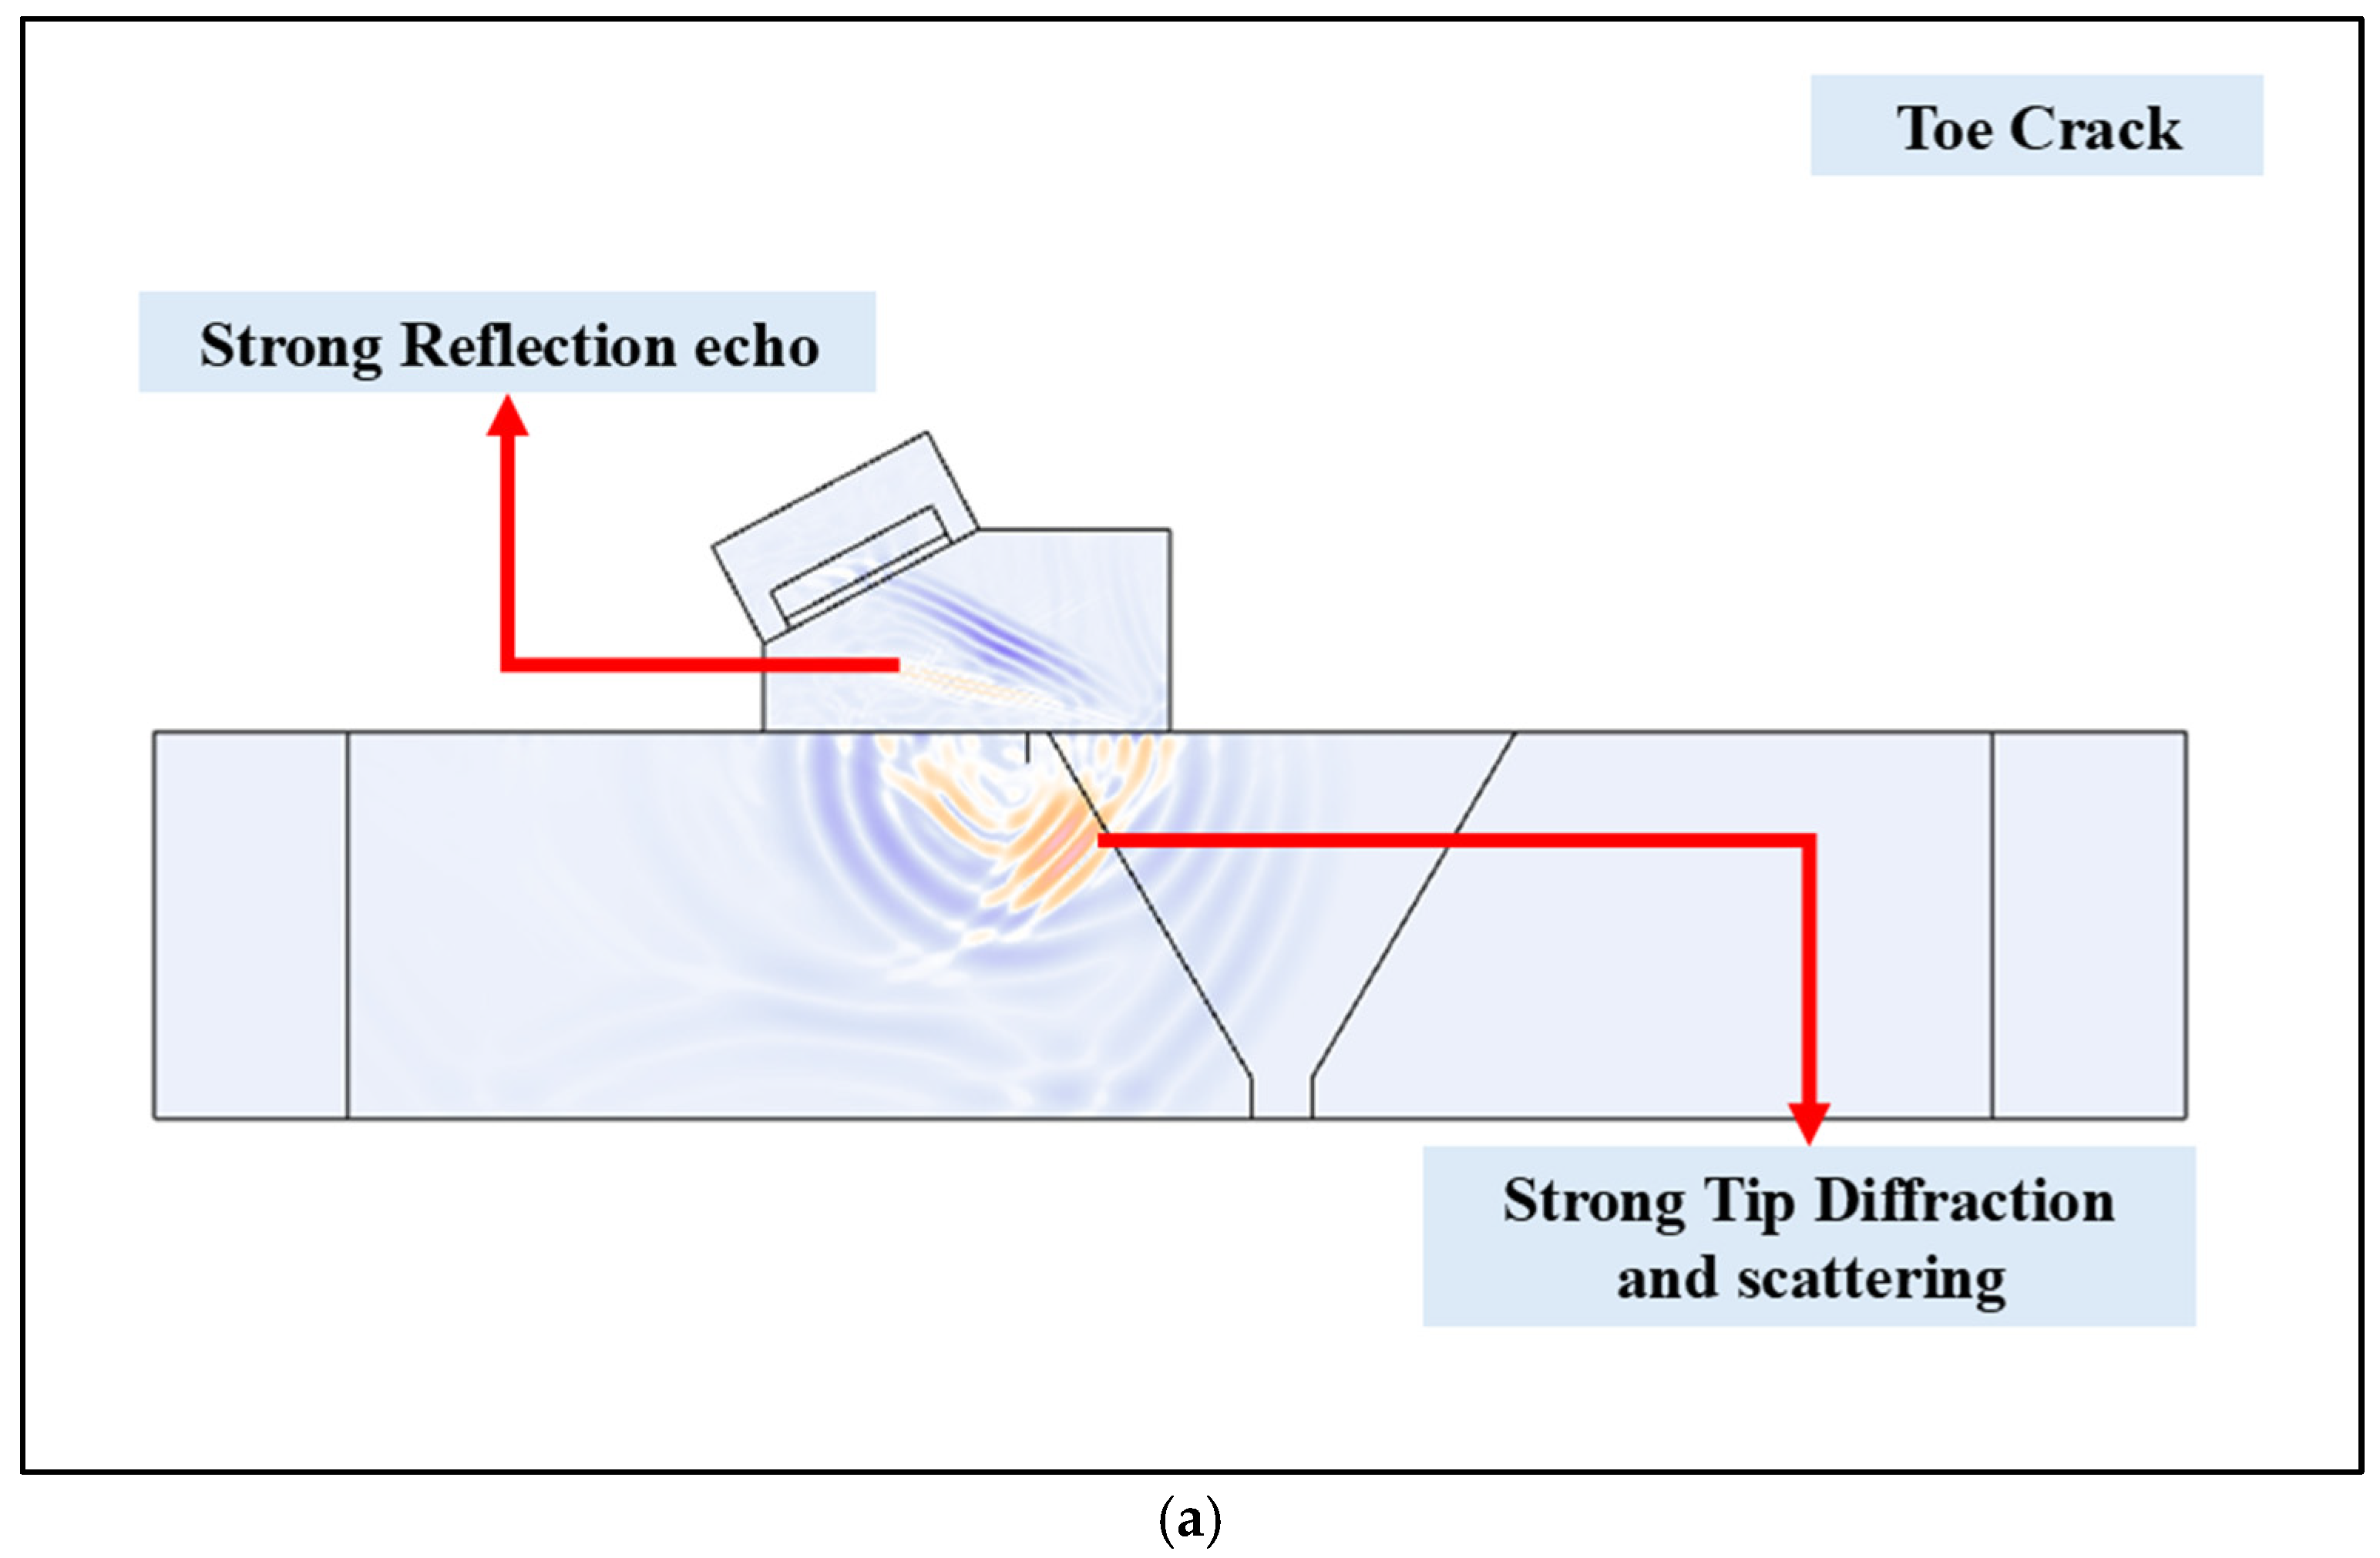
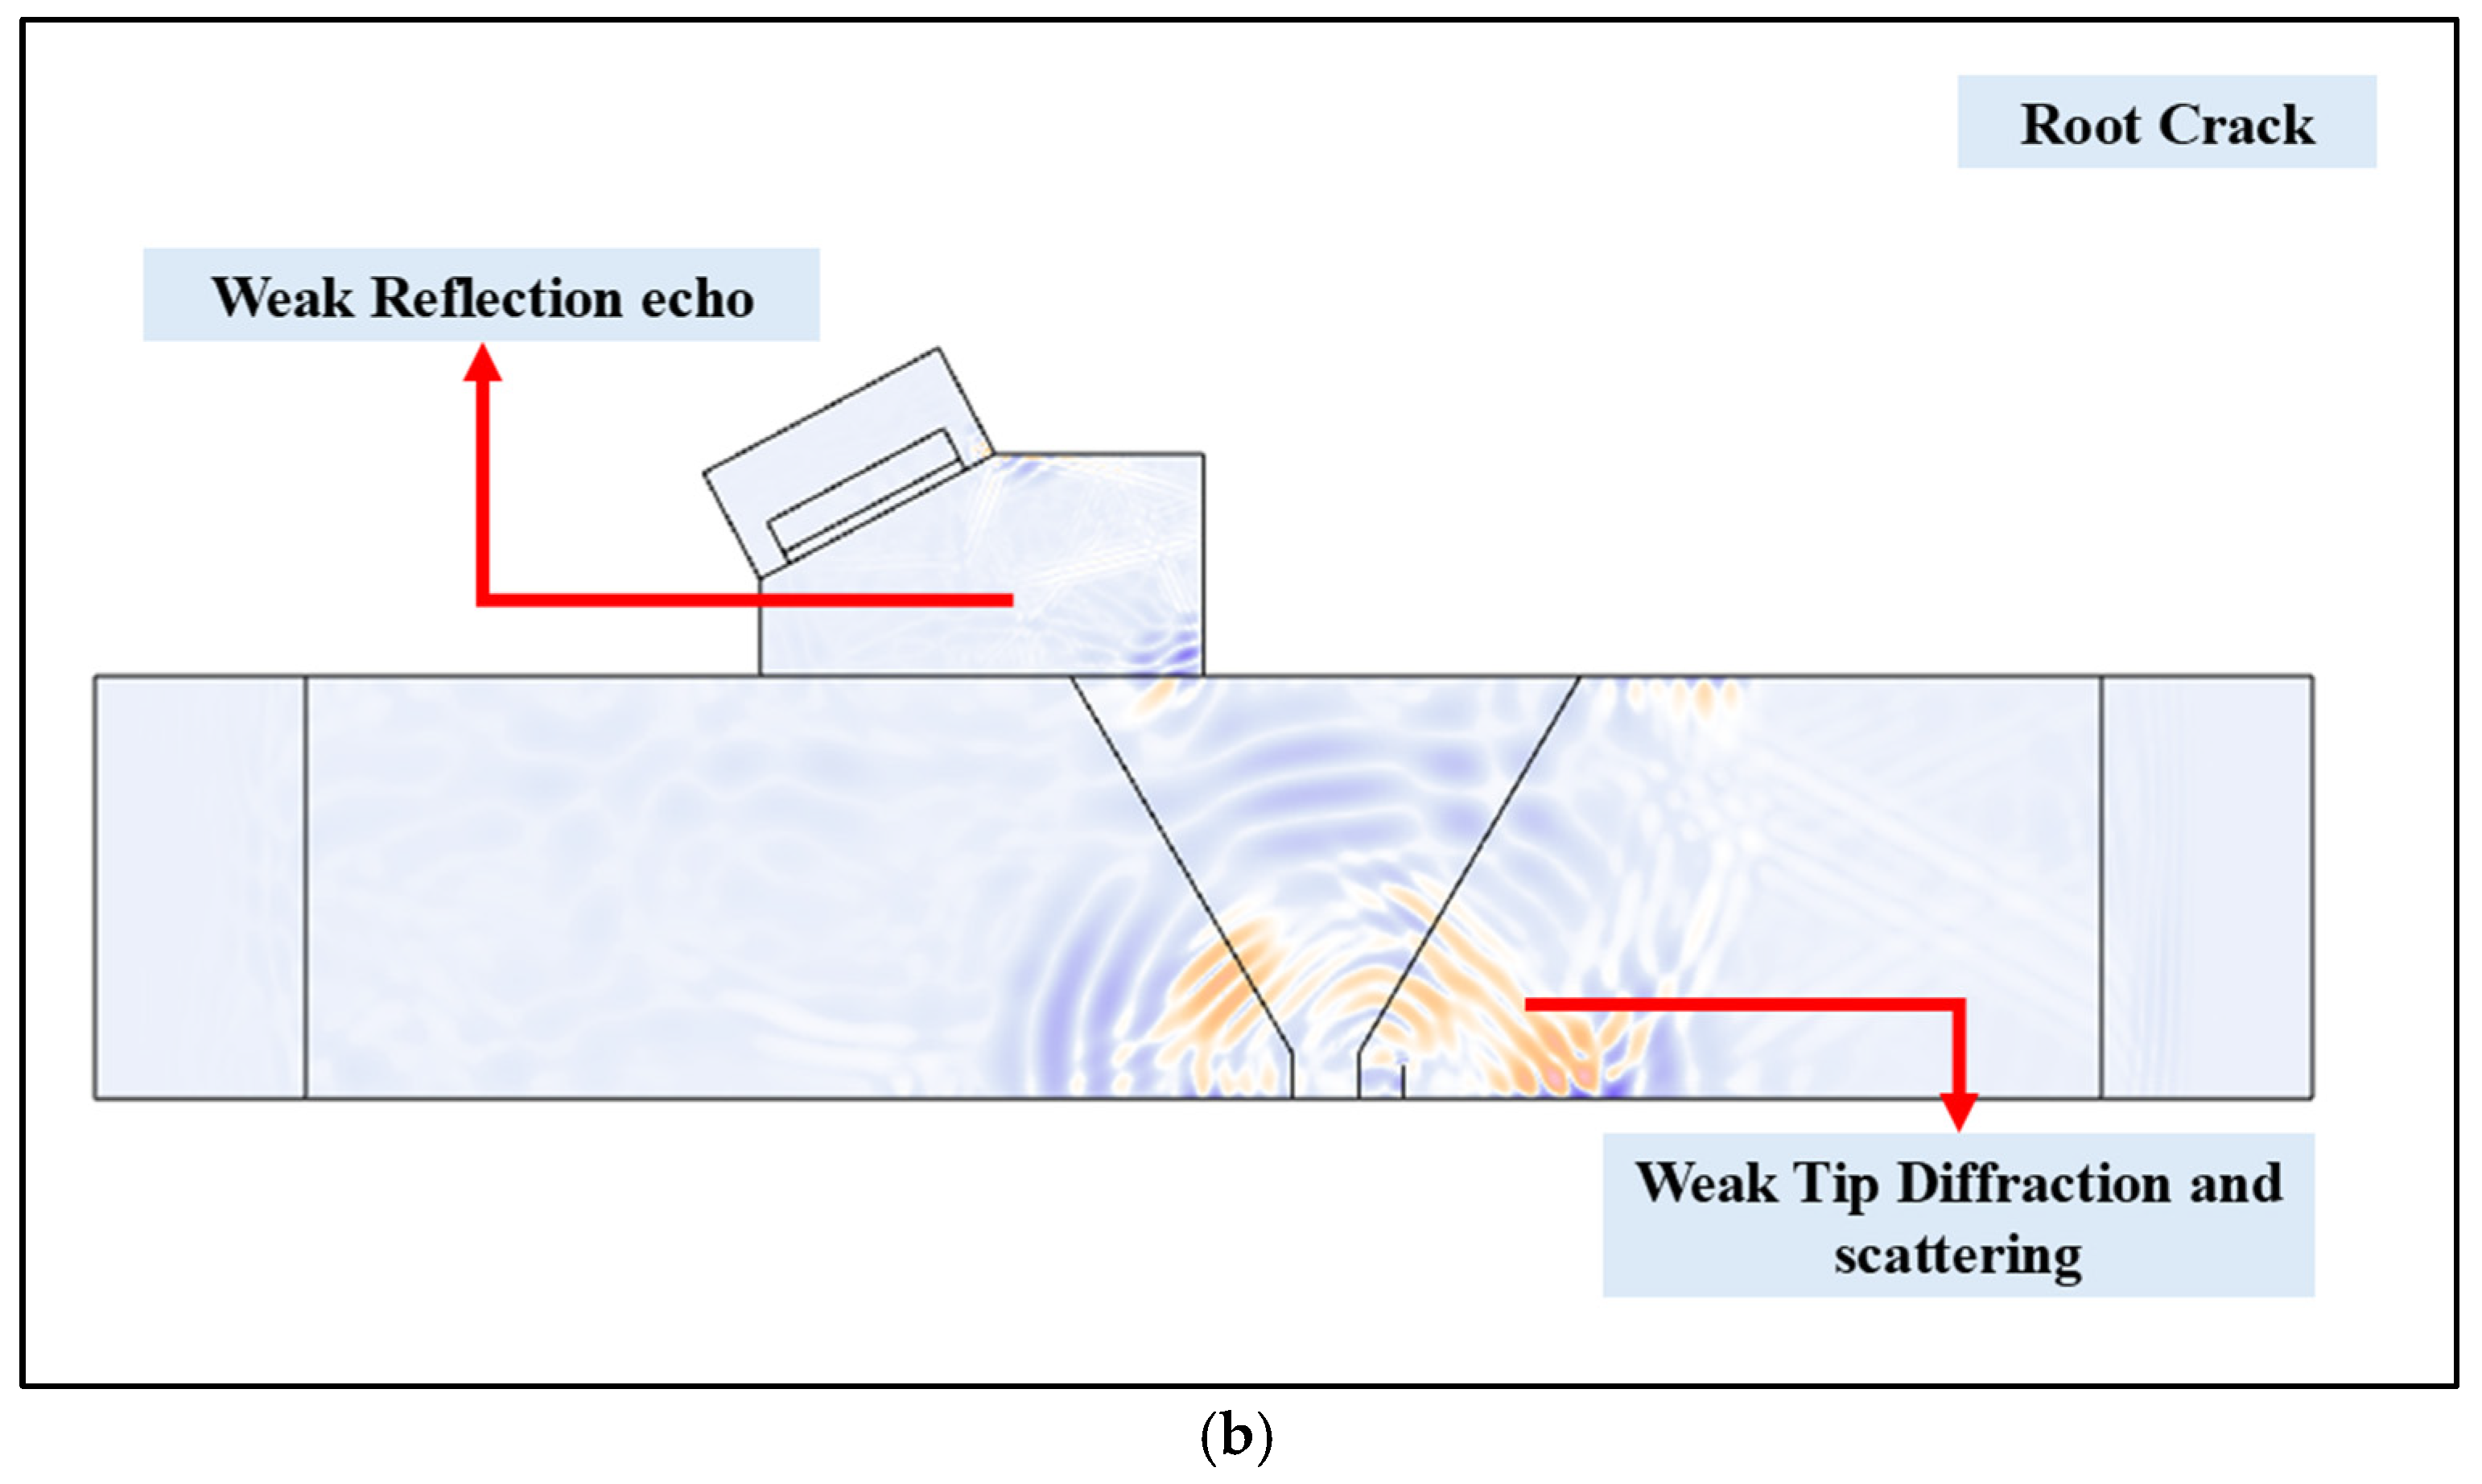
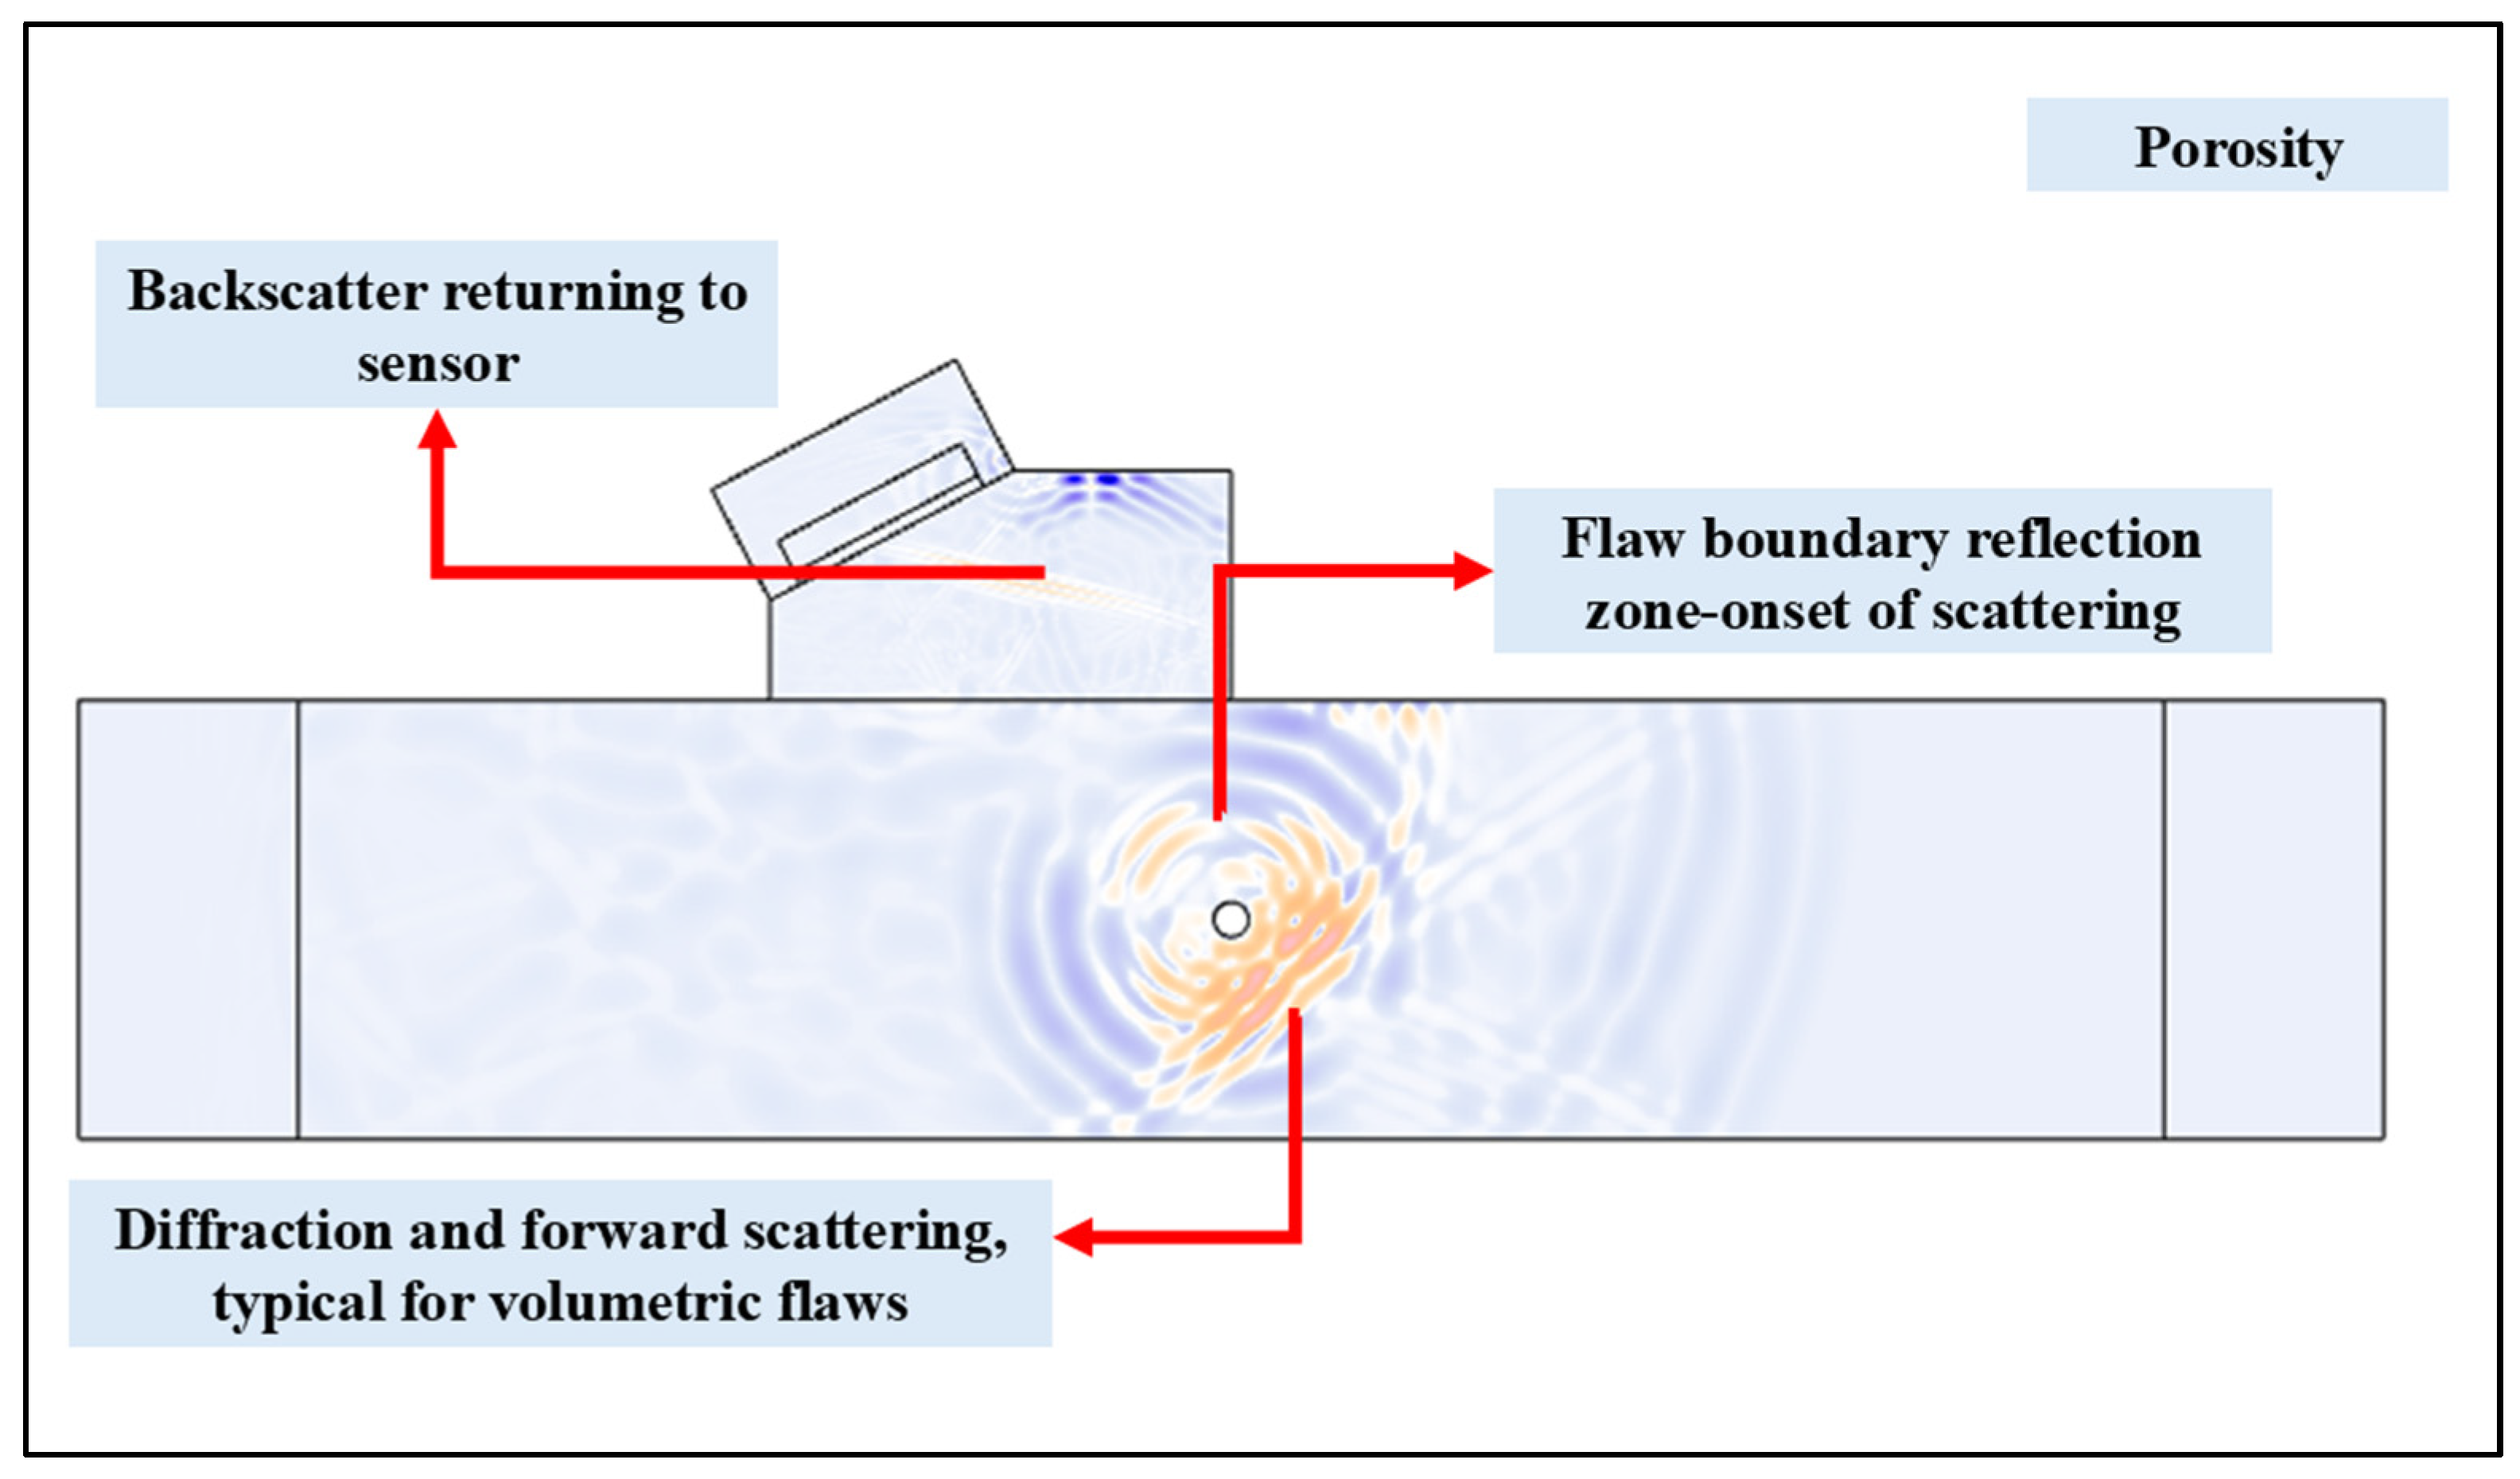
Figure 4 and Figure 5 show the simulated ultrasonic wavefields for representative 1.5 mm planar and volumetric defects, including toe crack, root cracks, and porosity. Distinct wave-defect interaction mechanisms are observed depending on defect type.
For Planar defects such as toe and root cracks (Figure 4), the ultrasonic response is dominated by directional tip diffraction and scattering mechanisms. In the toe crack cases, the shear wave interacts with the shallow, surface-breaking planar cracks and produces strong localized diffraction at crack tips and a concentrated backscatter wavefield. This results in a highly directional energy return towards the transducers, which is consistent with classical diffraction-based detection behavior for surface-breaking cracks. The localized nature of this interaction leads to a pronounced, time-localized response associated with the crack tip.
The root crack (Figure 4), which is located deeper within the plate, shows a similar planar scattering mechanism but with additional depth-related attenuation and phase scattering. Although the tip of the crack still acts as a dominant scattering source, the increased propagation distance and angular interaction with the incident beam reduce the spatial concentration of the reflected wavefield. Nevertheless, the response remains primarily governed by tip diffraction, rather than scattering like volumetric defects, which highlights the characteristic behavior of planar defects.
In terms of volumetric defects, such as porosity (Figure 5), the ultrasonic wave behaves fundamentally differently. For volumetric types of flaws, instead of producing a single dominant scattering point, the ultrasonic wave interacts with the porosity as a distributed three-dimensional scatter, which results in energy redistribution over a broader spatial region. The wavefield associated with porosity is characterized by lower directional coherence and reduced specular reflection, which results in scattered waves occurring over multiple angles. Because of that, the reflected energy is more diffused compared to planar flaws.
These findings clearly demonstrate that defect type governs ultrasonic detectability through fundamentally different physical mechanisms. Planar defects such as toe and root cracks produce strong localized diffraction-dominated responses, whereas volumetric defects such as porosity generate spatially distributed scattering with reduced directional sensitivity.

3.2. Influence of Defect Depth on Ultrasonic Wave–Defect Interactions (Planar Defects)

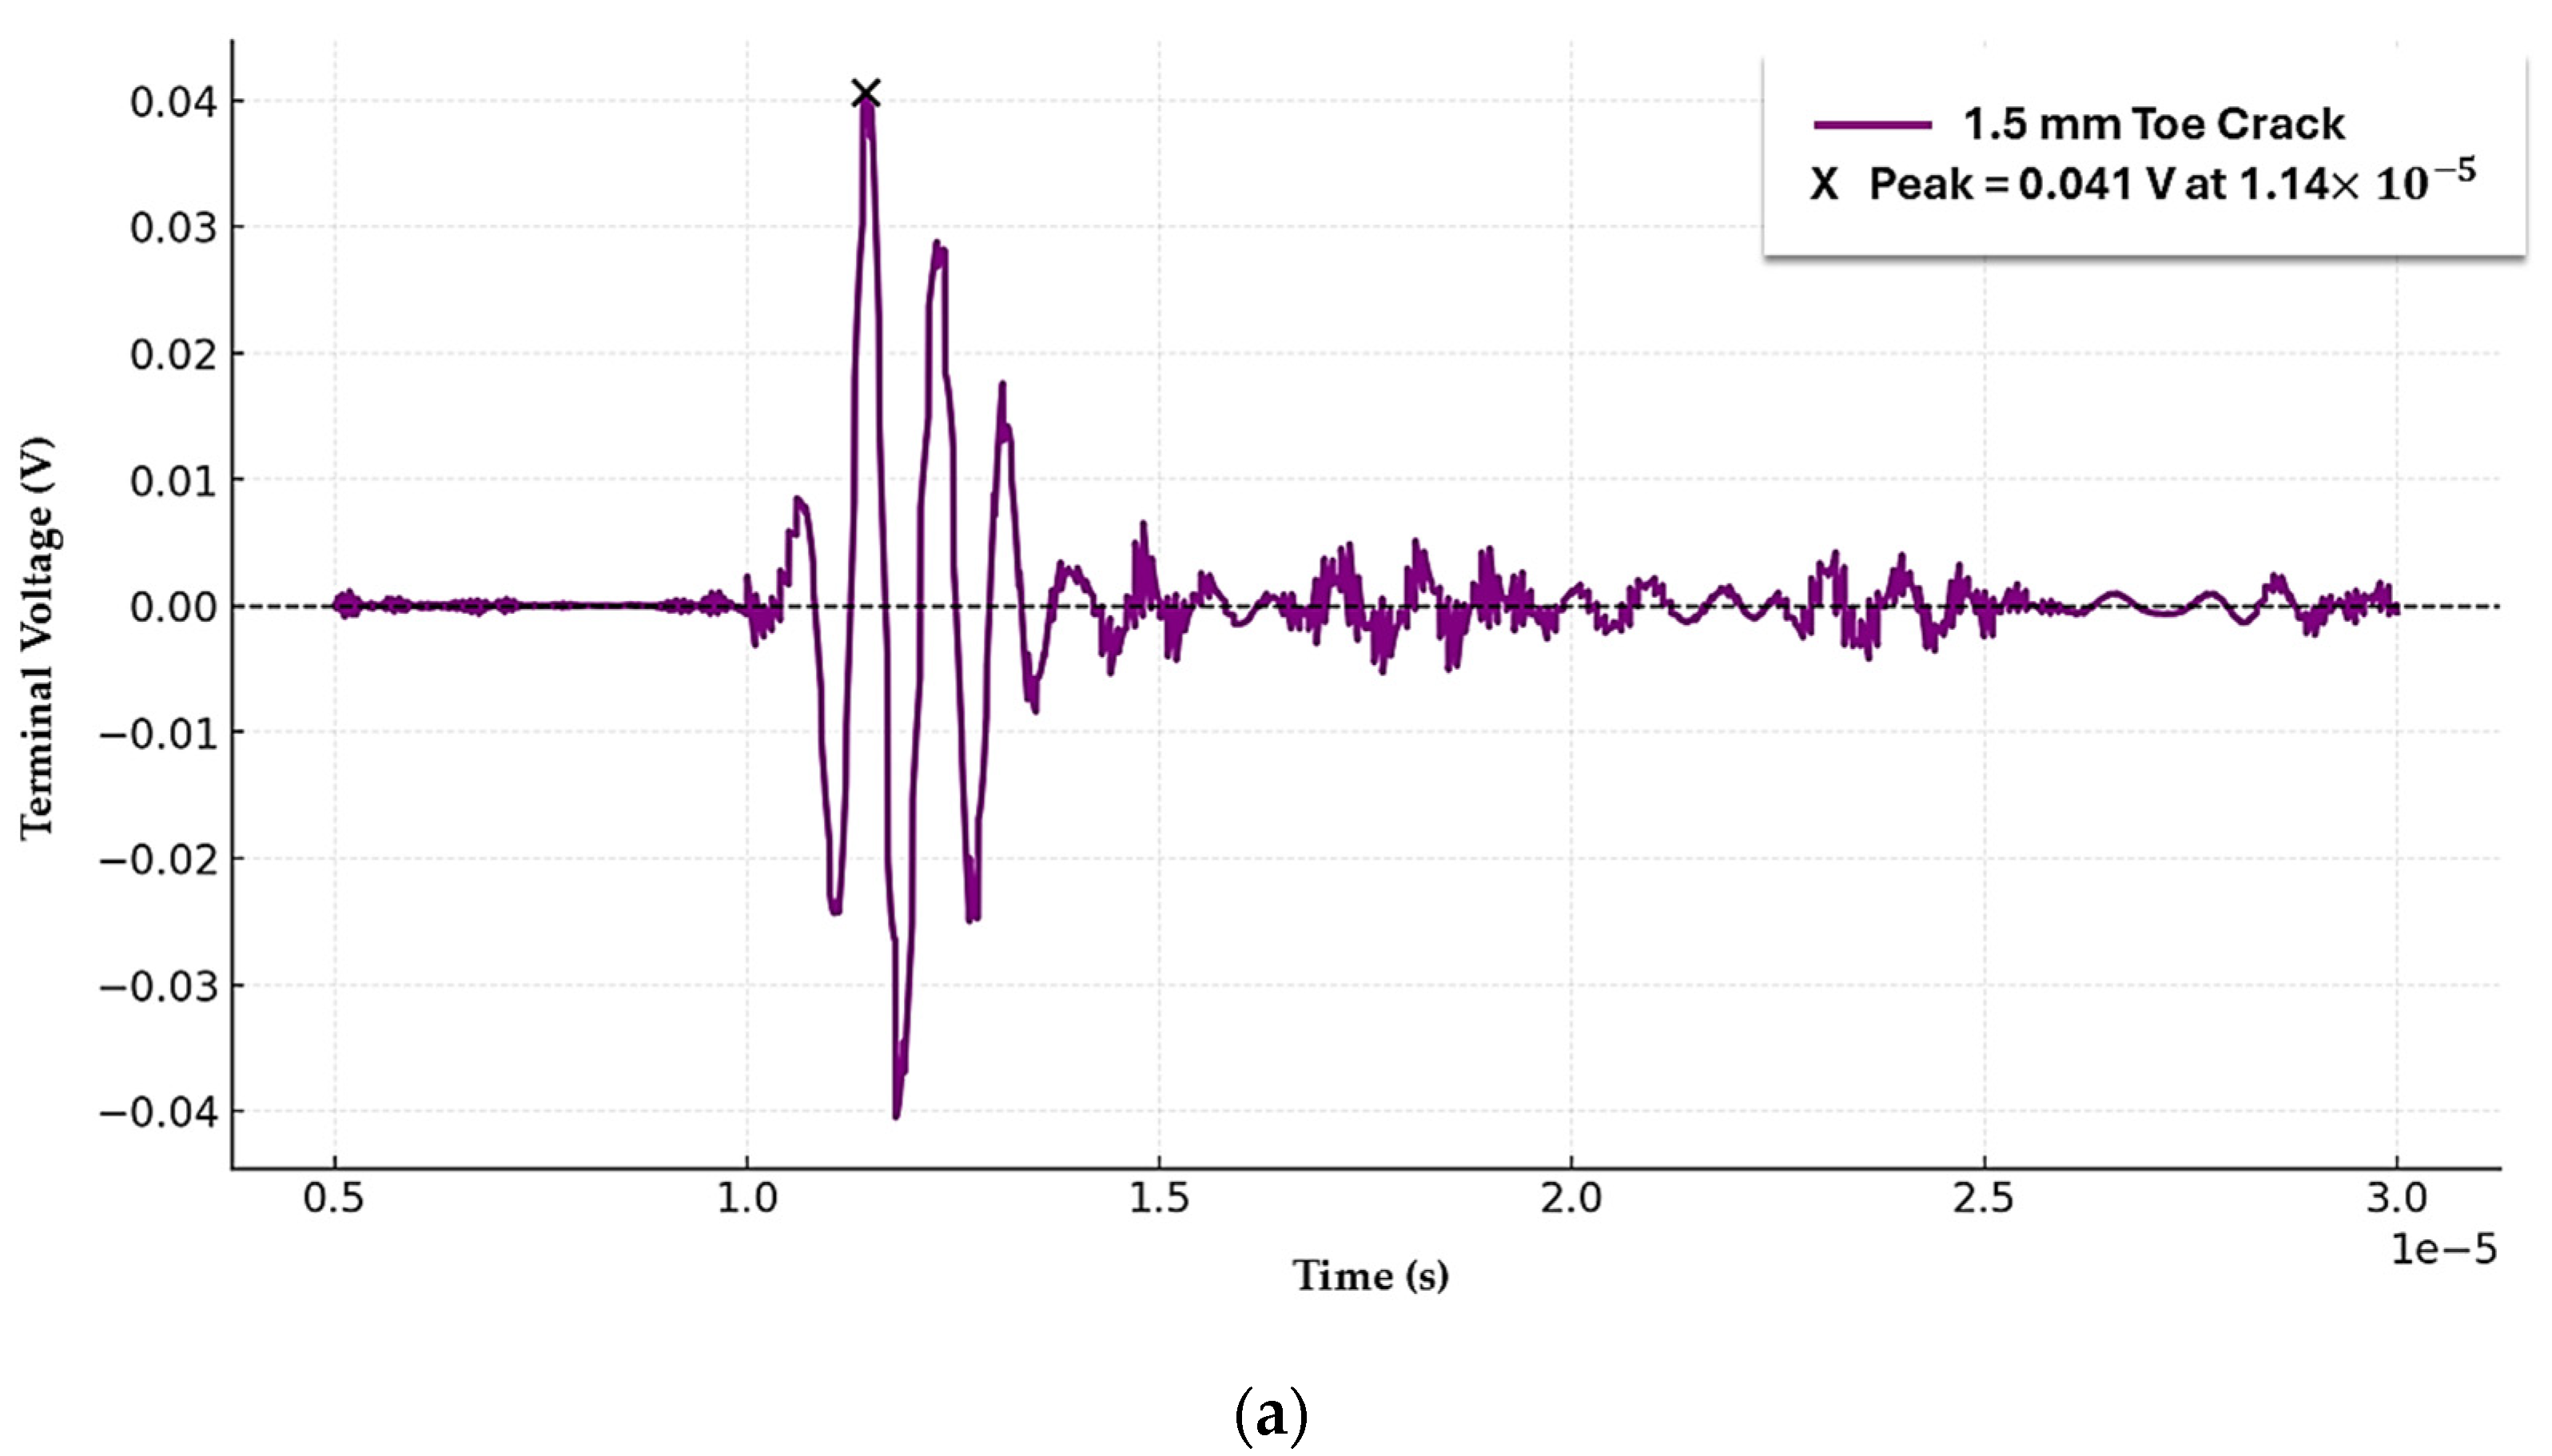
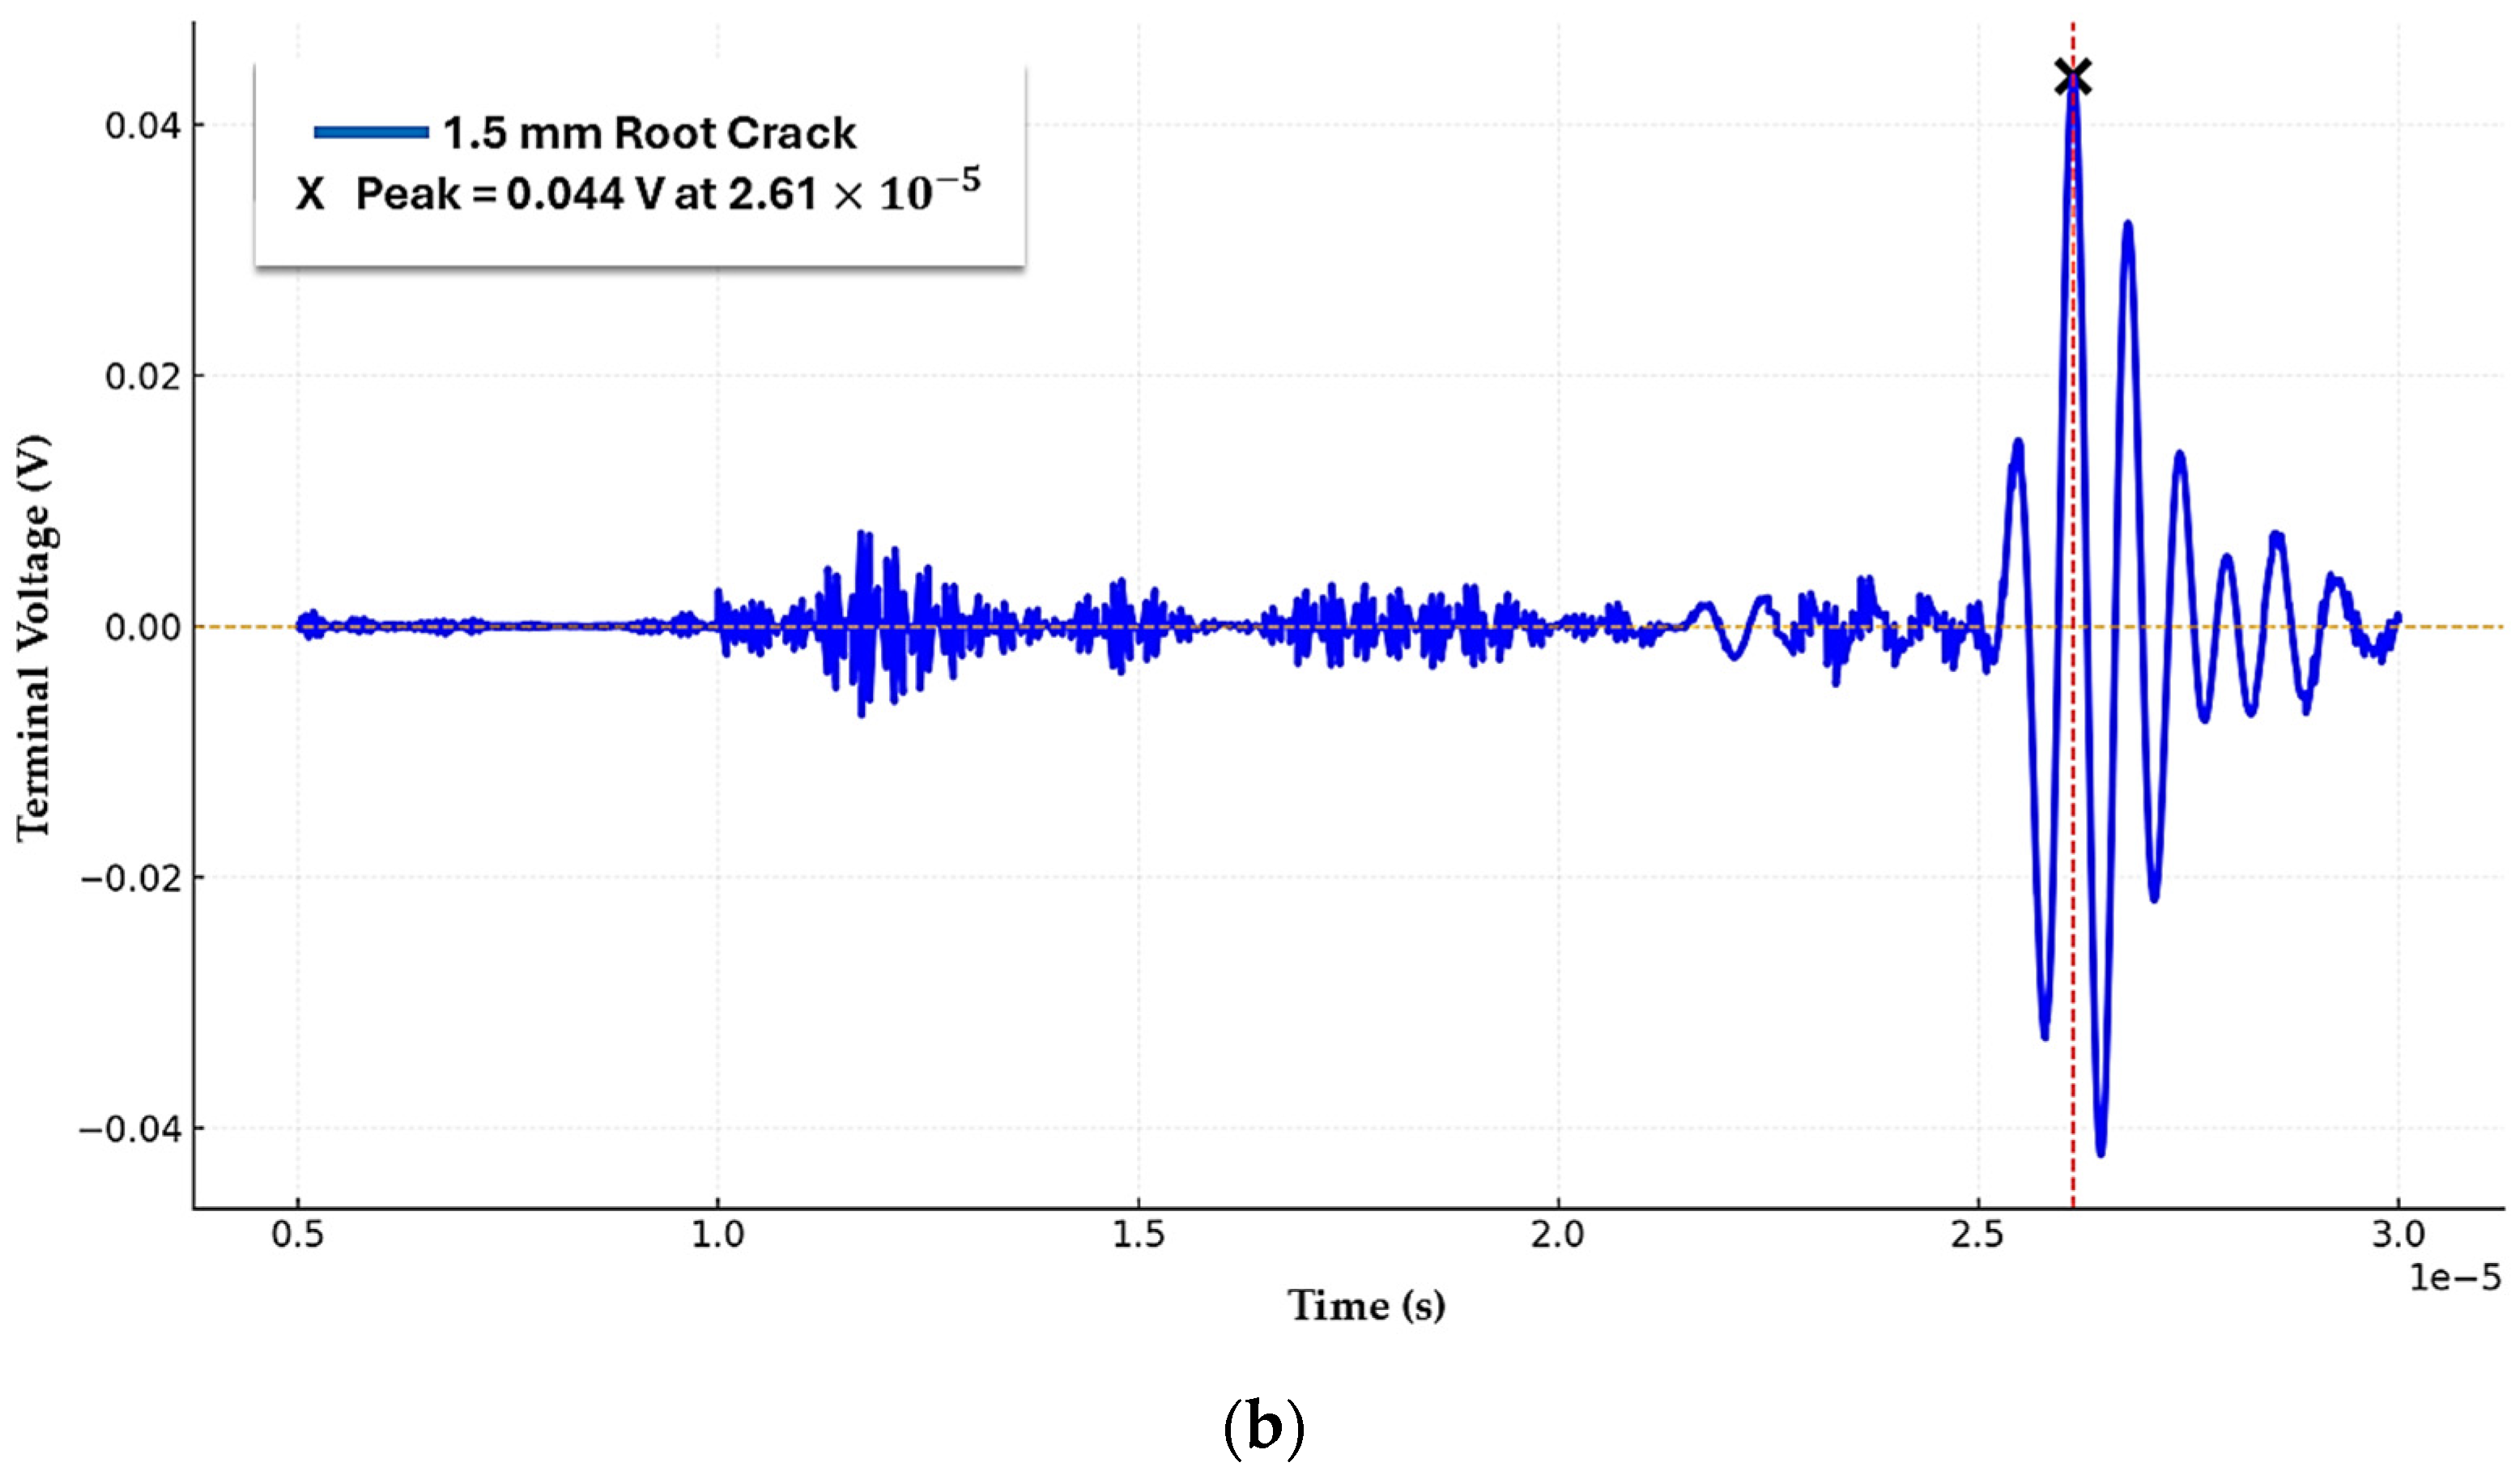
Figure 6 illustrates the terminal voltage signals obtained from 1.5 mm toe and root cracks at different depths. For the toe crack located at a shallower depth, the ultrasonic response is dominated by a strong tip diffraction and specular reflection, which results in a high-amplitude transient in the received signal. The difference waveform exhibits a terminal voltage of 0.041 Volt, which occurs at an earlier arrival time because of the shorter propagation path between the transducer and defect.
Compared to that, the root crack is positioned at a deeper depth, and that produces a delayed but distinct ultrasonic response. The peak terminal voltage difference reaches approximately 0.044 Volt, but with a noticeable shift corresponding to increased wave travel distance and attenuation through the plate thickness. The deeper crack generates a more extended oscillatory response following the primary peak, reflecting multiple diffraction and mode-converted wave components interacting with the crack tip and adjacent boundaries.
The comparison between the toe and root crack highlights a clear depth-dependent effect on planar defect detectability. Although both defects generate strong localized scattering, increasing depth primarily influences arrival time, signal spreading, and post-peak oscillation rather than eliminating detectability. This behavior is consistent with classical ultrasonic theory, where planar flaws act as efficient diffractors, maintaining relatively high response amplitudes even at increased depths.

3.3. Influence of Defect Depth on Ultrasonic Wave–Defect Interaction (Porosity)

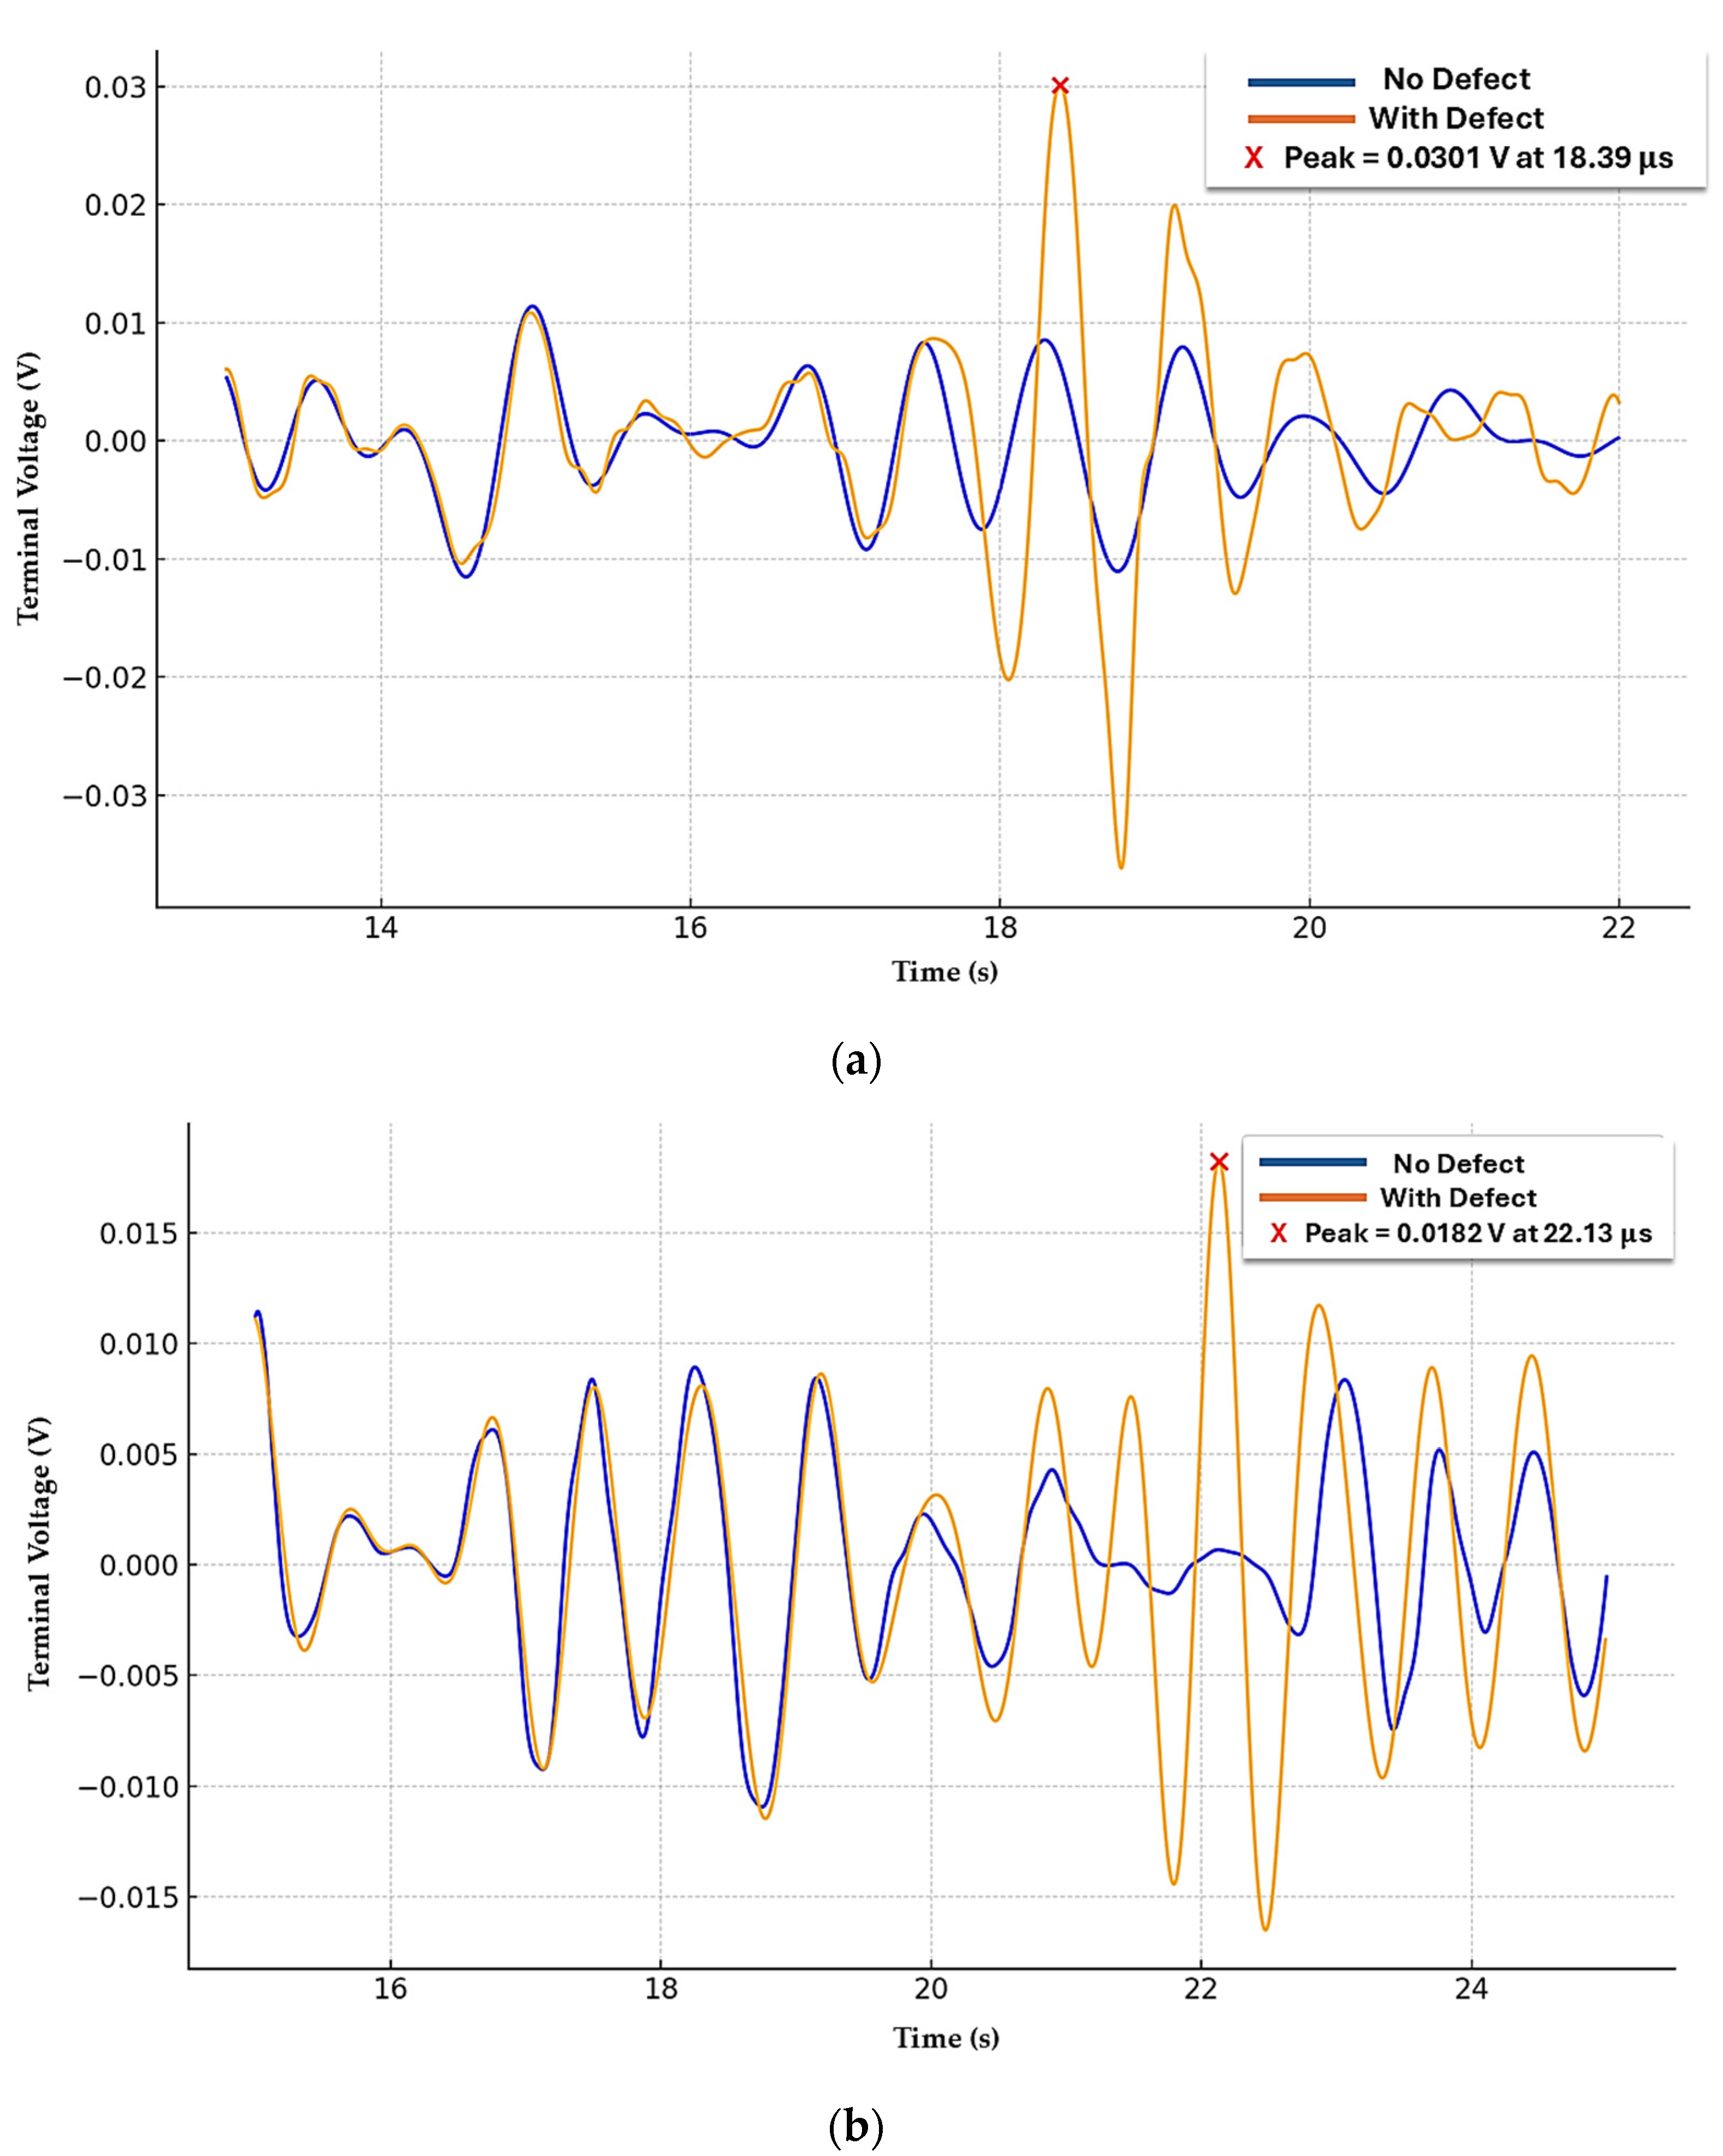
Figure 7 presents the terminal-voltage responses for a 1.5 mm porosity located at different depths. Unlike planar cracks, porosity exhibits a fundamentally different interaction regime characterized by distributed volumetric scattering rather than discrete tip diffraction. At the shallower depth, the presence of porosity leads to a measurable but comparatively smoother deviation from the no-defect signal, with a peak terminal-voltage difference of approximately 0.030 V.
When the porosity moved to greater depth, the ultrasonic response became further attenuated and temporally broadened. In this case, the peak terminal voltage reduces to 0.018 V, and the waveform shows more diffuse energy distributed rather than a sharp transient. This reduction reflects the combined effects of geometric spreading, material attenuation, and reduced backscattered energy density associated with volumetric defects. Compared to cracks, porosity does not provide a dominant reflecting surface, which causes the scattered energy to be distributed over a wider angular range and results in a lower peak terminal voltage response.
The depth-dependent comparison for porosity demonstrates that volumetric flaws are significantly more sensitive to depth than planar flaws. Increasing depth leads to a pronounced reduction in peak terminal voltage and overall signal contrast relative to the baseline, directly impacting detectability under identical inspection conditions.

3.4. Probability of Detection Analysis

3.4.1. Defect Morphology-Based POD Analysis

The effectiveness of ultrasonic wave interaction with different defect types was quantified using a signal-response Probability of Detection (POD) framework. A total of 12 data points were analyzed to conduct regression analysis in Minitab software (Version 21). Table 3 summarizes the input datapoints for defect morphology-based POD analysis.
The resulting regression equations indicate that, for a given defect size, planar defects produce systematically higher terminal voltage responses compared to volumetric defects. The regression relationships were the following:
  • Planar defects
Vpeak = 0.03293 + 0.00363·(Defect Size).
  • Volumetric defects:
Vpeak = 0.02318 + 0.00363·(Defect Size).
The identical coefficient (0.00363) for both defect types indicates that terminal voltage increases monotonically with defect size regardless of defect type. However, the negative coefficient associated with volumetric defects (−0.00975 V relative to planar defects) (Table 4) demonstrates a consistent reduction in signal strength for volumetric flaws at equivalent sizes. This offset reflects fundamental differences in ultrasonic wave-defect interaction mechanisms.
The ANOVA results confirm the dominant influence of defect morphology on signal response. Morphology accounts for a larger portion of explained variance (Adj SS = 2.85 × 10⁻⁴) than defect size (Adj SS = 1.84 × 10⁻⁴) (Table 4), indicating that flaw type governs detectability more strongly than size within the investigated range. Although the morphology term does not reach the 0.05 significance threshold (p = 0.073), the observed trend is meaningful given the limited dataset and the exploratory, simulation-based nature of the analysis.
In order to calculate the a90 by using the output of the regression analysis, Equation (1) is utilized by modifying it. The modified equation is as follows:
a 90 = T +   z 90 σ α 0 α 1
where
For volumetric flaws:
α 1 = r e g r e s s i o n   s l o p e = 0.00363 ;
a 0 = regression intercept = 0.02318.
For planar Flaws:
α 1 = r e g r e s s i o n   s l o p e = 0.00363 ;
a 0 = regression intercept = 0.03293;
Z 90 = 1.2816;
σ = s t a n d a r d   e r r o r   o f   r e g r e s s i o n = 0.0083246 V;
T = terminal voltage threshold.
The terminal-voltage detection threshold was defined using the defect-free (reference) simulation in order to establish a conservative decision criterion independent of defect responses. Terminal-voltage data were extracted from the no-defect simulation within the same 3 µs analysis window used for defect evaluation. The reference signal exhibited an RMS voltage of 0.00627 V and a maximum absolute background fluctuation of 0.02138 V within this window. The detection threshold was therefore selected as the smallest conservative value exceeding the maximum observed reference fluctuation, ensuring that detected responses are attributable to defect-induced scattering rather than background wave propagation or numerical artifacts. For the present simulation configuration, this corresponds to a nominal threshold of T = 0.033 V, which is approximately 5.33× the reference RMS level. This threshold was subsequently used for signal-response POD and a90 calculations.
So, the calculated a 90  values for planar and volumetric defects are the following:
  • Planar a 90
a 90 = 0.033 + 0.01067 0.03293 0.00363 = 2.96   mm
  • Volumetric a 90
a 90 = 0.033 + 0.01067 0.02318 0.00363 = 5.64   mm
The lower a90 value for planar flaws reflects their stronger and more coherent ultrasonic backscatter, driven by specular reflection and edge-diffraction mechanisms that efficiently couple energy back into the transducer. In contrast, volumetric flaws exhibit distributed scattering and reduced coherent back-reflection, requiring larger flaw sizes to achieve equivalent detection probability. These results quantitatively confirm the morphology-dependent detectability trends observed in the simulated terminal-voltage responses and demonstrate the capability of the simulation-based signal-response POD framework to distinguish fundamental differences in ultrasonic interaction behavior between planar and volumetric weld defects.
Sensitivity Analysis of POD with Respect to Detection Threshold
While a nominal-voltage threshold T 0 = 0.033   V was defined from the defect-free reference response and used to compute the characteristic detection sizes reported in Section 3.4.1, the signal-response POD formulation inherently depends on the selected detection threshold. As shown in Table 3, the peak terminal voltage exhibits a monotonic increase with defect size for both planar and volumetric flaw families, providing a consistent physical basis for applying a signal-response POD model and evaluating the robustness of the derived detectability metrics to threshold selection. Accordingly, a threshold sensitivity analysis was performed to assess whether the morphology-dependent conclusions are sensitive to the specific choice of T . The detection threshold was systematically varied relative to the reference RMS voltage V r m s , r e f = 0.00627   V , using thresholds defined as T = kVrms,ref, where the value of K is 4, 5.3, 6, and 7, which span a reasonable range from minimally conservative to highly conservative decision levels above the reference noise. For each threshold level, the same regression parameters ( α 0 , α 1 , and σ ) obtained in Section 3.4.1 were retained, and the characteristic detection size a 90 was recomputed using Equation (2) for both planar and volumetric defect classes, which is summarized in Table 5 below.
As expected from the analytical form of the signal-response POD model, increasing the detection threshold leads to a monotonic increase in the characteristic detection size a 90 for both defect morphologies, reflecting the higher signal amplitude required to achieve a fixed Probability of Detection. At relatively permissive threshold levels (e.g., T = 4 V r m s , r e f ), the model predicts very small a 90 values for planar defects, implying near-certain detection at modest flaw dimensions. While mathematically consistent, such behavior indicates that thresholds set too close to baseline signal fluctuations may overestimate practical detectability. This observation motivates the adoption of conservative, reference-based thresholds that exceed background variability and numerical noise.
Importantly, across the entire examined threshold range, the relative separation between planar and volumetric defects remains intact. Planar defects consistently exhibit lower a 90 values than volumetric defects, confirming that the dominant morphology-dependent detectability trends identified in Section 3.4.1 are robust to reasonable variations in detection threshold selection. The nominal threshold T 0 = 0.033   V   therefore represents a conservative and physically meaningful decision level, while the primary conclusions of the morphology-based POD analysis do not depend on the specific choice of this value.

3.4.2. Depth-Wise POD Analysis (Planar Defects)

In order to assess the ultrasonic wave interaction based on defect depth, a signal-response POD analysis was conducted. A total of 6 defect datapoints were considered to conduct this analysis. Table 6 summarizes the input variables for depth-wise POD analysis for planar defects.
The regression equation from the POD analysis is as follows:
Peak Terminal Voltage = 0.03900 + 0.0 Zone 01 + 0.0060 Zone 02.
Regression analysis indicated a systematic increase in terminal voltage response for planar flaws. The fitted model predicts a baseline peak terminal voltage of approximately 0.039 V for shallow planar defects (Zone 01), with an additional positive offset of 0.006 V associated with deeper defects in Zone 02. This trend is reflected in the measured responses, where root cracks at greater depths consistently produce higher peak terminal voltages than toe cracks of comparable size.
The ANOVA results support the statistical relevance of depth as a governing factor. The depth-zone term explains a substantial portion of the observed variance (R2 = 64.3%), and although the p-value for the zone effect (p = 0.055) (Table 7) is marginally above the conventional 0.05 threshold, it indicates a strong depth-dependent trend given the limited dataset and the deterministic nature of the simulation environment. The absence of lack-of-fit effects further confirms that a linear signal-response formulation adequately captures first-order depth-dependent detectability behavior.
From the output of the regression analysis, Probability of Detection for each depth zone was computed by modifying the Equation (1), which is the following:
P O D = 1   φ T   μ z o n e   σ
where
For Zone 01:
Mean response = μ Z 1   = 0.03900   V .
For Zone 02:
Mean response = μ Z 2 = 0.04500   V ;
Residual standard deviation = σ =   0.0027386   V .
By keeping the same terminal voltage threshold that is used in Section 3.4.1 for Defect Morphology Based analysis, which is T = 0.033 V, the terminal voltage detection threshold was held constant to enable direct comparison with the morphology-based POD results. As demonstrated by the threshold-sensitivity analysis in the Sensitivity Analysis of POD with Respect to Detection Threshold section, the relative POD trends are not sensitive to moderate variations in the threshold, and therefore, no additional sensitivity analysis is required for the depth-wise evaluation.
So, the value of the signal-response POD is the following:
  • For Zone 01:
P O D = 1 φ 0.033 0.039 0.0027386 = 0.986 .
  • For Zone 02:
P O D = 1 φ 0.033 0.045 0.0027386 = 0.999 .
Overall, the depth-wise signal-response POD analysis for planar defects indicates that inspection depth has a measurable influence on ultrasonic response strength under the simulated conditions. Planar defects located in the deeper inspection zone (Zone 02) exhibited a systematic increase in mean terminal voltage relative to shallower defects (Zone 01), resulting in a slightly higher Probability of Detection at a fixed voltage threshold. Although the zone effect approaches but does not reach conventional statistical significance (p = 0.055), the observed trend is physically consistent with depth-dependent wave-defect interaction and reflection geometry in shear-wave inspection. These results demonstrate that, even under idealized simulation conditions, defect depth contributes to detectability variations for planar flaws and should be explicitly considered when interpreting POD trends derived from ultrasonic signal-response metrics.

3.4.3. Depth-Wise POD Analysis (Volumetric Defects)

For volumetric flaws, a similar depth-based POD analysis was performed. The data points that were considered in this case are summarized in Table 8 below.
The regression equation output from the analysis is the following:
Peak Terminal Voltage = 0.03913 + 0.0 Zone 01 − 0.0180 Zone 02.
where the intercept represents the mean peak terminal voltage response for porosity located in the shallow reference depth zone, and the zone coefficients quantify relative changes in signal amplitude associated with increasing inspection depth.
The regression equation indicates a systematic reduction in peak terminal voltage with increasing depth for volumetric defects. Compared to shallow porosity, deeper porosity produces lower terminal voltage responses, consistent with increased beam spreading, attenuation, and distributed scattering effects characteristic of volumetric flaws. Unlike planar reflectors, porosity does not generate strong specular reflections, and its ultrasonic response becomes increasingly diffused as propagation distance increases.
The ANOVA result shows that the depth-zone effect does not reach statistical significance (p = 0.430), and the overall model explains approximately 43% of the observed variance (R2 = 43.04%) (Table 9). While this reflects the limited data set size and the idealized simulation environment, the negative depth coefficients observed in the regression model remain physically meaningful. The relatively large residual variance further highlights the inherently weak and incoherent backscattering behavior of volumetric defects, which reduces sensitivity to depth compared to planar flaws.
In this case, the POD was calculated using a modified form of Equation (1), previously applied for the depth-wise POD analysis of planar defects. For the volumetric defects, the input parameters were defined as follows:
Zone 01:
Mean response = μ Z 1   =   0.03913   V .
Zone 02:
Mean response = μ Z 2   =   0.02113   V ;
Residual standard deviation = σ =   0.0117250   V .
By maintaining the same terminal voltage threshold that is used in Section 3.4.1 for defect morphology-based analysis, which is T = 0.033 V, the signal-response POD is the following:
  • For Zone 1:
P O D = 1 φ 0.033 0.02753 0.0117250 = 0.320 .
  • For Zone 2:
P O D = 1 φ 0.033 0.02113 0.0117250 = 0.156 .
Overall, the depth-wise signal-response POD analysis for volumetric defects reveals a pronounced reduction in detectability with increasing depth, reflected by the decrease in POD from Zone 01 to Zone 02 under a fixed voltage threshold. Although the depth effect is not statistically significant due to the limited dataset and diffuse scattering behavior of porosity, the results highlight the inherently weak and depth-sensitive ultrasonic response of volumetric flaws. This behavior contrasts with planar defects and underscores the importance of morphology-aware POD assessment for realistic weld inspection reliability.
Table 10 summarizes the simulation-based signal-response POD results across all flaw morphologies and depth zones. The table focuses on the relative detectability trends that are observed for planar and volumetric defects under identical inspection and threshold conditions, serving as a compact reference for the overall POD findings of this study.

4. Discussion

The simulation-based signal-response POD analysis demonstrates that defect morphology is the primary driver of ultrasonic detectability, exceeding the influence of nominal defect size within the investigated range. Planar defects consistently generate higher peak terminal voltages than volumetric defects of equivalent size, reflecting fundamentally different wave-defect interaction mechanisms.
Planar flaws exhibited diffraction and specular-reflection-dominated scattering, producing coherent, directionally focused reflections that return to the transducer. This behavior resulted in a systematic positive voltage offset relative to volumetric defects, as quantified by the regression analysis. Although terminal voltage increased monotonically with defect size for both morphologies, the identical size coefficients indicate that size acts as a scaling parameter, while morphology establishes the detectability baseline. This distinction is directly reflected in the POD results, where planar defects achieved a substantially smaller characteristic detection size (a90 = 2.96 mm) compared to volumetric defects (a90 = 5.64 mm).
Depth-dependent analyses further highlight morphology-specific detectability behavior. For planar defects, increasing depth did not degrade detectability; deeper root cracks exhibited comparable or slightly higher peak terminal voltages than shallow toe cracks. This trend is attributed to favorable reflection geometry and beam-flaw alignment rather than attenuation-dominated effects. The depth-zone regression explained a significant portion of the variance (R2 ≈ 64%), confirming that depth modifies planar defect response primarily through interaction geometry.
In contrast, volumetric defects showed a pronounced reduction in peak terminal voltage and POD with increasing depth. The distributed scattering nature of porosity leads to angular energy dispersion and reduced coherent backscatter, making detectability strongly depth sensitive. The negative regression coefficient and reduced POD values are physically consistent and highlight the inherently weak ultrasonic response of volumetric flaws at greater depths.
For volumetric defects, the ultrasonic response is inherently distributed in time due to multi-path scattering and angular energy dispersion, which can reduce peak terminal voltage despite the presence of measurable scattered energy. Consequently, peak amplitude alone may not fully capture the total defect-induced response for volumetric flaws, particularly at greater depths. Complementary signal features such as time-integrated signal energy or effective signal duration may therefore provide additional sensitivity by characterizing distributed scattering behavior that is not reflected in the peak response. While the present study intentionally employs peak terminal voltage to isolate morphology and depth-dependent detectability trends under controlled conditions, extension of the signal-response POD framework to incorporate multi-feature response descriptors is identified as an important direction for future work.
The POD analysis in this study is based on a limited number of controlled simulation cases (12 points for morphology-based analysis and 6 points for depth-dependent analysis), which inherently limit the statistical confidence that can be assigned to the regression parameters and derived a90 values. This limitation arises from the parametric nature of the finite-element framework, where each data point corresponds to a deterministic, computationally intensive simulation rather than a stochastic experimental realization. As a result, the regression and ANOVA outcomes are intended to quantify relative detectability trends and effect magnitudes between defect classes, rather than to establish population-level detection probabilities. Within this context, the observed monotonic response behavior, physically interpretable regression coefficients, and consistent morphology-dependent separation across defect types support the qualitative robustness of the conclusions. Accordingly, the reported a90 values should be interpreted as comparative indicators of morphology and depth-dependent detectability, rather than as statistically converged inspection limits.
The simulations further assume homogeneous and isotropic elastic material behavior and exclude measurement noise in order to isolate fundamental wave-defect interaction mechanisms under idealized inspection conditions. In practical welded components, microstructural heterogeneity and anisotropy associated with weld metal and heat-affected zone regions can influence ultrasonic wave propagation through velocity variations, scattering, and attenuation, while electronic and structural noise introduce additional variability in measured responses. In practice, such noise effects are typically mitigated through signal processing techniques, including filtering, time gating, averaging, and coherence-based methods used in UT, PAUT, and TFM. Nevertheless, residual noise and material-related variability can increase response scatter and affect effective detection thresholds, particularly for low-amplitude volumetric defects. The present study, therefore, focuses on relative detectability trends obtained under identical material and noise-free assumptions, where the dominant differences between planar and volumetric defects arise from their inherent scattering mechanisms. Extension of the framework to incorporate anisotropic material models, representative noise statistics, and more realistic inspection conditions, including complex weld geometry and surface roughness, is identified as an important direction for future work.
The reliability of the present study is ensured through physics-consistent modeling, controlled parametric variation, and internal trend verification rather than direct prediction of absolute experimental amplitudes. The finite-element simulations reproduce well-established ultrasonic scattering behavior, including coherent specular reflection and diffraction-dominated responses for planar defects and distributed, incoherent scattering for volumetric defects, as extensively documented in experimental and theoretical ultrasonic nondestructive evaluation literature [26,28,29]. Robustness is further supported by consistent monotonic response trends, regression stability, and morphology-dependent separation in POD curves under identical inspection conditions. A dedicated threshold-sensitivity analysis confirms that while absolute a90 values shift with detection threshold, the relative detectability ranking between planar and volumetric defects remains unchanged. The gap between simulation and experiment is therefore expected to primarily affect absolute response levels due to noise, material heterogeneity, and coupling variability, but not the qualitative morphology- and depth-dependent detectability trends identified here. Accordingly, the results are interpreted as upper-bound, trend-focused indicators that provide a mechanistic foundation for future experimental and model-assisted POD studies.
Overall, this study demonstrates that controlled, physics-consistent finite-element simulations can be used to interpret morphology and depth-dependent ultrasonic detectability trends while maintaining clear separation between comparative, trend-based insights and qualification-level inspection metrics. By explicitly accounting for modeling assumptions, statistical limitations, and threshold sensitivity, the present study establishes a reliable mechanistic basis for understanding relative detectability differences between planar and volumetric weld defects, thereby providing a structured foundation for subsequent experimental and model-assisted POD investigations.

5. Conclusions

This work developed a finite-element based, signal-response Probability of Detection (POD) framework to examine ultrasonic detectability trends for representative planar and volumetric weld defects under controlled simulation conditions. Peak terminal voltage extracted from time-domain shear-wave simulations was used as a quantitative response metric to construct POD relationships as a function of defect morphology and depth.
The analysis shows that morphology-dependent wave-defect interaction behavior leads to systematically different detectability limits for planar and volumetric flaws, with planar defects reaching characteristic detection levels at smaller dimensions than volumetric defects under identical inspection conditions. Depth was also shown to influence signal response in a morphology-specific manner, highlighting the need to treat flaw type and inspection zone explicitly when interpreting ultrasonic reliability metrics.
While the derived POD values represent idealized upper-bound trends, the study demonstrates that simulation-based signal-response analysis can effectively isolate fundamental ultrasonic detectability mechanisms that are difficult to decouple in physical inspections. Accordingly, the reported POD metrics represent idealized, upper-bound trends derived from physics-consistent simulations rather than qualification-level inspection limits and are intended to provide mechanistic insight to support future experimental and model-assisted POD investigations. The presented framework provides a structured basis for evaluating how inspection sensitivity varies with defect characteristics under well-defined ultrasonic conditions.
Future work will extend this approach to three-dimensional models, broader frequency ranges, and additional flaw orientations to capture more realistic weld geometries and inspection scenarios. Parametric studies incorporating beam steering, focal law variations, and alternative response metrics are expected to further refine the understanding of ultrasonic detection limits for complex weld defects.


Author Contributions

Conceptualization, C.M.I. and H.T.; methodology, C.M.I.; software, C.M.I.; formal analysis, C.M.I.; investigation, C.M.I.; resources, H.T. and B.S.; data curation, C.M.I.; writing—original draft preparation, C.M.I.; writing—review and editing, H.T. and B.S.; visualization, C.M.I.; supervision, H.T. and B.S.; project administration, H.T. All authors have read and agreed to the published version of the manuscript.

Funding

This research received no external funding.

Institutional Review Board Statement

Not applicable.

Informed Consent Statement

Not applicable.

Data Availability Statement

Data is available upon written request to the corresponding author.

Acknowledgments

The authors would like to thank the Office of Research and Economic Development (ORED) and the Allen E. Paulson College of Engineering and Computing (CEC) at Georgia Southern University for their support and for facilitating this research.

Conflicts of Interest

The authors declare no conflicts of interest.

Abbreviations

The following abbreviations are used in this manuscript:
PODProbability of Detection
mmMillimeter
UTUltrasonic Testing
PAUTPhased-Array Ultrasonic Testing
TFMTotal focusing method
FEFinite element
FEMFinite Element Method
2DTwo-dimensional
CDFCumulative Distribution Function
ANOVAAnalysis of variance
AWSAmerican Welding Society
ASTMAmerican Society for Testing and Materials
MIL-HDBKMilitary Handbook
MSMild Steel
MHzMegahertz
VVolt

References

  1. Leitner, M.; Murakami, Y.; Farajian, M.; Remes, H.; Stoschka, M. Fatigue Strength Assessment of Welded Mild Steel Joints Containing Bulk Imperfections. Metals 2018, 8, 306. [Google Scholar] [CrossRef] [Scilit]
  2. Didžiokas, R.; Januteniene, J.; Jonaityte, J. The impact of the internal welding defects on the joint Strength. Transport 2008, 23, 240–244. [Google Scholar] [CrossRef] [Scilit]
  3. Fujii, T.; Naoya, O.; Keiichiro, T.; Yoshinobu, S. Monte Carlo simulation of stress corrosion cracking in welded metals. Int. J. Mech. Sci. 2023, 257, 108561. [Google Scholar] [CrossRef] [Scilit]
  4. Verma, J.; Taiwade, R.V. Effect of welding processes and conditions on the microstructure, mechanical properties and corrosion resistance of duplex stainless steel weldments—A review. J. Manuf. Process. 2017, 25, 134–152. [Google Scholar] [CrossRef] [Scilit]
  5. Santosuosso, B.J.; Kern, T.M.; Warke, R.W.; McGormley, J.C. I-40 Hearnando Desoto Bridge Fracture Investigation; Wiss, Janney, Elstner Associates: Northbrook, IL, USA, 2021. [Google Scholar]
  6. Kunishima, M. Collapse of the Korea Seoul Seongsu Bridge. Failure Knowledge Database/100 Selected Cases, Republic of Korea, 1994. Available online: https://www.shippai.org/fkd/en/cfen/CD1000144.html (accessed on 16 February 2026).
  7. Williams, C.; Lappin, E.; Taheri, H. Assessment of Process Induced Welding Flaws in Structural Steel Members Using Phased Array Ultrasonic Nondestructive Testing. In Proceedings of the ASME 2024 International Mechanical Engineering Congress and Exposition, Portland, OR, USA, 17–21 November 2024. [Google Scholar]
  8. Williams, C.; Taheri, M.; Taheri, H. Phased Array Ultrasonic Nondestructive Testing for Mechanical Integrity Assessment of Steel Welding. In Proceedings of the ASME 2023 International Mechanical Engineering Congress and Exposition, New Orleans, LA, USA, 29 October–2 November 2023. [Google Scholar]
  9. Federal Highway Administration (FHWA). Development of Phased-Array Ultrasonic Testing Acceptability Criteria (Phase I); Federal Highway Administration: Washington, DC, USA, 2014.
  10. Mogilner, L.Y.; Syasko, V.A.; Shikhov, A.I. Modeling Defects in Ultrasonic Nondestructive Testing: State-of-the-Art and Prospects. Russ. J. Nondestruct. Test. 2024, 60, 481–500. [Google Scholar] [CrossRef] [Scilit]
  11. Nardoni, M.C.G.; Nardoni, P.; Ferold, M.; Nardoni, D.; Possenti, L.; Filosi, A.; Quetti, S. Experimental Determination of Discrimination Criteria Between Volumetric and Planar Defects By Means of Ultrasonic Pulse Echo/Phased Array Techniques Based on the Ratio of Diffracted Echoes in Welding Examination. In Proceedings of the 18th World Conference on Nondestructive Testing, Durban, South Africa, 16–20 April 2012. [Google Scholar]
  12. Jasiūnienė, E.; Žukauskas, E. The ultrasonic wave interaction with porosity defects in welded rail head. Ultragarsas/Ultrasound 2010, 65, 1. [Google Scholar]
  13. Kim, G.; Seo, M.-K.; Kim, Y.-I.; Kwon, S.; Kim, K.-B. Development of phased array ultrasonic system for detecting rail cracks. Sens. Actuators A Phys. 2020, 311, 112086. [Google Scholar] [CrossRef] [Scilit]
  14. Irtiza, C.M.; Silwal, B.; Kardel, K.; Taheri, H. Implementing Phased Array Ultrasonic Testing and Lean Principles Towards Efficiency and Quality Improvement in Manufacturing Welding Processes. Appl. Sci. 2025, 15, 11271. [Google Scholar] [CrossRef] [Scilit]
  15. Irtiza, C.M.; Taheri, H. Phased Array Ultrasonic Testing and Characterization of Flaws in Structural Welding in Compliance with AWS D1.5. In Proceedings of the GS4 Georgia Southern Student Scholars Symposium, Statesboro, GA, USA, 24 April 2025. [Google Scholar]
  16. Lindgren, E.; Forsyth, D.; Aldrin, J.; Spencer, F.; Detection, P.O. ASM Handbook Nondestructive Evaluation of Materials; ASM International: Almere, The Netherlands, 2018. [Google Scholar]
  17. ASTM E2862-12; Standard Practice for Probability of Detection Analysis for Hit/Miss Data. ASTM: West Conshohocken, PA, USA, 2018.
  18. Department of Defense. Nondestructive Evaluation System Reliability Assessment; United States Air Force: Washington, DC, USA, 2009. [Google Scholar]
  19. Kurz, J.H.; Jüngert, A.; Dugan, S.; Dobmann, G. Probability of Detection (POD) determination using Ultrasound Phased Array for considering NDT in probabilistic damage assessments. In Proceedings of the 18th World Conference on Nondestructive Testing, Durban, South Africa, 6–20 April 2012. [Google Scholar]
  20. Lu, S.; Wang, X.; Teng, L.; Zhang, J.; Zhou, Z.; Tong, Z.; Shao, H.; Men, X. Finite element analysis and experimental investigation of ultrasonic testing of internal defects in SiCp/Al composites. Ceram. Int. 2022, 48, 5972–5982. [Google Scholar] [CrossRef] [Scilit]
  21. Silva, M.I.; Malitckii, E.; Santos, T.G.; Vilaça, P. Review of conventional and advanced non-destructive testing techniques for detection and characterization of small-scale defects. Prog. Mater. Sci. 2023, 138, 101155. [Google Scholar] [CrossRef] [Scilit]
  22. Anand, C.; Groves, R.M.; Benedictus, R. Modeling and Imaging of Ultrasonic Array Inspection of Side Drilled Holes in Layered Anisotropic Media. Sensors 2021, 21, 4640. [Google Scholar] [CrossRef] [Scilit] [PubMed]
  23. Taheri, H.; Koester, L.; Bigelow, T.; Bond, L. Finite Element Simulation and Experimental Verification of Ultrasonic Non-Destructive Inspection of Defects in Additively Manufactured Materials. AIP Conf. Proc. 2018, 1949, 020011. [Google Scholar]
  24. Meyer, R.; Lareau, J.; Crawford, S.; Anderson, M. Review of Literature for Model Assisted Probability of Detection; U.S. Department of Energy: Washington, DC, USA, 2014.
  25. Subair, S.M.; Balasubramaniam, K.; Rajagopal, P.; Kumar, A.; Rao, B.P.; Jayakumar, T. Finite Element Simulations to Predict Probability of Detection (PoD) Curves for Ultrasonic Inspection of Nuclear Components. Procedia Eng. 2014, 86, 461–468. [Google Scholar] [CrossRef] [Scilit]
  26. Krautkrämer, J.; Krautkrämer, H. Ultrasonic Testing of Materials; Springer: Berlin/Heidelberg, Germany, 1990. [Google Scholar]
  27. Gary, D.K.; Workman, L. Nondestructive Testing Handbook; American Society of Nondestructive Testing: Columbus, OH, USA, 2012. [Google Scholar]
  28. Schmerr, L.W., Jr. Fundamentals of Ultrasonic Nondestructive Evaluation; Springer Nature: Berlin/Heidelberg, Germany, 2016. [Google Scholar]
  29. Auld, B. Acoustic Fields and Waves in Solids; Ripol Klassik Publishing House: Moscow, Russia, 1973. [Google Scholar]
Figure 1. Two-dimensional schematic of the COMSOL Multiphysics simulation setup used for ultrasonic inspection of a welded joint. The model includes (a) a UT transducer assembly, (b) a signal damping block for the UT transducer, (c) an angle wedge, (d) the V-groove weld geometry with an embedded planar defect (lack of fusion), and (e) a damping block for the weld geometry.
Ndt 04 00009 g001
Figure 3. Workflow of simulation-based signal-response POD analysis framework.
Ndt 04 00009 g003
Figure 4. Simulated ultrasonic wave-defect interaction patterns predicted by the finite element model for planar weld defects with a nominal size of 1.5 mm: (a) toe crack and (b) root crack. The wave fields illustrate differences in reflection and diffraction behavior associated with the respective defect locations.
Ndt 04 00009 g004aNdt 04 00009 g004b
Figure 5. Finite element simulation of ultrasonic wave interaction with a 1.5 mm volumetric porosity defect. The wave field illustrates backscattered components returning to the probe, reflections at the flaw boundary, and forward-scattered and diffracted wave components associated with the volumetric defect.
Ndt 04 00009 g005
Figure 6. Time-domain terminal voltage responses predicted by the finite element simulation for two planar weld defect locations: (a) a 1.5 mm toe crack and (b) a 1.5 mm root crack. Peak voltage amplitudes and their corresponding arrival times are marked to illustrate differences in signal response.
Ndt 04 00009 g006aNdt 04 00009 g006b
Figure 7. Time-domain terminal voltage responses predicted by finite-element simulation for a 1.5 mm porosity defect at (a) Zone 1 and (b) Zone 2, compared against no-defect baseline signals.
Ndt 04 00009 g007
Table 1. Summary of the key parameters used in finite-element ultrasonic simulation.
CategoryParameterDescription/Value
Plate GeometryDomain Size100 mm (Length) ×   25 mm (Thickness)
Base MetalPlate MaterialStructural Steel (MS 1018)
Material PropertiesDensity7850 kg/m3
Material PropertiesShear-Wave Velocity3230 m/s
ExcitationCenter Frequency2 MHz
Transducer ConfigurationWedge Angle28 degrees
Table 2. Summary of flaw families, size ranges, and depth zones used in POD trend analysis.
Flaw FamilyMorphologySize Range
(mm)
Depth Zones
(Zone 01: 1–14 mm)
(Zone 02: 14–25 mm)
Toe CrackPlanar1.5–4Zone 01
Root CrackPlanar1.5–4Zone 02
PorosityVolumetric1.5–4Zone 01, Zone 02
Table 3. Signal response input data for defect morphology-based POD analysis.
Defect TypeDefect NameDefect Size
(mm)
Zones
(Zone 1: 1–14 mm)
(Zone 2: 14–25 mm)
Peak Terminal Voltage
(V)
VolumetricPorosity1.5Zone 010.0301
VolumetricPorosity2.0Zone 010.0360
VolumetricPorosity4.0Zone 010.0513
VolumetricPorosity1.5Zone 020.0182
VolumetricPorosity2.0Zone 020.0211
VolumetricPorosity4.0Zone 020.0368
PlanarToe Crack1.5Zone 010.0410
PlanarToe Crack2.0Zone 010.0410
PlanarToe Crack4.0Zone 010.0350
PlanarRoot crack1.5Zone 020.0440
PlanarRoot crack2.0Zone 020.0440
PlanarRoot Crack4.0 Zone 020.0470
Table 4. (a) Regression coefficients and (b) analysis of variance (ANOVA) for the signal-response POD analysis, showing the influence of defect morphology on peak terminal voltages.
(a)
TermCoefficientStd. Errort-Valuep-ValueVIF
Constant0.032930.006525.050.001-
Defect Size (mm)0.003630.002221.630.1371.00
Defect Type (Volumetric)−0.009750.00481−2.030.0731.00
(b)
SourceDFAdj SSAdj MSF-Valuep-Value
Regression20.000470.0002353.390.08
Defect Size10.0001840.0001842.660.137
Defect Type10.0002850.0002854.120.073
Error90.0006240.000069
Lack-of-Fit30.0002560.0000851.390.334
Pure Error60.0003680.000061
Total110.001093
Table 5. Threshold-sensitivity analysis showing the influence of terminal-voltage detection threshold on the derived a90 values for planar and volumetric weld defects.
Threshold DefinitionT (V) a 90 (Planar)
(mm)
a 90 (Volumetric)
(mm)
4 ×   V r m s , r e f 0.0250.773.46
5.3 ×   V r m s , r e f 0.0332.965.64
6 ×   V r m s , r e f 0.0384.236.91
7 ×   V r m s , r e f 0.0445.988.67
Table 6. Input data for signal-response POD analysis (depth-wise; planar defects).
Defect TypeDefect NameDefect Size
(mm)
Zones
(Zone 1: 1–14 mm)
(Zone 2: 14–25 mm)
Peak Terminal Voltage
(V)
PlanarToe Crack1.5Zone 010.0410
PlanarToe Crack2.0Zone 010.0410
PlanarToe Crack4.0Zone 010.0350
PlanarRoot Crack1.5Zone 020.0440
PlanarRoot Crack2.0Zone 020.0440
PlanarRoot Crack4.0Zone 020.0470
Table 7. (a) Regression coefficients, (b) analysis of variance (ANOVA), and (c) model summary for the depth-wise signal-response POD analysis (planar defects).
(a)
TermCoefficientStd. Errort-Valuep-ValueVIF
Constant Zones0.39000.0015824.670.00-
Zone 020.006000.002242.680.0551.00
(b)
SourceDFAdj SSAdj MSF-Valuep-Value
Regression10.0000540.0000547.200.055
Zones10.0000540.0000547.200.055
Error40.0000300.000008--
Total50.000084---
(c)
SR-sqR-sq (adj)R-sq (pred)
0.002738664.29%55.36%19.64%
Table 8. Input data for signal-response POD analysis (depth-wise; volumetric defects).
Defect TypeDefect NameDefect Size
(mm)
Zones
(Zone 1: 1–14 mm)
(Zone 2: 14–25 mm)
Peak Terminal Voltage
(V)
VolumetricPorosity1.5Zone 010.0301
VolumetricPorosity2.0Zone 010.036
VolumetricPorosity4.0Zone 010.0513
VolumetricPorosity1.5Zone 020.0182
VolumetricPorosity2.0Zone 020.0211
VolumetricPorosity4.0Zone 020.0368
Table 9. (a) Analysis of variance (ANOVA) and (b) model summary of the signal-response POD analysis for volumetric defects (depth-wise). * Indicates that the predicted R-sq was not available for the fitted model.
(a)
SourceDFAdj SSAdj MSF-Valuep-Value
Regression20.0003120.0001561.130.430
Zones20.0003120.0001561.130.430
Error30.0004120.000137--
Total50.000724---
(b)
SR-sqR-sq (adj)R-sq (pred)
0.011725043.04%5.06%*
Table 10. Summary of signal-response POD analysis for planar and volumetric defects under simulated ultrasonic inspection conditions.
Analysis CategoryDefect MorphologyDepth ZonesMean Peak Terminal Voltage
(V)
Residual
σ
V
Detection Threshold
T (V)
POD a 90 (mm)
Morphology-Based PODPlanarCombined-0.008320.033-2.96
VolumetricCombined-0.00832-5.64
Depth-Wise PODPlanarZone 10.0390.002740.986-
PlanarZone 20.0450.002740.999-
VolumetricZone 10.02750.011730.320-
VolumetricZone 20.02110.011730.156-
Disclaimer/Publisher’s Note: The statements, opinions and data contained in all publications are solely those of the individual author(s) and contributor(s) and not of MDPI and/or the editor(s). MDPI and/or the editor(s) disclaim responsibility for any injury to people or property resulting from any ideas, methods, instructions or products referred to in the content.