A Green Workflow to Determine Flavonoids from Physalis angulata L.: Extraction Optimization by Response Surface Method and Spectrophotometric Method Validation
Abstract
1. Introduction
2. Materials and Methods
2.1. Sampling and Pre-Treatment
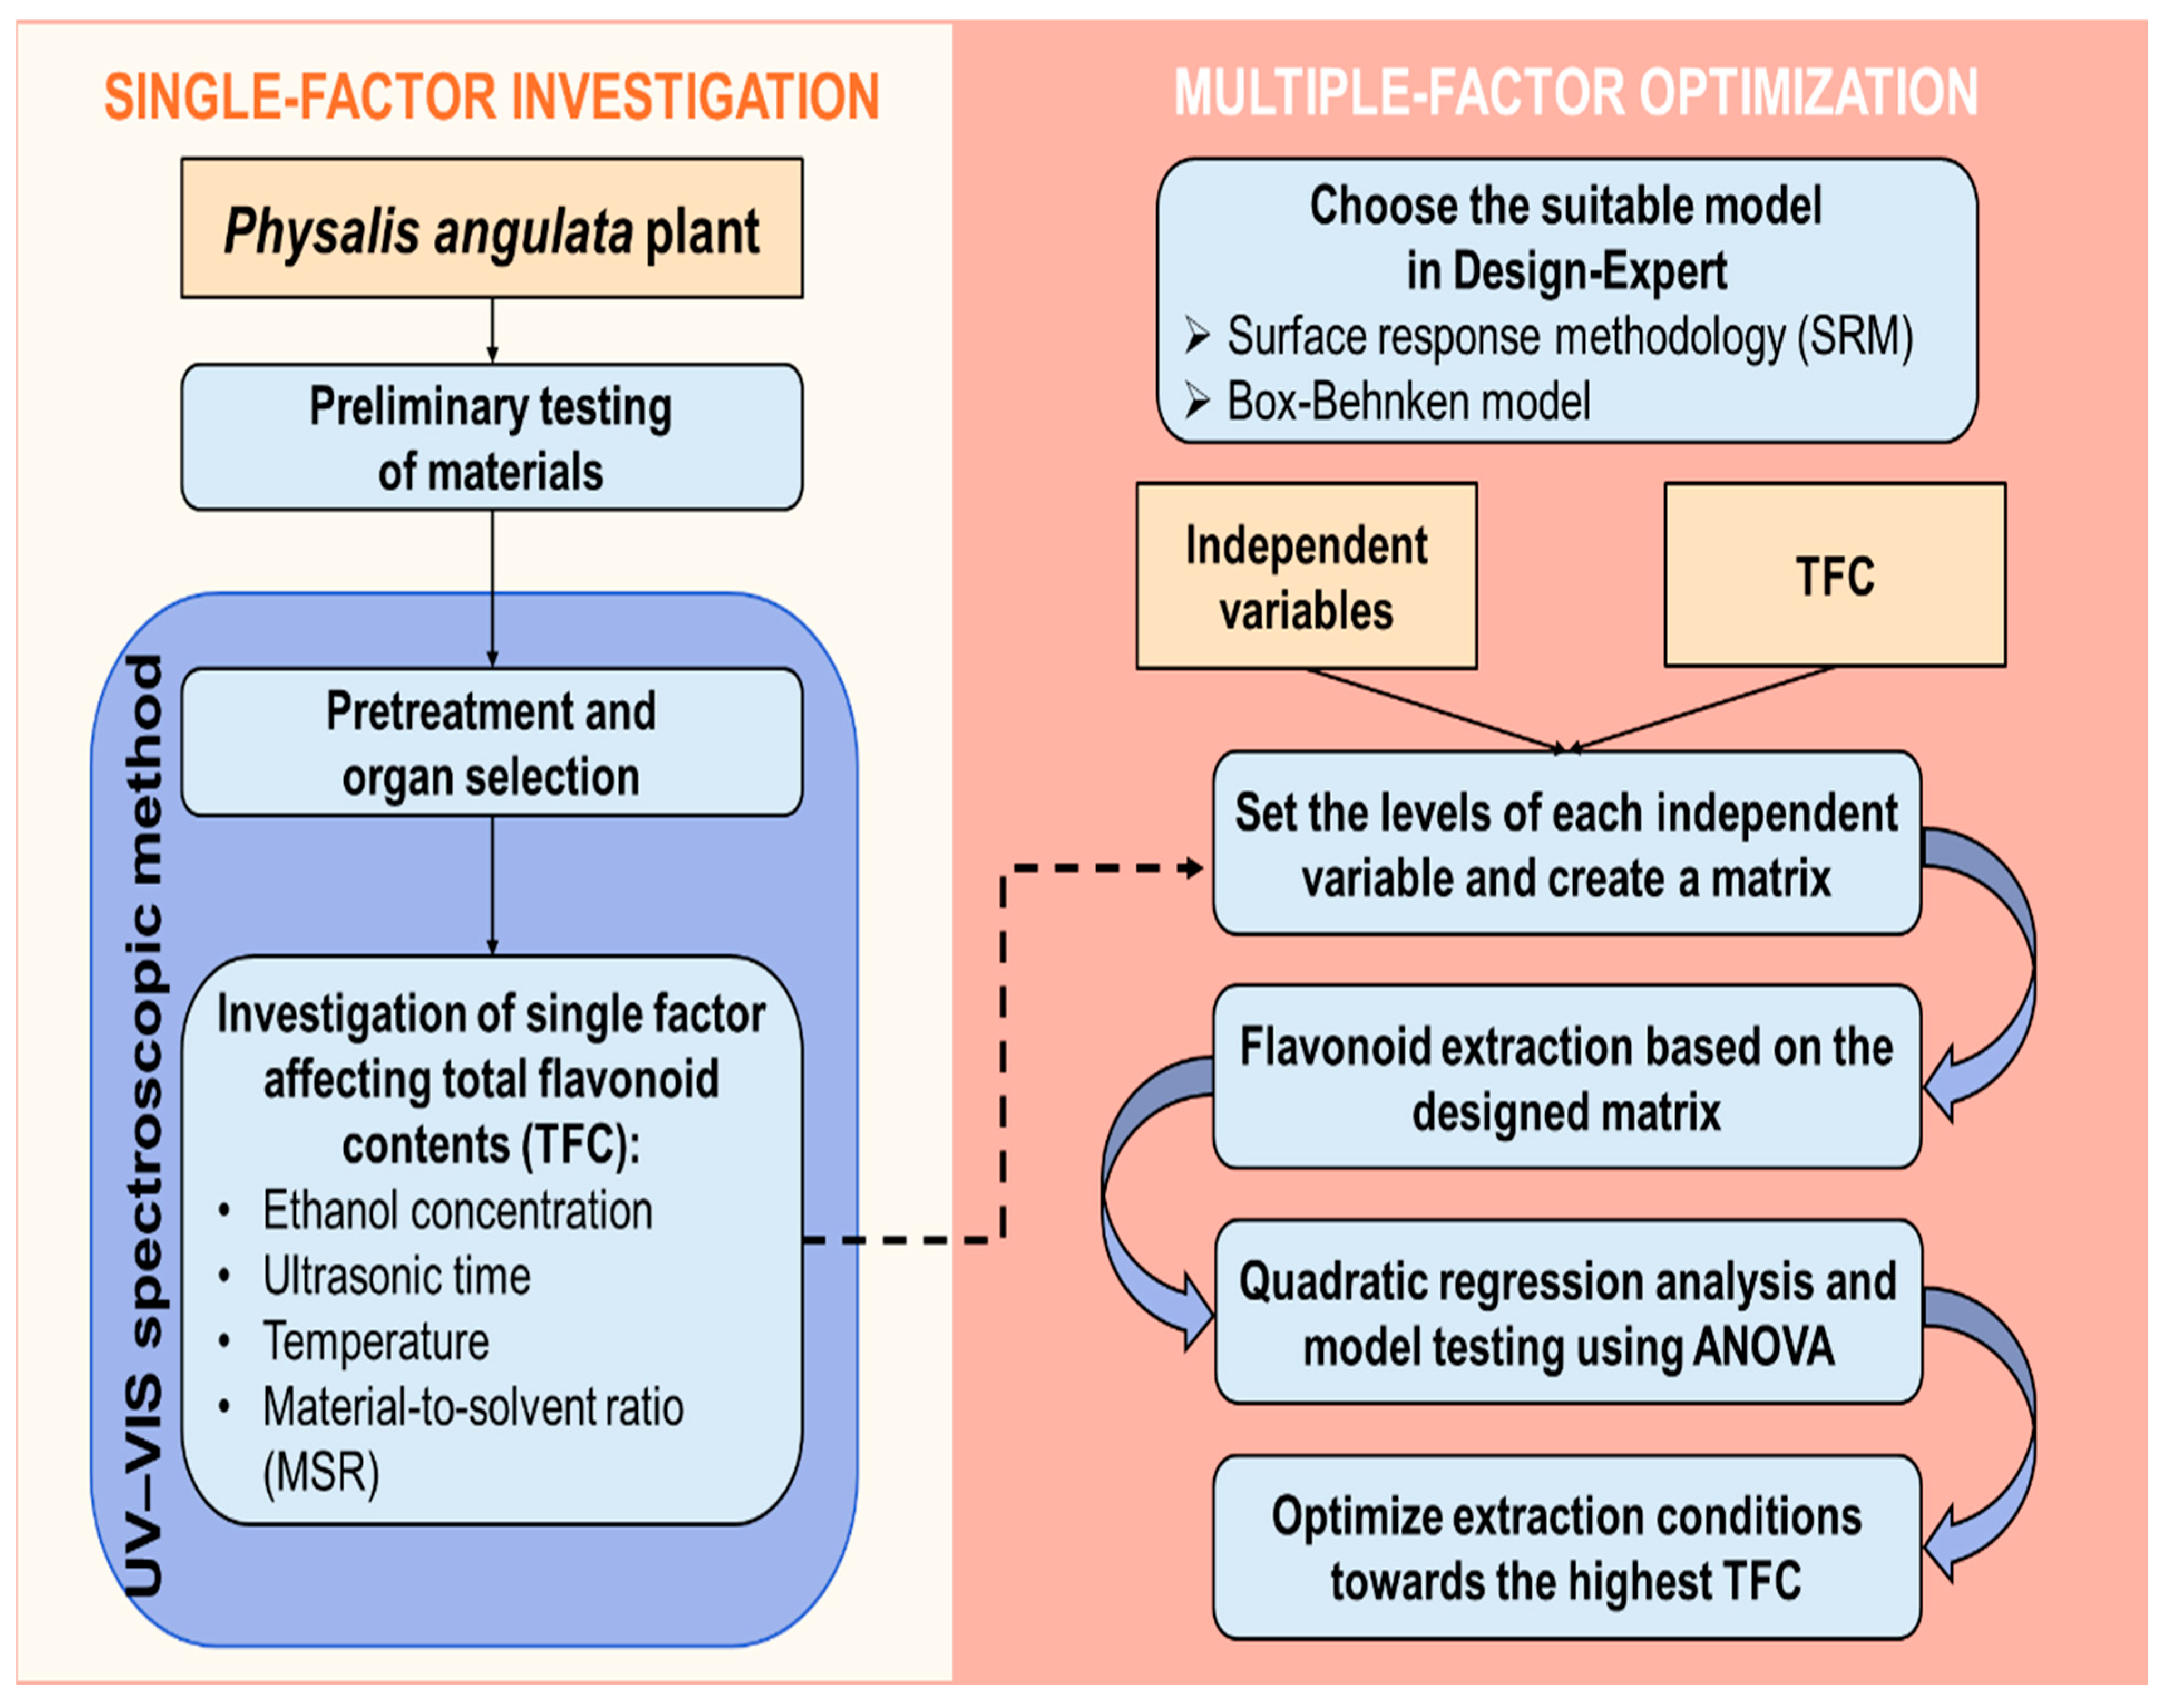
2.2. Single-Factor Investigation of Flavonoid Extraction
2.3. Total Flavonoid Extraction Optimization by Response Surface Methodology
2.4. Development and Application of UV-Vis Spectroscopic Method for Total Flavonoid Contents
- -
- Specificity: the spectra of blank, sample (after being extracted with the optimized condition), standard and spiked standard were scanned from 450 to 800 nm.
- -
- Linearity: stock standard (2000 µg/mL) was diluted into standards from 15 to 120 µg/mL. F- and t-tests were applied to confirm the suitability of the regression equation and the significance of the regression coefficient, respectively.
- -
- Precision: 6 test samples were repeated independently with the same optimized extraction and spectroscopic workflow in one day to calculate RSD (intra-day precision). For inter-day precision, an additional 6 samples were processed on the second day. F-test (two-sample for variances) was used to assess the homogeneity of variance (RSD) between two days, and the t-test (two-sample assuming equal variances) was used to compare the mean of TFC quantified on two different days.
- -
- Accuracy: the validation was performed on spiked standards at 80%, 100% and 120% levels to calculate recoveries, whether they fell in the range of 95% to 105% (RSD ≤ 3.7%).
- -
- Limit of detection (LOD) and limit of quantification (LOQ) were calculated from the standard curve with the following equation: LOD = 3.3/S, LOQ = 10/S.
3. Results and Discussion
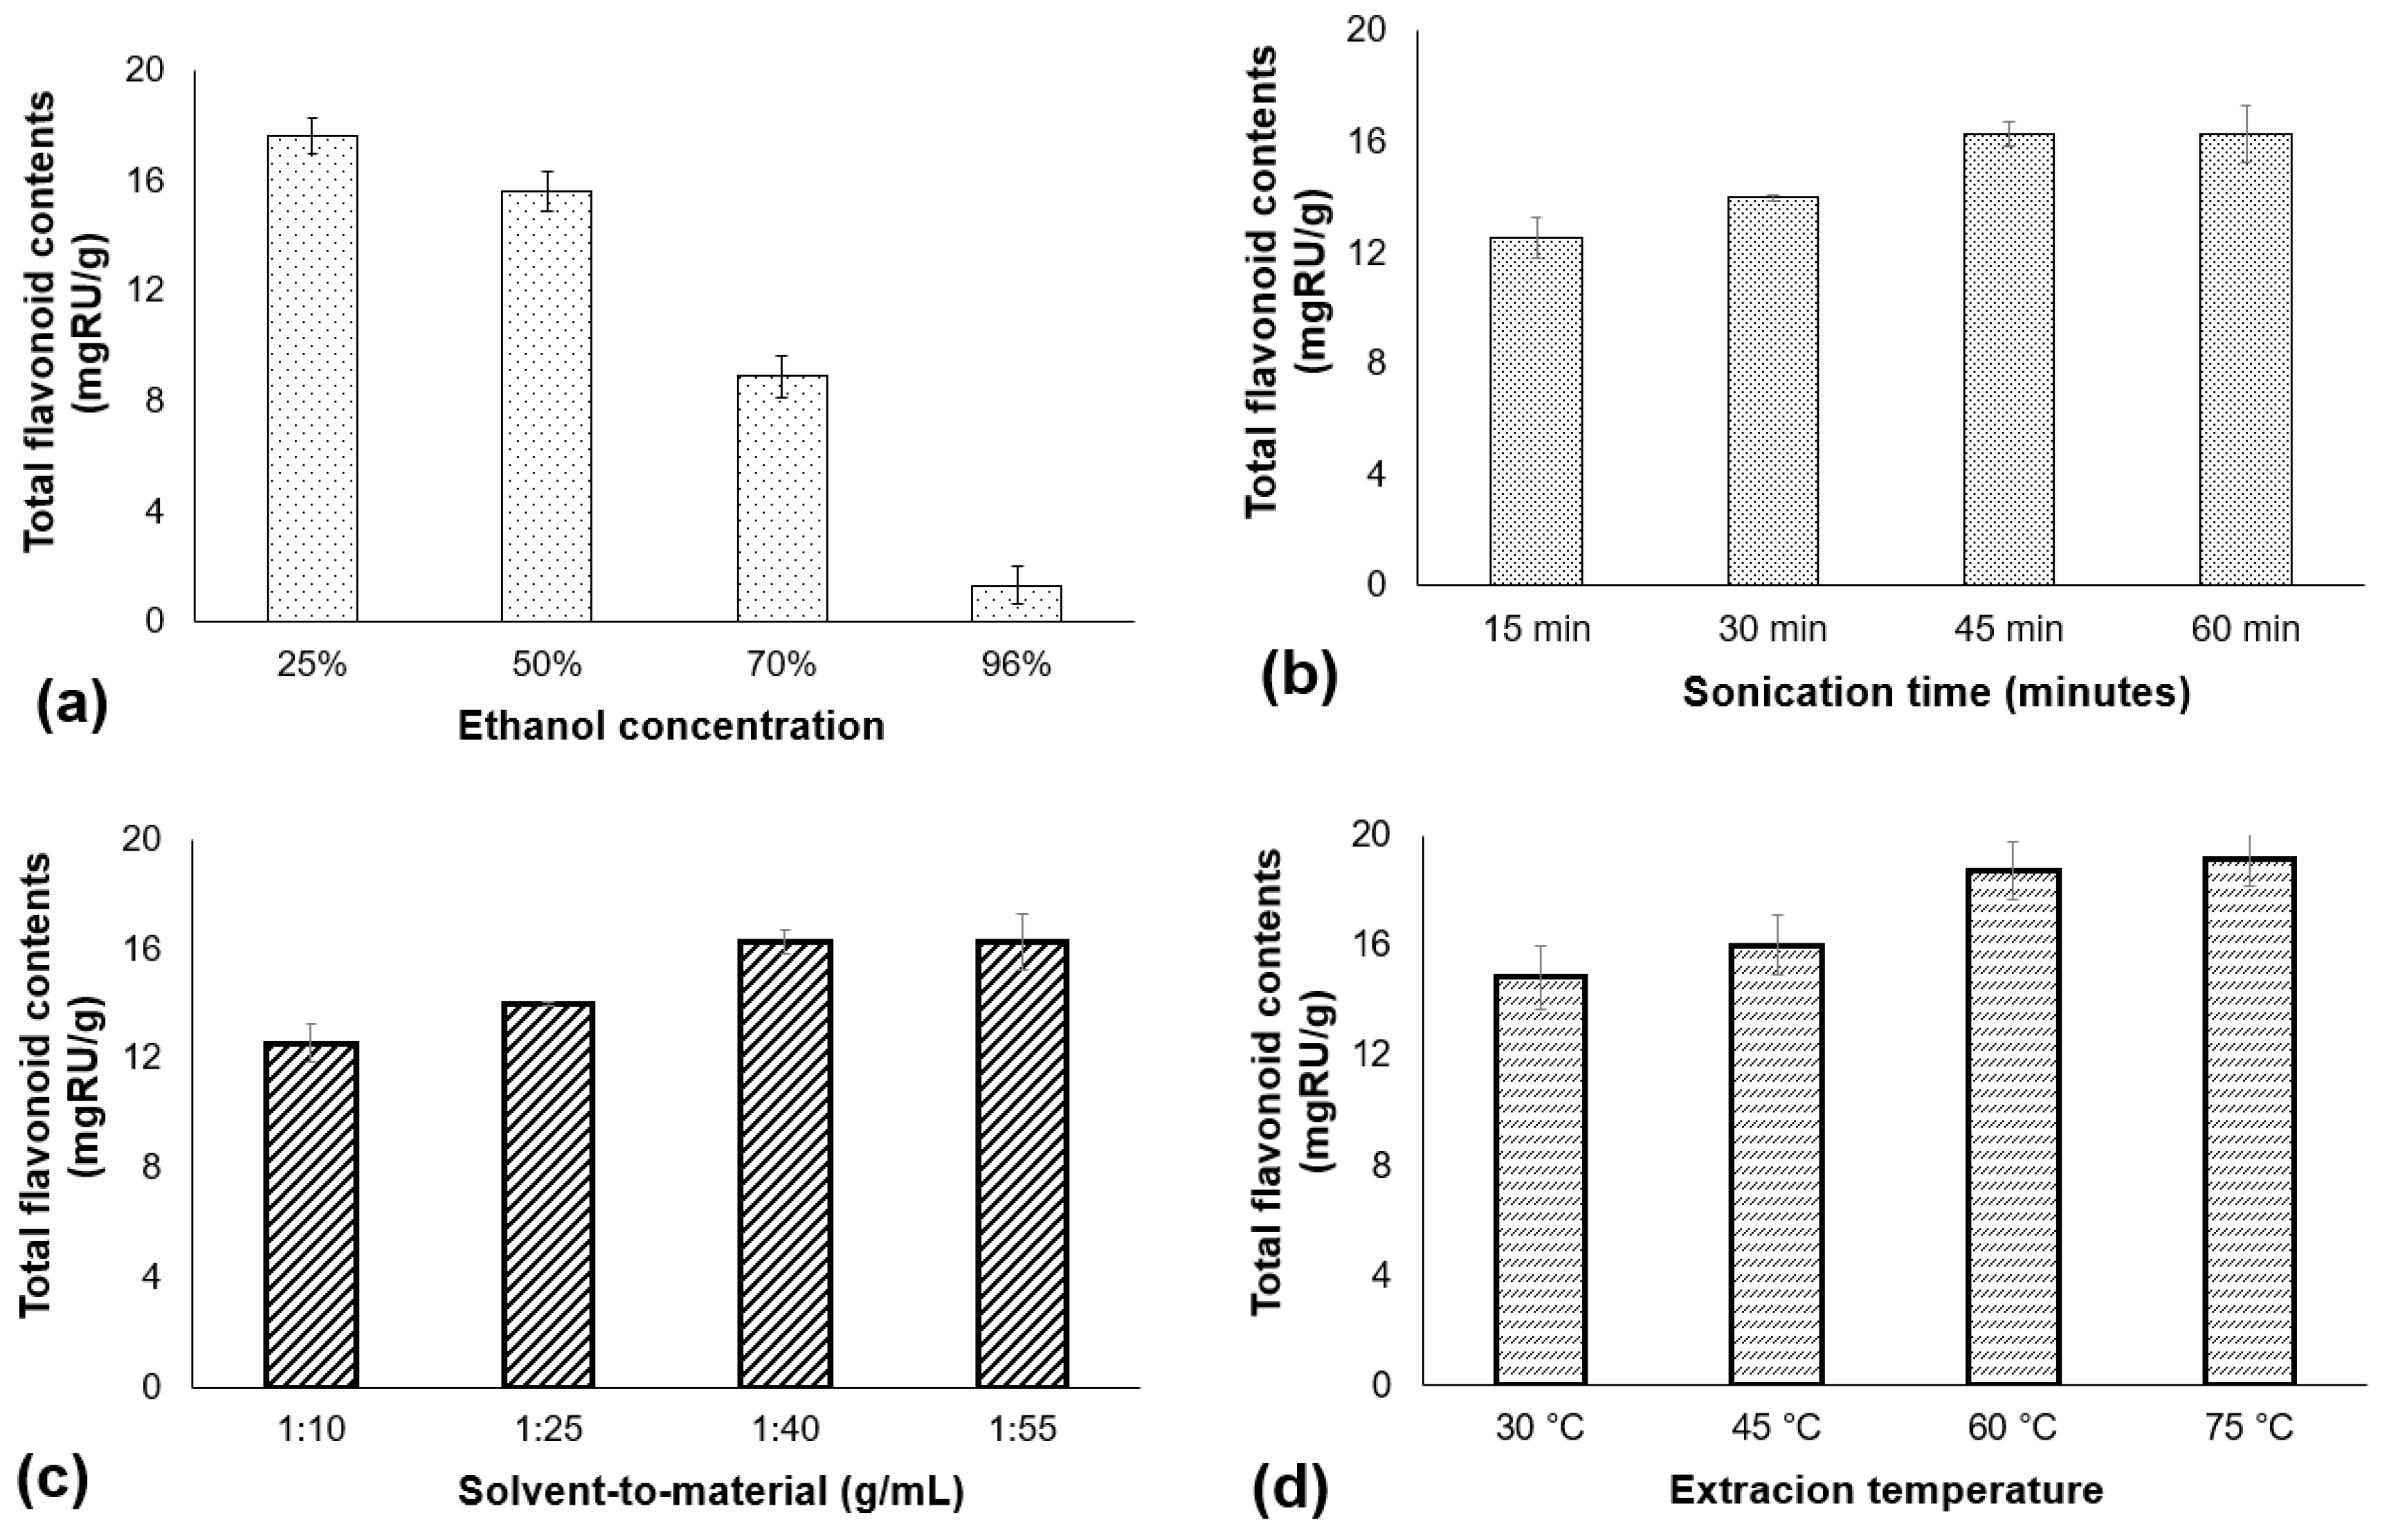
3.1. Results of Single-Factor Investigations Affecting the Flavonoid Extraction
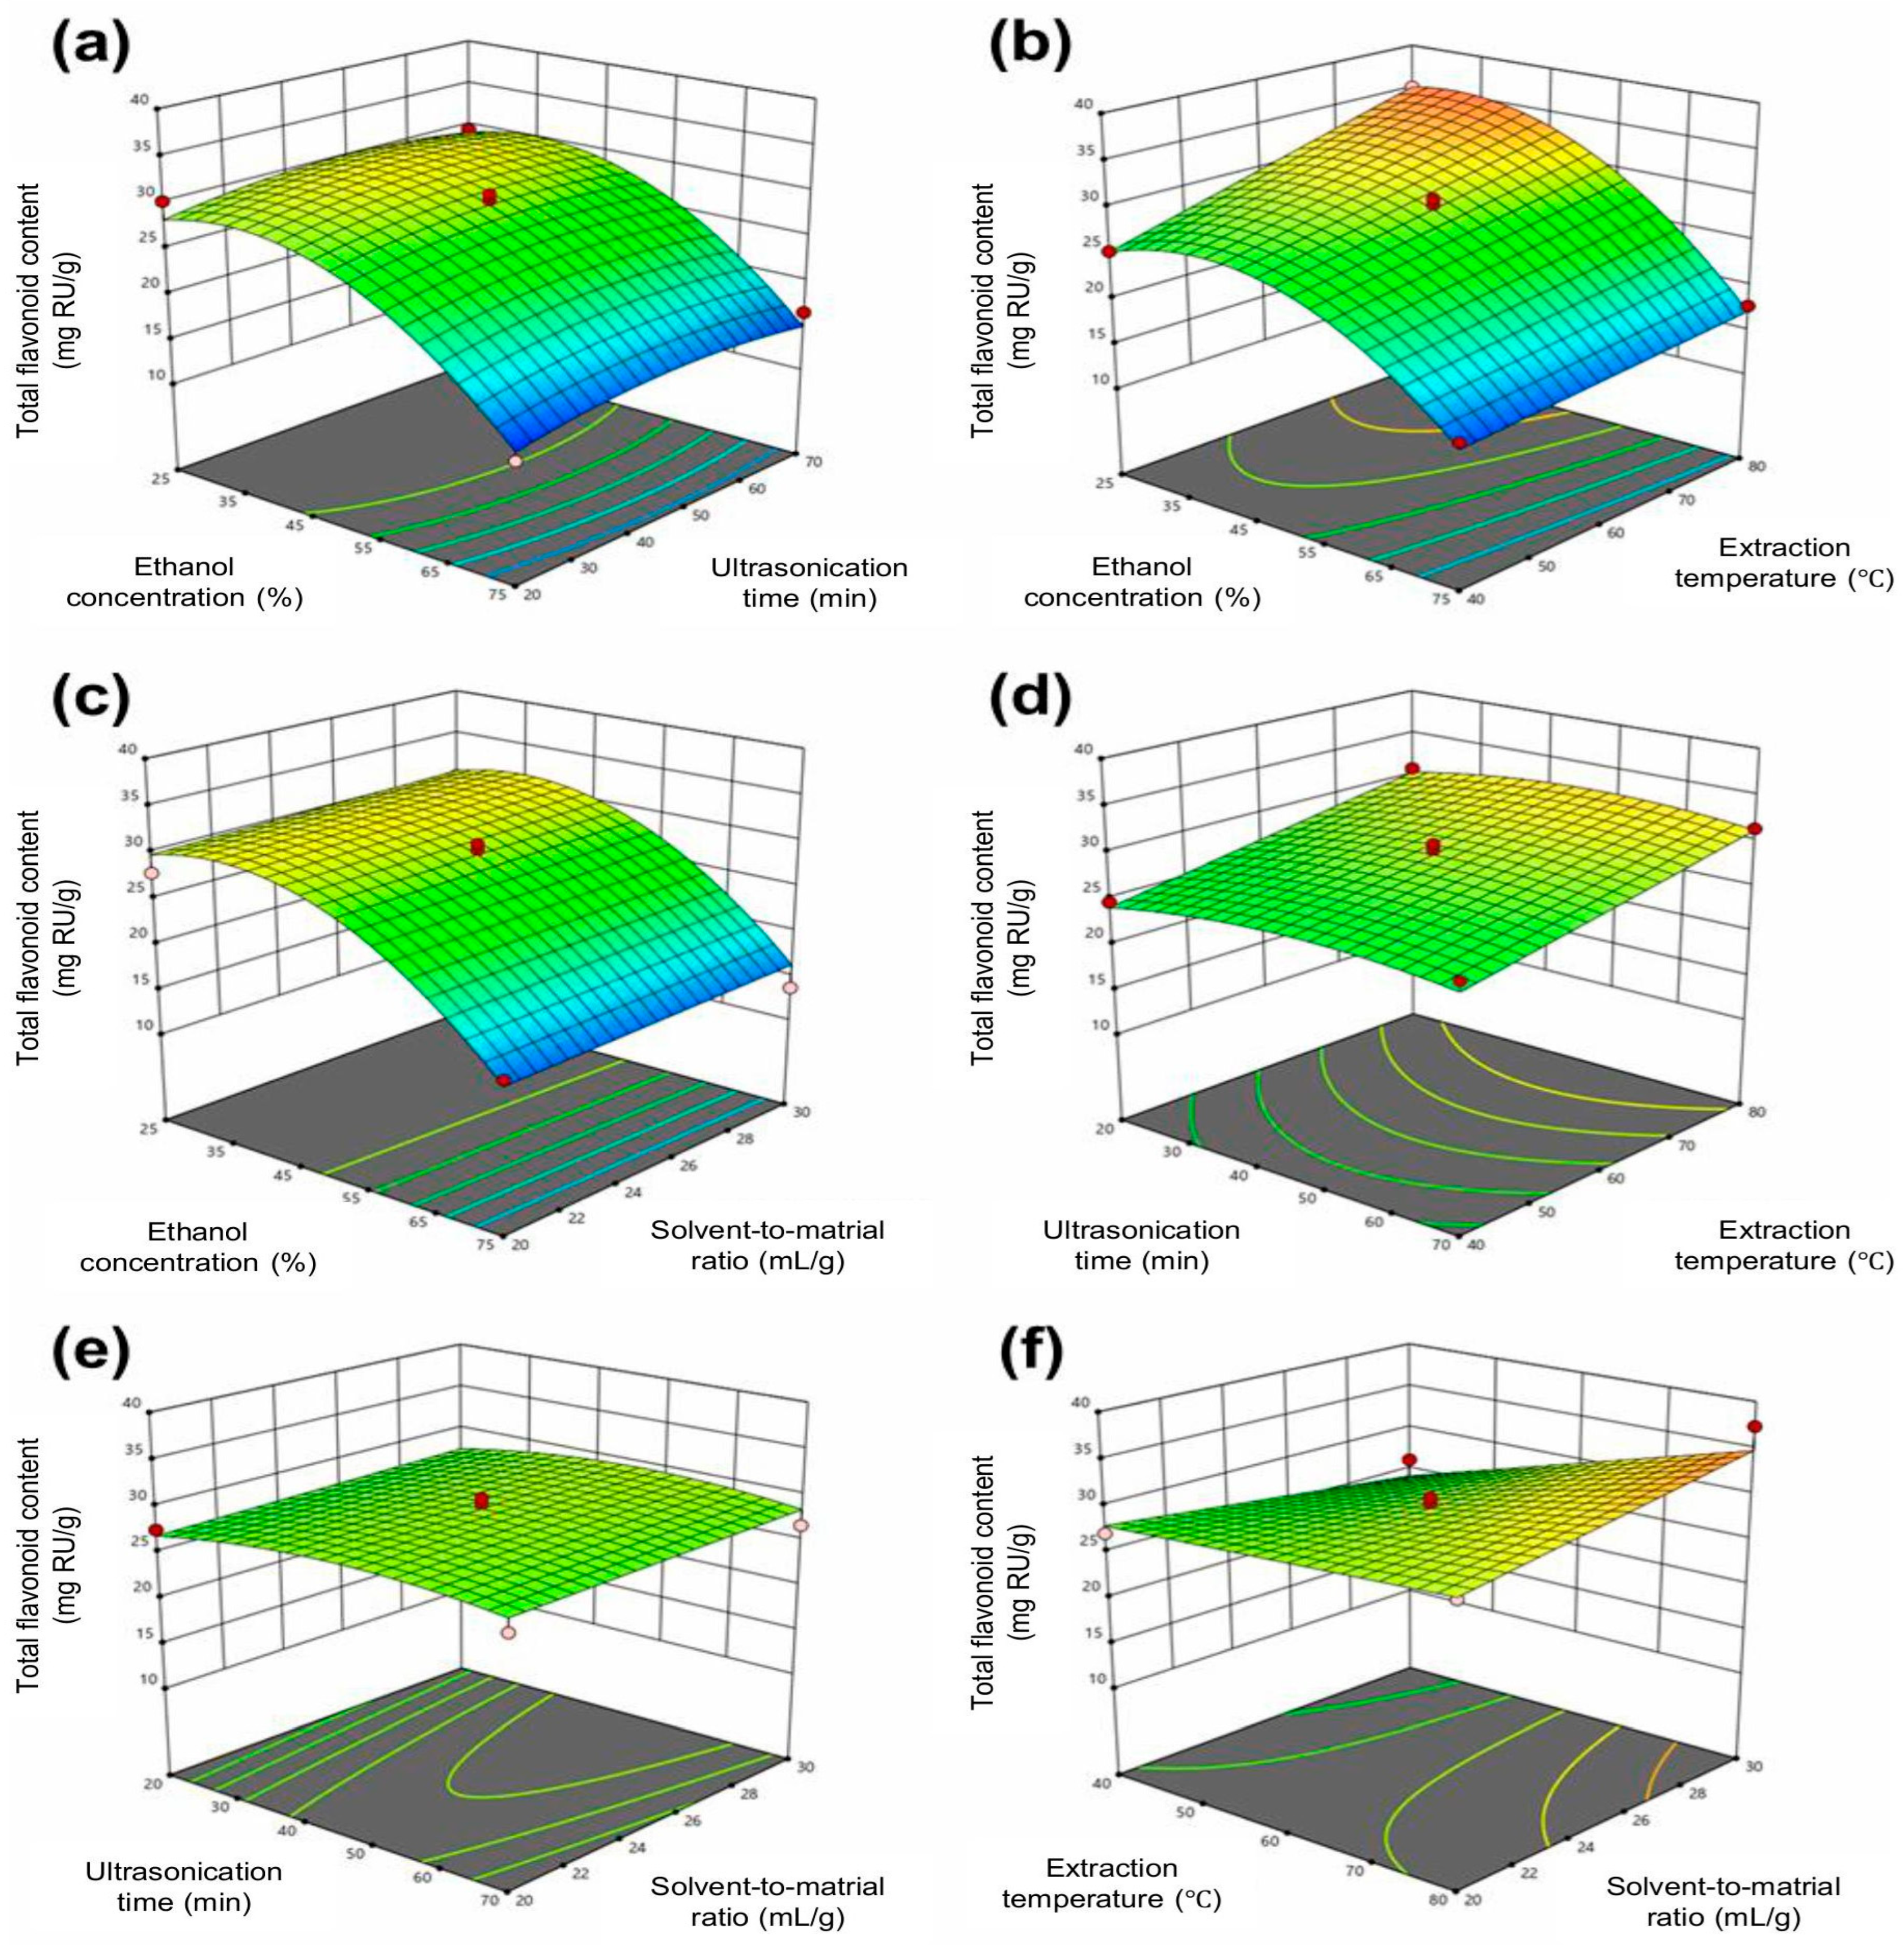
3.2. Extraction Optimization Results by Response Surface Methodology
Response Surface Optimization Analysis of Flavonoid Extraction Conditions
3.3. Development and Application of UV-Vis Spectroscopy to Determine Total Flavonoid Content
- -
- Intra-day precision: The RSD value of all TFC-determined samples was 1.89%, less than the allowable limit of 3.7% (for the concentration of analytes of 0.1%).
- -
- Inter-day precision: the same samples were analyzed on two different days, and the average of RSD was 2.21%, below 3.7%. F-Test Two-Sample for Variances and t-Test Two-Sample Assuming Equal Variances were used to test the variance and mean, respectively, of the two-day measurement data. The testing shows no significant difference, which indicates that the method met the precision requirements.
- -
- Accuracy: recoveries were 99.52 ± 2.07%, 102.28 ± 1.78%, 104.06 ± 0.79% for the concentration levels of 80%, 100% and 120%, respectively. At each level, the recovery rates were in the range of 95–105% and the RSD values were all less than 3.7%, which confirms that the method met the accuracy requirements.
3.4. A Comprehensive Greenness Assessment of the Workflow of Optimized Extraction and Quantification for Total Flavonoid Content
4. Conclusions
Author Contributions
Funding
Institutional Review Board Statement
Informed Consent Statement
Data Availability Statement
Acknowledgments
Conflicts of Interest
References
- Chi, V.V. Dictionary of Medicinal Plants of Vietnam, 2nd ed.; Hanoi Medical Publishing House: Hanoi, Vietnam, 2018; Volume 2. [Google Scholar]
- Sun, C.P.; Qiu, C.Y.; Yuan, T.; Nie, X.F.; Sun, H.X.; Zhang, Q.; Li, H.X.; Ding, L.Q.; Zhao, F.; Chen, L.X.; et al. Antiproliferative and Anti-inflammatory Withanolides from Physalis angulata. J. Nat. Prod. 2016, 79, 1586–1597. [Google Scholar] [CrossRef] [PubMed]
- Wu, J.; Zhao, J.; Zhang, T.; Gu, Y.; Khan, I.A.; Zou, Z.; Xu, Q. Naturally occurring physalins from the genus Physalis: A review. Phytochemistry 2021, 191, 112925. [Google Scholar] [CrossRef] [PubMed]
- Yang, J.; Sun, Y.; Cao, F.; Yang, B.; Kuang, H. Natural Products from Physalis alkekengi L. var. franchetii (Mast.) Makino: A Review on Their Structural Analysis, Quality Control, Pharmacology, and Pharmacokinetics. Molecules 2022, 27, 695. [Google Scholar] [CrossRef] [PubMed]
- Lima, L.G.B.; Montenegro, J.; Abreu, J.P.D.; Santos, M.C.B.; Nascimento, T.P.D.; Santos, M.D.S.; Teodoro, A.J. Metabolite profiling by UPLC-MSE, NMR, and antioxidant properties of amazonian fruits: Mamey apple (Mammea americana), camapu (physalis angulata), and uxi (endopleura uchi). Molecules 2020, 25, 342. [Google Scholar] [CrossRef] [PubMed]
- Yang, Y.; Chen, M.; Hu, L.; Zhu, D. Chemical Constituents of Whole Plant of Physalis angulata L. Chin. Pharm. J. 2013, 48, 1715–1718. [Google Scholar] [CrossRef]
- de Oliveira, A.M.; Malunga, L.N.; Perussello, C.A.; Beta, T.; Ribani, R.H. Phenolic acids from fruits of Physalis angulata L. in two stages of maturation. S. Afr. J. Bot. 2020, 131, 448–453. [Google Scholar] [CrossRef]
- Sultana, S.; Lawag, I.L.; Lim, L.Y.; Foster, K.J.; Locher, C. A Critical Exploration of the Total Flavonoid Content Assay for Honey. Methods Protoc. 2024, 7, 95. [Google Scholar] [CrossRef] [PubMed]
- Cetinkaya, A.; Yayla, S.; Hurkul, M.M.; Ozkan, S.A. Comprehensive review on chromatographic analysis of flavonoids in fruits. J. Chromatogr. Open 2025, 7, 100209. [Google Scholar] [CrossRef]
- Reddy, P.; Vijay, K.R.; Reddy, G.; Reddy, M.; Reddy, Y. Anti-diabetic and hypolipidemic effect of aqueous and methanolic root extracts of Physalis angulata in streptozotocin (STZ) induced diabetic rats. Int. J. Pharm. Res. Sch. 2014, 3, 402–409. [Google Scholar]
- Alara, O.R.; Abdurahman, N.H.; Ukaegbu, C.I. Soxhlet extraction of phenolic compounds from Vernonia cinereal leaves and its antioxidant activity. J. Appl. Res. Med. Aromat. Plants 2018, 11, 12–17. [Google Scholar] [CrossRef]
- Li, W.; Zhang, X.; Wang, S.; Gao, X.; Zhang, X. Research Progress on Extraction and Detection Technologies of Flavonoid Compounds in Foods. Foods 2024, 13, 628. [Google Scholar] [CrossRef] [PubMed]
- Song, L.; Liu, P.; Yan, Y.; Huang, Y.; Bai, B.; Hou, X.; Zhang, L. Supercritical CO2 fluid extraction of flavonoid compounds from Xinjiang jujube (Ziziphus jujuba Mill.) leaves and associated biological activities and flavonoid compositions. Ind. Crops Prod. 2019, 139, 111508. [Google Scholar] [CrossRef]
- Farzaneh, V.; Carvalho, I.S. Modelling of microwave assisted extraction (MAE) of anthocyanins (TMA). J. Appl. Res. Med. Aromat. Plants 2017, 6, 92–100. [Google Scholar] [CrossRef]
- Chaves, J.O.; de Souza, M.C.; da Silva, L.C.; Lachos-Perez, D.; Torres-Mayanga, P.C.; Machado, A.P.d.F.; Forster-Carneiro, T.; Vázquez-Espinosa, M.; González-de-Peredo, A.V.; Barbero, G.F.; et al. Extraction of Flavonoids From Natural Sources Using Modern Techniques. Front. Chem. 2020, 8, 507887. [Google Scholar] [CrossRef] [PubMed]
- Chemat, F.; Vian, M.A.; Cravotto, G. Green Extraction of Natural Products: Concept and Principles. Int. J. Mol. Sci. 2012, 13, 8615–8627. [Google Scholar] [CrossRef] [PubMed]
- Carniel, N.; Dallago, R.M.; Bilibio, D.; Nunes, A.L.; Bender, J.P.; Priamo, W.L. The effects of ultrasound-assisted extraction on polyphenolics compounds obtained from Physalis angulata using response surface approach. Acta Sci. Technol. 2018, 40, 35530. [Google Scholar] [CrossRef]
- Moreira, G.C.; de Souza Dias, F. Mixture design and Doehlert matrix for optimization of the ultrasonic assisted extraction of caffeic acid, rutin, catechin and trans-cinnamic acid in Physalis angulata L. and determination by HPLC DAD. Microchem. J. 2018, 141, 247–252. [Google Scholar] [CrossRef]
- Gałuszka, A.; Migaszewski, Z.M.; Konieczka, P.; Namieśnik, J. Analytical Eco-Scale for assessing the greenness of analytical procedures. TrAC Trends Anal. Chem. (Regul. Ed.) 2012, 37, 61–72. [Google Scholar] [CrossRef]
- Płotka-Wasylka, J. A new tool for the evaluation of the analytical procedure: Green Analytical Procedure Index. Talanta 2018, 181, 204–209. [Google Scholar] [CrossRef] [PubMed]
- Mansour, F.R.; Omer, K.M.; Płotka-Wasylka, J. A total scoring system and software for complex modified GAPI (ComplexMoGAPI) application in the assessment of method greenness. Green Anal. Chem. 2024, 10, 100126. [Google Scholar] [CrossRef]
- Pena-Pereira, F.; Wojnowski, W.; Tobiszewski, M. AGREE—Analytical GREEnness Metric Approach and Software. Anal. Chem. 2020, 92, 10076–10082. [Google Scholar] [CrossRef] [PubMed]
- Manousi, N.; Wojnowski, W.; Płotka-Wasylka, J.; Samanidou, V.F. Blue Applicability Grade Index (BAGI) and Software: A new tool for the evaluation of method’s practicality. Green Chem. 2023, 25, 7598. [Google Scholar] [CrossRef]
- Ramakrishna Pillai, J.; Wali, A.F.; Menezes, G.A.; Rehman, M.U.; Wani, T.A.; Arafah, A.; Zargar, S.; Mir, T.M. Chemical Composition Analysis, Cytotoxic, Antimicrobial and Antioxidant Activities of Physalis angulata L.: A Comparative Study of Leaves and Fruit. Molecules 2022, 27, 1480. [Google Scholar] [CrossRef] [PubMed]
- Azwanida, N.N. A review on the extraction methods use in medicinal plants, principle, strength and limitation. Med. Aromat. Plants 2015, 4, 1000196. [Google Scholar]
- Saeid, K.; Hossain, S.; Arezou, A.P.; Jamshid, M.; Amin, S. Optimization of ultrasound-assisted extraction of colchicine compound from Colchicum haussknechtii by using response surface methodology. J. Saudi Soc. Agric. Sci. 2017, 16, 163–170. [Google Scholar] [CrossRef]
- Tagrida, M.; Benjakul, S. Betel (Piper betle L.) leaf ethanolic extracts dechlorophyllized using different methods: Antioxidant and antibacterial activities, and application for shelf-life extension of Nile tilapia (Oreochromis niloticus) fillets. RSC Adv. 2021, 11, 17630–17641. [Google Scholar] [CrossRef] [PubMed]
- Lichtenthaler, H.K.; Buschmann, C. Chlorophylls and Carotenoids: Measurement and Characterization by UV-VIS Spectroscopy. Curr. Protoc. Food Anal. Chem. 2001, 1, F4.3.1–F4.3.8. [Google Scholar] [CrossRef]
- Christ, B.K.H.M. On the serial determination of the content of flavonol derivatives in drugs. Arch. Pharm. Berichte Dtsch. Pharm. Ges. 1960, 293, 1033–1042. [Google Scholar] [CrossRef] [PubMed]
- AF-1 Guidelines for Standard Method Performance Requirements. In Official Methods of Analysis of AOAC International; Oxford University Press: Oxford, UK, 2023. [CrossRef]
- Annegowda, H.V.; Anwar, L.N.; Mordi, M.N.; Ramanathan, S.; Mansor, S.M. Influence of sonication on the phenolic content and antioxidant activity of Terminalia catappa L. leaves. Pharmacogn. Res. 2010, 2, 368–373. [Google Scholar] [CrossRef] [PubMed]
- Hao, J.; Han, W.; Huang, S.; Xue, B.; Deng, X. Microwave-assisted extraction of artemisinin from Artemisia annua L. Sep. Purif. Technol. 2002, 28, 191–196. [Google Scholar] [CrossRef]
- Zhao, C.N.; Zhang, J.J.; Li, Y.; Meng, X.; Li, H.B. Microwave-assisted extraction of phenolic compounds from melastoma sanguineum fruit: Optimization and identification. Molecules 2018, 23, 2498. [Google Scholar] [CrossRef] [PubMed]
- Rodriguez, M.I. Subcritical Water Extraction and Characterization of Bioactive Compounds from Haematococcus pluviales microalga. J. Pharm. Biomed. Anal. 2013, 51, 456–463. [Google Scholar] [CrossRef] [PubMed]
- Kim, Y.C.; Higuchi, R.; Kitamura, Y.; Komori, T. Thermal Degradation of Glycosides, IV. Degradation of flavonoid glycosides. Liebigs Ann. Chem. 1991, 1991, 1285–1289. [Google Scholar] [CrossRef]
- Sharifi, A.; Mortazavi, S.A.; Maskooki, A.; Niakousari, M.; Elhamirad, A.H. Optimization of subcritical water extraction of bioactive compounds from barberry fruit (Berberis vulgaris) by using response surface methodology. Int. J. Agric. Crop Sci. 2013, 6, 89–96. [Google Scholar]
- Giordano, M.; Pinela, J.; Dias, M.I.; Calhelha, R.C.; Stojkovi’c, D.; Sokovi’c, M.; Tavares, D.; Cánepa, A.L.; Ferreira, I.C.; Caleja, C. Ultrasound-assisted extraction of flavonoids from kiwi peel: Process optimization and bioactivity assessment. Appl. Sci. 2021, 11, 6416. [Google Scholar] [CrossRef]
- Zhang, G.; He, L.; Hu, M. Optimized ultrasonic-assisted extraction of flavonoids from Prunella vulgaris L. and evaluation of antioxidant activities in vitro. Innov. Food Sci. Emerg. Technol. 2011, 12, 18–25. [Google Scholar] [CrossRef]
- Soares, L.F.; Machado, L.C.; Santos, E.J.P.d.; Bezerra, D.G.; Borges, L.L.; Amaral, V.C.S.; de Paula, J.R.; de Paula, J.A.M. Determination and validation of spectrophotometric analytical method for quantification of total flavonoids in the leaves of Azadirachta indica A. Juss. (Meliacease) and optimization of the ultrasound-assisted extraction conditions. Res. Soc. Dev. 2022, 11, e9211326135. [Google Scholar] [CrossRef]
- Woisky, R.G.; Salatino, A. Analysis of propolis: Some parameters and procedures for chemical quality control. J. Apic. Res. 1998, 37, 99–105. [Google Scholar] [CrossRef]
- Chang, C.; Yang, M.; Wen, H.; Chern, J. Estimation of total flavonoid content in propolis by two complementary colorimetric methods. J. Food Drug Anal. 2002, 10, 3. [Google Scholar] [CrossRef]
- Pekal, A.; Pyrzynska, K. Evaluation of aluminium complexation reaction for flavonoid content assay. Food Anal. Methods 2014, 7, 1776–1782. [Google Scholar] [CrossRef]
- Smyslova, O.A.; Bokov, D.O.; Potanina, O.G.; Litvinova, T.M.; Samylina, I.A. Development and validation of spectrophotometric procedure for quantitative determination of flavonoid content used to control the quality of mixture herbal product. J. Adv. Pharm. Technol. Res. 2019, 10, 155–162. [Google Scholar] [CrossRef] [PubMed]
- Sultana, S.; Hossain, M.L.; Sostaric, T.; Lim, L.Y.; Foster, K.J.; Locher, C. Investigating Flavonoids by HPTLC Analysis Using Aluminium Chloride as Derivatization Reagent. Molecules 2024, 29, 5161. [Google Scholar] [CrossRef] [PubMed]
- Shraim, A.M.; Ahmed, T.A.; Rahman, M.M.; Hijji, Y.M. Determination of total flavonoid content by aluminum chloride assay: A critical evaluation. LWT—Food Sci. Technol. 2021, 146, 111932. [Google Scholar] [CrossRef]
- Agati, G.; Azzarello, E.; Pollastri, S.; Tattini, M. Flavonoids as antioxidants in plants: Location and functional significance. Plant Sci. 2012, 196, 67–76. [Google Scholar] [CrossRef] [PubMed]
- Jansen, M.A.K.; Gaba, V.; Greenberg, B.M. Higher plants and UV-B radiation: Balancing damage, repair and acclimation. Trends Plant Sci. 1998, 3, 131–135. [Google Scholar] [CrossRef]
- Stewart, A.J.; Chapman, W.; Jenkins, G.I.; Graham, I.; Martin, T.; Crozier, A. The effect of nitrogen and phosphorus deficiency on flavonol accumulation in plant tissues. Plant Cell Environ. 2001, 24, 1189–1197. [Google Scholar] [CrossRef]
- Nguyen, K.N.H.; Nguyen, N.V.T.; Kim, K.H. Determination of phenolic acids and flavonoids in leaves, calyces, and fruits of Physalis angulata L. in Viet Nam. Pharmacia 2021, 68, 501–509. [Google Scholar] [CrossRef]
- Ratna, F.S.; Kevin, K.; Amadea, V.; Ignatius, J.R. Total Phenol, Flavanoid and Antioxidant Activity of Physalis angulata Leaves Extract by Subcritical Water Extraction. Mod. Appl. Sci. 2015, 9, 190–198. [Google Scholar] [CrossRef]
- Ushie, O.A.; Iyen, S.I.; Abeng, F.E.; Azuaga, T.I.; Okpaegbe, U.C.; Aikhoje, E.F. Quantification of Alkaloids, Flavonoids and Saponins in Physalis angulata and Mucuna pruriens. Rec. Chem. Sci. (FRsCS) 2019, 1, 86–89. [Google Scholar]
- Chandarana, C.; Juwarwala, I.; Shinde, R. UV Derivative Spectroscopy: A Comprehensive Review for Advancement in Quantification. Pharm. Chem. J. 2025, 58, 1755–1773. [Google Scholar] [CrossRef]
- Olvera-Aguirre, G.; Mendoza-Taco, M.M.; Moo-Huchin, V.M.; Lee-Rangel, H.A.; Roque-Jiménez, J.A.; Gómez-Vázquez, A.; Dzib-Cauich, D.A.; Vargas-Bello-Pérez, E.; Chay-Canul, A.J. Effect of Extraction Type on Bioactive Compounds and Antioxidant Activity of Moringa oleifera Lam. Leaves. Agriculture 2022, 12, 1462. [Google Scholar] [CrossRef]

| Chlorophyll Removal Methods | Chlorophyll Removal Yields (%) | TFC (mg RU/g) | |
|---|---|---|---|
| Before Removal | After Removal | ||
| Liquid–liquid extraction with hexane | 32.00 ± 7.30 | 18.25 ± 0.61 * | 19.17 ± 0.17 * |
| Sedimentation | 94.46 ± 0.52 | 18.93 ± 1.26 ** | 9.23 ± 1.36 ** |
| Independent Variables | Abbreviations | Value Levels | |||
|---|---|---|---|---|---|
| Mark | Code | Min (−1) | Centre (0) | Max (+1) | |
| Ethanol concentration (%) | C | X1 | 25 | 50 | 75 |
| Sonication time (minute) | T | X2 | 20 | 45 | 70 |
| Extraction temperature (°C) | T | X3 | 40 | 60 | 80 |
| Solvent-to-material ratio (mL/g) | D | X4 | 20 | 25 | 30 |
| Dependent variable | Requirement | ||||
| Total flavonoid contents (mg RU/g) | TFC | Y | Maximum | ||
| No | Samples | Code | Independent Variables | Dependent Variables | |||
|---|---|---|---|---|---|---|---|
| X1 (%) | X2 (min) | X3 (°C) | X4 (mL/g) | TFC (mg RU/g) | |||
| 1 | A1 | −−00 | 25 | 20 | 60 | 25 | 30.22 |
| 2 | A2 | −00− | 25 | 45 | 60 | 20 | 27.90 |
| 3 | C1 | −0−0 | 25 | 45 | 40 | 25 | 25.28 |
| 4 | B1 | −0+0 | 25 | 45 | 80 | 25 | 35.09 |
| 5 | A3 | −00+ | 25 | 45 | 60 | 30 | 29.92 |
| 6 | A4 | −+00 | 25 | 70 | 60 | 25 | 29.49 |
| 7 | D1 | 0−0− | 50 | 20 | 60 | 20 | 27.55 |
| 8 | C2 | 0—0 | 50 | 20 | 40 | 25 | 24.72 |
| 9 | B2 | 0−+0 | 50 | 20 | 80 | 25 | 30.75 |
| 10 | E1 | 0−0+ | 50 | 20 | 60 | 30 | 24.83 |
| 11 | C3 | 00−− | 50 | 45 | 40 | 20 | 27.10 |
| 12 | B3 | 00+− | 50 | 45 | 80 | 20 | 29.49 |
| 13 | D2 | 0000 | 50 | 45 | 60 | 25 | 27.02 |
| 14 | D3 | 0000 | 50 | 45 | 60 | 25 | 30.36 |
| 15 | E2 | 0000 | 50 | 45 | 60 | 25 | 29.68 |
| 16 | G1 | 00−+ | 50 | 45 | 40 | 30 | 26.18 |
| 17 | F1 | 00++ | 50 | 45 | 80 | 30 | 37.35 |
| 18 | D4 | 0+0− | 50 | 70 | 60 | 20 | 26.34 |
| 19 | C4 | 0+−0 | 50 | 70 | 40 | 25 | 26.11 |
| 20 | B4 | 0++0 | 50 | 70 | 80 | 25 | 31.36 |
| 21 | E3 | 0+0+ | 50 | 70 | 60 | 30 | 26.69 |
| 22 | H1 | +−00 | 75 | 20 | 60 | 25 | 13.08 |
| 23 | E4 | +00− | 75 | 45 | 60 | 20 | 16.27 |
| 24 | G2 | +0−0 | 75 | 45 | 40 | 25 | 15.45 |
| 25 | F2 | +0+0 | 75 | 45 | 80 | 25 | 17.75 |
| 26 | H2 | +00+ | 75 | 45 | 60 | 30 | 13.62 |
| 27 | H3 | ++00 | 75 | 70 | 60 | 25 | 16.51 |
| Sources | Sum of Mean Squares | Degrees of Freedom | Mean of Square | F-Value | p-Value |
|---|---|---|---|---|---|
| Model | 1019.27 | 14 | 72.81 | 30.43 | <0.0001 |
| X1 | 604.93 | 1 | 604.93 | 252.85 | <0.0001 |
| X2 | 2.38 | 1 | 2.38 | 0.9967 | 0.3378 |
| X3 | 113.76 | 1 | 113.76 | 47.55 | <0.0001 |
| X4 | 1.29 | 1 | 1.29 | 0.5382 | 0.4773 |
| X1X2 | 4.33 | 1 | 4.33 | 1.81 | 0.2036 |
| X1X3 | 14.09 | 1 | 14.09 | 5.89 | 0.0319 |
| X1X4 | 5.46 | 1 | 5.46 | 2.28 | 0.1567 |
| X2X3 | 0.1489 | 1 | 0.1489 | 0.0623 | 0.8072 |
| X2X4 | 2.36 | 1 | 2.36 | 0.9857 | 0.3404 |
| X3X4 | 19.28 | 1 | 19.28 | 8.06 | 0.0149 |
| X12 | 196.17 | 1 | 196.17 | 82.00 | <0.0001 |
| X22 | 10.88 | 1 | 10.88 | 4.55 | 0.0543 |
| X32 | 4.73 | 1 | 4.73 | 1.98 | 0.1849 |
| X42 | 2.84 | 1 | 2.84 | 1.19 | 0.2971 |
| Residues | 28.71 | 12 | 2.39 | ||
| Model fit error | 22.47 | 10 | 2.25 | 0.7203 | 0.7063 |
| Random error | 6.24 | 2 | 3.12 | ||
| Sum | 1047.98 | 26 | |||
| R2: 0.9726, Adjusted R2: 0.9406, Predicted R2: 0.8631 | |||||
| Suitability: 19.9602, CV (%): 6.00 | |||||
| Optimal Values | TFC (mg RU/g) | ||||
|---|---|---|---|---|---|
| Ethanol Concentration (%) | Sonication Time (min) | Extraction Temperature (°C) | Solvent-to-Material Ratio (g/mL) | Predicted | Experimental |
| 31.66% | 48.73 | 80 °C | 1:30 | 38.09 ± 1.70 * | 34.58 ± 0.87 * |
| Eco-Scale Score | AGREE | |
|---|---|---|
| Reagent | Penalty Points | 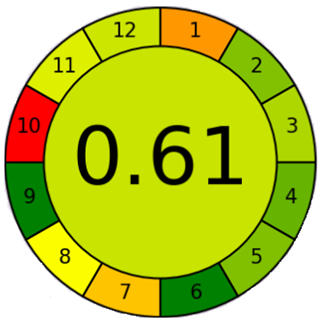 |
| Ethanol | 4 | |
| Sodium hydroxide | 2 | |
| ∑ | 6 | |
| Instrument | Penalty points | |
| UV-Vis | 0 | |
| Occupational hazards | 0 | |
| Wates (25 mL) | 5 | |
| No treatment | 3 | |
| ∑ | 8 | |
| Total penalty points | 14 | |
| Eco-Scale score | 86 | |
ComplexMo GAPI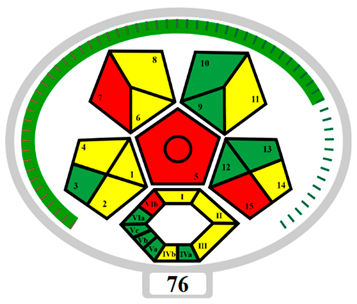 | BAGI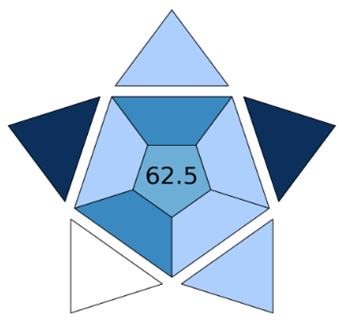 | |
Disclaimer/Publisher’s Note: The statements, opinions and data contained in all publications are solely those of the individual author(s) and contributor(s) and not of MDPI and/or the editor(s). MDPI and/or the editor(s) disclaim responsibility for any injury to people or property resulting from any ideas, methods, instructions or products referred to in the content. |
© 2025 by the authors. Licensee MDPI, Basel, Switzerland. This article is an open access article distributed under the terms and conditions of the Creative Commons Attribution (CC BY) license (https://creativecommons.org/licenses/by/4.0/).
Share and Cite
Anh, H.T.M.L.; Ngan, L.P.M.M.K.; Khuyen, V.T.K.; Anh, L.N.H.; Bao, H.H.G.; Ngoc, H.L.B.; Anh, Đ.T.Q. A Green Workflow to Determine Flavonoids from Physalis angulata L.: Extraction Optimization by Response Surface Method and Spectrophotometric Method Validation. Spectrosc. J. 2025, 3, 27. https://doi.org/10.3390/spectroscj3040027
Anh HTML, Ngan LPMMK, Khuyen VTK, Anh LNH, Bao HHG, Ngoc HLB, Anh ĐTQ. A Green Workflow to Determine Flavonoids from Physalis angulata L.: Extraction Optimization by Response Surface Method and Spectrophotometric Method Validation. Spectroscopy Journal. 2025; 3(4):27. https://doi.org/10.3390/spectroscj3040027
Chicago/Turabian StyleAnh, Huynh Tran Mai Lan, Le Phan Minh My Kim Ngan, Vo Thi Kim Khuyen, Le Nguyen Hong Anh, Huynh Hoang Gia Bao, Huynh Le Bao Ngoc, and Đinh Thi Quynh Anh. 2025. "A Green Workflow to Determine Flavonoids from Physalis angulata L.: Extraction Optimization by Response Surface Method and Spectrophotometric Method Validation" Spectroscopy Journal 3, no. 4: 27. https://doi.org/10.3390/spectroscj3040027
APA StyleAnh, H. T. M. L., Ngan, L. P. M. M. K., Khuyen, V. T. K., Anh, L. N. H., Bao, H. H. G., Ngoc, H. L. B., & Anh, Đ. T. Q. (2025). A Green Workflow to Determine Flavonoids from Physalis angulata L.: Extraction Optimization by Response Surface Method and Spectrophotometric Method Validation. Spectroscopy Journal, 3(4), 27. https://doi.org/10.3390/spectroscj3040027


