Article

Electro-Tunable Optical Cavity Filters in the Mid-Infrared Regime: A Polarization-Independent Solution for Hyperspectral Imaging

1
Key Laboratory of Optoelectronic Devices and Systems of Ministry of Education of Guangdong Province, College of Physics and Optoelectronic Engineering, Shenzhen University, Shenzhen 518060, China
2
Department of Physics and Applied Mathematics, Pakistan Institute of Engineering and Applied Sciences (PIEAS), Islamabad 45650, Pakistan
3
Department of Physics, College of Science, Imam Mohammad Ibn Saud Islamic University (IMSIU), Riyadh 13318, Saudi Arabia
4
School of Physics and Optoelectronic Engineering, Beijing University of Technology, Beijing 100124, China
*
Author to whom correspondence should be addressed.
Spectrosc. J. 2025, 3(4), 26; https://doi.org/10.3390/spectroscj3040026 (registering DOI)
Submission received: 9 September 2025 / Revised: 29 September 2025 / Accepted: 22 October 2025 / Published: 27 October 2025

Abstract

The development of tunable optical filters in the mid-infrared (MIR) region is crucial for a variety of applications, including environmental monitoring, medical diagnostics, and communication systems. This paper presents the design, fabrication, and characterization of a novel Twisted Liquid Crystal (TLC) electro-tunable optical cavity filter for the MIR region 3–5 μm. The filter is based on a Fabry–Perot interferometer configuration, which includes a polarization-independent TLC to achieve electrical control over the filter’s transmission characteristics. Two distinct filters were fabricated, differing in their substrate materials: silicon and glass. The silicon-based filter demonstrated an impressive 80% transmission with a tuning range of ∼13.6 nm and ∼14.64 nm in two separate bands, achieved by varying the applied voltage from 0 to 20 V. In contrast, the glass substrate filter exhibited a slightly higher transmission of 82% with tuning ranges of ∼10.5 nm and ∼7.2 nm across the spectral band when the voltage was adjusted from 0 to 27 V. Experimental validation showed a strong alignment between the simulations and results, demonstrating the feasibility of integrating tunable liquid crystals into mid-infrared optical cavities. This advancement highlights their potential for applications that require precise and dynamic control of the mid-infrared spectrum.

1. Introduction

Nanostructured materials exhibit distinctive physical and optical properties and are extensively employed in current research and the development of electro- and nonlinear optical materials for optoelectronic applications [1].
Traditionally, several approaches can be used to attain tunability in optical cavity filters, such as adjusting the thickness or varying the refractive index of the cavity. Variation in cavity thickness is typically achieved by mechanically adjusting the mirrors (e.g., with a piezo actuator), which in turn shifts the resonance wavelength [2,3], while the latter is accomplished either by variation in temperature or by varying the externally applied voltage in the cavity [4]. To make the Fabry–Perot cavity polarization-insensitive, blue-phase liquid crystals and adjustable half-wave plates (HWPs) are most commonly used [5,6]. Tuning can be achieved by adjusting the thickness, but a mechanical force is required to vary the optical length. However, in this method, applying a force may result in non-parallel reflections. Tuning can also be accomplished by varying the temperature, as the refractive index of the cavity changes with temperature variation. This dependence of the refractive index on the temperature is known as the thermo-optic effect (TOE). In the case of thermally tunable filters, care is required to select materials that maintain their optical and mechanical performance over the intended operating temperature range. While the variation in voltage, the refractive index of the LC varies, which results in a shift in the transmitted filtered wavelength peaks, providing a highly efficient, fast and accurate way to control light transmission. The dependence of the refractive index on voltage is known as the electro-optic effect [7,8,9]. In our study, the second approach was employed as the most convenient for tuning purposes.
Liquid crystal Fabry–Perot cavities are extensively used in tunable devices because of their remarkable advantages, including a wide tuning range (typically 50–100 nm), firmness, low power consumption, simple fabrication process, and high stability [10,11,12]. Such devices are compatible with nearly all the widely used optoelectronic materials because they offer extraordinary broadband [UV-Far infrared] transparency and vast optical birefringence. LC tunable Fabry–Perot filters also serve as optical resonators, as they offer a high resolution and ultra-fine optical filtering [11,12,13,14,15,16,17,18].
While conventional tunable filters are designed to be polarization-insensitive, a desirable feature, this requirement constrains their design and makes it more difficult to extend the spectral tuning range, limiting their suitability for hyperspectral imaging (HSI) and wavelength division multiplexing (WDM) applications. A Liquid Crystal Tunable Filter (LCTF) is an ultimate wideband and tunable spectral solution widely utilized in hyperspectral imaging systems to successively acquire different spectral bands, enabling dynamic adjustment of the transmitted wavelength [19,20,21]. These filters offer wavelength-selective properties in a sufficient number of spectral channels, making them ideal for HSI [22,23,24].
Under normal incidence, the wavelength tunability of the conventional Fabry–Perot structures is sensitive to the polarization direction of the incident light relative to the optical axis of the LC film. Oblique incidence can further complicate the polarization response. Because Nematic Liquid Crystal (NLC) molecules exhibit anisotropic behavior, tunability in the LC Fabry–Perot cavity is usually governed by the molecular alignment alteration of the active medium in the cavity. Nematic liquid crystals (NLCs) refer to the phase of liquid crystals where molecules do not have positional order but have directional order, which means that molecules have long-range orientational order. The rod-like molecules in nematic liquid crystals do not have an arranged center of mass in a regular lattice; therefore, they tend to align parallel to each other. This unique orientational order can be manipulated using electric or magnetic fields, allowing for the control of optical properties, such as birefringence and anisotropic light propagation. Specifically, the alignment of nematic liquid crystal molecules influences the refractive indices along different axes, allowing for the selective transmission or reflection of specific wavelengths. This property is widely used in tunable optical filters, wavelength-selective switches, and adaptive lenses in display technologies, where precise control of the light polarization and wavelength is required [11]. The insensitivity of filters to polarization can be achieved in the fabrication process by using a twisted molecular assembly with an axially deformed state of the NLC [11,25].
In this article, the fundamental design of Twisted Nematic Liquid Crystal (TNLC) optical cavity filters, simulation work to investigate the tunable properties of filters in the MIR regime, and fabrication and characterization of polarization-independent Fabry–Perot cavities functioning at different voltages are reported. The fabricated filters exhibited reasonably good electro-optic tuning in a single and multiple band with a high transmittance efficiency and narrow FWHM at almost all applied voltages. The simulation analysis for the designed filters was in good agreement with the experimental results.

2. Theoretical Background

The LC is employed in the Fabry–Perot cavity for refractive index tuning by varying the strength of the applied electric field. The DC Kerr effect describes that the electric field (E) and index difference or birefringence (Δn) have a quadratic relation [26,27,28,29], given by:
n = λ β E 2
where λ is the wavelength, and β is the optical Kerr constant. One of the simplest ways to achieve polarization insensitivity is to employ Twisted Nematic Liquid Crystal (TNLC) layers in the Fabry–Perot cavity. A reduction in anisotropy was observed when an electric field was applied to the LCTF, leading to the coupling and mixing of modes at higher voltages. This behavior contributed to the polarization-independent properties of the filter. The Mauguin condition (Δn d >> λ 2 ) should be fulfilled to remove elliptically polarized light. Under this condition, the transmission of the Fabry–Perot cavity is given by [30,31,32].
T = 1 A 1 R 2 1 1 + 4 R 1 R 2 sin 2 2 π n d c o s θ λ ø
where R is the reflectance, A is the absorbance, n is the corresponding refractive index of the liquid crystal, λ is the wavelength, d is the thickness of the cell, θ is the angle of incidence, and ø is the phase shift due to reflection. According to the law of energy conservation (T + R + A = 1), this relationship is simplified under the conditions where the incident angle θ = 0 (normal incidence) and the phase shift ϕ = π (which typically corresponds to a 180° phase change in reflection). Simplification of Equation (2) under θ = 0 and ø = π; and law of conversation yield Equation (3).
T = 1 A 1 R 2 1 1 + 4 R 1 R 2 sin 2 2 π n d λ
Alignment layers were made along the mirror surfaces to achieve the parallel and perpendicular orientations of the TNLC molecules relative to the optical axis in the Fabry–Perot cavity [11,33,34,35]. For vertically and parallel aligned cells, the optical axes are oriented perpendicular and parallel to the substrate surface, respectively. When an electric field is applied, the director (not the optical axis) of the LC molecules reorients owing to dielectric anisotropy, causing the optical axis to rotate. This reorientation is governed by the difference in electric permittivity along and perpendicular to the director and is given by:
Δ ε   =   ε     ε
where the electric permittivity parallel to the optical axis (or director) is denoted as ε and ε denotes the electric permittivity perpendicular to the optical axis (or director). The dielectric anisotropy, Δε, plays a critical role in determining the reorientation of the liquid crystal molecules under an applied electric field, which in turn affects the optical properties of the Fabry–Perot cavity.

3. Design and Simulation

In our first designed filter, an LC layer of 1.2 μm was sandwiched between an ITO electrode and an Ag mirror deposited on Si substrates, while glass substrates were used in the second filter. Silicon, which is a suitable optical material for transmission in the infrared regime, was used as a substrate in the first-designed filter with the deposition of an indium tin oxide (ITO) thin film for electrode purposes. Silver is deposited to serve as a highly reflective mirror in the Fabry–Perot cavity. Its reflectance is chosen to be sufficiently high (typically > 90%) to achieve the desired cavity performance. When light passes through the cavity, interference occurs owing to multiple internal reflections between the mirror layers, resulting in light transmission through the cavity.
Nematic Liquid Crystals (NLCs) exhibit birefringence due to the presence of two distinct refractive indices, which results in different propagation speeds of light polarized parallel and perpendicularly to the director. In NLCs, the dielectric constants parallel to the director (εk) and perpendicular to the director (ε) are different, leading to the birefringence effect. When an external electric field is applied, body torque is induced on the LC molecules; such dielectric anisotropy results in the re-orientation of the director subsequent to a change in the extraordinary refractive index, as given by Equation (4). Thus, the wavelength peaks are tuned by the applied voltages, and various channels can be electrically selected.
Figure 1 shows a schematic of the proposed LCTFs. In this work, the NLC layer is initially aligned perpendicular to the optical axis. For liquid crystals with positive dielectric anisotropy (Δε > 0), the application of an external electric field causes the LC molecules to reorient along the direction of the field E. According to the Fréedericksz effect, this reorientation begins at a specific threshold voltage, denoted as Vth [33], and complete molecular alignment is achieved at voltages higher than Vth, given by
V t h = π k 11 ε Δ ε
where k 11 is splay elastic constant that characterize elastic interactions between molecules of NLC, ε is electric permittivity for free space (8.85 pF/m), Δε is dielectric anisotropy. At 25 °C and 1 kHz frequency, the elastic constant is k 11 = 6.38 pN [36], and the dielectric anisotropy is 12.04 [37,38,39]. Although the cell employs a twisted nematic configuration, the initial reorientation of LC molecules near the threshold voltage can be approximated using the standard Fréedericksz threshold voltage expression for a planar-aligned cell Equation (5).
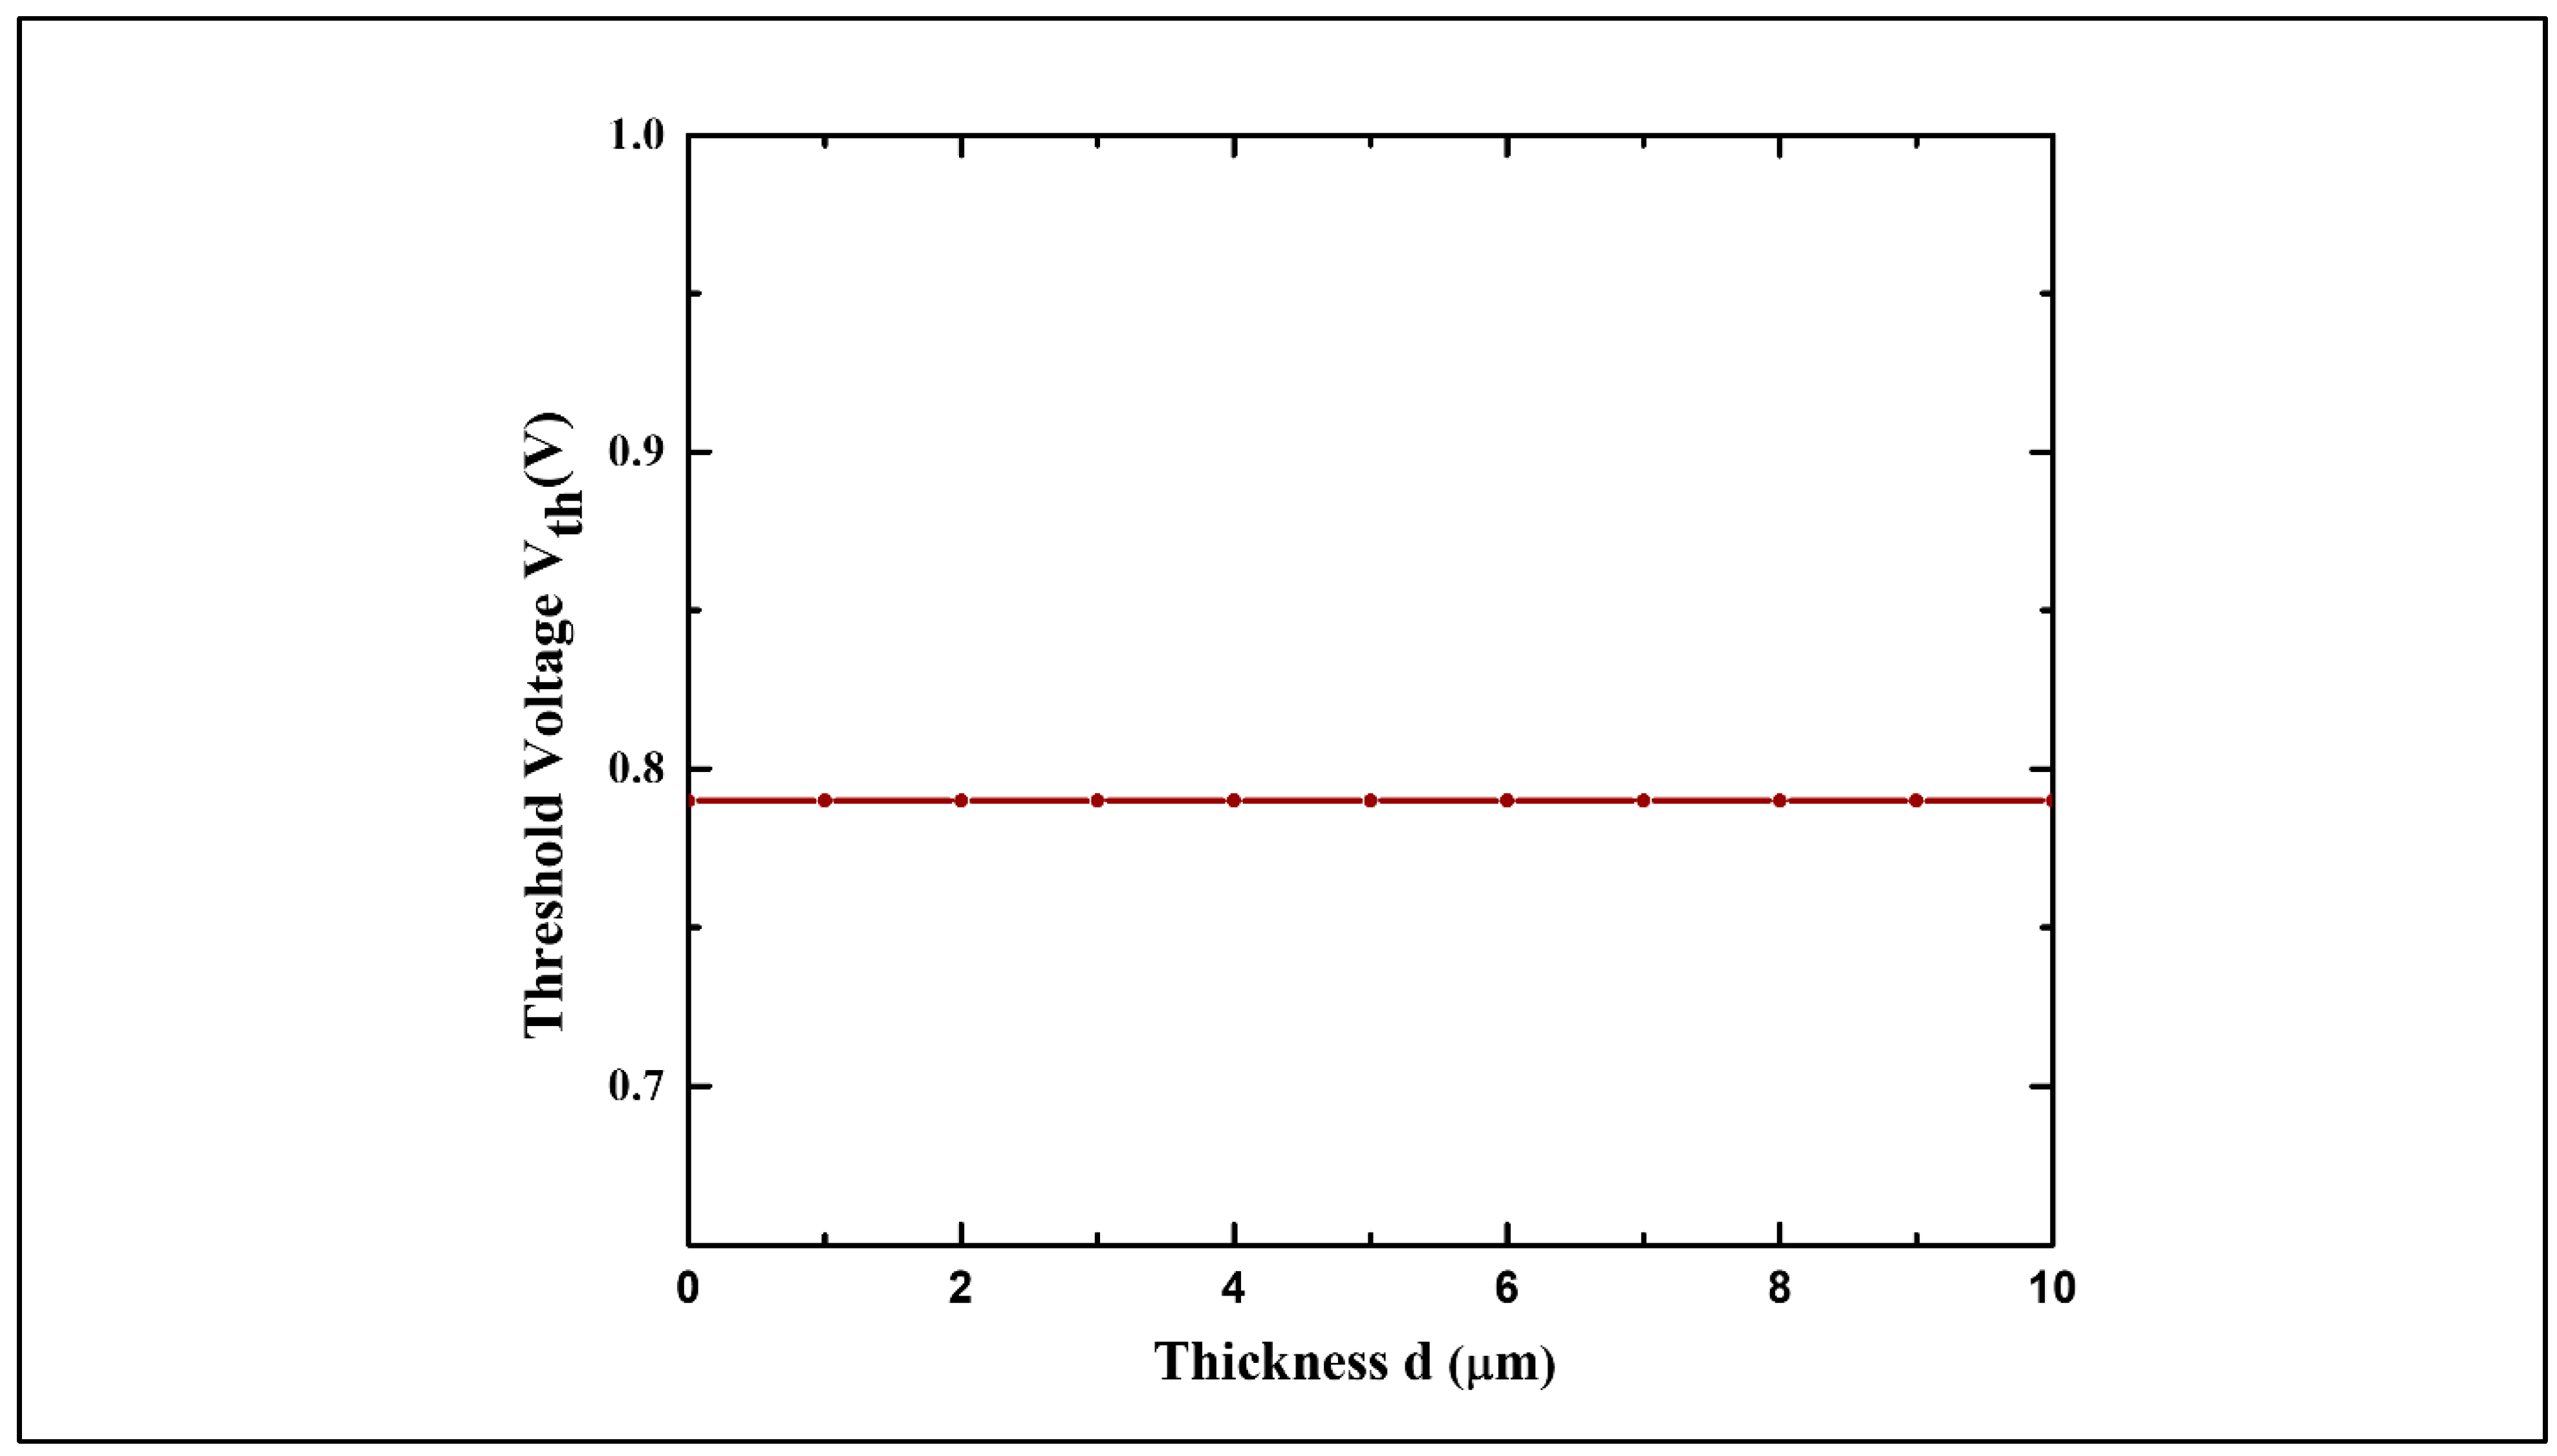
Figure 2 shows the 5CB NLC Fredericksz threshold voltage, 0.79 V, at a frequency of 1 kHz and a temperature of 25 °C. It is evident from Equation (5) that the threshold voltage is primarily determined by the intrinsic properties of the material rather than by the thickness of the layer. This relationship is further illustrated in the plot shown in Figure 2, where variations in the material composition influence the threshold voltage.
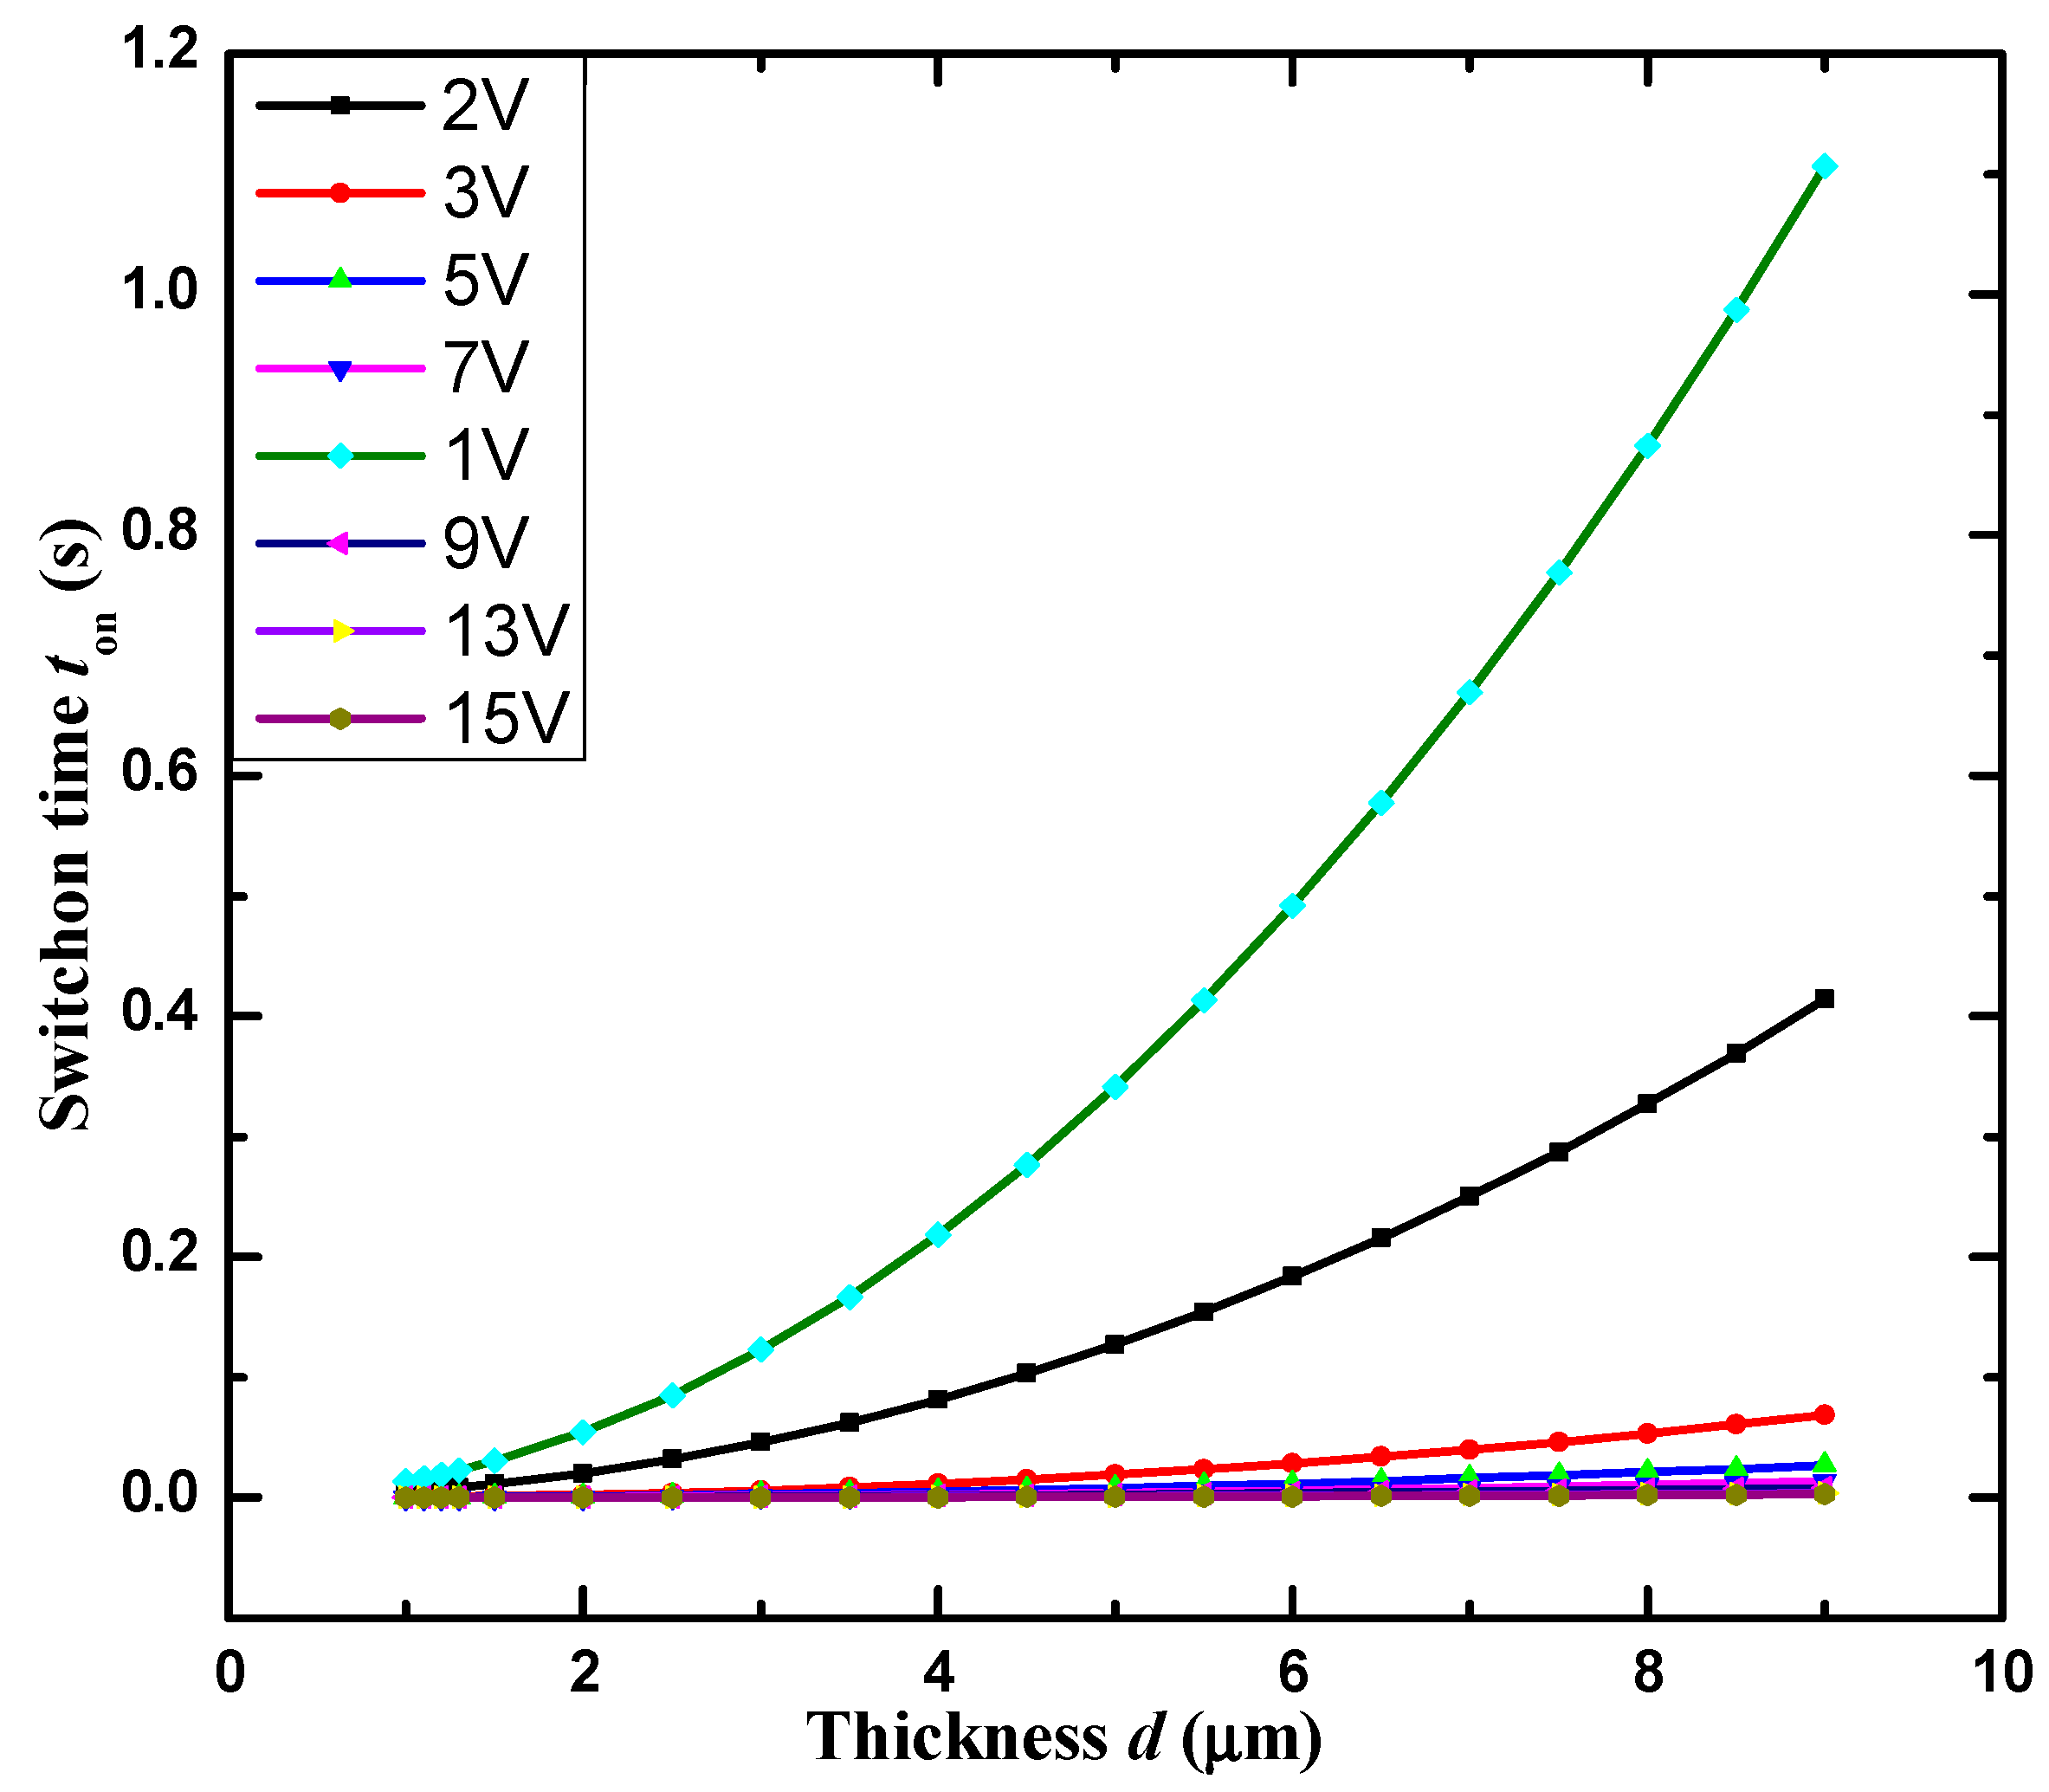
Figure 3 shows that the switch-on time gradually increases at a certain constant applied voltage by increasing the active cell thickness. However, the switch-on time began to decrease with an increase in the applied voltage, even for large cell thicknesses. Curves tilted towards the x-axis with increasing applied voltages showed a decrease in the switch-on time at high voltages. According to the above observations, the optical response time depended on the applied voltage.

4. Experimental Work

4.1. Fabrication Process

In this study, two filters, Si-ITO-Ag and G-ITO-Ag, were fabricated. The Si-ITO-Ag filter contained a Si substrate, and G-ITO-Ag contained a glass substrate, whereas ITO was used as an electrode and Ag as a mirror in both filters.

4.1.1. Fabrication of Si-ITO-Ag

Silicon was used as a substrate in the first designed filter with dimensions of 2.3 × 1 cm2 and a thickness of 0.65 mm. To clean the silicon wafers, they were first washed with acetone and then with neutral detergent in an ultrasonic bath for 10 min at approximately 50–60 °C. The silicon wafers were then dipped in solutions of sulfuric acid (H2SO4) and hydrogen peroxide (H2O2) [1:2] for 15 min at 160 °C. After rinsing with isopropyl alcohol, the silicon chips were dried using nitrogen. The first layer of ITO (70 nm) was deposited using thermal evaporation at a chamber pressure of 10−6 to 10−7 Torr. To fulfill the requirements of the mirror, a second layer of Ag thin film with a thickness of approximately 80 nm was deposited by plasma sputtering within a vacuum of 1.7 × 10⁻⁴ mb and 3 cm target distance to the substrate, under an argon pressure of 10 Pa, serving as a highly reflective mirror, with an estimated reflectance of >95% at the operating wavelength of the Fabry–Perot cavity. The deposition time was set to 400 s. Both ITO and Ag layers were deposited on the front surface of substrate, while the back surface was left uncoated. An aqueous solution of polyvinyl alcohol (PVA, ~2 wt%) was prepared for the antiparallel alignment of liquid crystals on individual substrates. The PVA was manually applied to the substrates and rubbed 70–80 times in a single direction, forming a thin layer with an estimated thickness of ~20–30 nm. The Mylar spacer [40], that is, a polyethylene terephthalate polyester film with a thickness of 1.2 μm, was used to adjust the space for liquid crystals between the cells. A 4-Pentyl-4-biphenyl-carbonitrile liquid crystal (5CB-sigma Aldrich ®-328510, Sigma-Aldrich, St. Louis, MO, USA) was placed at its clearing temperature (isotropic phase 35 °C) with capillary action from the fourth side and closed with a sealant after successful sealing of the three sides of the cavity. We maintained uneven wafer sizes for stress-free contact with the electrode during the measurement.

4.1.2. Fabrication of G-ITO-Ag Filter

In this filter, an ITO thin film with a thickness of 70 nm (which acts as an electrode) was deposited on a clean glass substrate (1 × 2 cm2) using the thermal evaporation. The deposition of a silver thin film was performed using the plasma sputter. The same procedure was followed for the alignment coatings of PVA and the filing of cells as discussed in Section 4.1.1.

4.2. Optical Characterization

Optical characterization of the two filters was supported by an FTIR spectrometer, and the transmission bands of the constituent parts of the filters were spectrally scanned at wavelength ranges from 3 to 5 μm.

5. Results and Discussion

The transmission spectra of both filters were obtained over the entire spectral band (3000–5000 nm) at different applied voltages.
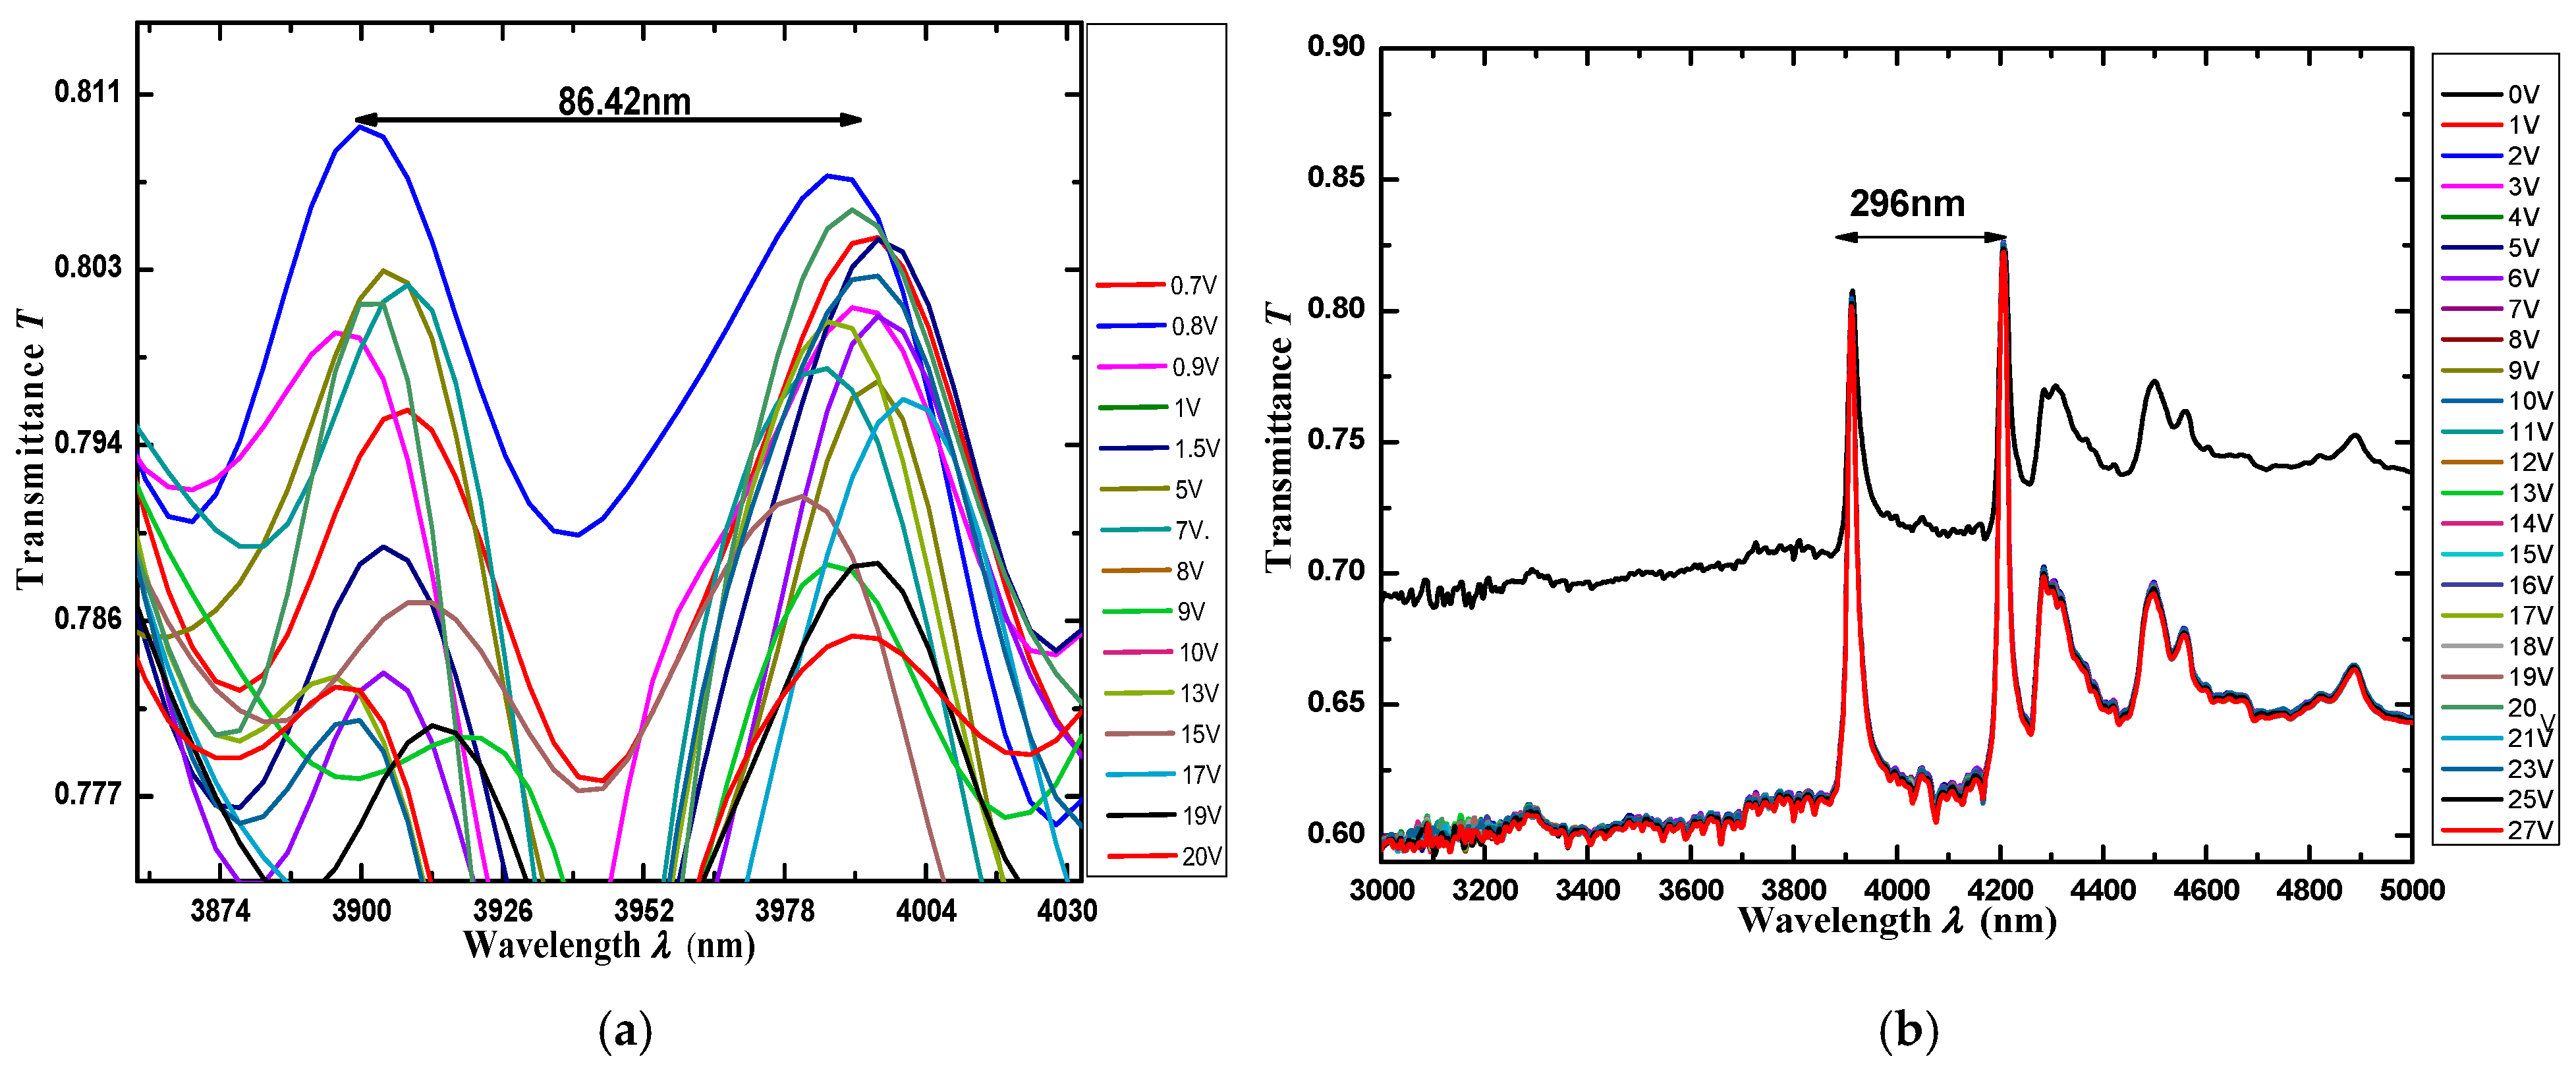
As shown in Figure 4a, two transmission peaks at 3899.94 nm and 3986.36 nm with maximum transmissions of 80.0% and 80.6% were obtained with a free spectral band of 86.42 nm for the Si-ITO-Ag filter (filter 1). Sharp and narrow transmission peaks at 3911 and 4207 nm with 80% and 82% of the maximum transmission, respectively, were obtained for G-ITO-Ag (filter 2), as shown in Figure 4b. A free spectral band of 296 nm was obtained for Filter 2. Standard glass substrates, as well as fused silica and quartz, exhibit significant absorption at wavelengths above ~3.5 µm higher absorption of silicon and the refractive index in MIR is ~1.4–1.5, which allows more wavelengths to pass through without significant attenuation. This contributes to the wider free spectral band of G-ITO-Ag (Filter 2). Simultaneously, because of the higher refractive index of Si in the MIR (~3.4–3.5), more selective interference patterns can be obtained, along with a stronger phase shift owing to stronger absorption. Consequently, the effective transmission of certain wavelengths is limited, ultimately narrowing the free spectral band of the Si-ITO-Ag filter (filter 1).
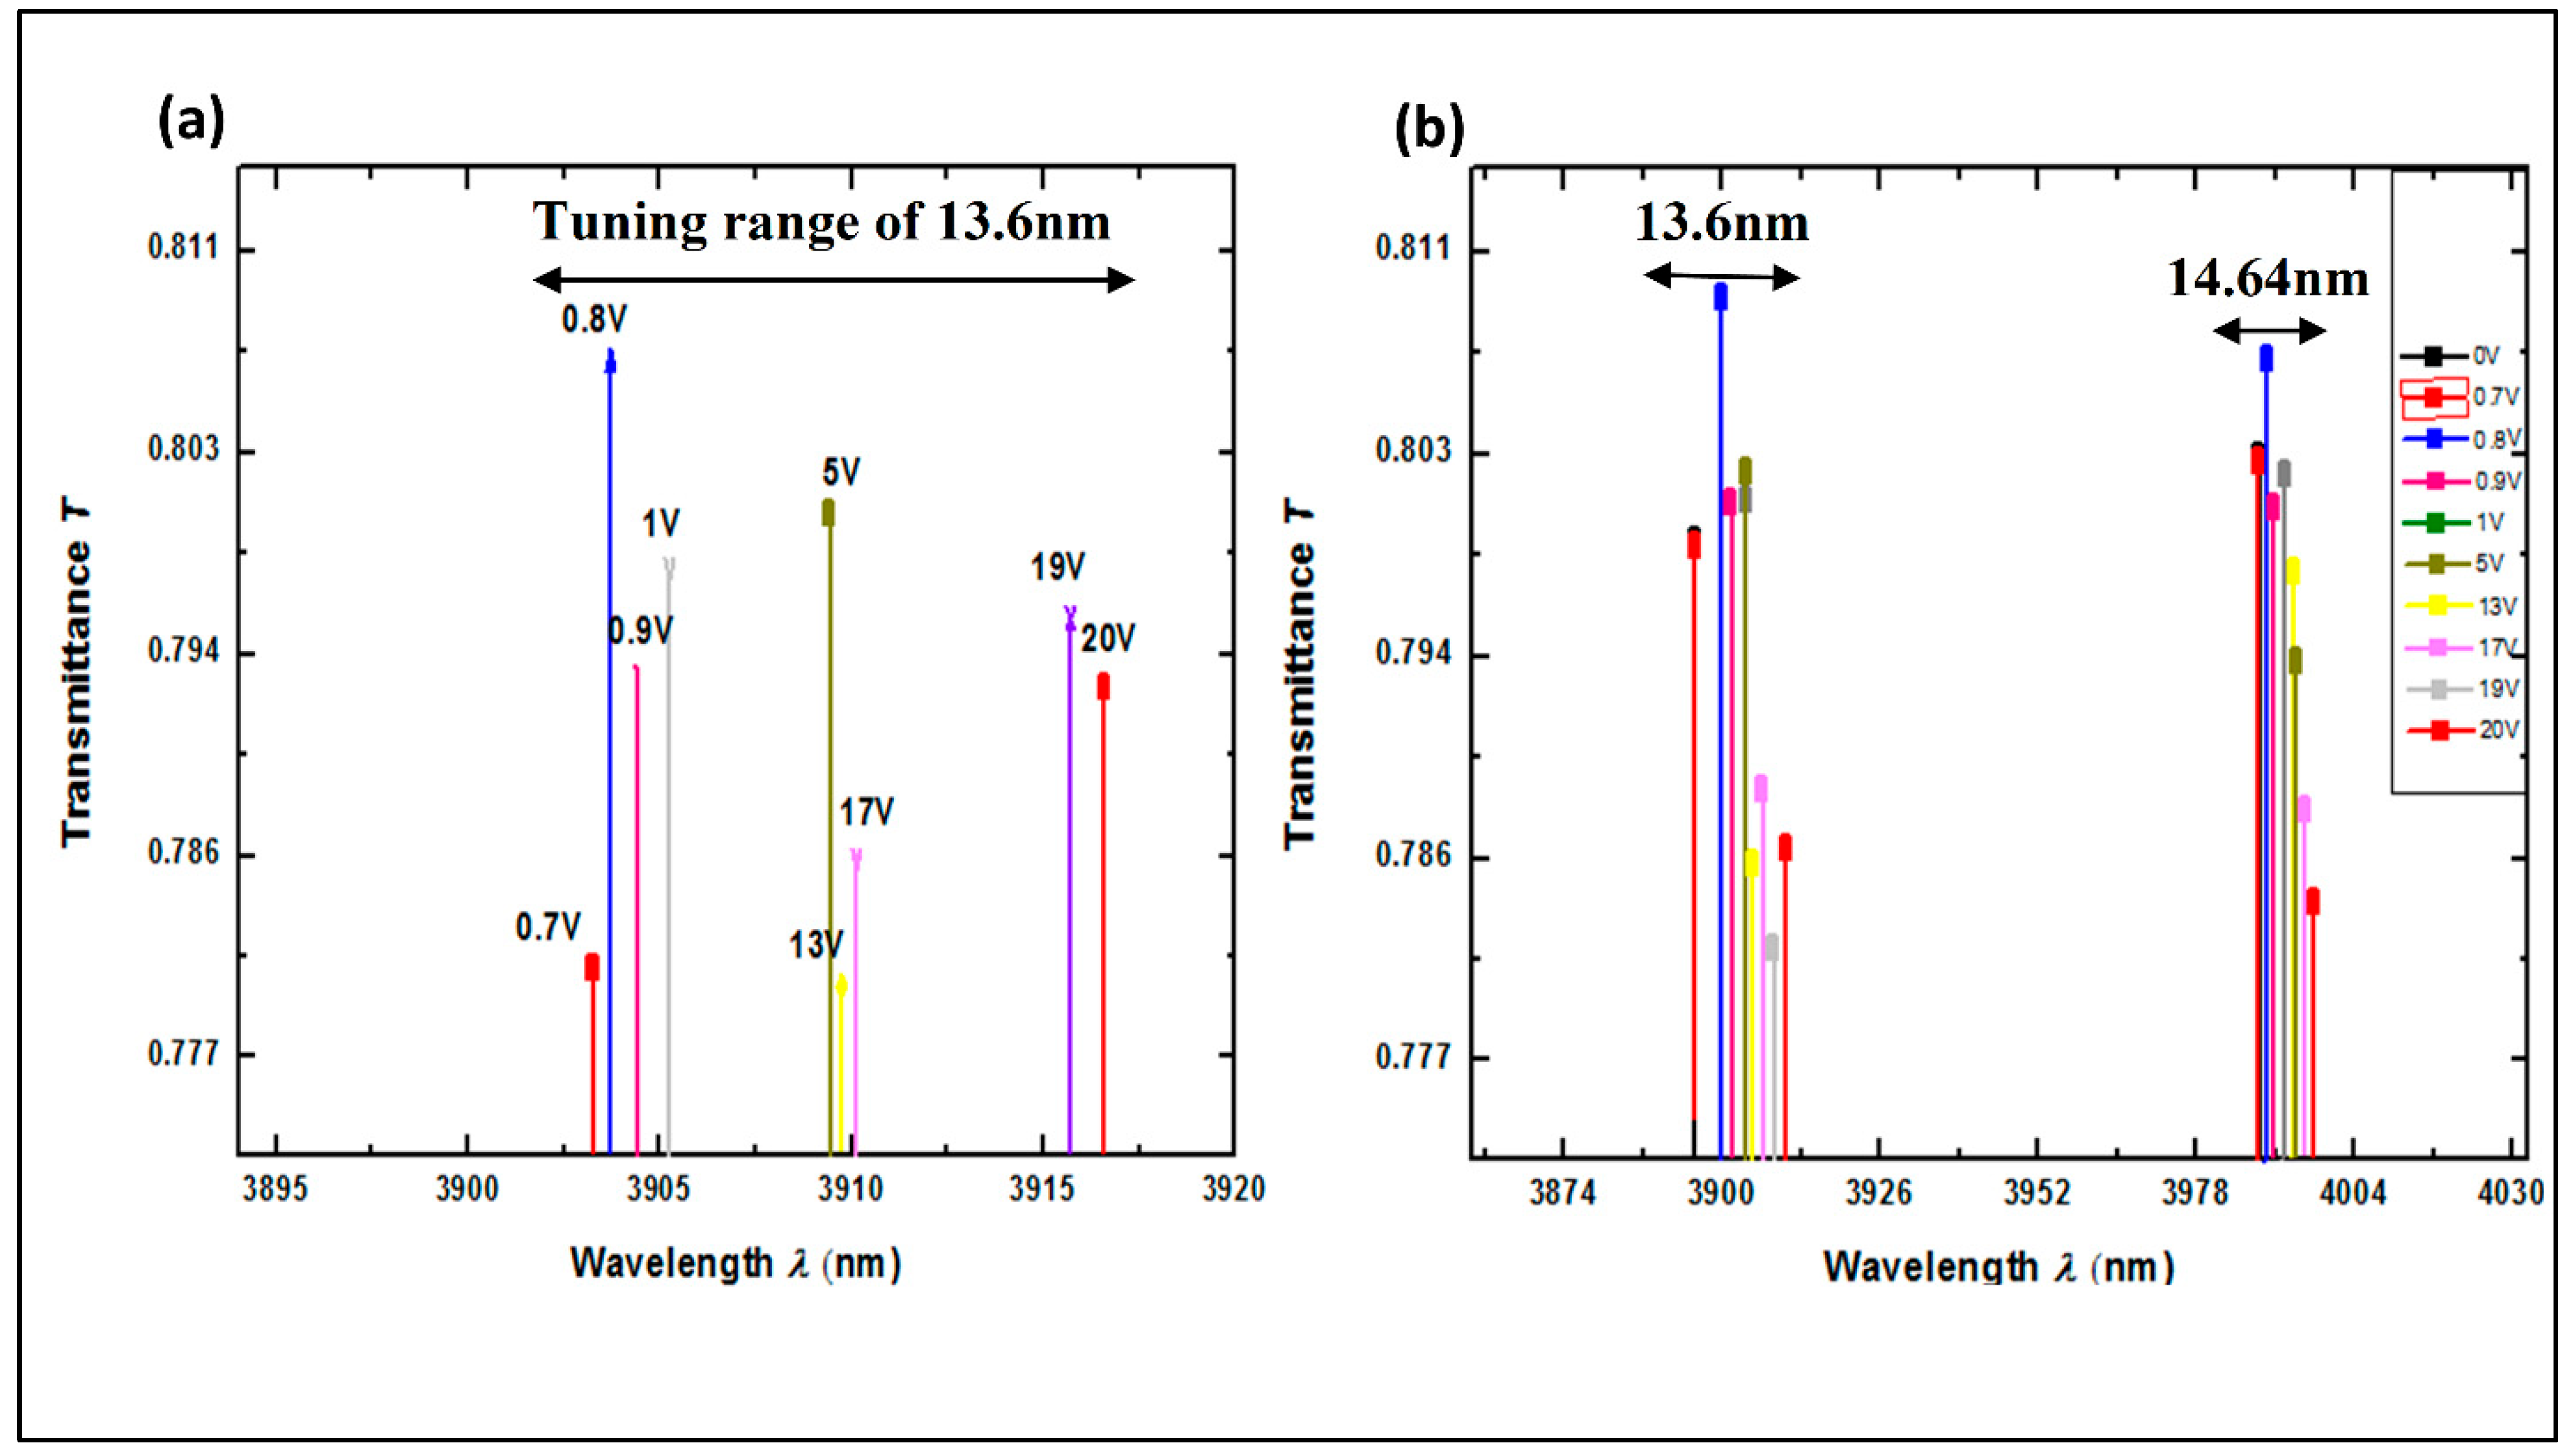
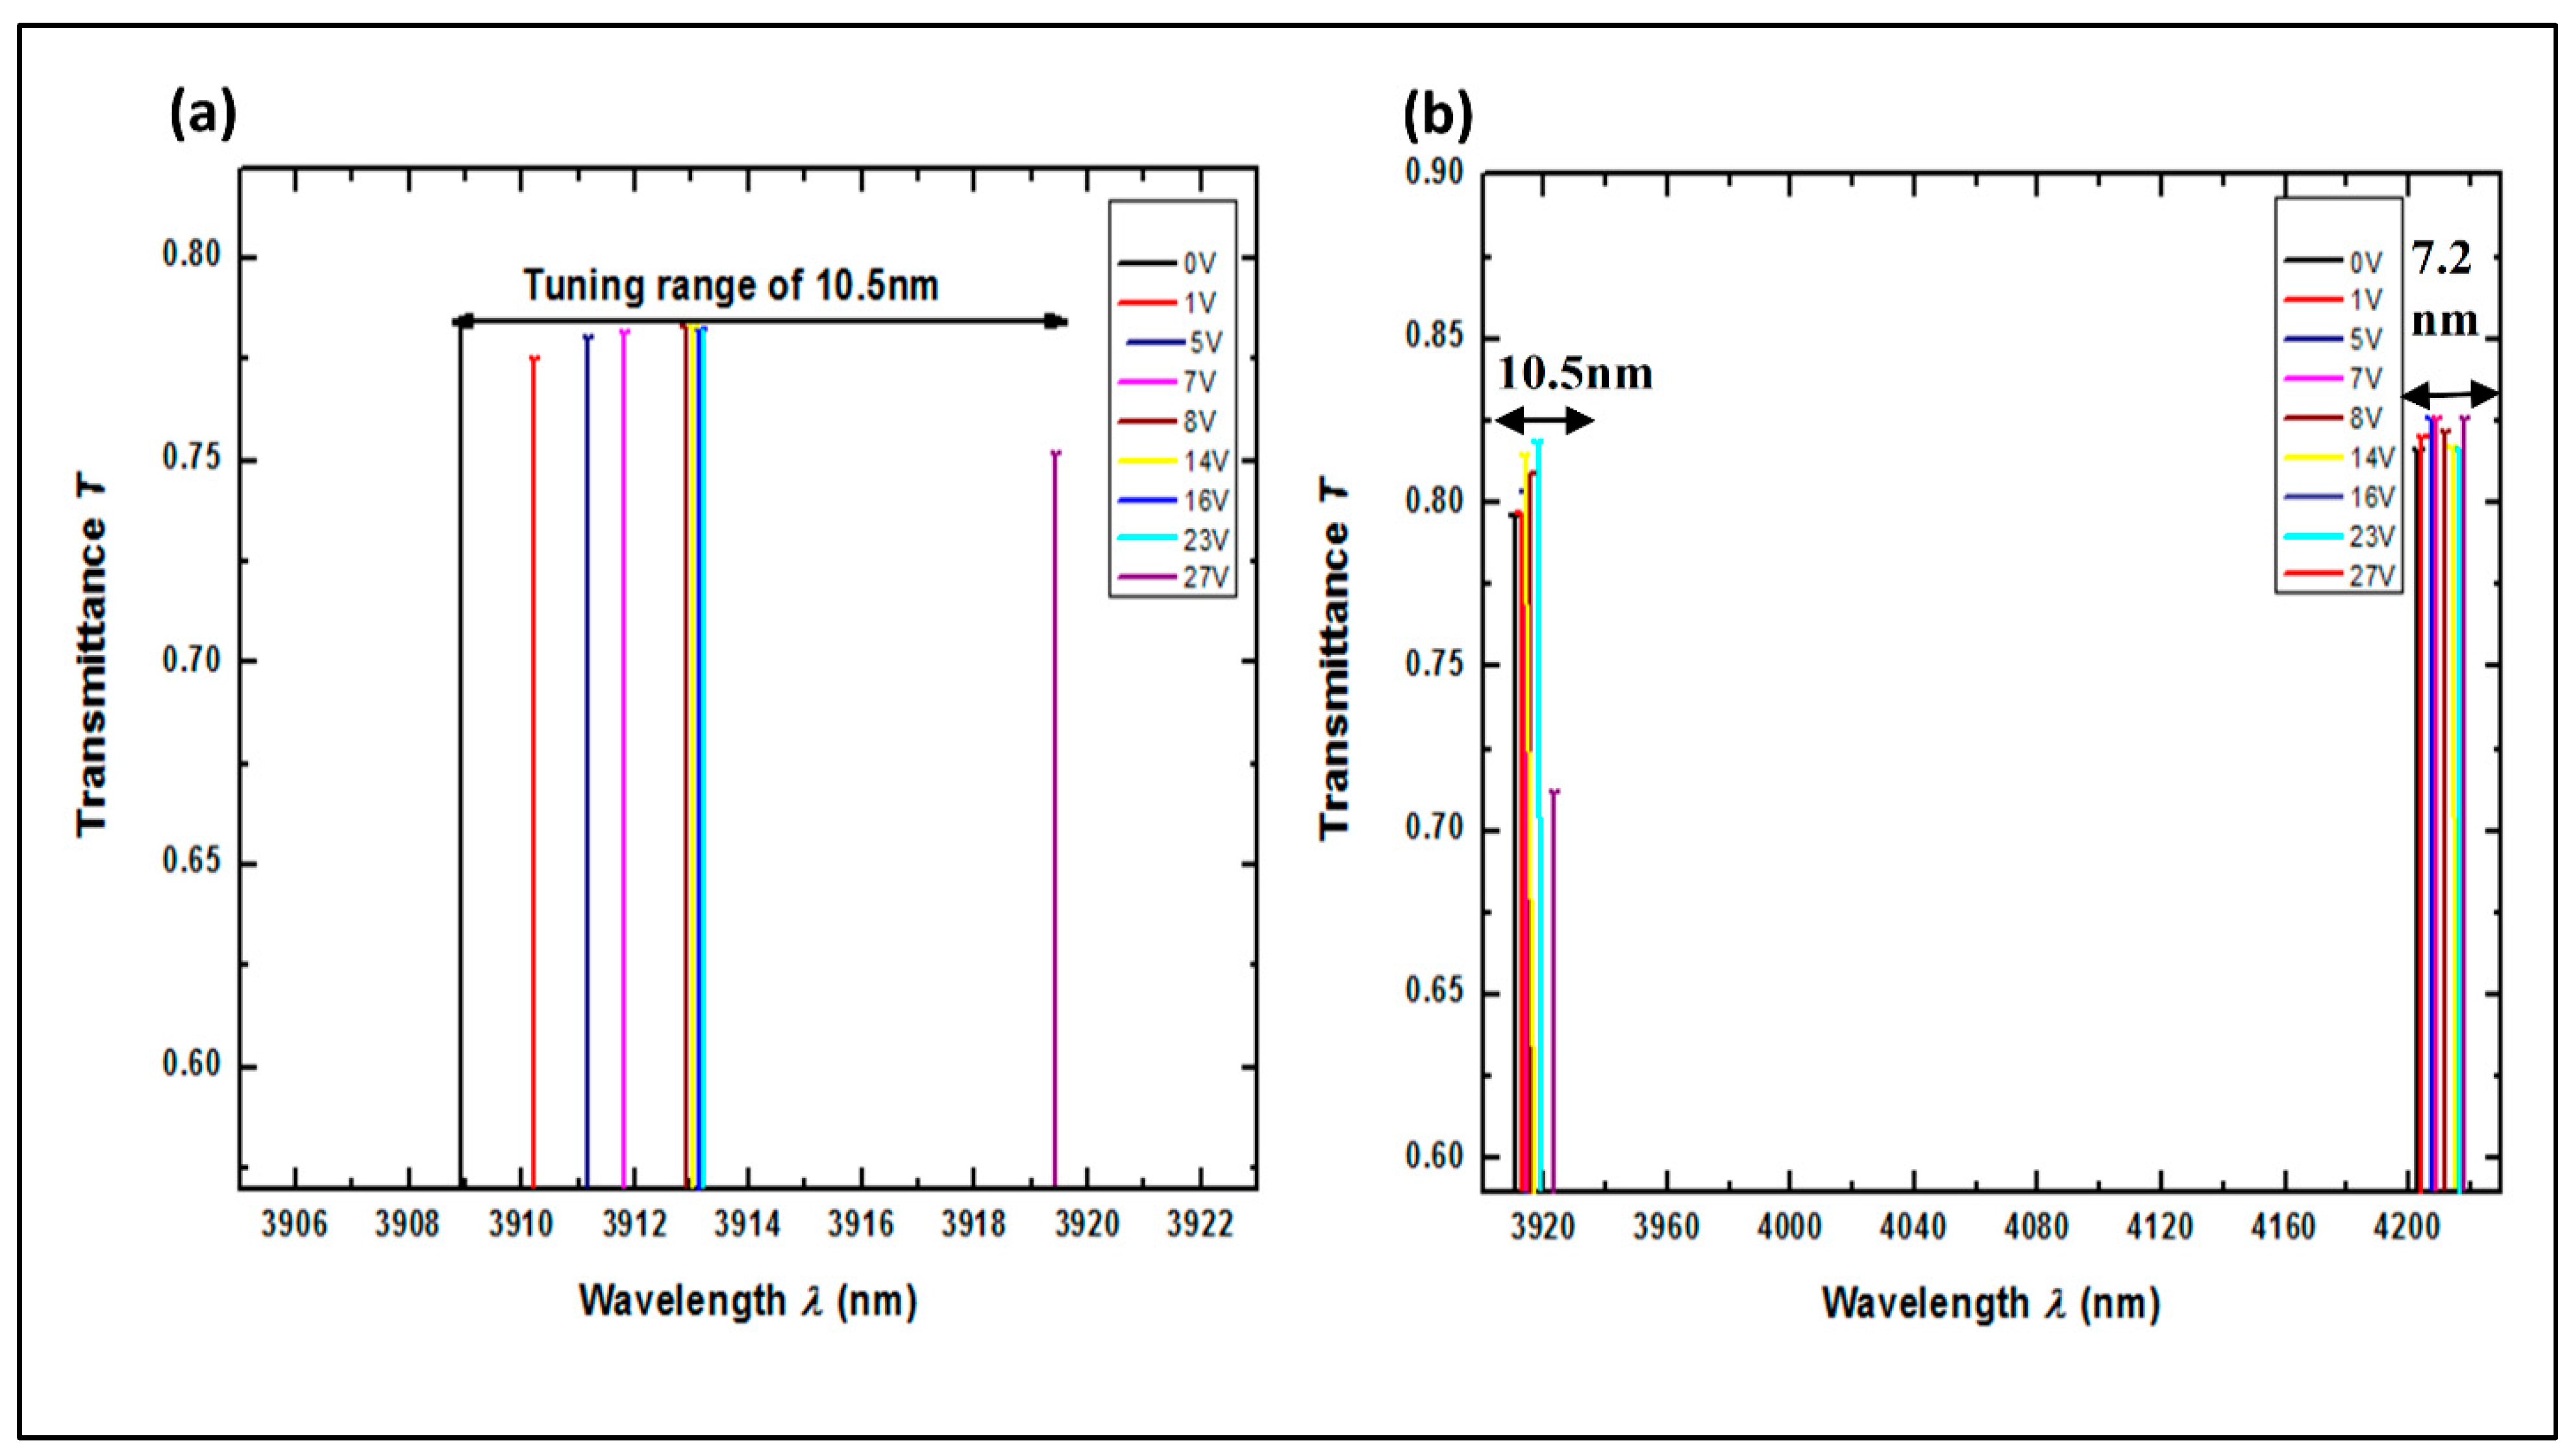
A shift in the transmission peaks was observed by varying the voltage from 0 V to 20 V for filter 1, as shown in Figure 5, and by varying the voltage from 0 V to 27 V for filter 2, as shown in Figure 6. As the optical axis rotates with an external electric field in a twisted designed cell, with the application of an external voltage, the peak shifts towards a higher wavelength owing to positive anisotropy, which is observed for both filters.
Figure 5a,b show the filter 1 tuning range of 13.6 nm and 14.64 nm for two bands in the given ranges of 3903.5–3917.16 nm and 3982.73–3997.37 nm, respectively. However, over the range of 3909–3919.5 nm and 4209.71–4202.51 nm, filter 2 provides tuning ranges of 10.5 nm and 7.2 nm, respectively, for the first and second bands, as shown in Figure 6a, b.
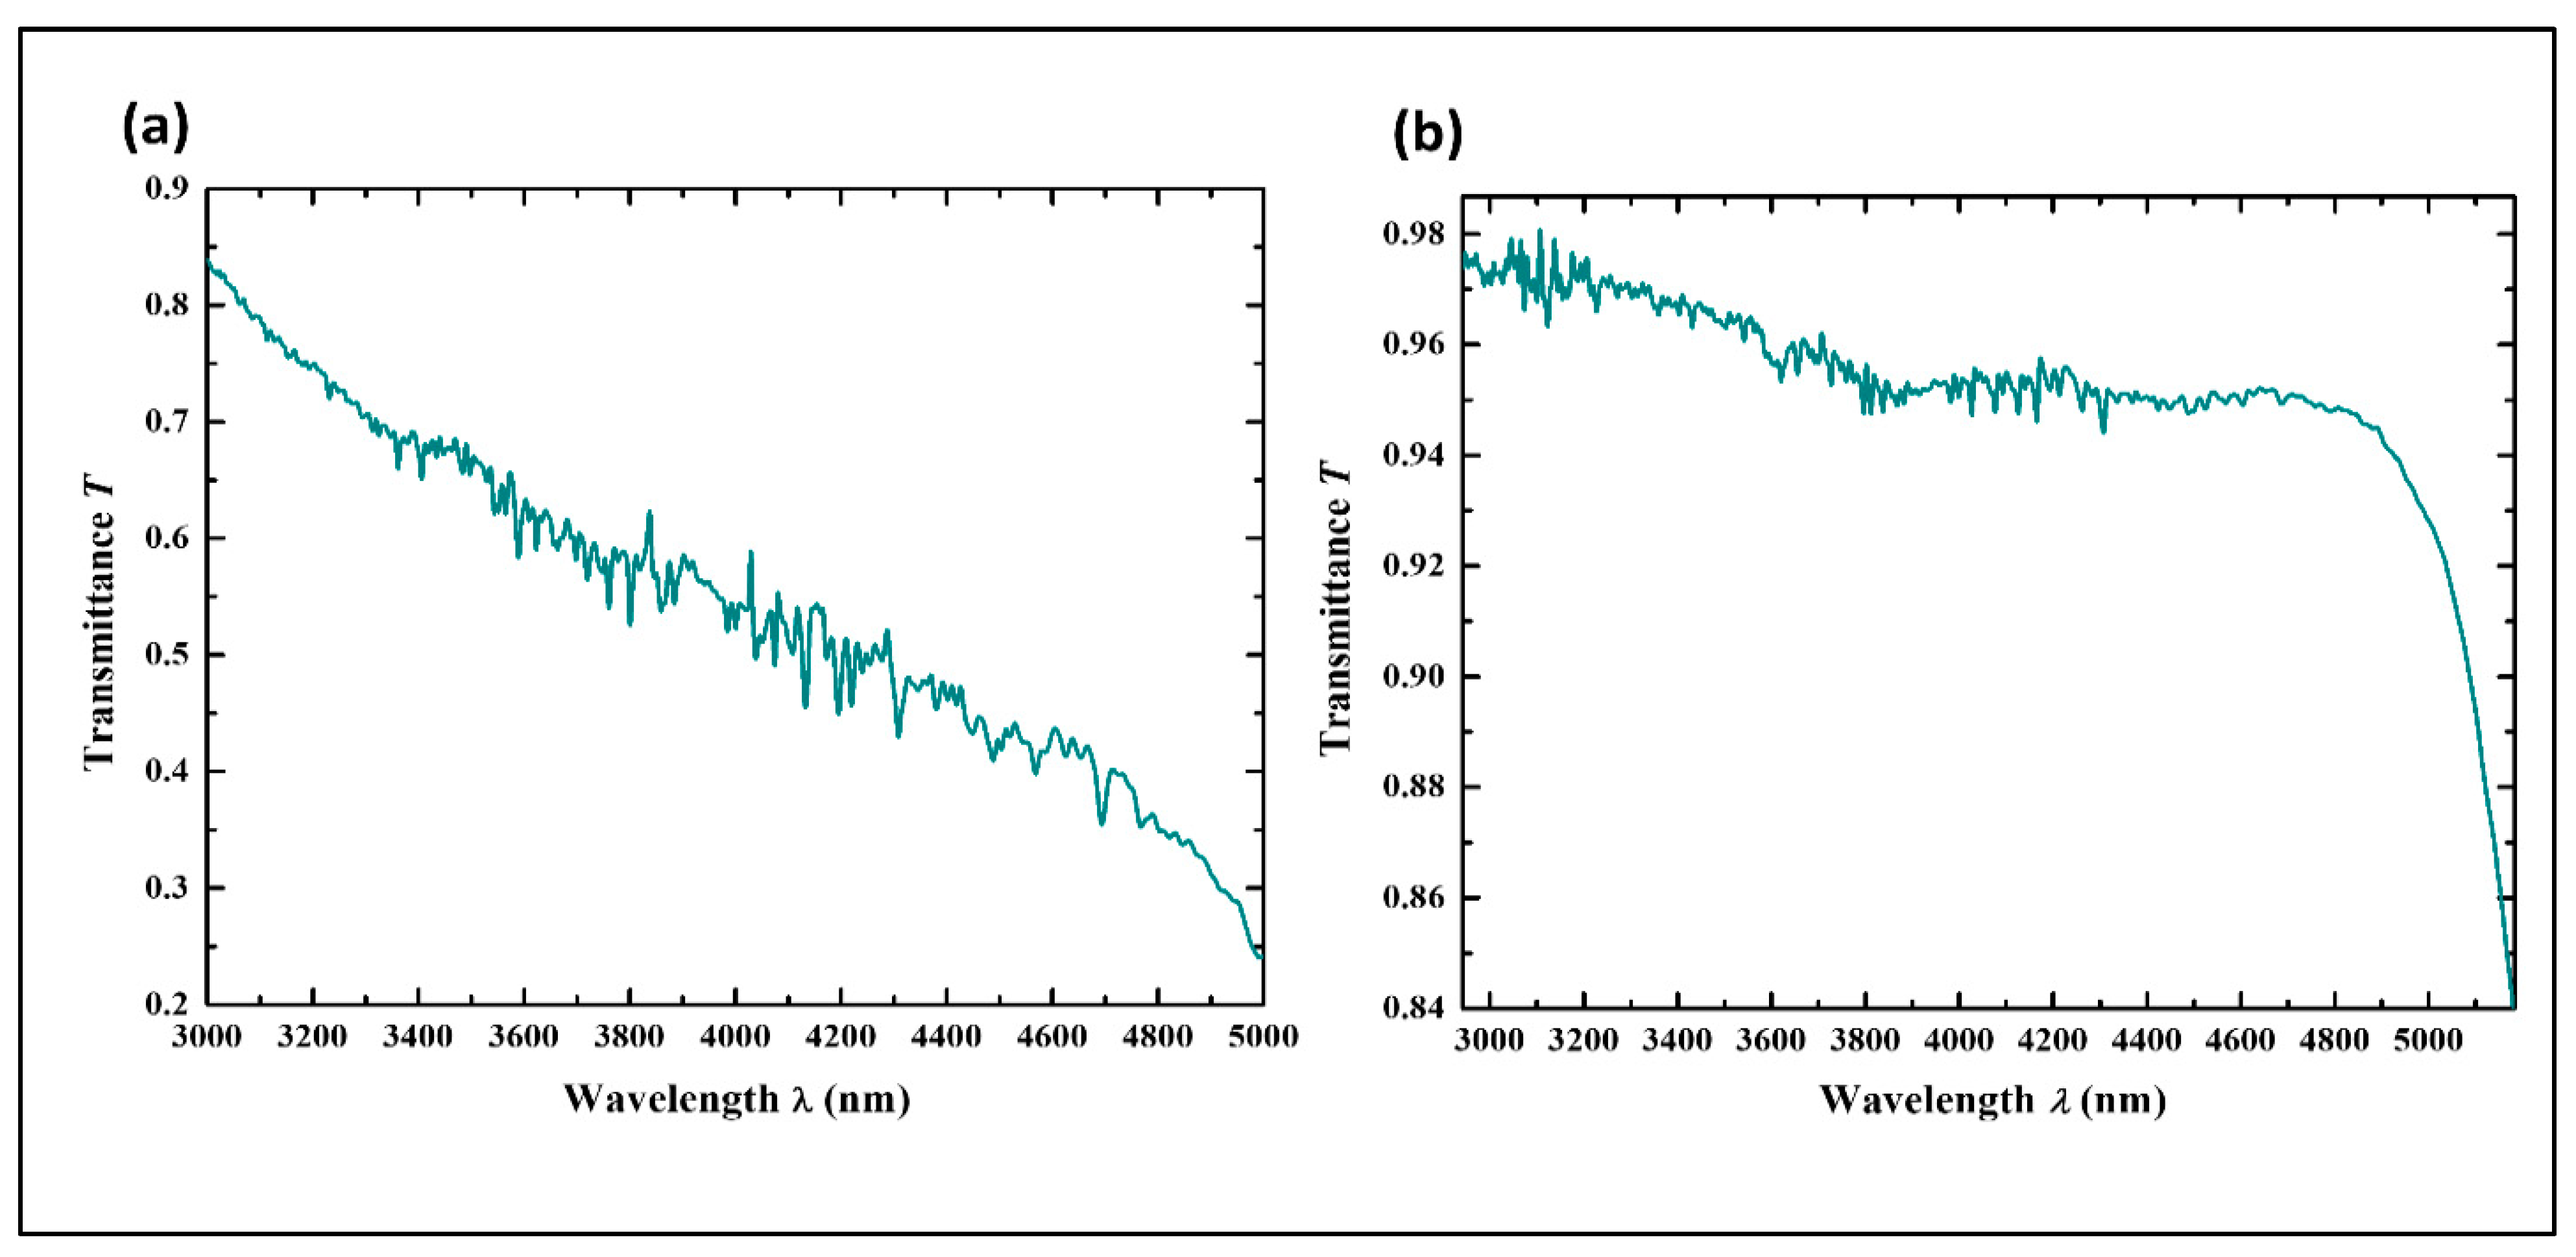
Figure 7a shows the experimentally calculated transmission band of ITO and silver-coated silicon (one face) of the Si-ITO-Ag filter in the MIR, while the experimentally measured transmission spectra for silver and ITO on glass substrates for the G-ITO-Ag filter in the mid-IR region are shown in Figure 7b. A broad MIR band at approximately 2000 nm is characteristic of both filters. The transmission spectra for silver and ITO-coated glass are primarily due to the higher transparency of silicon in the mid-infrared region, whereas glass exhibits significant absorption above ~3.5 µm. The transmission on both sides of the cell was understandably decreased in comparison to that on one side.
Some critical assumptions include proper twisting, exact parallelism of the respective mirrors, and a perfectly clean experimental environment for the fabrication of filters. A reflectance finesse of almost 8.5 was obtained for filter 1, whereas a high reflectance finesse of 11.95 was obtained for filter 2. The overall FWHM obtained for filter 1 was 1.7 nm and 23.1 nm for filter 2.
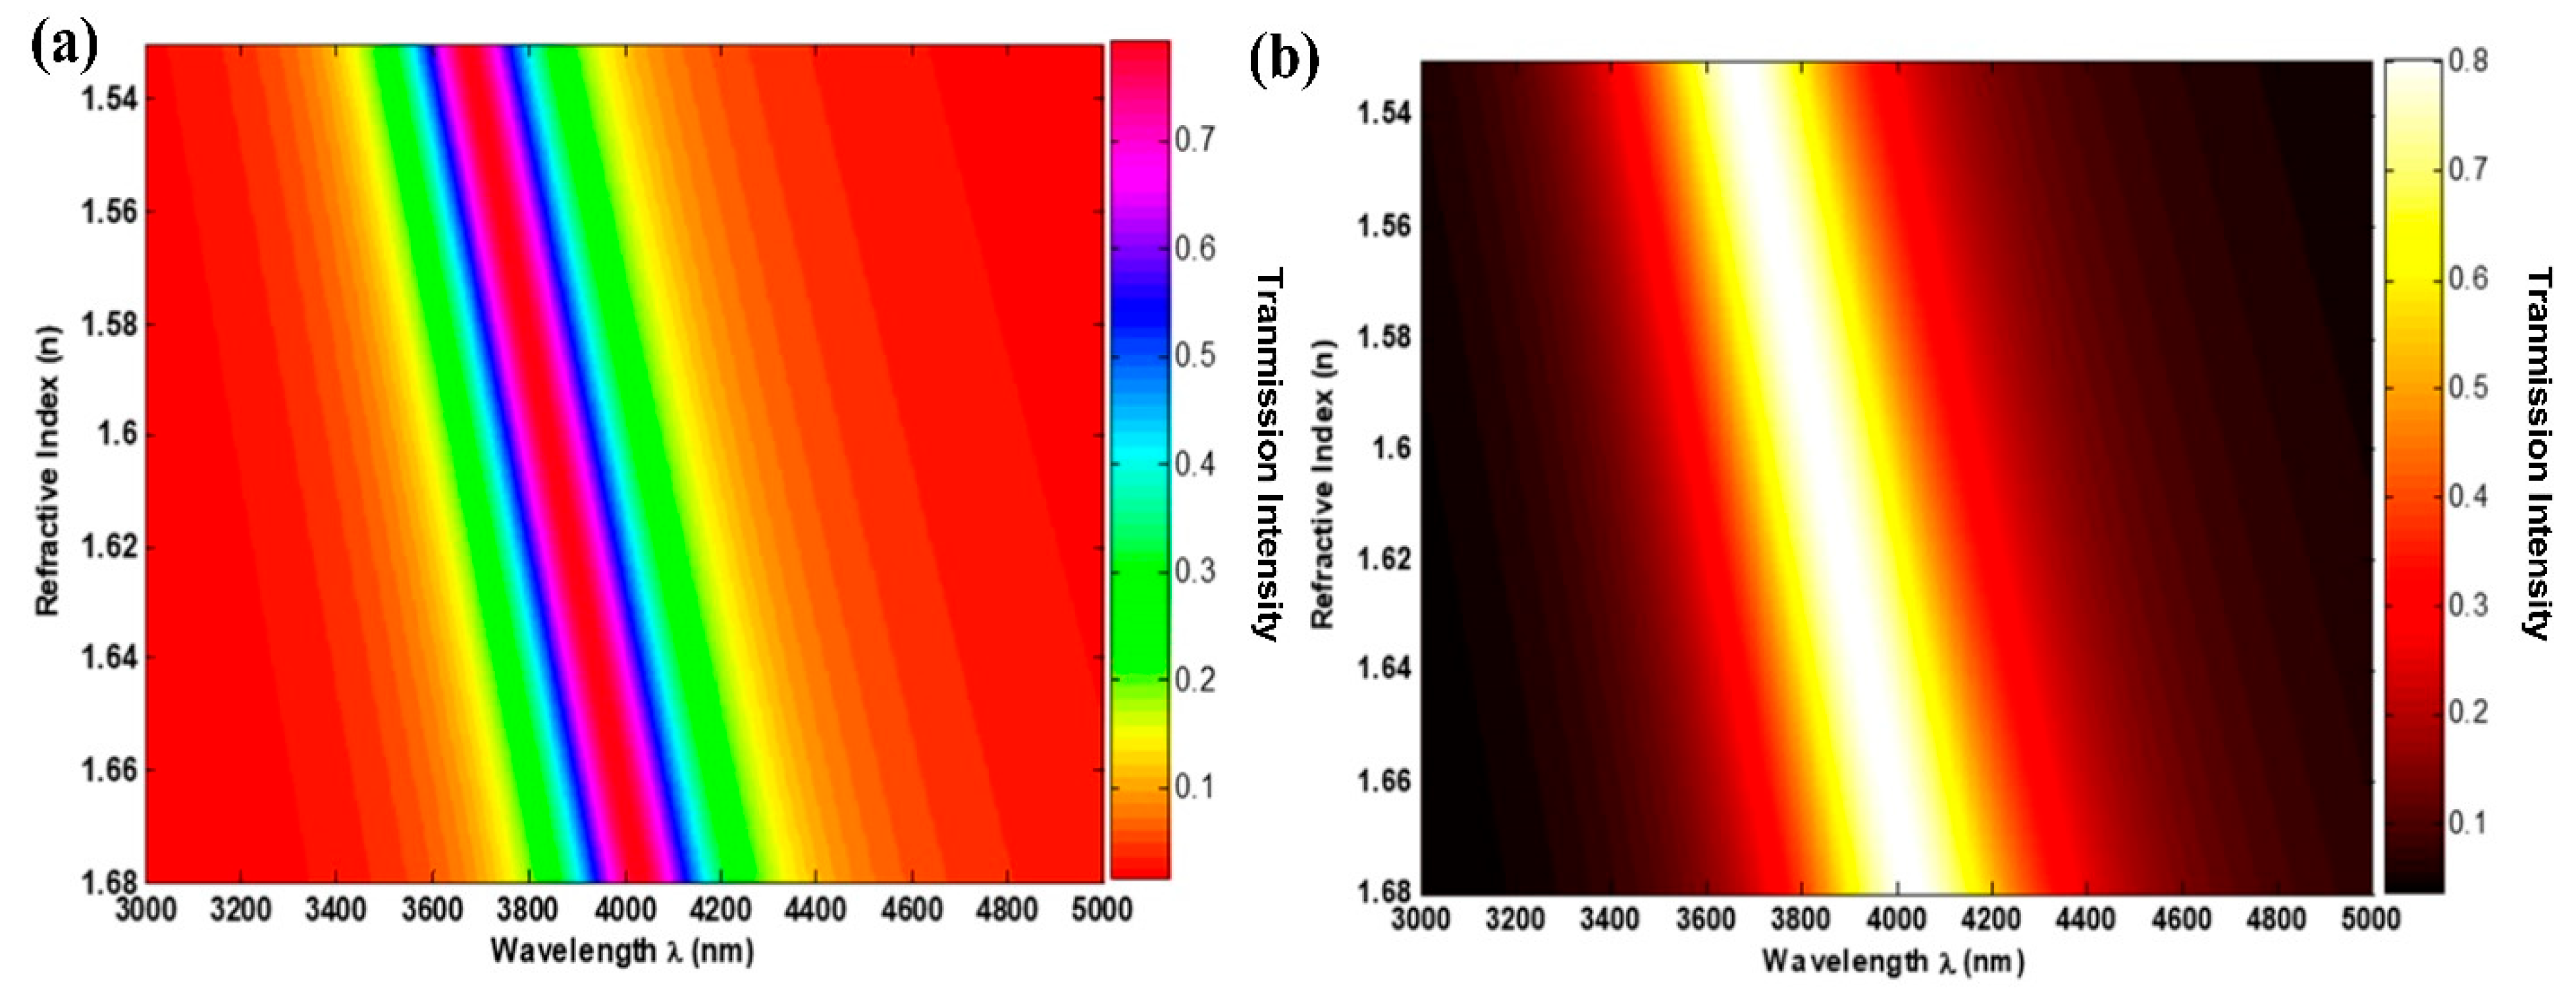
In this study, extraordinary refractive indices of 1.68 and 1.52 were considered at an incident angle (θ at 0). Two-dimensional plots of the dependencies between the refractive index and scanning wavelength with the corresponding transmission for both filters are shown in Figure 8. These plots help in designing filters with a proper choice of refractive indices at the central wavelength.
A 2D plot is a valuable tool for identifying and selecting the optimum design parameters for filter design. By visualizing the relationship between the key parameters (refractive index, central wavelength and transmission intensity), the plot allows for a clearer understanding of how different designs impact the performance of the filter. This helps in quickly identifying the region of optimal parameter values, ensuring that the filter meets the desired specifications with the highest efficiency. This visualization aids in streamlining the design process and reducing trial-and-error experimentation, ultimately leading to more effective and precise filter designs in the future.
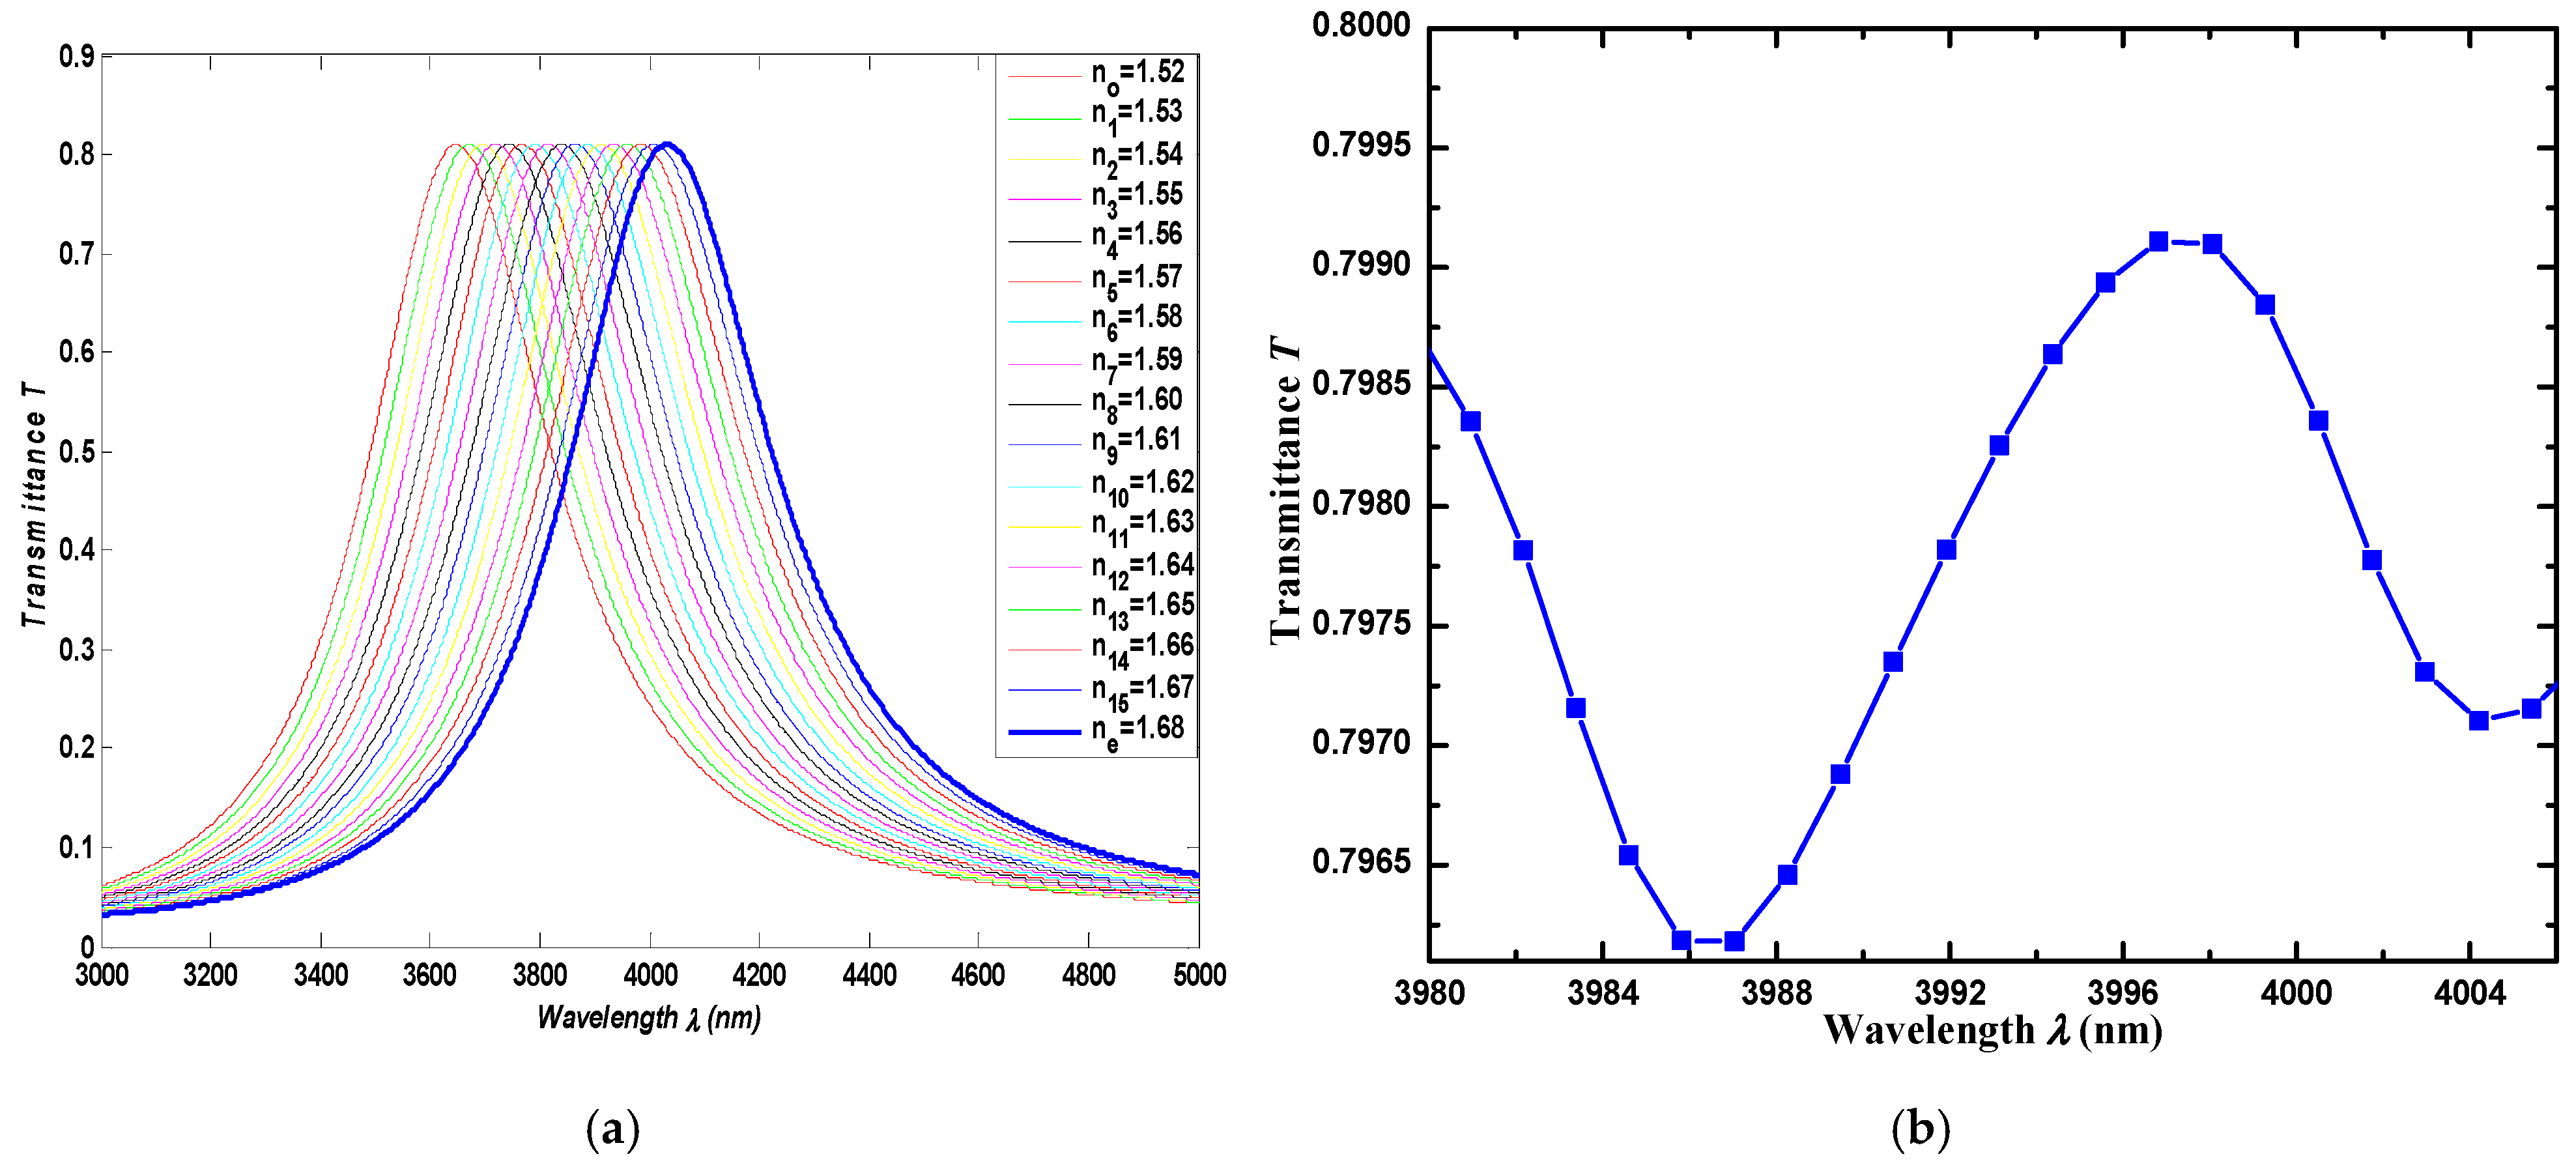
Figure 9a depicts the simulated transmission spectra for the first designed filter. The simulated results presented in Figure 9a were generated based on Equation (2), which provides the relationship between the transmission intensity against the wavelength and refractive index [4]. Almost 80% transmission was observed with a tuning range of 376 nm, which lies in the MIR regime with a wavelength range of 3658–4028 nm. The experimental results for filter 1 in the absence of an applied voltage are presented in Figure 9b. It can be clearly seen that at 0 V, 80% transmission is achieved at 3998 nm, verifying 80% transmission and the wavelength band of the simulated spectra shown in Figure 9a, confirming its suitability for MIR wavelength tuning.

6. Conclusions

Liquid Crystal Tunable Transmission Filters (LCTFs) filled with twisted 5CB nematic LC were examined analytically and experimentally, with distinct transmissions in the MIR regime. Different materials with varying parameters were employed for the fabrication of filters. FTIR measurements taken for each fabricated filter authenticate an FWHM of 7 nm for the Si-ITO-Ag filter and 23.1 nm for the G-ITO-Ag filter with a transmission of almost 82% for the G-ITO-Ag filter and 80% for the Si-ITO-Ag filter. A high reflectance finesse of 11.95 with a wide free spectral range of 294.6 nm was obtained for the G-ITO-Ag filter, with two sharp transmission peaks obtained over the entire spectral region (3000–5000 nm), allowing it to be employed as a MIR sensor/filter for HSI. The LCTFs offer superior tuning speed, requiring lower voltages (0 to 20 V) for fast adjustments compared to MEMS filters with mechanical actuation. Additionally, LCTFs are more power-efficient and cost-effective due to their simpler fabrication process, in contrast to the more complex and expensive MEMS-based filters. LCTFs can be used as integrated devices for multiple wavelength band tuning in a rotating wheel configuration. In HIS, it can also be helpful for a user to select the optimum band to achieve a high spatial and spectral resolution. The future goal is to design and produce metamaterial constructs using inexpensive and simple manufacturing methods. This allows for more spectral channel studies while simultaneously retaining ultrathin coatings made of different materials, further adjusting the additional ability to manipulate the liquid crystal phase.

Author Contributions

Conceptualization, K.A. and R.N.; methodology, K.A., M.H.B. and M.H.E.; writing—original draft preparation, K.A.; writing—review and editing, T.Y.O., A.Z., M.H.B., M.H.E. and S.S.; supervision, T.Y.O., R.N. and M.H.B.; project administration, M.H.B. All authors have read and agreed to the published version of the manuscript.

Funding

This research received no external funding.

Data Availability Statement

The original contributions presented in this study are included in the article. Further inquiries can be directed to the corresponding authors.

Conflicts of Interest

The authors declare no conflicts of interest.

References

  1. Ilyas, N.; Wang, J.; Li, C.; Li, D.; Fu, H.; Gu, D.; Jiang, X.; Liu, F.; Jiang, Y.; Li, W. Nanostructured materials and architectures for advanced optoelectronic synaptic devices. Adv. Funct. Mater. 2022, 32, 2110976. [Google Scholar] [CrossRef]
  2. Yan, K.; Guo, Q.; Wu, F.; Sun, J.; Zhao, H.; Kwok, H.-S. Polarization-independent nematic liquid crystal phase modulator based on optical compensation with sub-millisecond response. Opt. Express 2019, 27, 9925–9932. [Google Scholar] [CrossRef]
  3. Zeng, R.; Bi, R.; Zhu, J.; Huang, X.; Wang, Q. Near-infrared tuneable filter based on polymer dispersed liquid crystals. Micro Nano Lett. 2025, 20, e70007. [Google Scholar] [CrossRef]
  4. Ganaraj, P.; Guha, K.; Kavicharan, M.; Iannacci, J.; Donelli, M.; Rao, K.S. Design and analysis of piezoelectric MEMS actuator based SIW filter for K/Ka band communication. Microsyst. Technol. 2025, 1–10. [Google Scholar] [CrossRef]
  5. Cho, S.; Ozaki, M. Blue phase liquid crystals with tailored crystal orientation for photonic applications. Symmetry 2021, 13, 1584. [Google Scholar] [CrossRef]
  6. Chen, L.; Zhang, S.; Zheng, W.; Yao, L. High Light Efficiency Spectral Polarization Imaging Method Based on Mach–Zehnder Structured Liquid Crystal Tunable Filters and Variable Retarders. Photonics 2023, 10, 765. [Google Scholar] [CrossRef]
  7. Wang, J.; Cheng, W.; Zhu, W.; Lu, M.; Chen, Y.; Shi, S.; Guo, C.; Hu, G.; Cui, Y.; Yun, B. Optimization and comprehensive comparison of thermo-optic phase shifter with folded waveguide on SiN and SOI platforms. Opt. Commun. 2024, 555, 130242. [Google Scholar] [CrossRef]
  8. Butt, M.A. Emerging Trends in Thermo-Optic and Electro-Optic Materials for Tunable Photonic Devices. Materials 2025, 18, 2782. [Google Scholar] [CrossRef]
  9. Wang, H.; Chen, L.; Wu, Y.; Li, S.; Zhu, G.; Liao, W.; Zou, Y.; Chu, T.; Fu, Q.; Dong, W. Advancing inorganic electro-optical materials for 5 G communications: From fundamental mechanisms to future perspectives. Light Sci. Appl. 2025, 14, 190. [Google Scholar] [CrossRef] [PubMed]
  10. Guo, T.; Lin, Z.; Xu, X.; Zhang, Z.; Chen, X.; He, N.; Wang, G.; Jin, Y.; Evans, J.; He, S. Broad-tuning, dichroic metagrating Fabry-Perot filter based on liquid crystal for spectral imaging. Prog. Electromagn. Res. 2023, 177, 43–51. [Google Scholar] [CrossRef]
  11. Nasir, R.; Saleem, M.R.; Nisar, A.; Rafiq, M.A. Electro-tunable optical cavity filters in near-infrared regime. Optik 2021, 225, 165714. [Google Scholar] [CrossRef]
  12. Wu, X.; Lin, Z.; Tang, S.; Chen, X.; Guo, T.; He, S. A Multi-Resonant Tunable Fabry-Pérot Cavity for High Throughput Spectral Imaging. Adv. Opt. Mater. 2025, 13, 2402784. [Google Scholar] [CrossRef]
  13. Yang, Y.; Forbes, A.; Cao, L. A review of liquid crystal spatial light modulators: Devices and applications. Opto-Electron. Sci. 2023, 2, 230026-1–230026-9. [Google Scholar] [CrossRef]
  14. Shriyan, S.K. Tunable Electro-Optic Thin Film Stack for Hyperspectral Imaging. Ph.D. Thesis, Drexel University, Philadelphia, PA, USA, 2011. [Google Scholar]
  15. Zhang, J.; Wang, B.; Wang, R.; Wang, J.; Wang, X.; Zhang, Y. Multiple Broadband Infrared Topological Photonic Crystal Valley States Based on Liquid Crystals. Materials 2024, 17, 5212. [Google Scholar] [CrossRef]
  16. Gao, B.; Wang, T.; Chen, L.; Wang, S.; Li, C.; Xiao, F.; Liu, Y.; Yu, W. Novel Fabry-Pérot Filter Structures for High-Performance Multispectral Imaging with a Broadband from the Visible to the Near-Infrared. Sensors 2025, 25, 6123. [Google Scholar] [CrossRef]
  17. Mansha, S.; Moitra, P.; Xu, X.; Mass, T.W.; Veetil, R.M.; Liang, X.; Li, S.-Q.; Paniagua-Domínguez, R.; Kuznetsov, A.I. High resolution multispectral spatial light modulators based on tunable Fabry-Perot nanocavities. Light Sci. Appl. 2022, 11, 141. [Google Scholar] [CrossRef]
  18. Batrakov, K.; Valynets, N.; Dubinetski, M.; Paddubskaya, A.; Margaryan, H.; Hakobyan, N.; Abrahamyan, V. Fabry–Perot enhancement of liquid crystals birefringence effects in terahertz range. Phys. Scr. 2024, 100, 015510. [Google Scholar] [CrossRef]
  19. Li, Z.; Lu, Y.; Han, Y.; Li, H.; Niu, Z.; Liu, X.; Wei, C.; Shao, J. Numerical Verification of a Polarization-Insensitive Electrically Tunable Far Infrared Band-Stop Meta-Surface Filter. Photonics 2024, 11, 1016. [Google Scholar] [CrossRef]
  20. Hegyi, A.; Martini, J. Hyperspectral imaging with a liquid crystal polarization interferometer. Opt. Express 2015, 23, 28742–28754. [Google Scholar] [CrossRef] [PubMed]
  21. Tam, A.; Qi, G.; Srivastava, A.; Wang, X.; Fan, F.; Chigrinov, V.; Kwok, H. Enhanced performance configuration for fast-switching deformed helix ferroelectric liquid crystal continuous tunable Lyot filter. Appl. Opt. 2014, 53, 3787–3795. [Google Scholar] [CrossRef]
  22. Khan, M.J.; Khan, H.S.; Yousaf, A.; Khurshid, K.; Abbas, A. Modern trends in hyperspectral image analysis: A review. IEEE Access 2018, 6, 14118–14129. [Google Scholar] [CrossRef]
  23. Golovynskyi, S.; Golovynska, I.; Roganova, O.; Golovynskyi, A.; Qu, J.; Ohulchanskyy, T.Y. Hyperspectral imaging of lipids in biological tissues using near-infrared and shortwave infrared transmission mode: A pilot study. J. Biophotonics 2023, 16, e202300018. [Google Scholar] [CrossRef]
  24. Zhang, L.; Yang, Y.; Zhao, S.; Chen, T.; Yu, K.; Wang, K.; Xie, C.; Wang, M.; Cai, B. Hyperspectral full polarization imaging system based on spatial modulation. Appl. Opt. 2023, 62, 1428–1435. [Google Scholar] [CrossRef] [PubMed]
  25. Isaacs, S.; Placido, F.; Abdulhalim, I. Investigation of liquid crystal Fabry–Perot tunable filters: Design, fabrication, and polarization independence. Appl. Opt. 2014, 53, H91–H101. [Google Scholar] [CrossRef] [PubMed]
  26. Ledzion, R.; Izdebski, M.; Rambo, A. Measuring the Electro-Optical Kerr Effect Against the Background of Electro-Absorption Modulation in Liquids. Materials 2024, 17, 5346. [Google Scholar] [CrossRef]
  27. Huang, Z.; Zhang, Z.; Zhang, R.; Ding, B.; Yang, L.; Wu, K.; Xu, Y.; Zhong, G.; Ren, C.; Liu, J. An inorganic liquid crystalline dispersion with 2D ferroelectric moieties. Natl. Sci. Rev. 2024, 11, nwae108. [Google Scholar] [CrossRef]
  28. Pourmostafa, D.; Tajalli, H.; Vahedi, A.; Milanchian, K. Electro-optical Kerr effect of 6CHBT liquid crystal doped with MgO nanoparticles in different concentration. Opt. Mater. 2020, 107, 110061. [Google Scholar] [CrossRef]
  29. Li, B.-X.; Borshch, V.; Wang, H.; Li, Q.; Shiyanovskii, S.V.; Lavrentovich, O.D. Enhanced nanosecond electro-optic effect in isotropic and nematic phases of dielectrically negative nematics doped by strongly polar additive. J. Mol. Liq. 2018, 267, 450–455. [Google Scholar] [CrossRef]
  30. Gunyakov, V.A.; Timofeev, I.V.; Krakhalev, M.N.; Zyryanov, V.Y. Polarization exchange of optical eigenmode pair in twisted-nematic Fabry-Pérot resonator. Phys. Rev. E 2017, 96, 022711. [Google Scholar] [CrossRef] [PubMed]
  31. Gunyakov, V.; Timofeev, I.; Krakhalev, M.; Lee, W.; Zyryanov, V.Y. Electric field-controlled transformation of the eigenmodes in a twisted-nematic Fabry–Pérot cavity. Sci. Rep. 2018, 8, 16869. [Google Scholar] [CrossRef]
  32. Zhu, X.; Hong, Q.; Huang, Y.; Wu, S.-T. Eigenmodes of a reflective twisted-nematic liquid-crystal cell. J. Appl. Phys. 2003, 94, 2868–2873. [Google Scholar] [CrossRef]
  33. Yang, D.-K.; Wu, S.-T. Fundamentals of Liquid Crystal Devices; John Wiley & Sons: Hoboken, NJ, USA, 2014. [Google Scholar]
  34. Jagodič, U.; Vellaichamy, M.; Škarabot, M.; Muševič, I. Surface alignment of nematic liquid crystals by direct laser writing of photopolymer alignment layers. Liq. Cryst. 2023, 50, 1999–2009. [Google Scholar] [CrossRef]
  35. Patel, J.S. Electrically tunable ferroelectric liquid-crystal Fabry–Perot filter. Opt. Lett. 1992, 17, 456–458. [Google Scholar] [CrossRef] [PubMed]
  36. Mrukiewicz, M.; Kowiorski, K.; Perkowski, P.; Mazur, R.; Djas, M. Threshold voltage decrease in a thermotropic nematic liquid crystal doped with graphene oxide flakes. Beilstein J. Nanotechnol. 2019, 10, 71–78. [Google Scholar] [CrossRef] [PubMed]
  37. Mrukiewicz, M.; Perkowski, P.; Mazur, R.; Chojnowska, O.; Piecek, W.; Dąbrowski, R. Strong modulation of electric permittivity at an isotropic-nematic phase transition in a liquid crystal mixture for optical devices based on the Kerr effect. J. Mol. Liq. 2016, 223, 873–879. [Google Scholar] [CrossRef]
  38. Zgłobicka, I.; Chlanda, A.; Woźniak, M.; Łojkowski, M.; Szoszkiewicz, R.; Mazurkiewicz-Pawlicka, M.; Święszkowski, W.; Wyroba, E.; Kurzydłowski, K.J. Microstructure and nanomechanical properties of single stalks from diatom Didymosphenia geminata and their change due to adsorption of selected metal ions. J. Phycol. 2017, 53, 880–888. [Google Scholar] [CrossRef] [PubMed]
  39. Dark, M.; Moore, M.; Shenoy, D.; Shashidhar, R. Rotational viscosity and molecular structure of nematic liquid crystals. Liq. Cryst. 2006, 33, 67–73. [Google Scholar] [CrossRef]
  40. Jewell, S.A.; Hendry, E.; Isaac, T.H.; Sambles, J.R. Tuneable Fabry–Perot etalon for terahertz radiation. New J. Phys. 2008, 10, 033012. [Google Scholar] [CrossRef]
Figure 1. Schematic diagram of designed electrically tunable LC transmission filter: Si/ Glass-ITO Ag (Indium Tin Oxide)-Ag (Silver) with PVA (Polyvinyl Alcohol) layers. The filter is composed of a 1.2 μm LC (Liquid Crystal) layer sandwiched between substrates, with a Mylar spacer for maintaining the gap. The system is controlled by a variable voltage source, allowing for the tuning of the filter. Incident light is filtered to produce infrared (IR) radiation, which is then detected.
Spectroscj 03 00026 g001
Figure 2. Curve for threshold voltage versus active cell thickness.
Spectroscj 03 00026 g002
Figure 3. Curve for switch-on time versus active cell thickness at variable applied voltages.
Spectroscj 03 00026 g003
Figure 4. Transmission spectra of filters at variable applied voltages: (a) Si-ITO-Ag; (b) G-ITO-Ag.
Spectroscj 03 00026 g004
Figure 5. (a) Transmission peak shifting at varying voltages for a single band in Si-ITO-Ag; (b) transmission peak shifting at varying voltages for multiple bands in Si-ITO-Ag.
Spectroscj 03 00026 g005
Figure 6. (a) Transmission peak shifting at varying voltages for a single band in G-ITO-Ag; (b) transmission peak shifting at varying voltages for multiple bands in G-ITO-Ag.
Spectroscj 03 00026 g006
Figure 7. (a) Transmission spectra of half-cell (one side of the Fabry–Perot cavity) consisting of silver and ITO on silicon substrate; (b) Transmission spectra of half-cell consisting of silver and ITO on glass substrate.
Spectroscj 03 00026 g007
Figure 8. Two-dimensional plot of transmission against wavelength for variable refractive indices: (a) Si-ITO-Ag and (b) G-ITO-Ag.
Spectroscj 03 00026 g008
Figure 9. (a) Transmission spectra for variable refractive indices against wavelength; (b) Transmission spectra of filter 1 at 0 V.
Spectroscj 03 00026 g009
Disclaimer/Publisher’s Note: The statements, opinions and data contained in all publications are solely those of the individual author(s) and contributor(s) and not of MDPI and/or the editor(s). MDPI and/or the editor(s) disclaim responsibility for any injury to people or property resulting from any ideas, methods, instructions or products referred to in the content.