1. Introduction
The concept of function is one of the central organizing ideas of mathematics and forms the foundation of advanced topics such as limits, derivatives, and integrals. A solid understanding of functions is therefore essential for mathematical reasoning and for engaging in mathematical modeling across contexts. In mathematics education, functions are not merely procedural tools but conceptual structures that require coordination among multiple forms of representation.
Pre-service teachers are typically introduced to functions in a one-variable context and tend to conceptualize them as relationships in which a change in one variable determines the other [
1,
2]. However, when they encounter two-variable functions at the university level, this prior understanding often proves insufficient. Research consistently shows that students are more successful with one-variable functions than with two-variable functions and experience significant difficulties when transitioning between the two [
3,
4,
5,
6]. Because schemas developed for one-variable functions cannot be directly generalized to two-variable situations, students are required not only to learn new content but also to reorganize their existing understanding of functions. In this regard, Trigueros and Martínez-Planell [
7] emphasize that understanding two-variable functions involves restructuring and extending prior knowledge of one-variable functions. The challenge, therefore, reflects a transition problem involving conceptual reorganization rather than a simple lack of knowledge.
This conceptual reorganization is closely related to the representational nature of the function concept. Functions can be expressed through algebraic expressions, graphs, tables, and verbal explanations. Meaningful understanding requires flexible coordination and translation among these representations [
8,
9]. When learners fail to establish connections between representations, they may treat each representation as an isolated topic rather than as different expressions of the same underlying relationship [
10]. Such fragmentation can hinder deep functional reasoning.
Although a substantial body of research has examined students’ understanding of one-variable functions and their representations, studies focusing on two-variable relations remain comparatively limited [
11,
12]. Existing findings indicate that transitions between algebraic and graphical representations pose persistent difficulties, particularly when moving from algebraic forms to graphs [
13,
14]. Moreover, research suggests that generalizations developed for one-variable functions do not automatically support representational transformations in two-variable contexts [
7].
The ability to move flexibly between representations is important not only for student learning but also for instructional quality. Teachers need to understand how students think across representations in order to interpret their errors, provide appropriate explanations, and guide the learning process. Studies have shown that teachers who effectively use multiple representations are more successful in supporting students’ conceptual understanding [
13,
15]. From a constructivist perspective, new mathematical knowledge is built through the reorganization and extension of prior cognitive structures [
16,
17]. Accordingly, investigating how pre-service teachers transform representations in one-variable contexts, and how this competence extends to two-variable contexts, is essential for understanding this transition.
Given that algebraic–graphical transformations are among the most challenging representational shifts for pre-service teachers [
18], it is important to examine their strategies and levels of proficiency in both one- and two-variable settings. Identifying how skills developed in one-variable contexts are reflected in two-variable situations may provide insights into how instruction on one-variable functions should be structured to better support later learning. The findings of such research have the potential not only to offer alternative explanations for pre-service teachers’ difficulties but also to inform instructional design.
The present study aims to examine pre-service mathematics teachers’ abilities to transform between algebraic and graphical representations in the context of one- and two-variable relations. In research on representational competence, matching and graphing tasks are among the most frequently used activities to assess transformation skills [
19,
20]. Therefore, this study specifically focuses on distinguishing between matching and graphing tasks when examining representational transitions.
It is also important to note that some fundamental curves and surfaces, such as circles and spheres, do not represent functions in the strict mathematical sense. Although the term “function” is frequently used in this study, the broader term “relation” is adopted to encompass all relevant algebraic expressions, including those that may not define functions. This study is guided by the following research questions:
How proficient are pre-service teachers in matching algebraic expressions with the graphs of one- and two-variable relations?
How proficient are pre-service teachers in graphing one- and two-variable relations based on their algebraic expressions?
Theoretical Background
One- and Two-Variable Functions
Functions are one of the fundamental structures in mathematics. The concept of function serves as a central and unifying theme in school mathematics, encompassing diverse mathematical meanings, interpretations, and representations [
21]. Furthermore, functions play a crucial role in understanding other foundational mathematical concepts such as limits, derivatives, and integrals, all of which rely on functional reasoning [
1,
22]. For these reasons, the function concept holds a significant place in mathematics education.
Pre-service teachers are first introduced to the concept of functions during high school. At this level, the foundational aspects of functions are taught through multiple representations, progressing to topics such as quadratic, exponential, logarithmic, and trigonometric functions [
1,
2]. Pre-service teachers who pursue a mathematics-oriented undergraduate education expand upon this foundation to develop a more comprehensive understanding of functions. Notably, they encounter two-variable functions for the first time at the university level. Studies have shown that pre-service teachers who are more familiar with one-variable functions tend to perform better with them compared to two-variable functions [
3,
4,
5,
6]. One contributing factor to this discrepancy is that many key properties of one-variable functions also apply to two-variable functions, making the transition between the two challenging for learners. Trigueros and Martínez-Planell [
7] emphasize that it is not straightforward for pre-service teachers to generalize their understanding of one-variable functions to the context of two-variable functions.
The challenges pre-service teachers face with functions are not limited to transitioning from one-variable to two-variable functions. Research indicates that pre-service teachers encounter various conceptual difficulties with both types [
3,
23,
24,
25,
26,
27]. These difficulties may stem from the inherent of the function concept itself, which encompasses numerous related ideas such as one-variable and multi-variable functions, inverse functions, composite functions, and domain considerations [
28,
29,
30].
Multiple Representations in Functions
Another source of difficulty lies in the diversity of representations associated with functions. The multiplicity of representations and the necessity to transition between them can complicate the problem-solving process [
29,
30,
31]. In this context, pre-service teacher awareness becomes crucial. If students lack an understanding of how representations are interconnected, they may perceive each representation as an isolated topic [
10]. This highlights the importance of grasping representational connections. Although pre-service teachers often struggle with handling multiple representations, these representations are essential for a deep understanding of functions. As emphasized by the National Council of Teachers of Mathematics [
31], representations are central to developing pre-service teachers’ understanding of functions, and instructional emphasis should be placed on representation of transformations.
One of the fundamental properties of the function concept is its expressibility in multiple forms, including tables, algebraic expressions, graphs, and verbal descriptions. The use of these representations and the ability to transfer key information between them is critical for understanding functions [
32,
33]. Representations serve as essential tools for conceptualizing mathematical ideas, performing operations, and communicating meaning. Moreover, they play a mediating role in the development of conceptual understanding, as the ability to move fluently between different representations of a single concept is widely regarded as an indicator of conceptual comprehension [
9]. Utilizing multiple representations is also a prerequisite for the real-world applicability of mathematics [
34]. Given these considerations, representation is clearly central to understanding functions. In this context, the ability to transform between representations is vital for developing a sound understanding of both one and two-variable functions.
Algebraic and Graphical Representations
Among various types of representations, graphical and algebraic forms are particularly significant. This is because, beyond being distinct symbolic systems, algebraic and graphical representations work together to construct and define the function concept [
8]. In instructional contexts, assessing pre-service teachers’ understanding of functions often involves evaluating their ability to recognize and relate these two forms of representation [
35]. Therefore, while algebraic and graphical representations are highly prominent, the ability to transform between them serves as a useful lens for examining pre-service teachers’ conceptual understanding of functions. Pre-service teachers’ proficiency in transforming between graphical and algebraic forms reflects the depth of their functional understanding. Chinnappan and Thomas [
13] support this view, arguing that pre-service teachers who fail to recognize the algebraic structures underlying graphical representations often experience significant gaps in their functional understanding.
There is a substantial body of literature focusing on one-variable and two-variable functions and their representations [
5,
29,
36,
37,
38,
39,
40]. Studies on one-variable functions reveal that pre-service teachers have trouble converting graphical representations to algebraic forms [
13,
38], transitioning from algebraic to graphical representations [
14], and establishing connections between graphical and algebraic representations in linear functions [
41]. Additional research indicates that teachers infrequently present problems requiring transitions between these forms in classroom settings, which contributes to pre-service teacher difficulties [
42]. Pre-service teachers also struggle to move between representations of functions, particularly toward graphical forms, and there appears to be a relationship between pre-service teachers’ ability to shift representations and their overall problem-solving performance [
24].
In terms of two-variable functions, the literature shows that pre-service teachers often struggle with graphical representations [
3,
4,
26,
37,
43]. Although pre-service teachers may demonstrate competency in performing algebraic operations on two-variable functions, they frequently encounter difficulties when interpreting or constructing graphical representations [
44]. While the research base for one-variable functions is extensive, studies focusing on two-variable functions remain relatively limited [
11,
12]. This imbalance underscores a notable gap in the literature.
Cognitive Requirements of Matching and Graphing Tasks
Matching and graphing proficiencies are frequently used in research on representational competence to assess students’ ability to transform between algebraic and graphical representations [
19,
20]. Although these two transformation activities may appear structurally similar, they differ in important cognitive respects.
Both activities require representational translation; however, matching tasks may involve bidirectional coordination between representations, whereas graphing tasks are typically unidirectional and require the production of a new representation. The necessity to construct a graph from an algebraic expression increases cognitive demand, as students must generate rather than recognize structural correspondences. Research on graphical understanding emphasizes that graph construction requires coordinating symbolic manipulation with graphical meaning [
8].
A central cognitive requirement in both tasks is covariational reasoning, that is, reasoning about how changes in one quantity correspond to changes in another [
10]. In matching tasks, this reasoning may remain partially implicit, as students sometimes rely on perceptual similarity or elimination strategies [
14]. In contrast, graphing tasks require explicit coordination of variable change, particularly when determining slope, direction of change, and curvature.
Attention to structural features of functions, such as intercepts, roots, rate of change, increasing–decreasing behavior, and extrema, is another shared cognitive demand. Structural reasoning has been identified as central to relational understanding of mathematical representations [
45]. Students who focus on these features are more likely to establish meaningful connections between algebraic expressions and graphs [
14]. In matching activities, however, some structural properties may be bypassed if surface-level cues appear sufficient.
Both tasks also require conceptual and relational understanding, rather than mere procedural execution. According to Hiebert and Carpenter [
45], meaningful understanding involves recognizing relationships among representations and interpreting their mathematical significance. Similarly, Leinhardt et al. [
8] emphasize that successful graphing entails understanding what graphical features represent in terms of underlying quantitative relationships.
For two-variable functions, the cognitive demands increase substantially. Students must engage in multivariable covariational reasoning, coordinating simultaneous variation between two independent variables and a dependent variable [
10]. Research shows that students often struggle to conceptualize graphs as surfaces rather than as collections of curves [
11]. Effective strategies such as reasoning with level curves or cross-sections require spatial visualization and representational flexibility, competencies that are frequently underdeveloped [
11]. Furthermore, because schemas constructed for one-variable functions cannot be directly generalized to two-variable contexts, learners must reorganize and reconstruct their existing conceptual structures [
4].
In summary, while both matching and graphing require representational coordination, structural reasoning, and conceptual understanding, graphing tasks, particularly in two-variable contexts, impose greater cognitive load due to the necessity of explicit construction, sustained covariational reasoning, and spatial coordination across representations.
Teacher Professional Competence and Representational Knowledge
Representations help make abstract mathematical concepts and problem situations more accessible and visible [
34,
46]. Because of the inherently abstract nature of functions, this topic often presents substantial challenges for pre-service teachers. The Ministry of National Education [
2] therefore emphasizes that mathematics instruction should incorporate multiple representations in the structuring of mathematical knowledge. The coordinated use of algebraic, graphical, and tabular representations can support understanding of different aspects of functions.
Within this process, teachers play a critical role. Research shows that students taught by teachers who lack adequate content knowledge and pedagogical skills tend to demonstrate lower achievement in mathematics e.g., [
47,
48]. Shulman [
49] argues that teacher competence cannot be reduced to subject-matter knowledge alone; rather, it requires the integrated development of content knowledge and pedagogical content knowledge. In particular, pedagogical content knowledge enables teachers to transform their mathematical understanding into forms that are teachable and comprehensible to learners [
49,
50]. Accordingly, teacher competencies are closely related to the professional knowledge structures developed during teacher education [
50]. For this reason, teacher education programs must be structured to develop both the subject knowledge and pedagogical knowledge of preservice teachers. It is important for preservice teachers to prepare for the teaching process by integrating these types of knowledge.
Moreover, teachers’ content knowledge directly influences the quality of students’ learning experiences [
15]. Teachers who are proficient in using multiple representations of functions are better able to support students’ understanding in classroom settings [
13]. The ability to switch between representations is not only an indicator of conceptual understanding, but it can also be said to be a component of professional teaching competence.
Teachers must recognize the representations students use and be able to make meaningful transformations between these representations in order to interpret students’ solutions, diagnose faulty reasoning, and decide on appropriate instructional interventions. In this context, representational fluency can be said to be related not only to the teacher’s mathematical knowledge but also to their teaching skills. For this reason, it is important that pre-service teachers develop representational fluency prior to entering the profession, and that their competencies be assessed in order to identify potential areas of weakness. Examining preservice teachers’ ability to translate between representations is important not only for understanding students’ conceptual knowledge but also for understanding the professional competencies that will guide their future teaching practices.
2. Method
2.1. Research Design
This study adopted a qualitative research approach and was designed as a case study. A case study involves the in-depth exploration of a particular issue through one or more cases within a bounded system [
51]. A review of the literature indicates that qualitative case studies are the most frequently preferred methodology in research on multiple representations [
18,
52]. In the present study, preservice teachers’ transformation skills between algebraic and graphical representations were examined in the context of one- and two-variable relations. To this end, qualitative data collection instruments were developed to assess their ability to match algebraic and graphical representations and to construct the graphical representation of a relation when its algebraic representation was provided. The analysis focused on the preservice teachers’ performance in these activities as well as the strategies they employed. In addition, individual interviews were conducted with the preservice teachers to elicit their self-evaluations of their performance in the relevant tasks, the difficulties they experienced, and their views regarding the sources of these difficulties.
2.2. Research Group
The research group consisted of 85 pre-service mathematics teachers enrolled in the second year of department of primary school mathematics education at two public universities located in Türkiye. All pre-service teachers successfully completed Analysis I, Analysis II, and Analysis III courses, which provide foundational knowledge of one- and two-variable functions and their properties. Details regarding the content of these courses are presented in
Table 1.
The opinions of eight pre-service teachers, randomly selected from a pool of 85 pre-service mathematics teachers, were collected using interview forms. To ensure anonymity, the pre-service teachers were identified by codes: PT1, PT2, PT3, PT4, PT5, PT6, PT7, and PT8, rather than by their real names.
2.3. Data Collection Tool
In this study, the Algebraic–Graphical Representation Skill Form (AGRSF) was developed to assess preservice mathematics teachers’ abilities to relate algebraic and graphical representations of one- and two-variable relations. The AGRSF consists of two parts.
In the first part of AGRSF, preservice teachers were presented with the algebraic and graphical representations of three fundamental one-variable relations: (inverse parabola), (parabola), and (circle), together with eight surface equations involving two variables: , (closed-form parabolic cylinders); , (open-form parabolic cylinders); (cylinder); (paraboloid); (cone); and (sphere). Visualizations of these graphs were generated using MAPLE 2020.0 software.
The inclusion of the circle and parabola in the AGRSF is justified by their dual role: beyond being fundamental curves in the teaching of analysis, they also serve as level curves of the basic surfaces examined in the study. This design enabled the researchers not only to reveal preservice teachers’ skills resulting from prior instruction but also to examine their competencies regarding level curves, which are essential for surface analysis. In this way, it became possible to obtain insights into potential positive or negative transfer between one-variable and two-variable contexts.
The inverse parabola was specifically included to assess preservice teachers’ covariational reasoning related to the dependent–independent variable relationship. This allowed the researchers to determine whether preservice teachers’ covariational reasoning was restricted to a unidirectional perspective (i.e.,
as independent and
as dependent). As documented in the literature, one of the major difficulties in preservice teachers’ covariational reasoning is their tendency to focus exclusively on a single-directional dependent–independent variable relationship [
54,
55]. Similarly, the surfaces included in the AGRSF were selected because they are fundamental surfaces previously covered in instruction and are directly related to the one-variable functions used in the study.
In the matching activity of the AGRSF, a list of algebraic expressions of one- and two-variable relations was first presented. Subsequently, the graphical representations of these relations were provided in a mixed order. A blank space was placed beneath each graph for preservice teachers to write the corresponding algebraic expression, followed by the word “because” (see Figures 2, 4, 5 and 6). In this way, preservice teachers were required to match algebraic and graphical representations with justification. This design made it possible to examine not only their matching accuracy but also the reasoning underlying their decisions, thereby providing insight into the strategies they employed.
In the second part of AGRSF, preservice teachers were asked to sketch approximate graphs of selected one- and two-variable relations—specifically and —based on their algebraic expressions (see Figures 8–11).
To complement the AGRSF, an Interview Form (IF) was administered to gather qualitative data regarding preservice teachers’ perceptions of their performance. Through this form, preservice teachers were asked to reflect on the difficulties they encountered in each section and to elaborate on the sources of those difficulties.
Prior to implementation, preservice teachers were informed about the purpose and procedures of the study, and detailed instructions were provided on how to complete the data collection instruments. It was clearly stated that participation was entirely voluntary, that personal data would be kept confidential, and that all data would be used solely for scientific purposes. Preservice teachers were informed that they could withdraw from the study at any time and that participation would not affect their course grades or evaluations. Written informed consent was obtained from all preservice teachers.
The data collection instruments were administered in the preservice teachers’ regular classroom environment under the supervision of the first author. No time limit was imposed. It was observed that all preservice teachers completed and submitted the instruments within approximately two hours.
2.4. Data Analysis
Descriptive analysis was employed to examine the qualitative data collected in the study. In descriptive qualitative analysis, the categories to be used are determined in advance by the researchers or derived from the existing literature [
56]. In this study, a two-stage descriptive analysis was conducted. In the first stage, preservice teachers’ performance in the matching and graphing tasks was evaluated in terms of mathematical accuracy. In the second stage, the strategies they employed during these activities were analyzed.
Preservice teachers’ performance in the tasks involving the matching of algebraic and graphical representations, as well as graph sketching, was categorized as correct, partially correct, incorrect, or no response based on mathematical accuracy. These categories are defined below:
Correct match/graph: The algebraic and graphical representations of the relation were correctly matched/the graph of the relation was drawn correctly.
Partially correct graph: Although the increasing and decreasing intervals and critical points of the relation were correctly represented, there were differences in the type of curve (concave/convex).
Incorrect match/graph: The algebraic and graphical representations were not correctly matched/the graph of the relation was not drawn correctly.
No response: The response was left blank or was not analyzable.
In analyzing the arguments used by preservice teachers during the matching and graphing activities, the identification of strategies was informed by the existing literature [
8,
10,
14,
54,
57]. The strategies observed in preservice teachers’ transformation activities were categorized as axis analysis [
14], external warrants [
14], empirical warrants [
8], and covariational reasoning [
10]. These strategies are described below. While most preservice teachers tended to rely predominantly on a single strategy, some were found to employ multiple strategies.
Doing axis analysis: Analyzing the points at which curves intersect the coordinate axes.
Using empirical warrants: Substituting numerical values into algebraic expressions to infer the corresponding graphical representation.
Using external warrants: Relying on familiar forms or prior knowledge without engaging in detailed analysis.
Employing covariational reasoning: Reasoning about the relationship between dependent and independent variables.
To ensure the validity of the analysis, the descriptive data analysis was conducted independently by the authors. The authors then compared their analyses. Full agreement was achieved regarding the accuracy classifications of the matching and graphing tasks. For these analyses, the categories of correct, incorrect, and no response were used.
With respect to the identification of strategies, approximately 94% agreement was obtained for the matching activity and approximately 88% agreement for the graphing activity. The authors reconvened to discuss discrepancies. It was observed that disagreements primarily arose in the classification of flawed instances of covariational reasoning. These cases were re-evaluated in light of the primary analytical purpose and were ultimately categorized under covariational reasoning.
To further enhance the credibility of the analysis, an external academic expert holding a Ph.D. in Analysis and Function Theory reviewed the data. The expert independently evaluated the accuracy of the students’ responses in the matching and graphing sections. A discrepancy was identified only in the analysis of the correctness of one-variable function graphs. For this section, the agreement rate between the researchers and the expert was calculated as 80%.
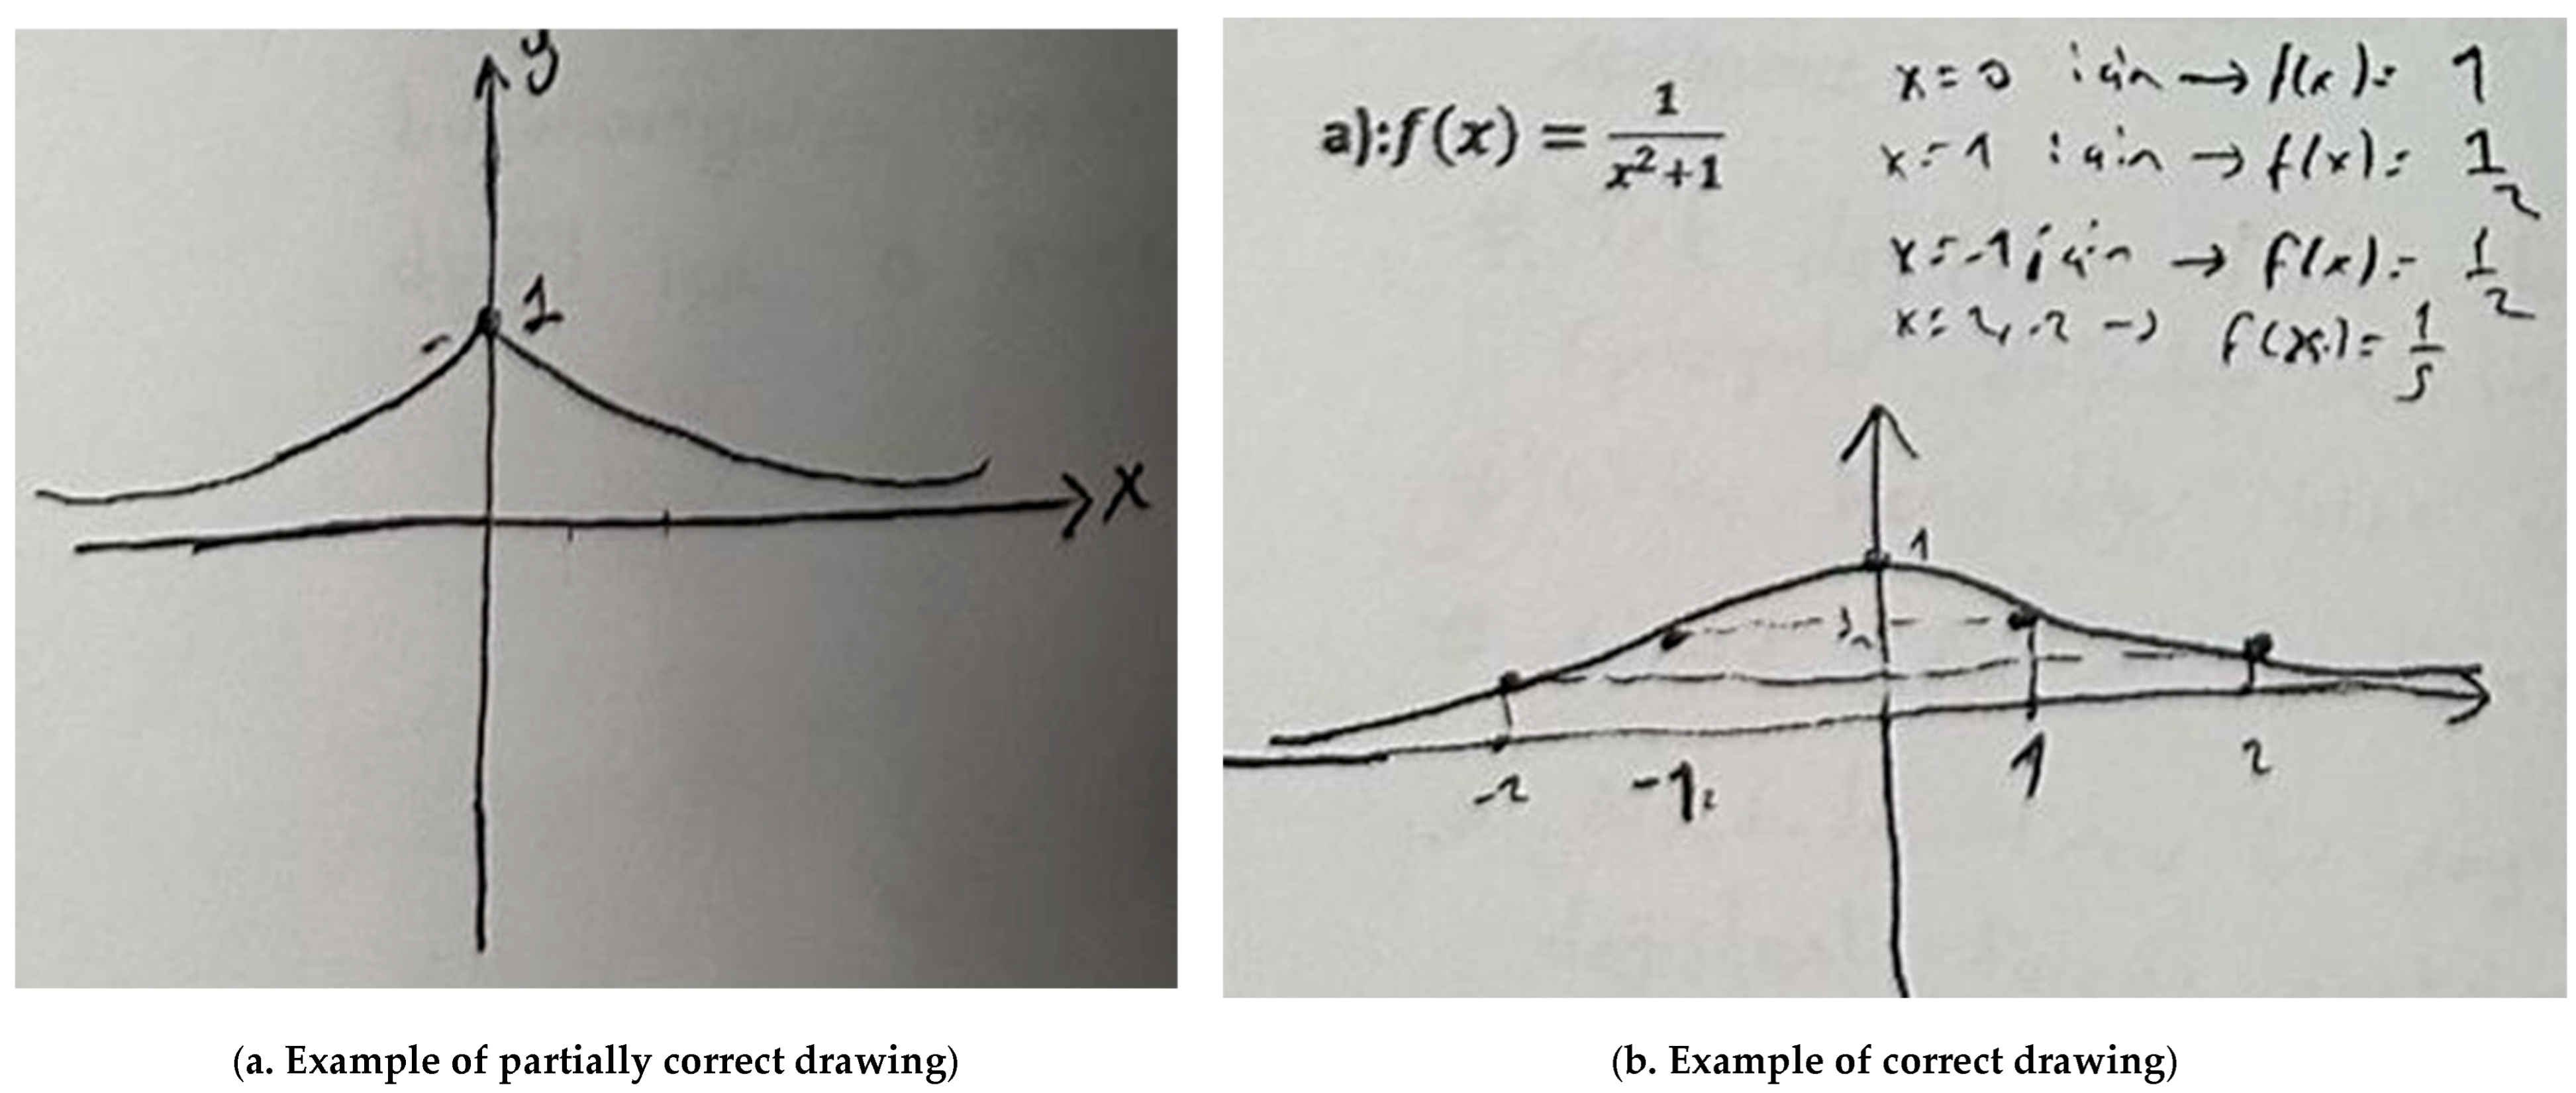
The 20% discrepancy in the graphing section stemmed from differing interpretations of one-variable function sketches, particularly regarding Figure 8a. While the expert considered Figure 8b, which closely resembled the expected graph, to be correct, Figure 8a was not fully accepted. Upon discussion, the researchers and the expert agreed that although Figure 8a did not perfectly match the expected graph, being represented entirely as a convex curve, it nevertheless captured essential features of the function’s overall behavior, including the horizontal asymptote and the maximum point. Given that preservice teachers were instructed to provide rough sketches, the authors concluded that graphs resembling Figure 8a could reasonably be classified as partially correct.
In presenting the data, a descriptive approach was adopted. The number of preservice teachers in each category for both the matching and graphing activities was first reported for each type of relation. Subsequently, representative excerpts from preservice teachers were provided to illustrate each category and the different strategies employed. The original statements of the preservice teachers were presented without any modification. English translations of these excerpts were included beneath the original responses to enhance clarity and comprehensibility.
Furthermore, preservice teachers’ errors and their reflections, collected through interview forms, were also analyzed descriptively. Their views were presented without any alteration.
3. Findings
Pre-service Teachers’ Abilities and Opinions Regarding the Matching of Algebraic and Graphical Representations of One- and Two-Variable Relations
This section presents the findings related to the pre-service mathematics teachers’ abilities to match algebraic expressions with corresponding graphical representations for one- and two-variable functions, as well as their opinions on this process. The primary aim was to investigate how effectively the pre-service teachers could interpret and transition between algebraic and graphical representations of mathematical relationships.
To this end, pre-service teachers were asked to match algebraic expressions and graphical representations for a total of eleven curves and surfaces. These included four parabolic cylinders (two in closed form), a standard cylinder, paraboloid, cone, and sphere, as well as three one-variable relations: two parabolas and a circle, all defined over the real numbers. This task was designed to assess pre-service teachers’ representational fluency—that is, their ability to convert between algebraic and graphical forms. The results pertaining to pre-service teachers’ performance in matching one-variable algebraic expressions with their corresponding graphs are presented in
Figure 1 below.
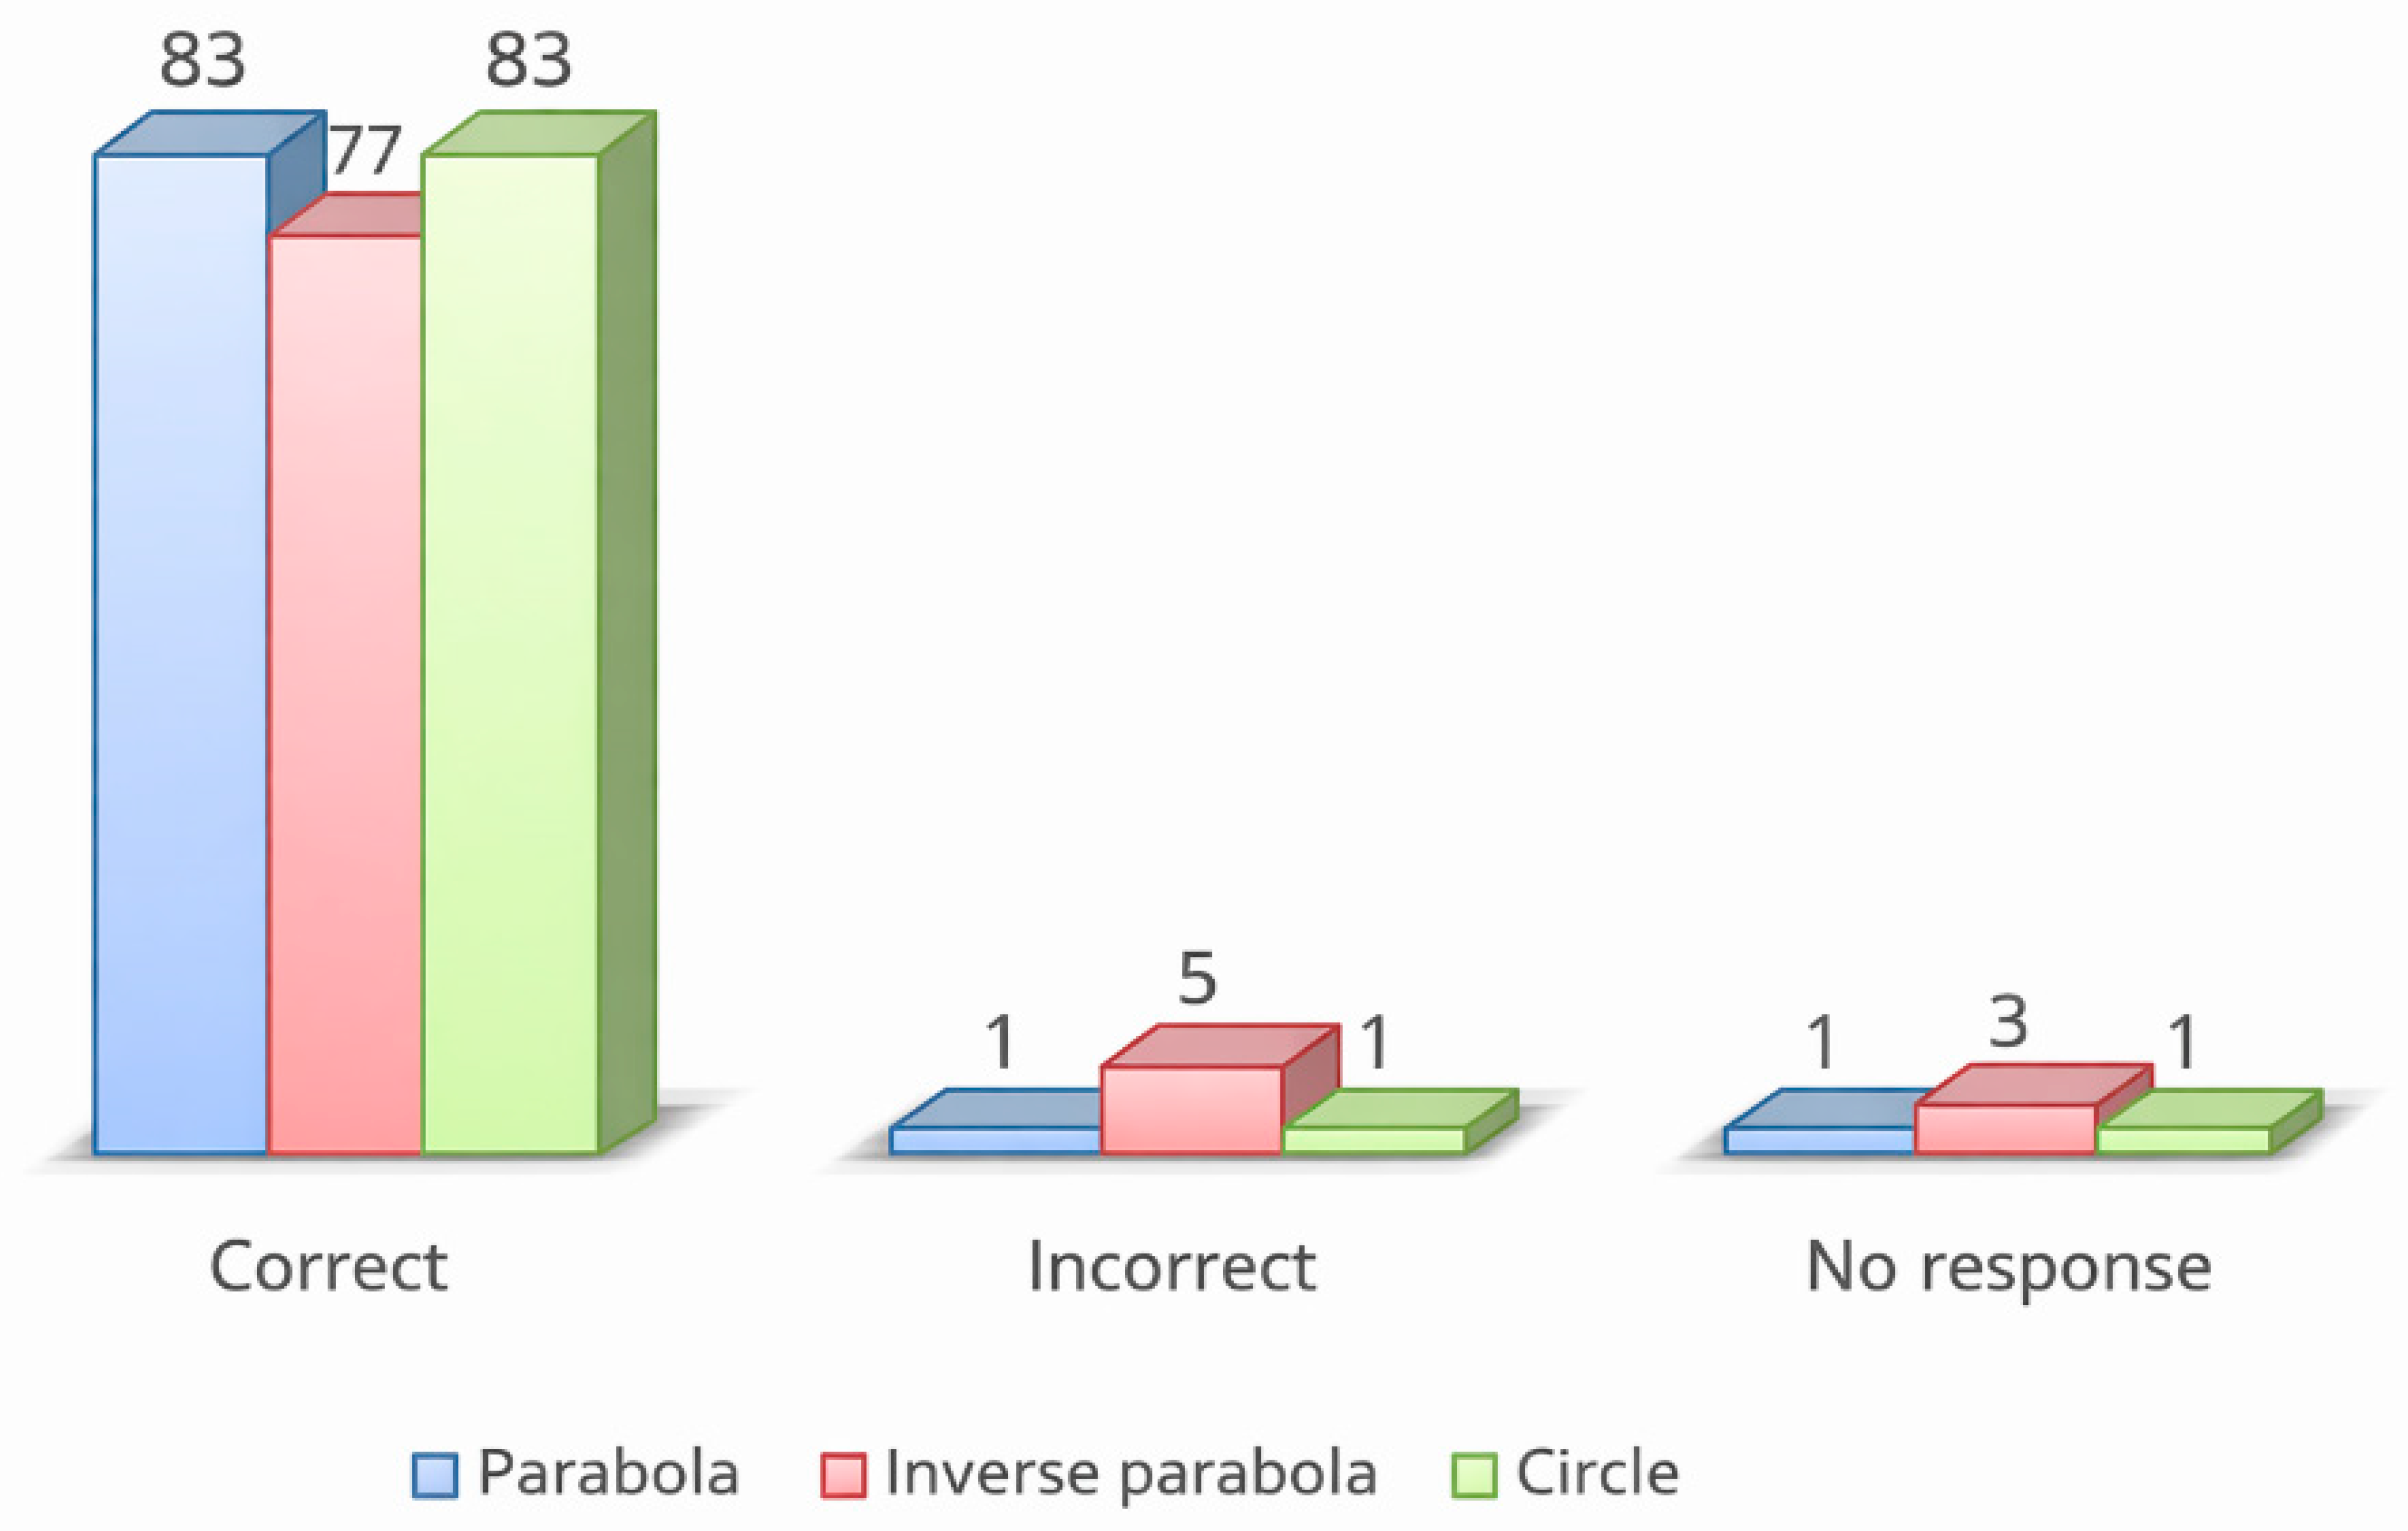
An examination of
Figure 1 reveals that the vast majority of pre-service teachers correctly matched the algebraic representations of one-variable relations with their corresponding graphs. These findings indicate that the pre-service teachers were generally successful in converting between algebraic and graphical representations for the given basic curves. However, it was observed that the number of correct matches for the inverse parabola
was slightly lower compared to the other relations.
These particular curves—parabolas and circles—are considered fundamental, as they often serve as level curves in the analysis and interpretation of graphs of two-variable relations. Thus, the ability to accurately recognize and relate these curves is essential for understanding more complex mathematical surfaces.
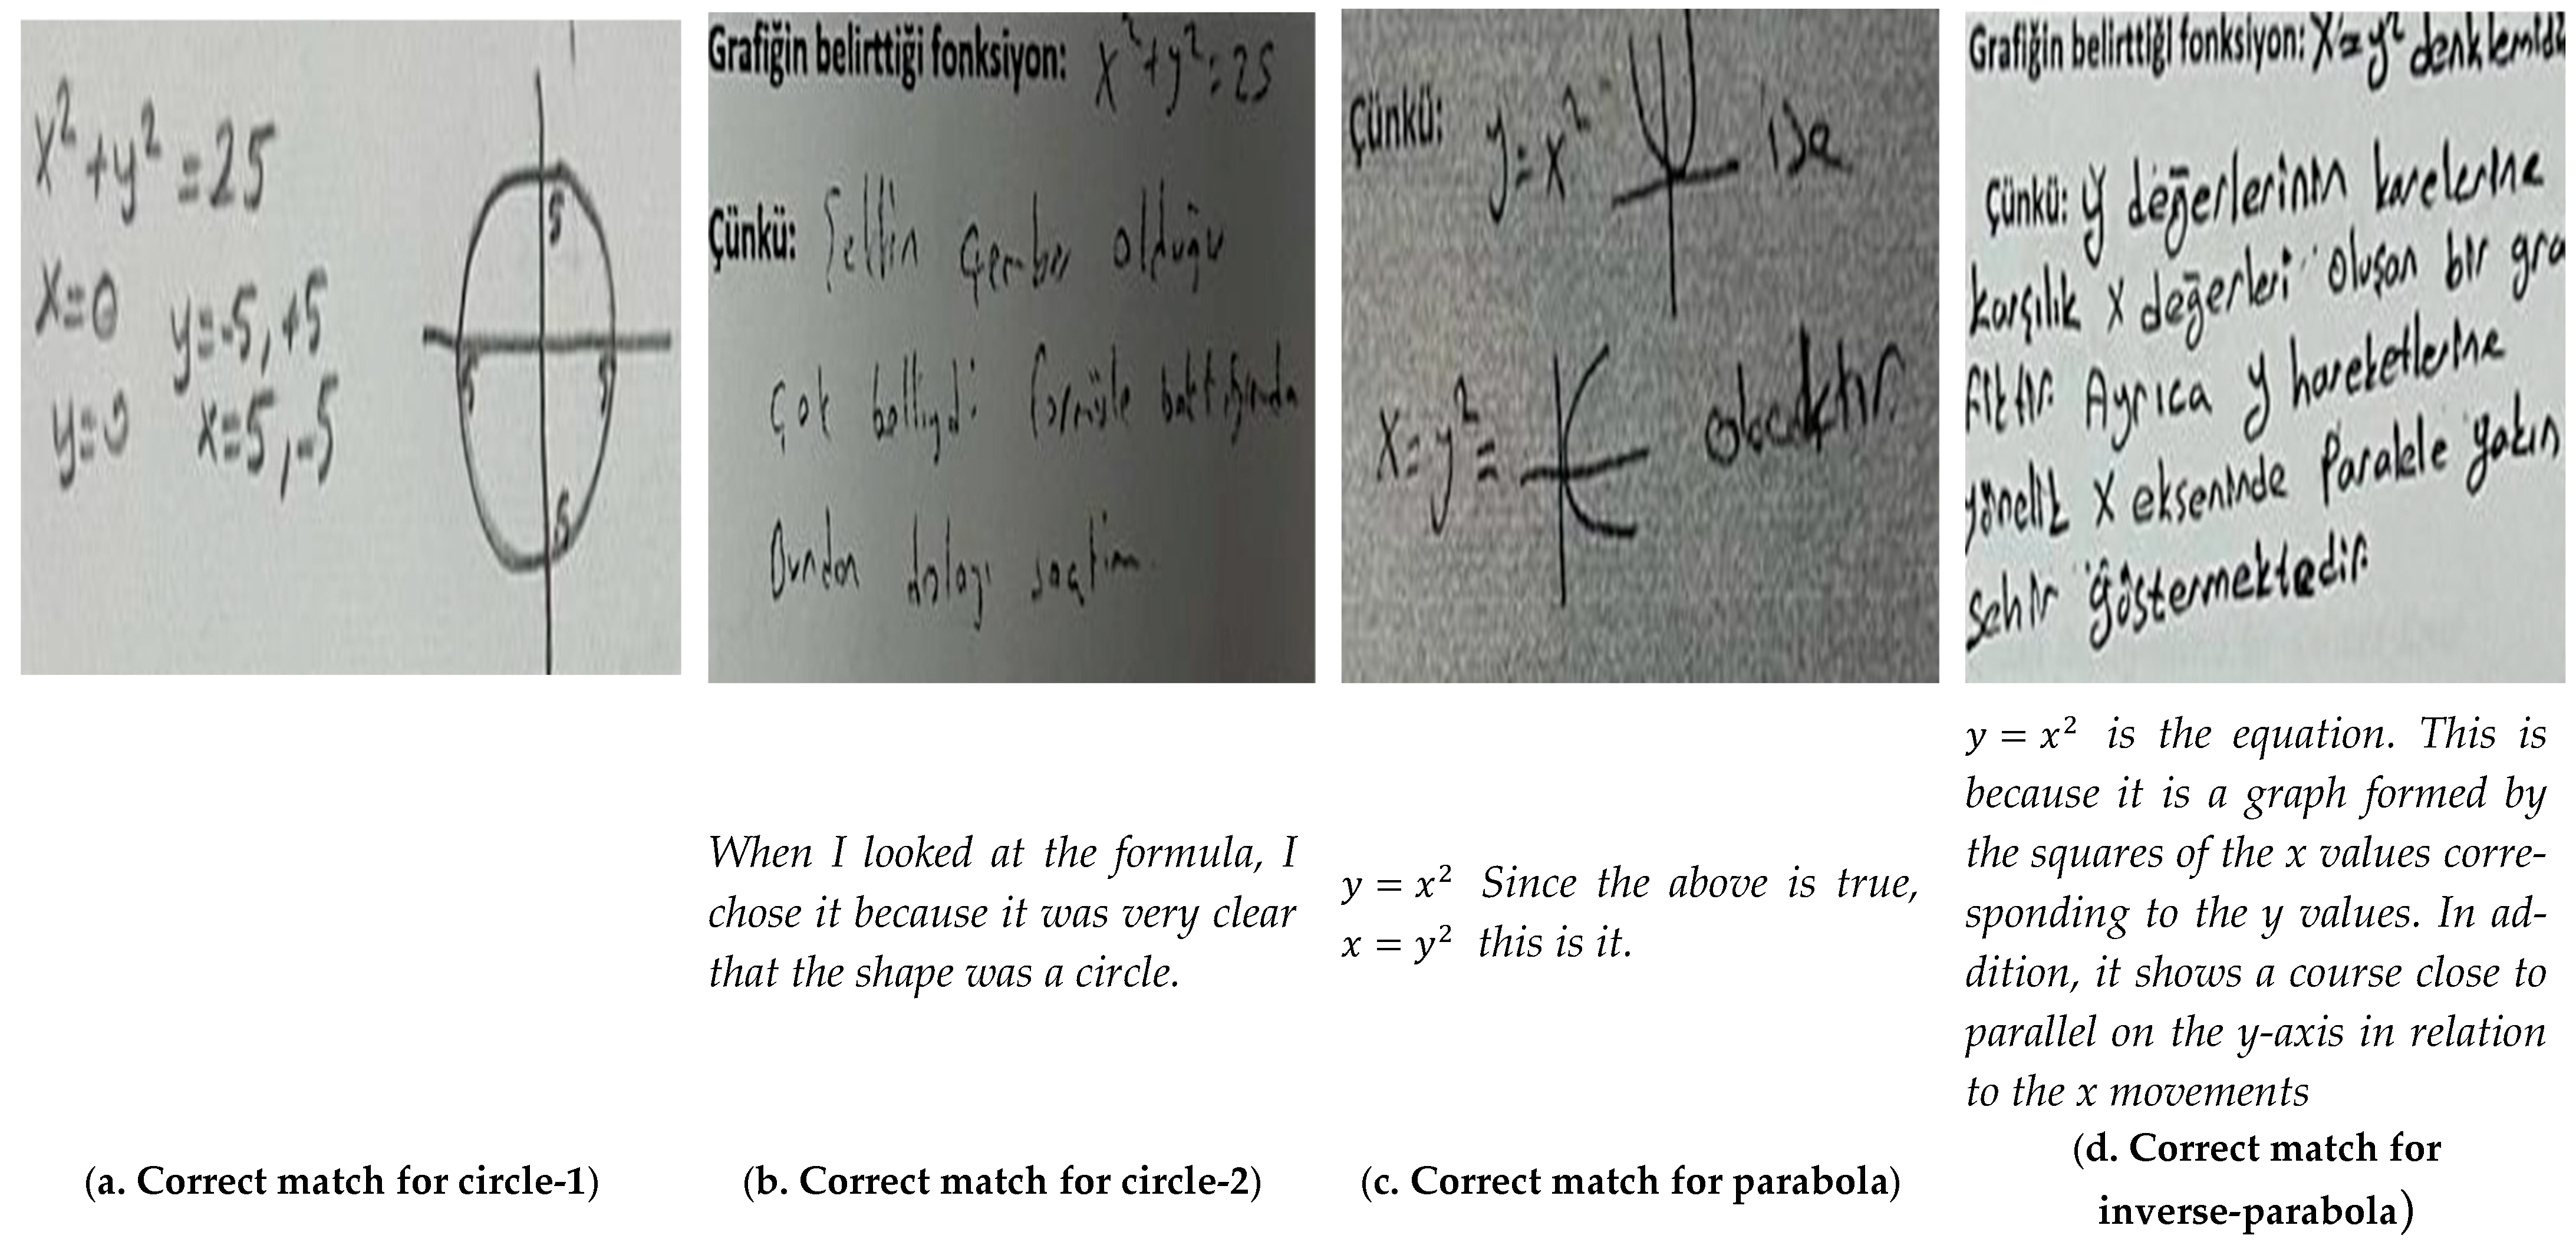
Figure 2 illustrate examples of correct matches provided by the pre-service teachers.
Although most pre-service teachers did not provide explicit justifications for their choices during the matching tasks, those who did typically employed one of four identifiable reasoning strategies. As illustrated in
Figure 2a, some pre-service teachers focused on identifying the points of intersection between the graph and the coordinate axes based on the given algebraic expression (axis analysis). In
Figure 2b, several pre-service teachers reported recognizing the general form of the circle equation and relied on this familiarity to guide their decision (external warrants). In
Figure 2c, pre-service teachers matched the parabolic curves by considering their mutual relationships, particularly recognizing the structural similarity and the reversal of dependent and independent variables—an indication of their awareness of relation inversion (covariational reasoning). Similarly,
Figure 2d demonstrates attempts to interpret algebraic expressions geometrically, with attention to the roles of dependent and independent variables. Additionally, some pre-service teachers occasionally utilized numerical substitutions within algebraic expressions to support their graphical matching decisions (empirical warrants).
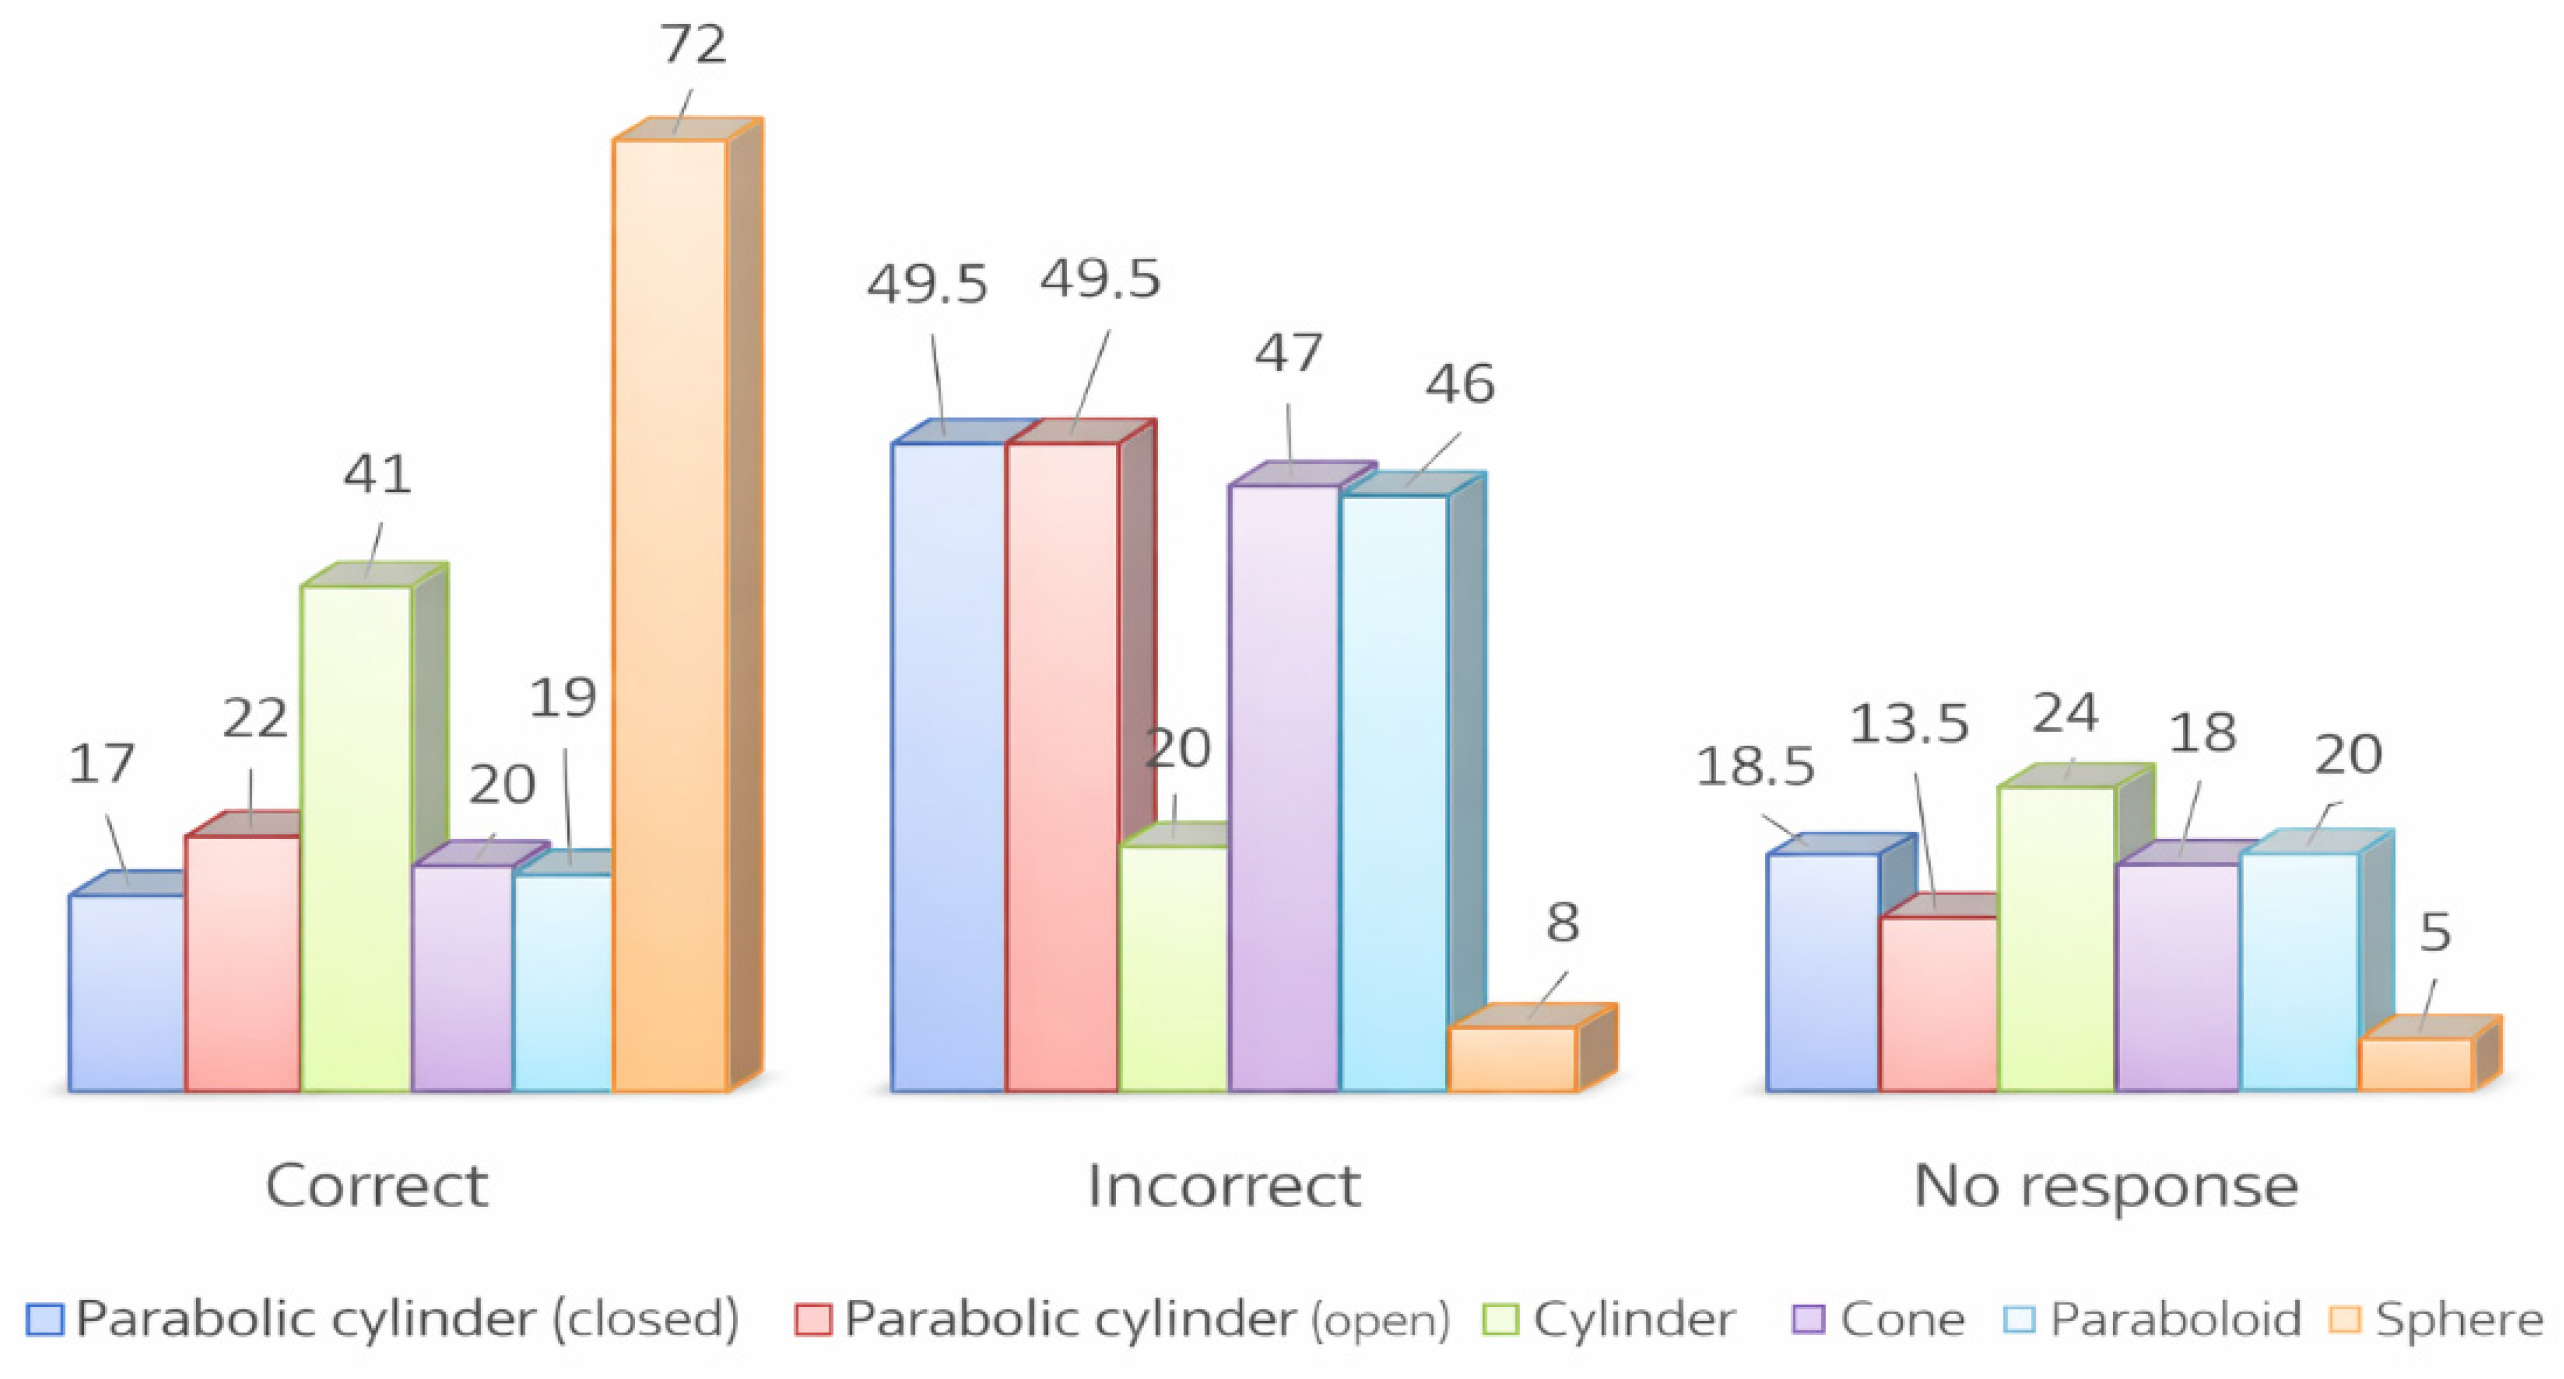
Following this task, pre-service teachers were asked to match eight algebraic expressions representing two-variable relations with their corresponding graphical representations. The results of this task are presented in
Figure 3.
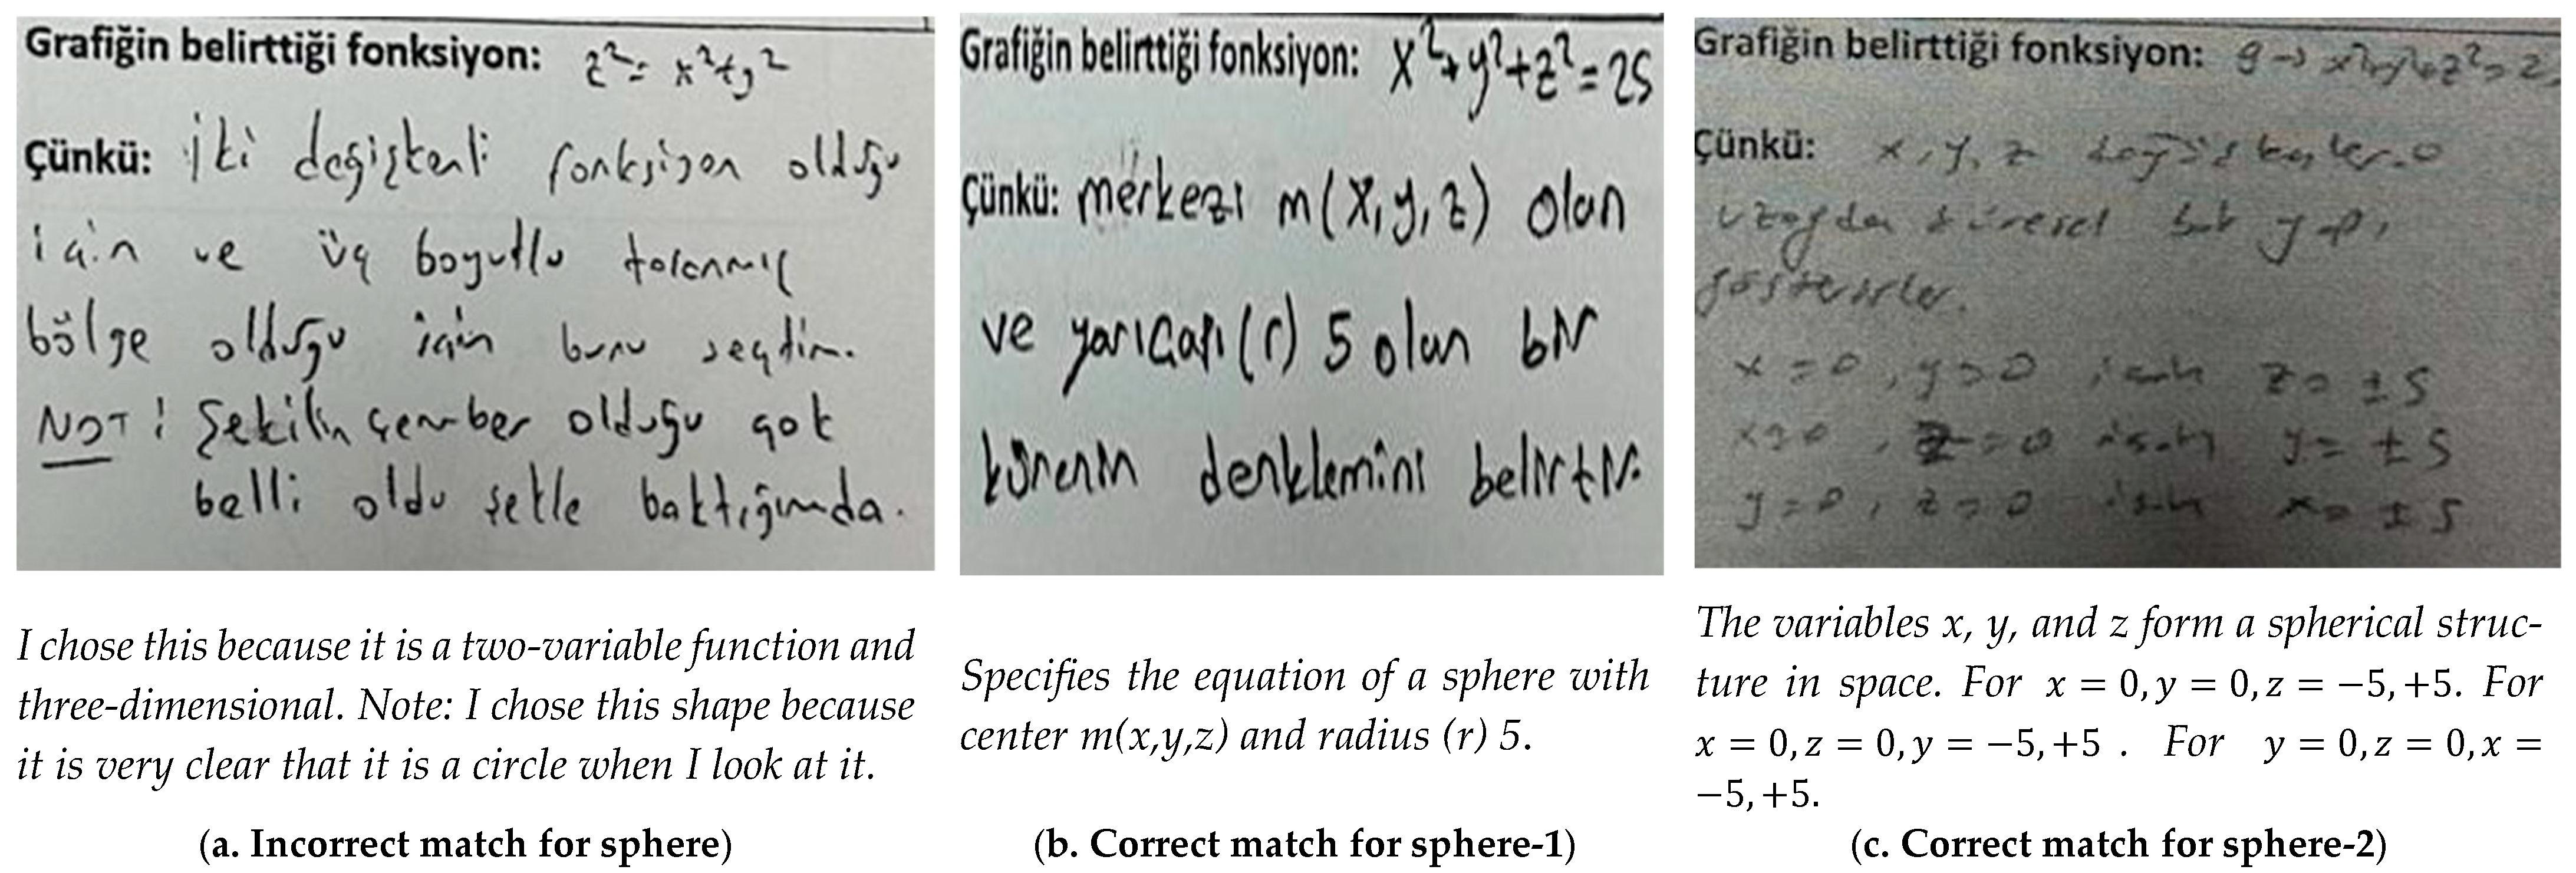
Pre-service teachers were presented with eight algebraic and graphical representations of two-variable relations. The first four of these surfaces can be interpreted as parabolic cylinders, identifiable through level curves of parabolas, while the remaining four represent cylinders, paraboloids, cones, and spheres, which can be recognized through level curves of circles. Analysis of the results revealed that most pre-service teachers were unable to correctly match the algebraic expressions with the corresponding graphs for the first four relations involving parabolic cylinders. In particular, the closed-form representations of two parabolic cylinders posed significant challenges. In contrast, the majority of pre-service teachers correctly identified the algebraic representation of the sphere defined by a center at the origin and a radius of 5 units. Similar to their performance on the one-variable matching task, most pre-service teachers did not provide justifications for their selections. Among those who did, responses indicated a familiarity with the standard equation of a sphere—much like their recognition of the circle equation in the previous section (external warrants). These pre-service teachers also attempted to match algebraic expressions to graphs by locating points of intersection with coordinate axes (axis analysis).
Figure 4 illustrate examples of such pre-service teacher strategies.
Approximately half of the pre-service teachers were able to correctly match the algebraic expression of the cylinder with its corresponding graphical representation. However, the majority of pre-service teachers had trouble in identifying the correct matches for paraboloid and cone. These findings suggest that pre-service teachers struggled to distinguish between surfaces with similar general shapes but differing algebraic structures.
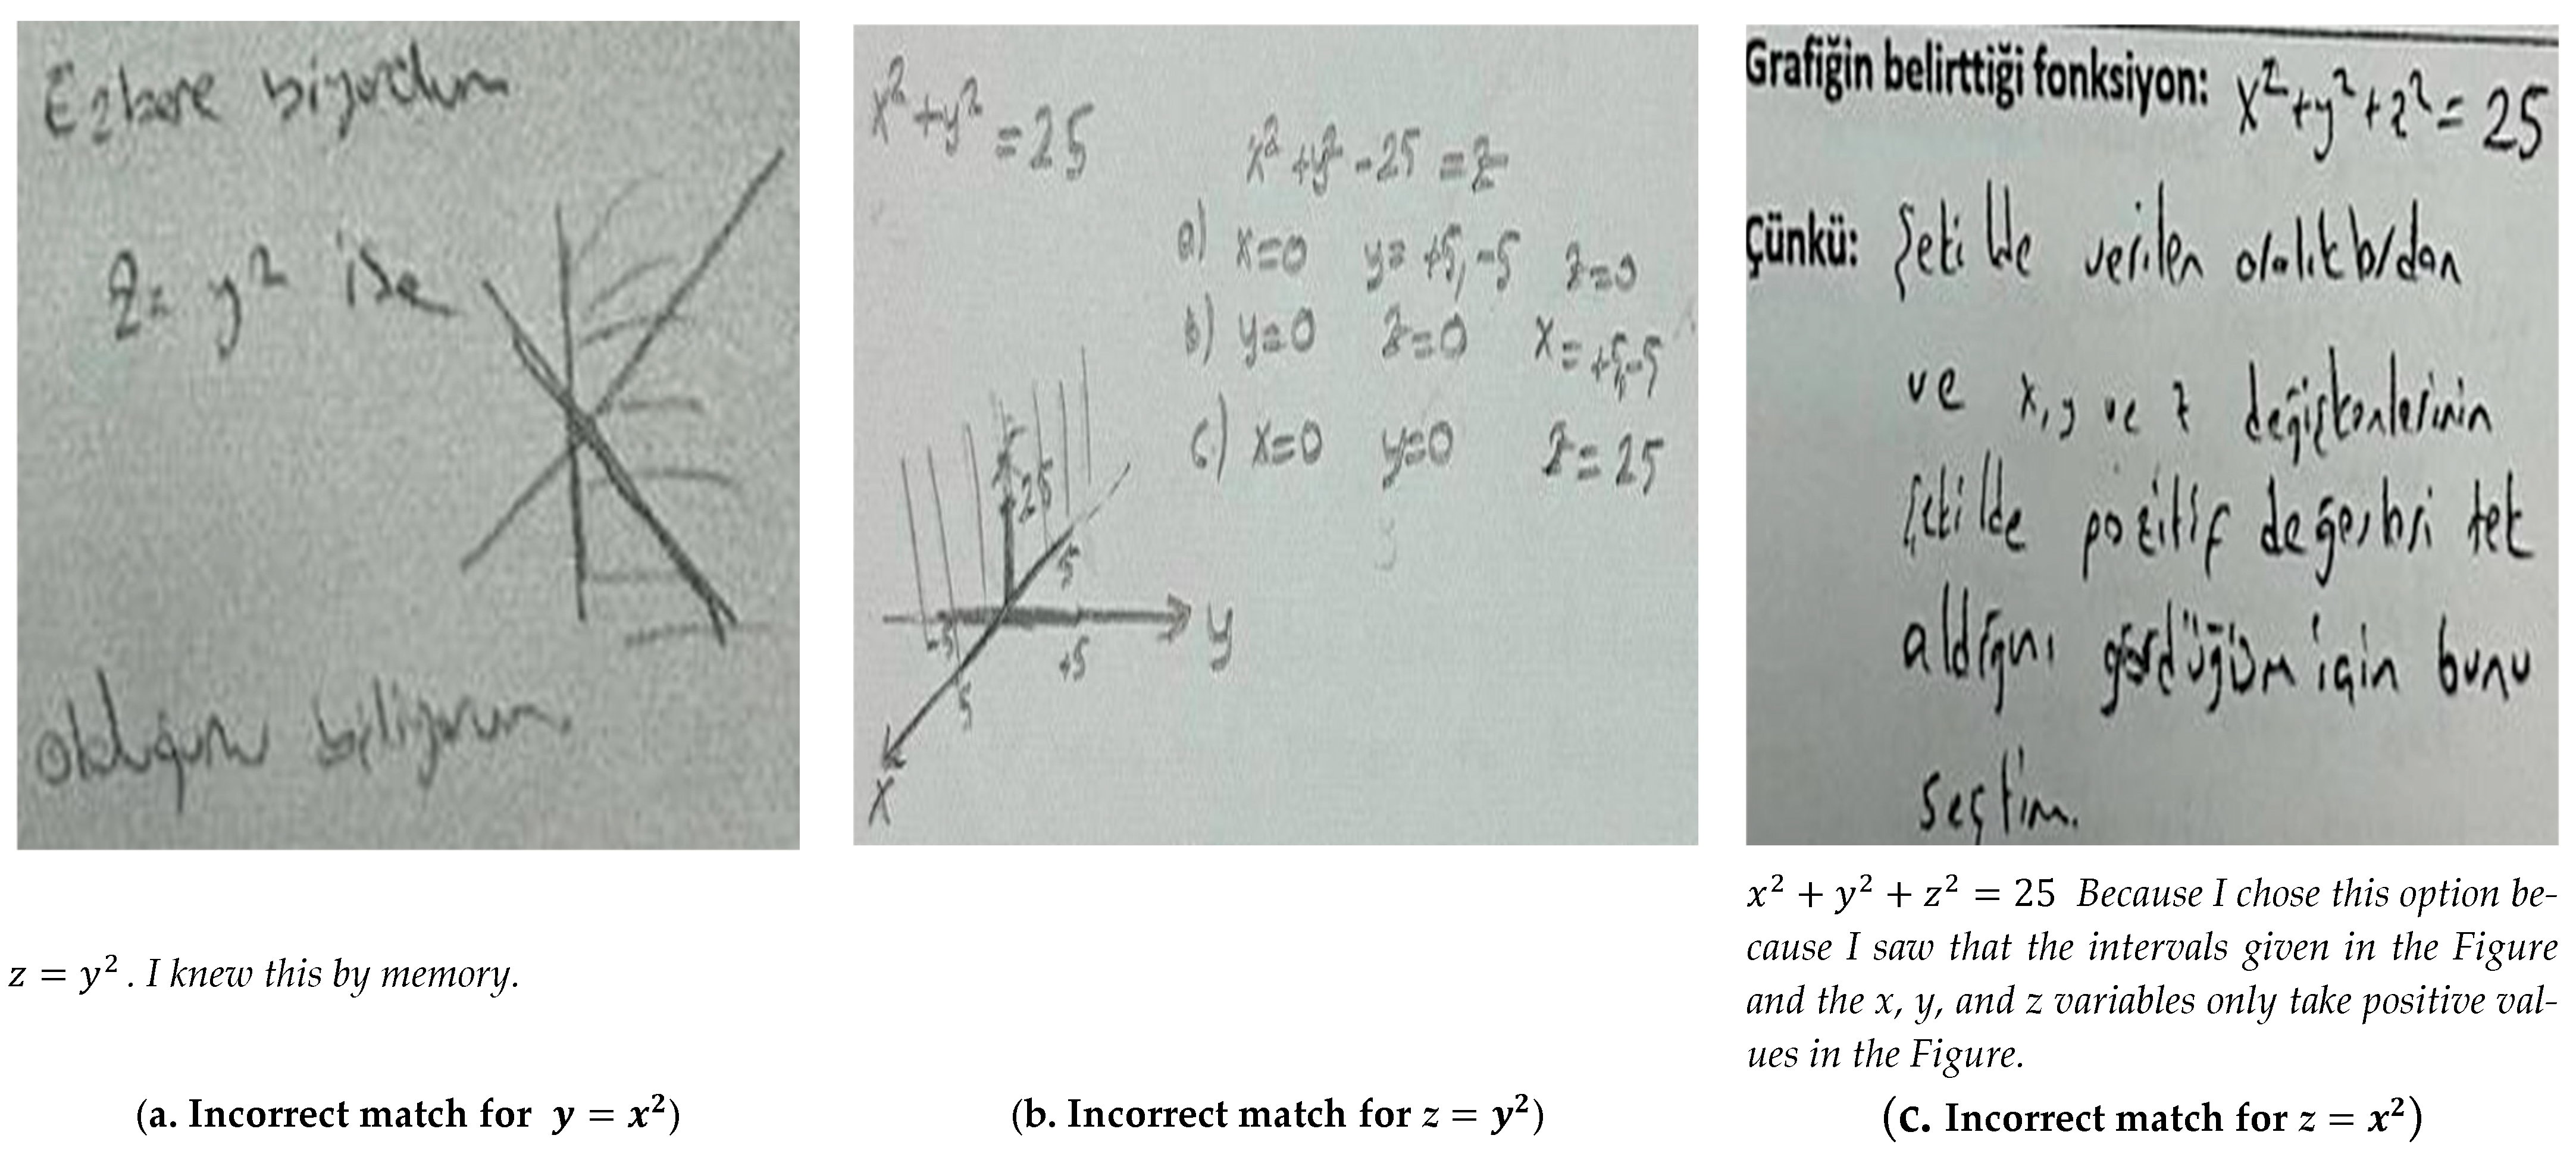
Figure 5 presents examples of incorrect matches made by pre-service teachers, illustrating common misconceptions and challenges encountered in interpreting the graphical forms of these three-dimensional surfaces.
In
Figure 5a, the pre-service teacher incorrectly identified the parabolic cylinder
as
, stating that he relied on memorization of the equation and its graph (external warrants). In
Figure 5b, another pre-service teacher matched the surface represented by
with the algebraic expression
, attempting to justify the decision by locating points of intersection with the coordinate axes (axis analysis). Similarly, in
Figure 5c, the equation
, which defines a parabolic cylinder, was incorrectly matched with the equation of a sphere,
. The pre-service teacher’s reasoning revealed a conceptual error related to the interpretation of variables and their roles in defining surfaces (lack of covariational reasoning).
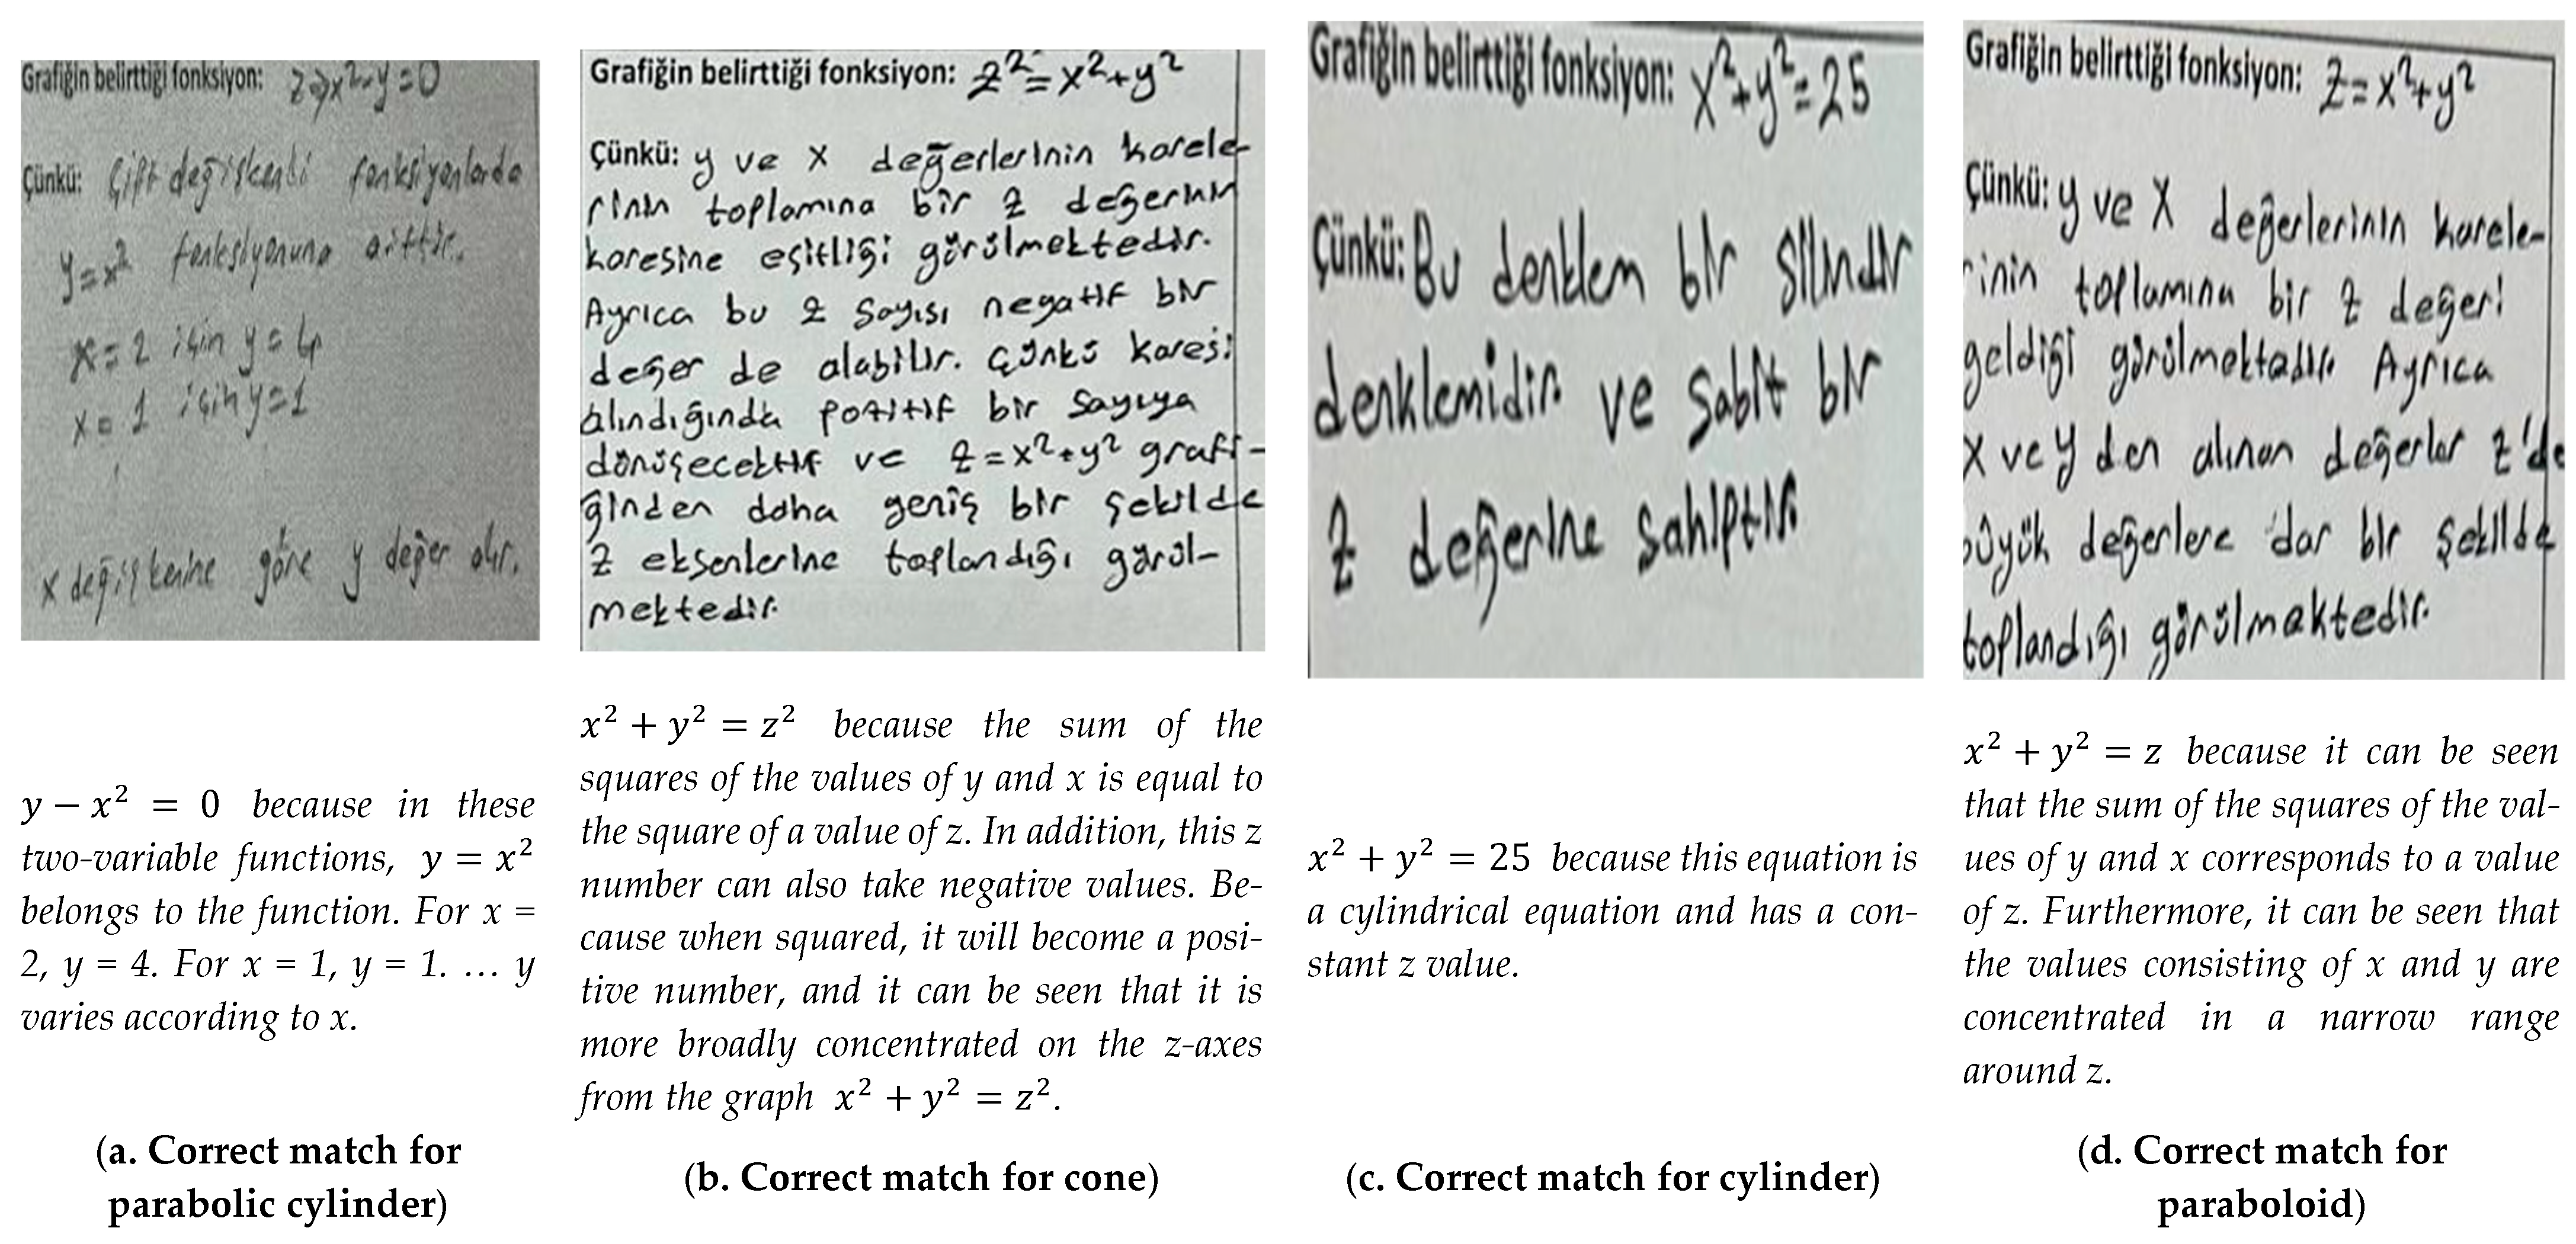
These examples highlight that many pre-service teachers struggled to correctly match algebraic expressions with the graphical representations of parabolic cylinders, paraboloids, and cones. Only a small number of pre-service teachers were able to demonstrate accurate understanding of these representations.
Figure 6 presents examples of correct matches made by pre-service teachers who employed appropriate reasoning strategies.
Figure 6a presents the work of one pre-service teacher, while
Figure 6b–d belongs to another pre-service teacher. In
Figure 6a, the pre-service teacher correctly identified the matching graph by substituting specific values into the algebraic expression rather than relying solely on axis intersection points. This approach allowed the pre-service teacher to test whether the graph was consistent with the equation and ultimately led to the correct match (covariational reasoning). For the remaining shapes, the second pre-service teacher demonstrated a solid understanding of the underlying mathematical structures. They correctly identified the cylinder by recognizing its standard equation and successfully matched the paraboloid and cone by accurately interpreting the relationships between variables in the given algebraic expressions. This suggests a deeper conceptual grasp of multivariable relations and their geometric representations (covariational reasoning).
During the interviews, pre-service teachers were asked to reflect on the types of difficulties they experienced while matching algebraic expressions with their graphical counterparts, as well as the reasons behind these challenges. Their responses are summarized below.
PT1: I left it blank because I found it difficult.
PT2: I had difficulty matching two-variable functions because I had trouble visualizing them in my mind.
PT3: I had difficulty matching the graphs of two-variable functions. This is because the graph of a two-variable function requires three-dimensional vision. I had difficulty substituting the given values and making them match.
PT4: I had difficulty matching two-variable functions. This was because the graphs seemed confusing when matching their shapes.
PT5: I had difficulty matching two-variable functions. This is because I can easily solve one-variable functions since they only have one variable. I have difficulty seeing the solution when there are two variables.
PT6: I found two-variable functions a little more difficult. Since A4 paper is two-dimensional and the graphs contain three or more dimensions, I found it difficult because the graphs of each equation can be similar.
PT7: Finding equations for three-dimensional shapes was more difficult than matching their shapes with equations for two-dimensional shapes.
PT8: I had more difficulty with two-variable functions because they are spatial. In other words, they are three-dimensional, so they are difficult to think about, draw, and determine. In fact, I couldn’t do either of them, so I left them blank.
All pre-service teachers who answered the matching questions stated that they had difficulty matching the graphs of two-variable relationships with their corresponding algebraic expressions. It can be said that pre-service teachers were highly aware of this challenge.
Pre-service teachers reported several reasons for their difficulties: the challenge of visualizing two-dimensional surfaces, the difficulty of substituting given values, the similarity and complexity of the graphs of two-variable relations, the difficulty of estimating three-dimensional objects from representations drawn on a two-dimensional plane, and the challenge of identifying the images of two-variable relations due to their spatial nature. One pre-service teacher mentioned that he left the relevant items blank because of the difficulty he experienced in the matching task. This may help explain the high rate of unanswered items. Indeed, while pre-service teachers showed significant difficulty with parabolic cylinders, paraboloids, and cones, reflected in the high number of blank responses, they left fewer items unanswered when matching spheres, which they were generally more successful at identifying.
Pre-service Teachers’ Abilities and Views on Graphing One- And Two-Variable Relations Given as Algebraic Expressions
In this section, pre-service teachers were asked to graph a one-variable relation, (
), and to plot the graph of a two-variable relation, (
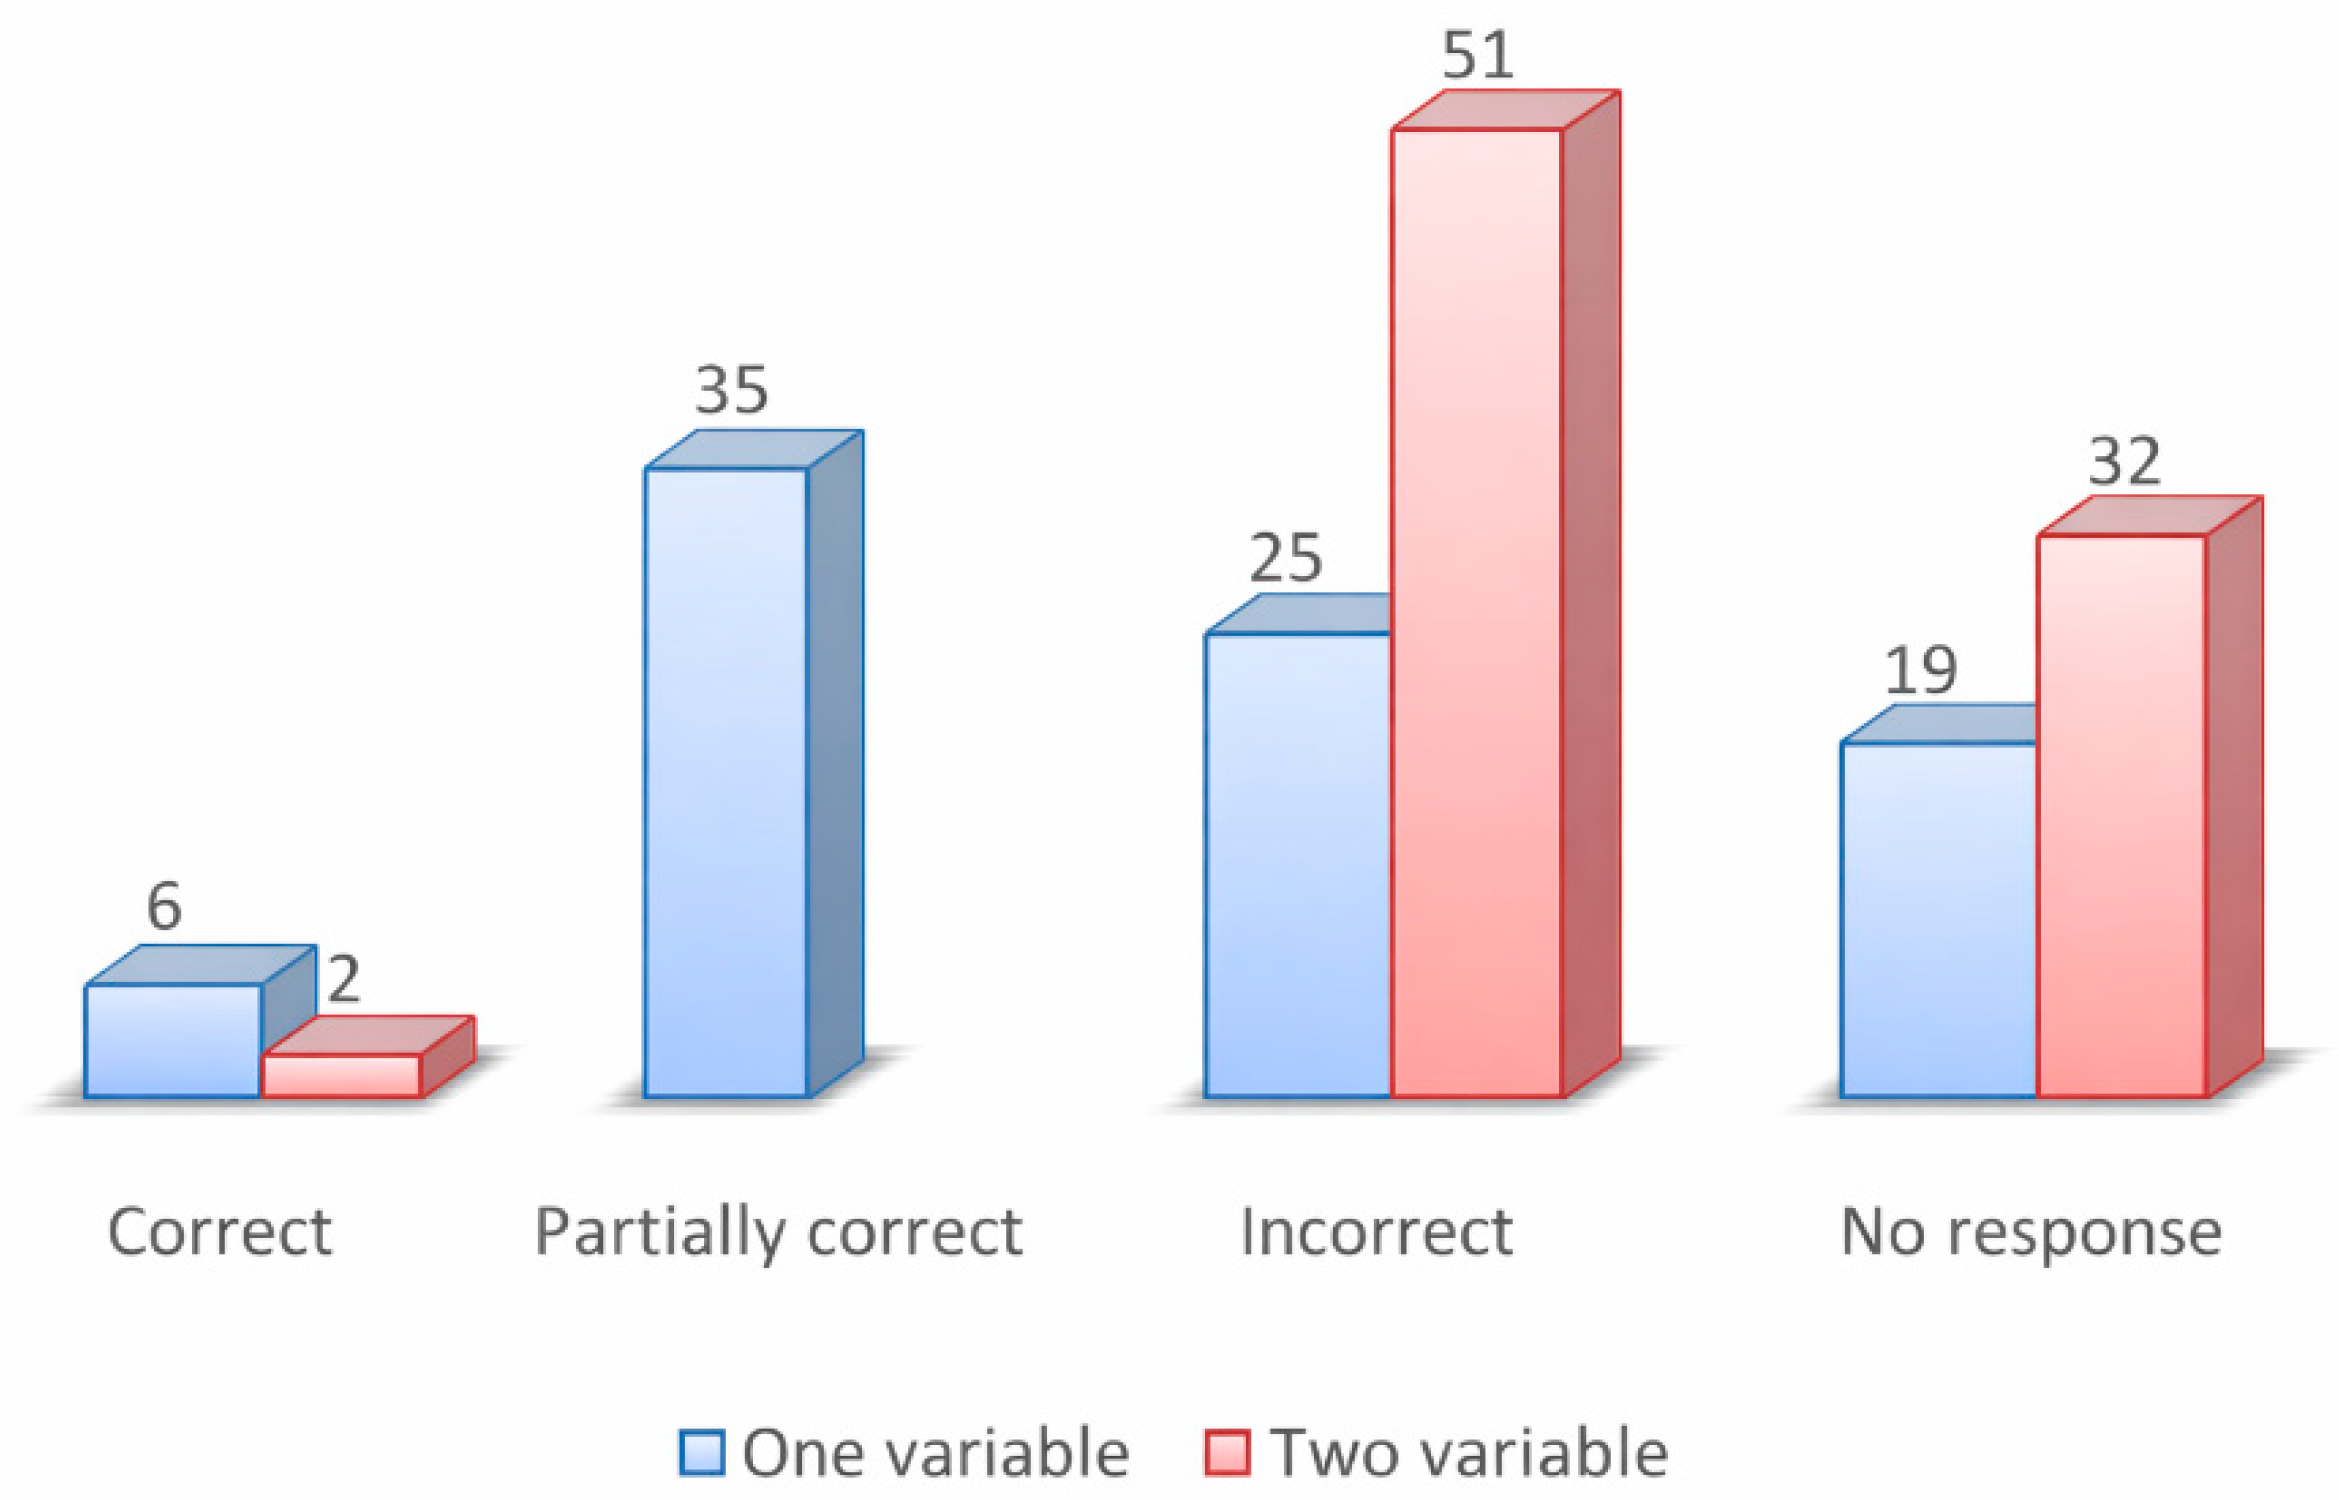
). Information regarding the success of pre-service teachers in drawing the graphs of these algebraic expressions is presented in
Figure 7.
An examination of
Figure 7 shows that 41 of the pre-service teachers were able to successfully draw the graph of the one-variable relation, six drawings were completely correct, while 35 were partially correct. On the other hand, 44 pre-service teachers either drew the graph incorrectly or did not respond to the activity. Based on these findings, it can be stated that approximately half of the pre-service teachers were successful in graphing the one-variable relation. In contrast, only two pre-service teachers were able to accurately sketch the graph of the two-variable relation. This indicates that most pre-service teachers were unsuccessful in producing a rough sketch of the two-variable relation. Examples of Figures considered correct and partially correct are shown below (
Figure 8).
Six pre-service mathematics teachers accurately sketched the graph of the relevant relation in a manner consistent with
Figure 8b, which closely resembles the original. These representations were evaluated as correct. Axis analysis and covariational reasoning were seen in
Figure 8b. In contrast, thirty-five pre-service teachers produced sketches similar to
Figure 8a. Although these sketches may appear approximately accurate at first glance, they deviate from the expected shape. The key difference between the two representations lies not in the concavity or convexity of the curve, but in the depiction of the relation’s maximum value of 1 at the point
x = 0. While this representation (
Figure 8a) reflects the overall increasing-decreasing behavior of the relation, it has two significant shortcomings. First, the entire curve is drawn with a convex shape, and second, the peak at
x = 0 is represented as a sharp corner. As is well known, such a sharp peak implies that the derivative does not exist at
x = 0, which is inconsistent with the original relation, whose derivative is zero at that point. These results raise the question of whether pre-service teachers genuinely believed the relation should be drawn in this way or whether they simply aimed to produce an approximate sketch without deeper reasoning or analysis. Due to this ambiguity, these responses were partially evaluated as correct. When considering both partially correct and fully correct representations as successful attempts, it was found that fewer than half of the pre-service teachers were able to sketch the graph of the relation in an acceptably accurate manner.
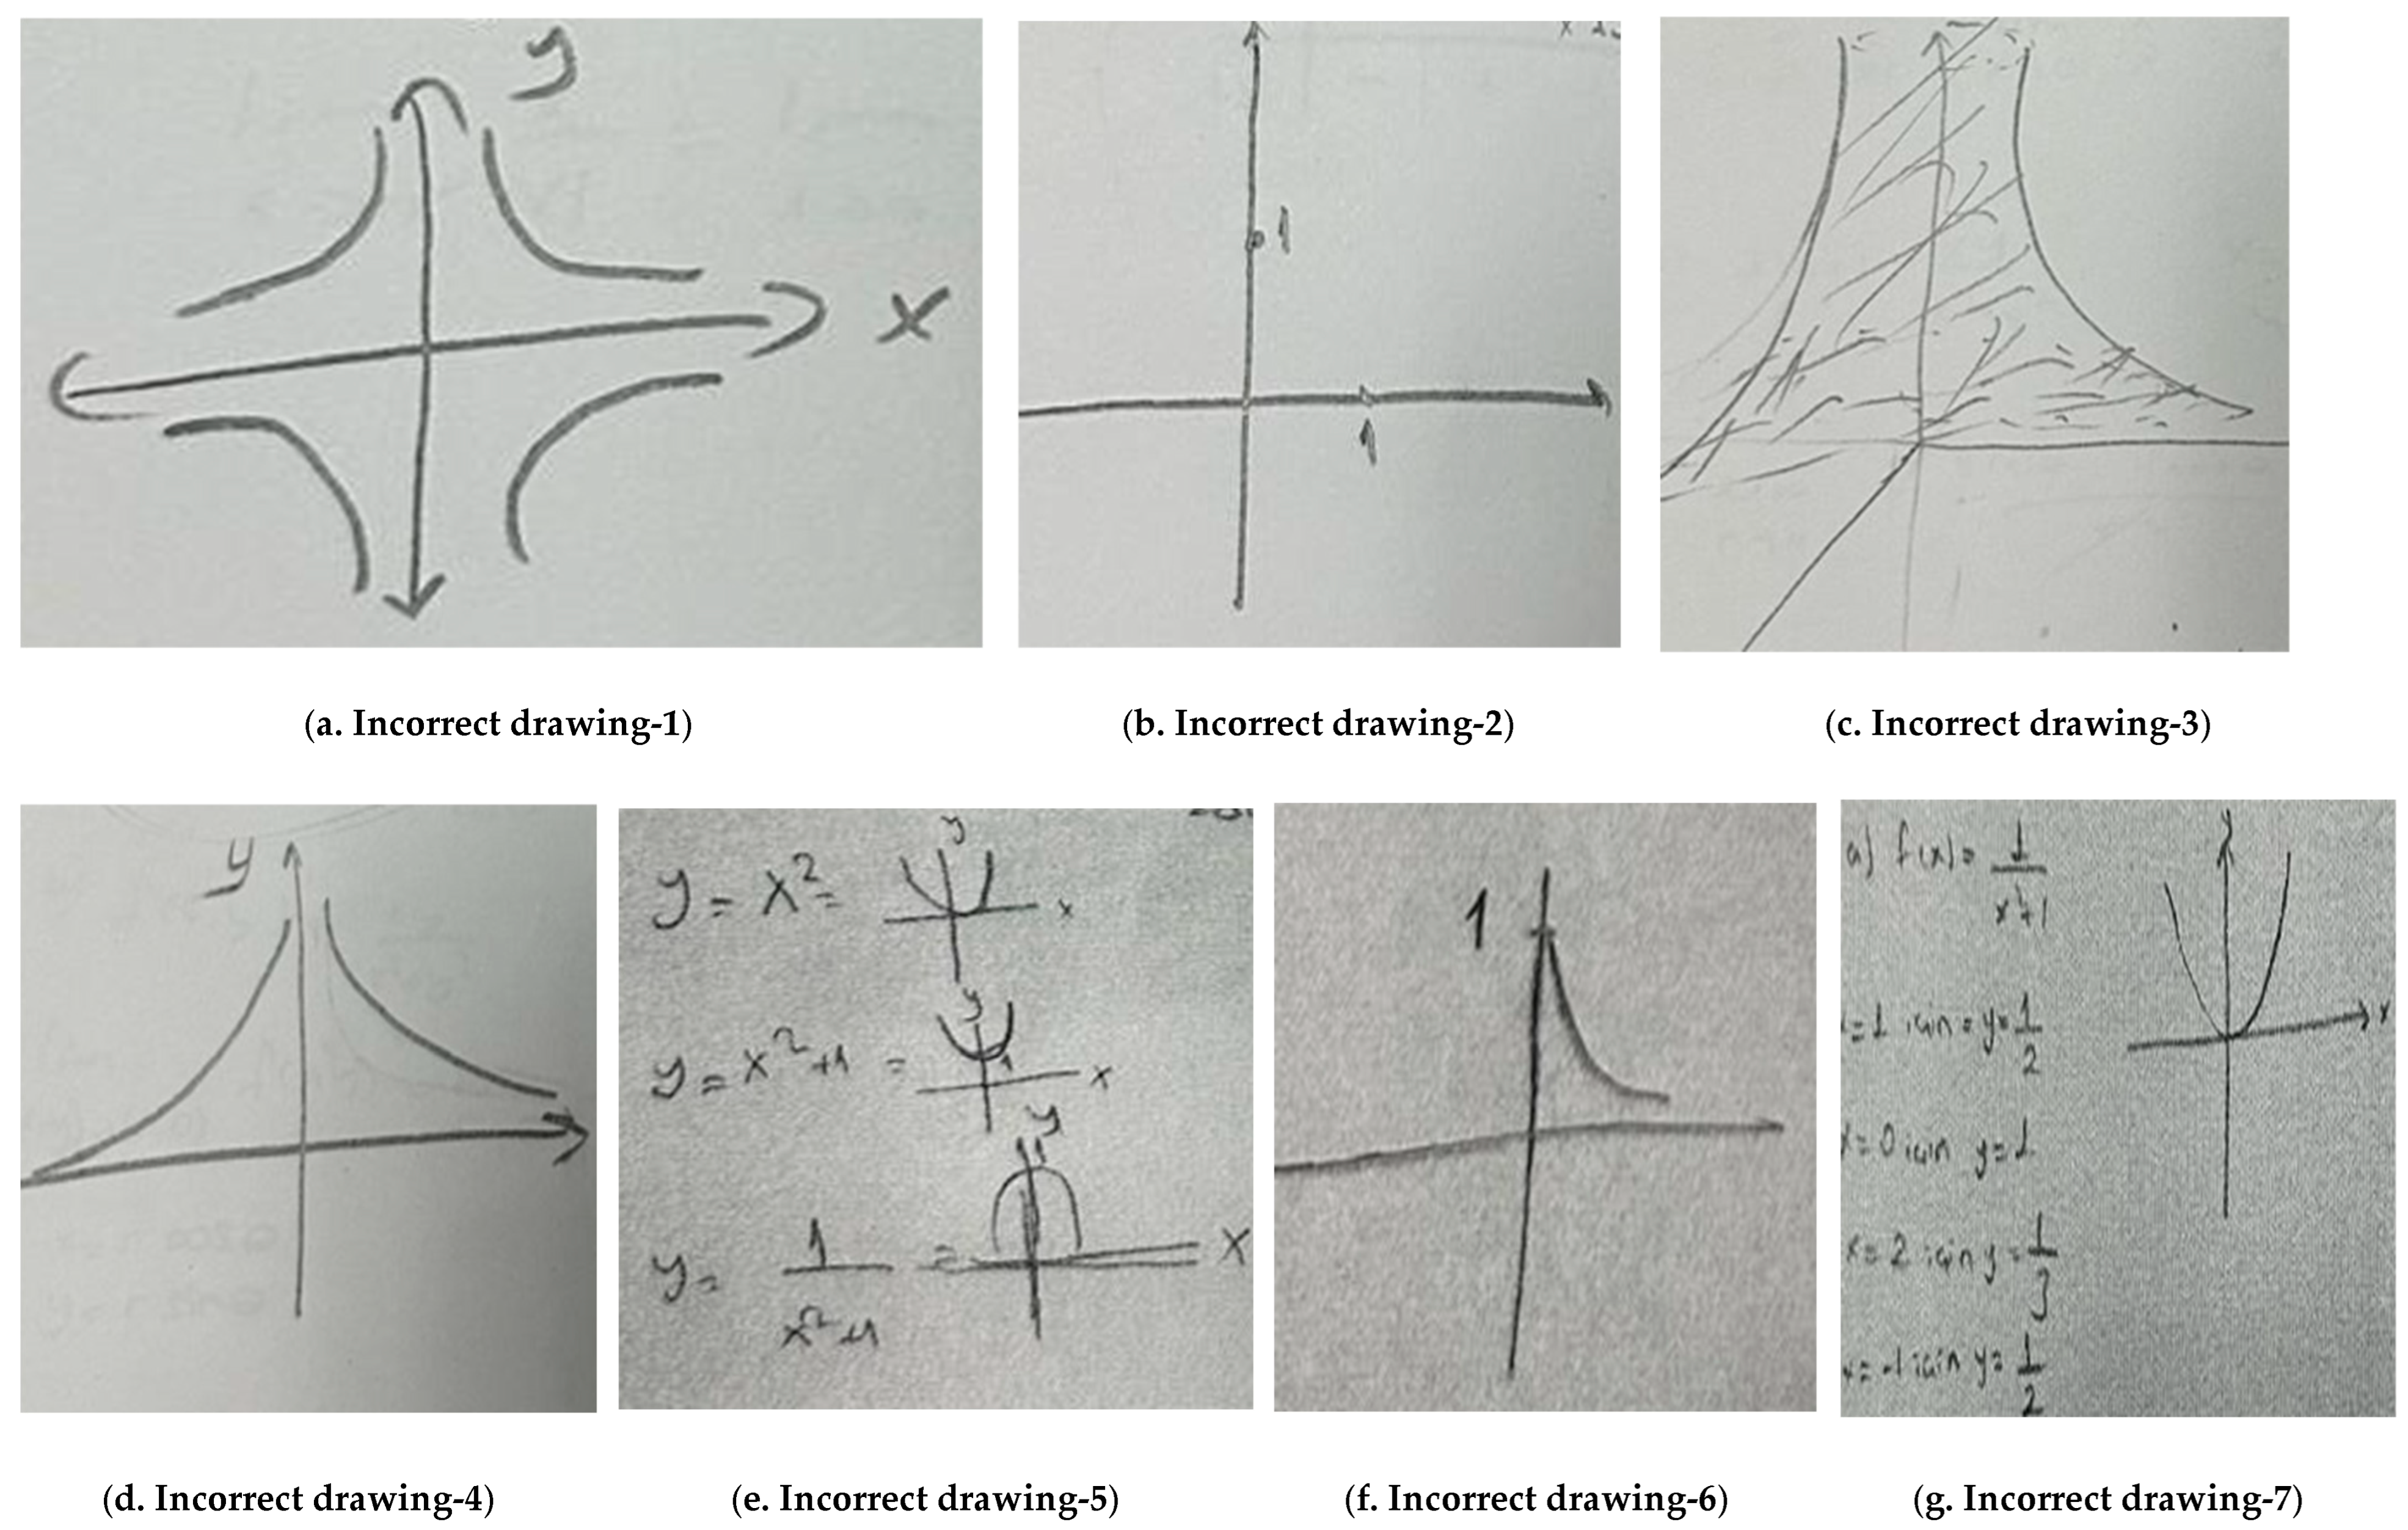
Moreover, an examination of the incorrect graphs of one-variable relations revealed seven distinct types of errors. These incorrect sketches are illustrated in
Figure 9.
Thirteen pre-service teachers drew graphs similar to the one shown in
Figure 9a. These graphs resemble the union of the image sets of the functions
and
over the set of real numbers. Four pre-service teachers drew only the Cartesian coordinate axes without attempting the graph itself. Three pre-service teachers attempted to represent the graph in three dimensions (
Figure 9c). Two pre-service teachers misrepresented the function as
, as shown in
Figure 9d. In addition, several pre-service teachers created sketches resembling functions such as
(
Figure 9e),
, defined on
(
Figure 9f), and
(
Figure 9g). Notably, in many of the incorrect representations, the
y-axis was mistakenly interpreted as a vertical asymptote, suggesting a fundamental misconception about the nature of the function’s domain and behavior near the origin.
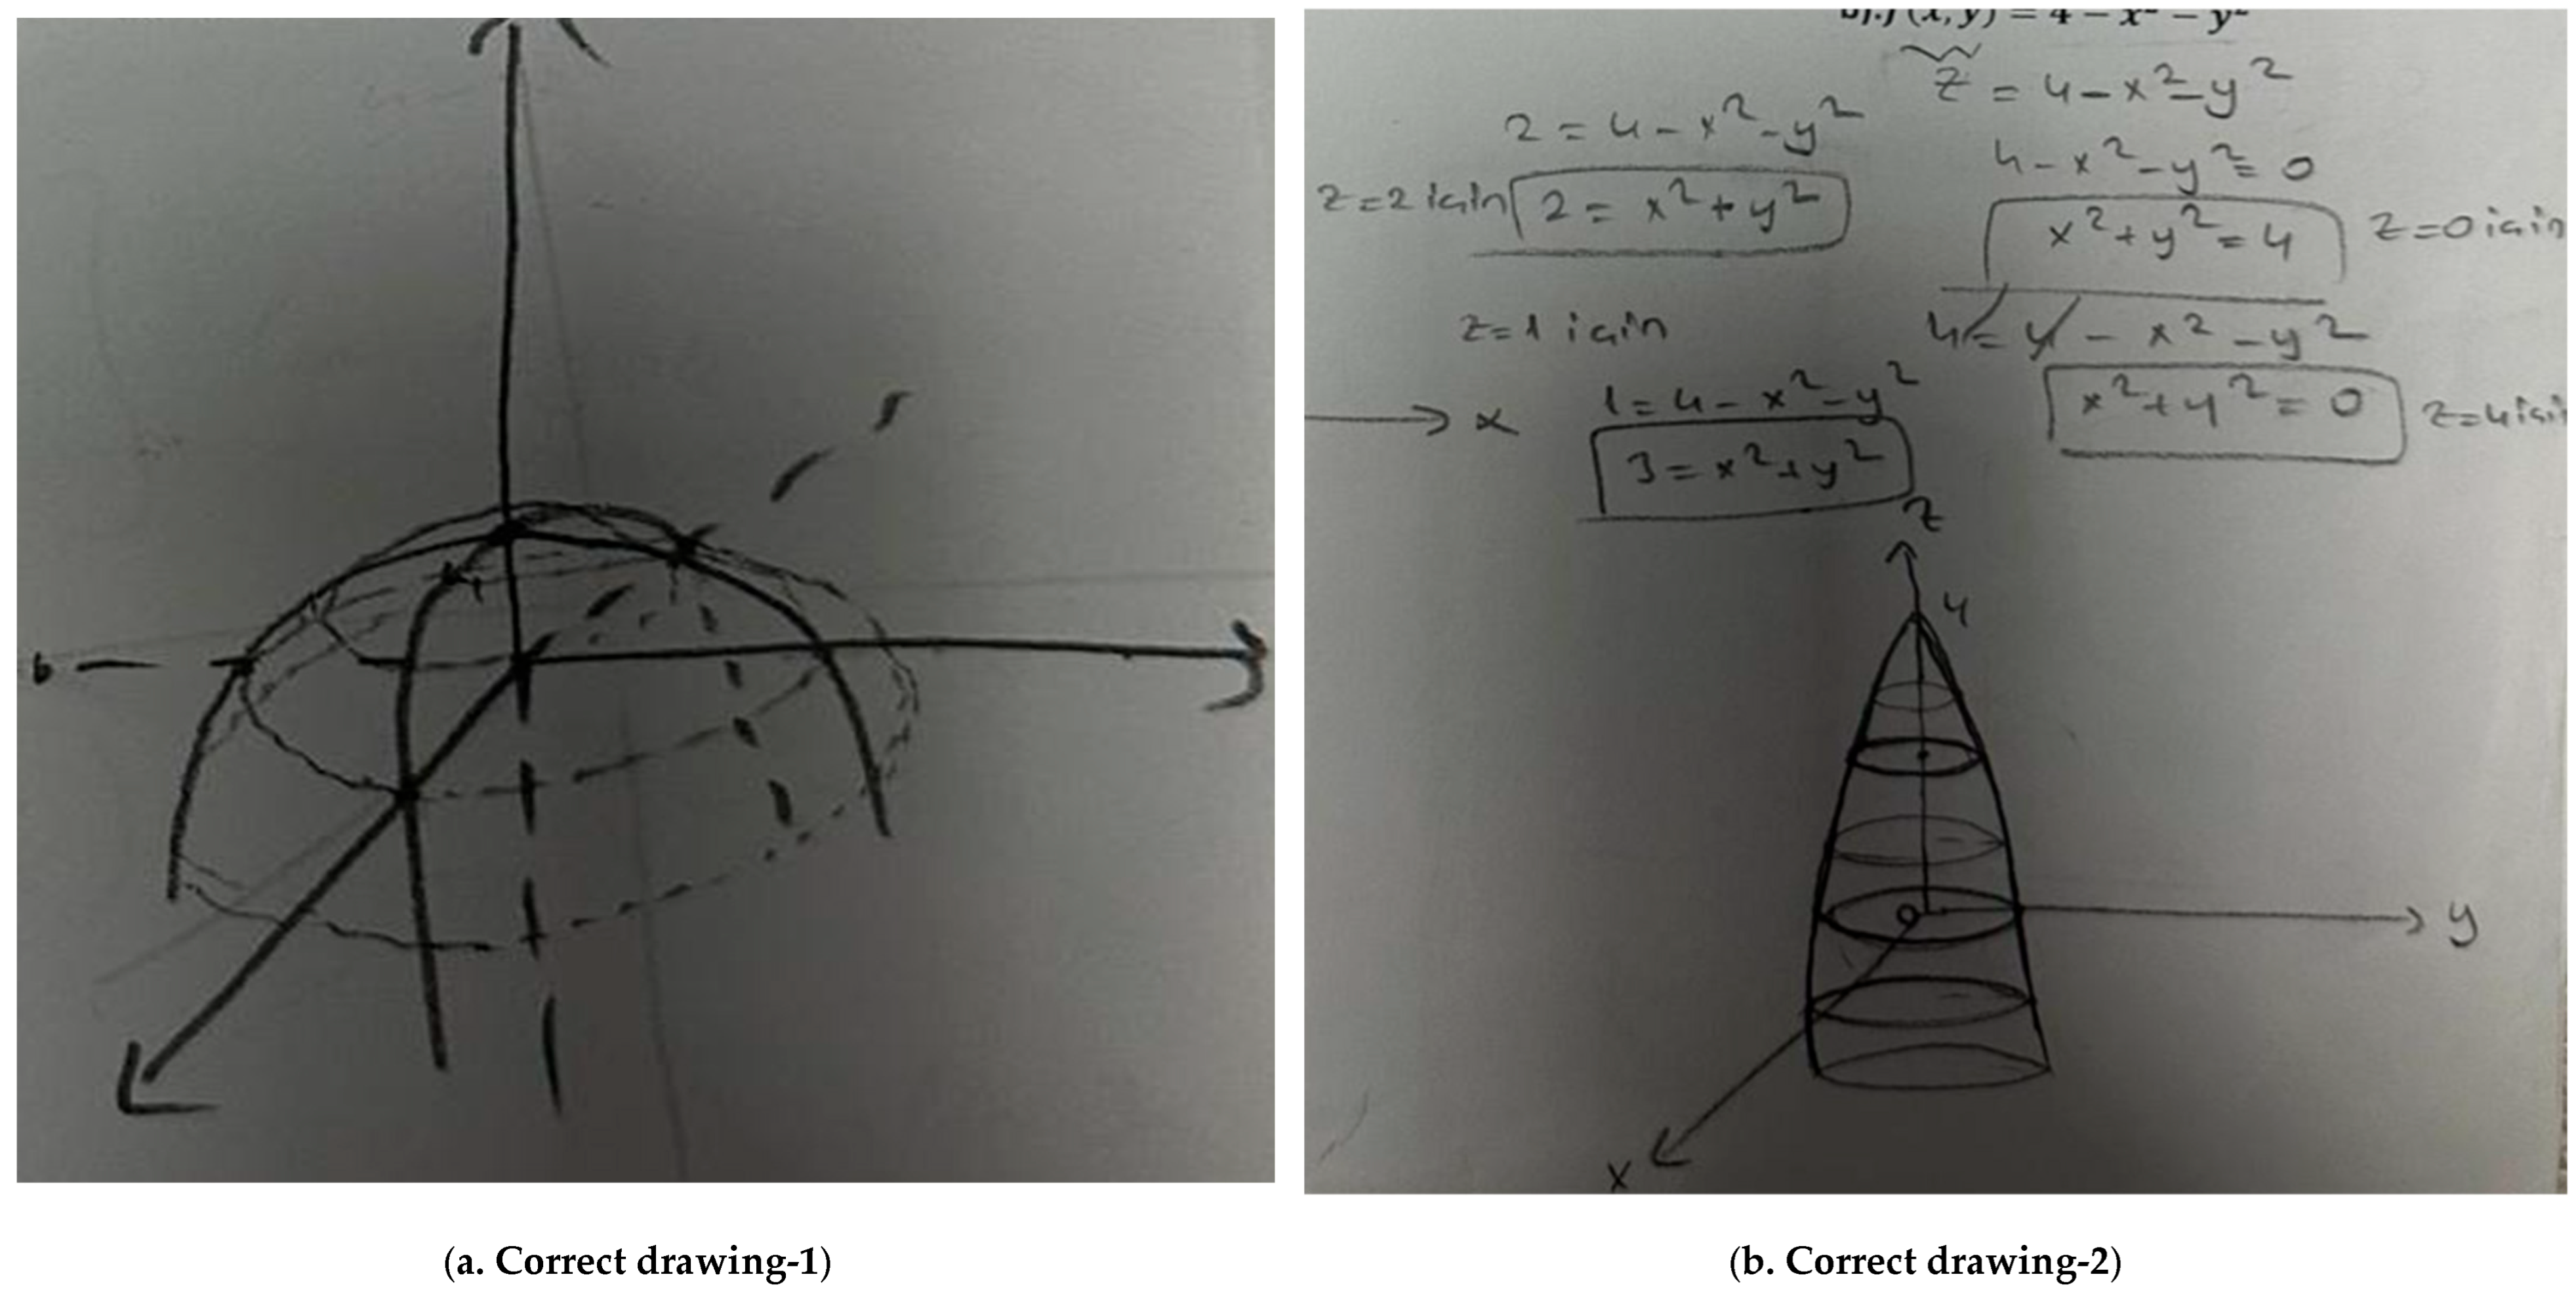
When the drawings produced by pre-service teachers for the two-variable relation were examined, it was found that only two pre-service teachers were able to produce accurate sketches. These drawings are presented in
Figure 10.
An analysis of
Figure 10b shows that the pre-service teacher examined the level curves of the given relation. The drawing demonstrates that the pre-service teacher correctly used circular level curves to represent the surface accurately. Thus, an appropriate relationship was established between the independent variables and the dependent variable (multiple covariational reasoning). Similarly, although the pre-service teacher in
Figure 10a did not explicitly present any algebraic expressions in the analysis, the use of circular level curves in the drawing indicates an accurate understanding of the structure of the graph.
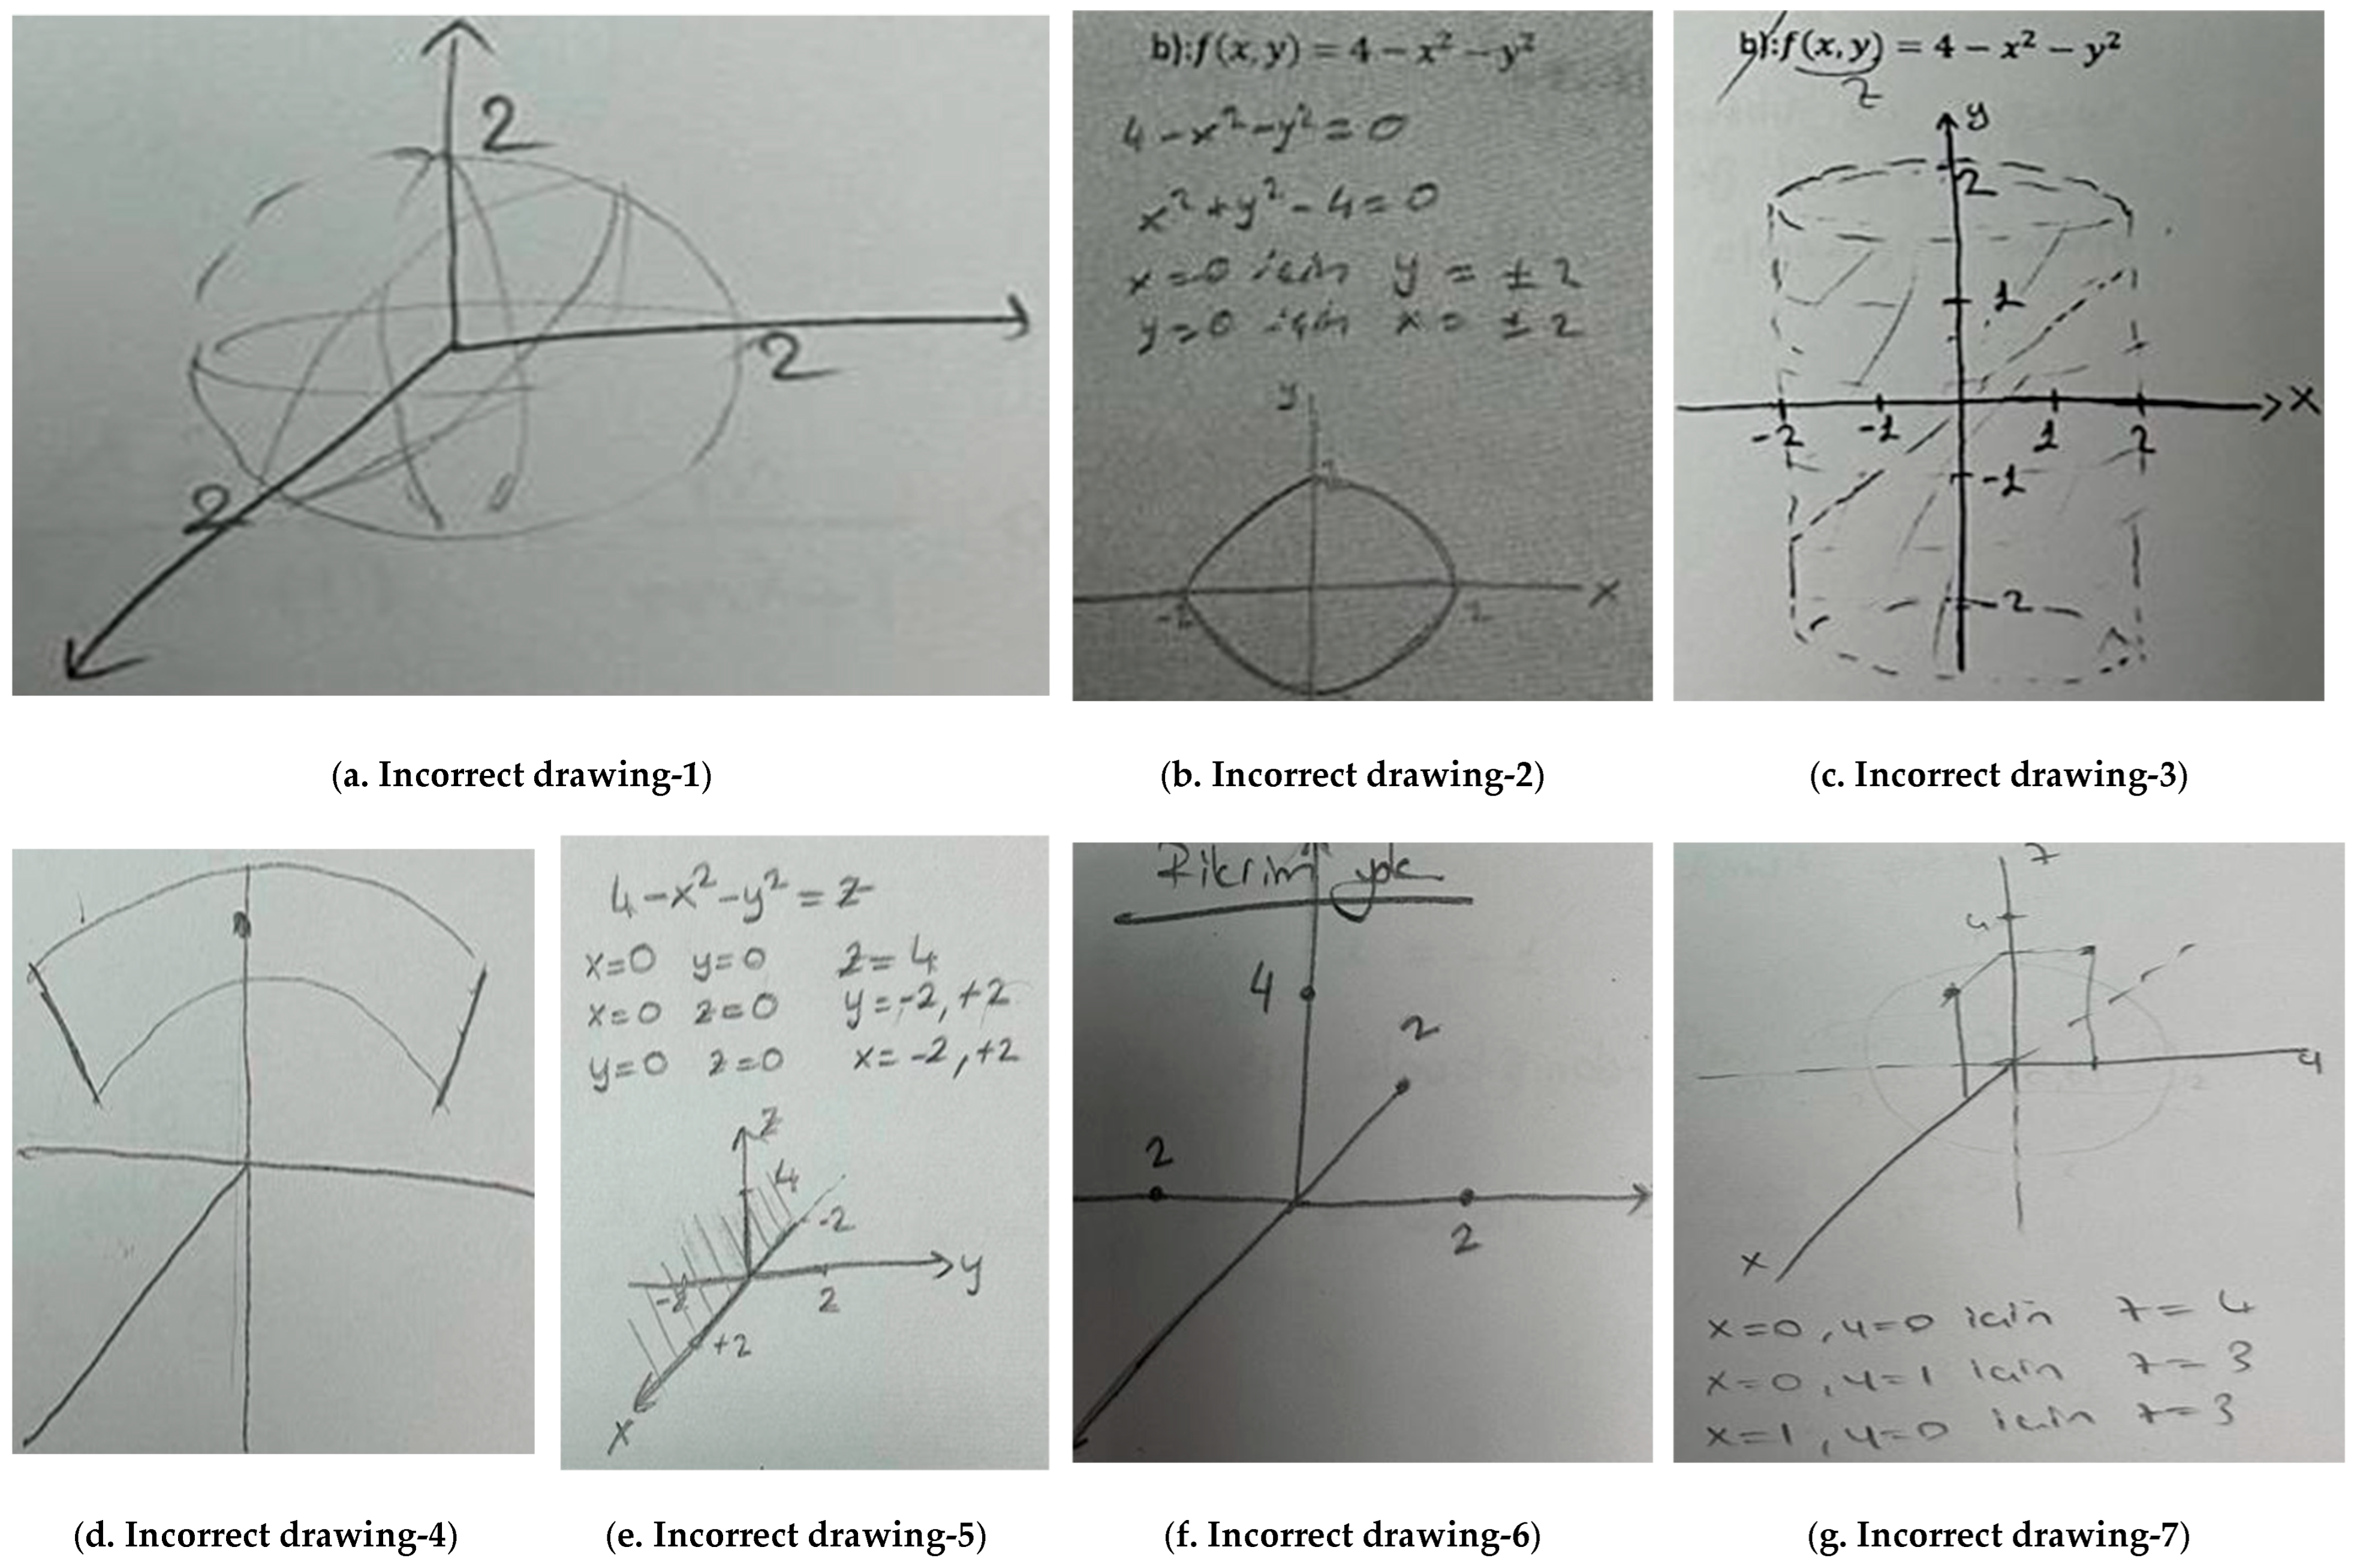
Despite these examples, 51 pre-service teachers were unable to graph the two-variable relation. Upon examining their responses, it was found that seven distinct drawing styles had emerged among the incorrect sketches. Examples of these incorrect attempts are presented in
Figure 11.
Seventeen pre-service teachers drew spheres for the given relation (
Figure 11a), while 13 drew circles (
Figure 11b). These pre-service teachers attempted to determine the shape of the graph by identifying the points where the relation intersects the coordinate axes. Eight pre-service teachers drew cylindrical shapes (
Figure 11c), and five produced non-specific surfaces resembling
Figure 11d. Three pre-service teachers attempted to represent the graph as a plane (
Figure 11e). One pre-service teacher only drew Cartesian coordinate axes (
Figure 11f), and another tried to mark individual points on the Cartesian plane (
Figure 11g) without constructing a full graph.
As part of the interviews, pre-service teachers were asked what types of difficulties they experienced during the graph-drawing activity and what they believed the causes of these difficulties were. Their opinions are presented below.
PT1: I had trouble drawing both of them and had to leave them blank.
PT2: I had difficulty drawing the graph of a two-variable function because there were two variables.
PT3: It was easy to draw the graph of a one-variable function. I had a little trouble with two-variable functions because they require three-dimensional thinking. I don’t think I was able to draw the shape clearly.
PT4: I couldn’t draw the graph of the one-variable function. I had more difficulty with that.
PT5: Actually, I didn’t find either of them very difficult. I want to say that I am good at drawing and analyzing graphs, and that I know them well. However, if I have to answer your question, I would say the one-variable function, because it required millimeter-precise drawing.
PT6: I would say that the given two-variable function is more challenging because it contains three variables. I did not encounter any difficulties when drawing the one-variable function.
PT7: When drawing one-variable functions, only two-dimensional drawings are made. Three-dimensional drawings are required for two-variable functions. Therefore, it was easier to draw the graph of one-variable functions.
PT8: Both were easy functions. I didn’t have any trouble.
Four pre-service teachers stated that they had more difficulty with two-variable relations. They noted that graphing such relations required them to think in three dimensions, and in some cases, they described it as requiring reasoning with three variables. PT1 reported having difficulty with both types of relations and stated that they left the relevant activity blank for this reason. This response suggests a tendency among pre-service teachers to leave questions unanswered when they find them particularly challenging. Indeed, the number of unanswered responses was higher for the graphing of two-variable relations, where overall success was lower. PT4 indicated that they had more difficulty drawing the graph of a one-variable relation and believed themselves to be more successful with two-variable graphs. This pre-service teacher produced
Figure 11e, a drawing that suggests a limited understanding of the actual graph. PT4 also mentioned that they had performed well in the Analysis course and generally did not experience difficulty in drawing graphs. PT5 reported being more confident with one-variable relations. Upon examining PT5’s drawings, it was found that they accurately produced
Figure 8b for the one-variable relation but drew a graph resembling
Figure 11b for the two-variable relation. This indicates a failure to correctly represent the two-variable relation, despite self-reported confidence. Finally, PT8 stated that they experienced no difficulties in either task. However, upon review, PT8’s graphs corresponded to
Figure 9f for the one-variable relation and
Figure 11b for the two-variable relation, both of which were classified as incorrect. This discrepancy suggests a low level of self-awareness regarding their actual performance in graphing.
4. Discussion
In the activity in which preservice teachers were asked to match algebraic and graphical representations of one-variable relations, the findings indicated that they were generally successful in making correct matches. This result suggests that preservice teachers were familiar with the algebraic and graphical forms of parabolas and circles, which are regarded as fundamental curves in mathematics education. However, a slight decline in performance was observed in items involving inverse parabolas, where the conventional roles of the dependent and independent variables were reversed. This finding is consistent with previous studies reporting that preservice teachers often conceptualize the dependent–independent variable relationship in a predominantly unidirectional manner during graphing activities [
54,
55]. The results therefore indicate that, although this difficulty was not widespread, some preservice teachers may experience challenges in identifying or reasoning about the dependent–independent variable relationship, particularly when it deviates from the conventional
-independent,
-dependent structure to which they are accustomed. When justifying their matches, preservice teachers predominantly relied on strategies such as:
analyzing the points where the curves intersect the coordinate axes (axis analysis),
using familiar forms or prior knowledge without analyzing (external warrants),
reasoning about the relationship between dependent and independent variables (simple covariational reasoning), and
using empirical warrants, such as substituting numerical values into algebraic expressions to infer the corresponding graphical representation.
In the graph drawing activity, which required transitioning from algebraic to graphical representation in one-variable relations, approximately half of the pre-service teachers were successful. This finding suggests that pre-service teachers experience notable difficulty in converting algebraic representations into their corresponding graphical forms, even in the context of one-variable relations. The results of this study are consistent with previous research, which has shown that pre-service teachers often struggle with the algebraic and graphical representations of functions, particularly when required to transition from algebraic expressions to graphs [
18,
58,
59]. In particular, several studies have identified the transition from algebraic to graphical representation as the most challenging transformation for pre-service teachers [
14,
18,
41].
In the graph drawing activity, it was found that pre-service teachers had the most difficulty in interpreting the graphical consequences of algebraic expressions (e.g.,
Figure 9e) and in constructing graphs based on empirical warrants (e.g.,
Figure 9a,c,d). For instance, in these drawings, the algebraic justification for features such as the downward orientation of the arms of a parabola or the mistaken presence of a vertical asymptote along the
y-axis was not adequately considered or questioned. These findings suggest that pre-service teachers struggle to establish cause-and-effect relationships between algebraic and graphical representations. Similarly, Chinnappan and Thomas [
13] argued that pre-service teachers’ failure to identify the algebraic structure underlying a function’s graphical representation hinders their understanding of functions. Cunningham [
42] further noted that such difficulties may stem from classroom practices, where teachers seldom pose tasks that require transitions between different representations of functions.
It was found that pre-service teachers were generally unsuccessful in matching algebraic and graphical representations of two-variable surfaces—except for the sphere. The sphere was the most accurately matched object, while the cylinder yielded a success rate close to the average. Many pre-service teachers indicated that they relied on prior familiarity with circles or their knowledge of standard equations when making these matches. In contrast, most pre-service teachers were unable to correctly match algebraic and graphical representations of parabolic cylinders, cones, and paraboloids. The lowest success rate was observed for parabolic cylinders given in closed form. This suggests that closed-form expressions may present an additional layer of difficulty for pre-service teachers when interpreting two-variable functions. Although pre-service teachers demonstrated familiarity with basic curves, they often failed to identify the corresponding surfaces derived from these curves. This may stem from a limited understanding of the nature of two-variable functions and the three-dimensional surfaces they represent. The findings of this study are in line with previous research indicating that pre-service teachers face significant challenges in visualizing and interpreting the graphical representations of two-variable functions [
3,
4,
26,
37,
43]. While pre-service teachers are generally able to perform algebraic operations involving two-variable functions, they struggle with translating these expressions into graphical forms [
44]. Additionally, the results support existing literature indicating that pre-service teachers are less successful and encounter more difficulties with two-variable functions than with one-variable functions [
4,
5].
It is useful to evaluate the strategies employed by pre-service teachers in order to better understand the reasons behind their difficulties. It was observed that most pre-service teachers relied on external warrants during the matching process—such as conducting axis analysis or attempting to reach graphical representations through empirical warrants, often by substituting numerical values into the algebraic expressions. In contrast, those who made correct matches typically engaged in inductive reasoning or used level curves to identify relationships between the dependent and independent variables. Despite this, almost all pre-service teachers failed to accurately draw the surface described by algebraic expressions. The findings suggest that this failure stems from the dominance of conceptual images centered on circles and spheres, the overreliance on axis intersection points, the inability to distinguish between the roles of dependent and independent variables, and the lack of attention to level curves. Many pre-service teachers attempted point-by-point analysis (empirical warrants) but were unsuccessful in applying this technique meaningfully in the context of two-variable functions. The underlying causes of these difficulties appear to include insufficient knowledge and experience related to multivariable functions, challenges in visualizing three-dimensional structures, an inability to distinguish between surface types, and the ineffectiveness of one-variable techniques (such as axis analysis and simple covariational reasoning) in this context. These factors were also echoed in the pre-service teachers’ interview responses.
5. Conclusions
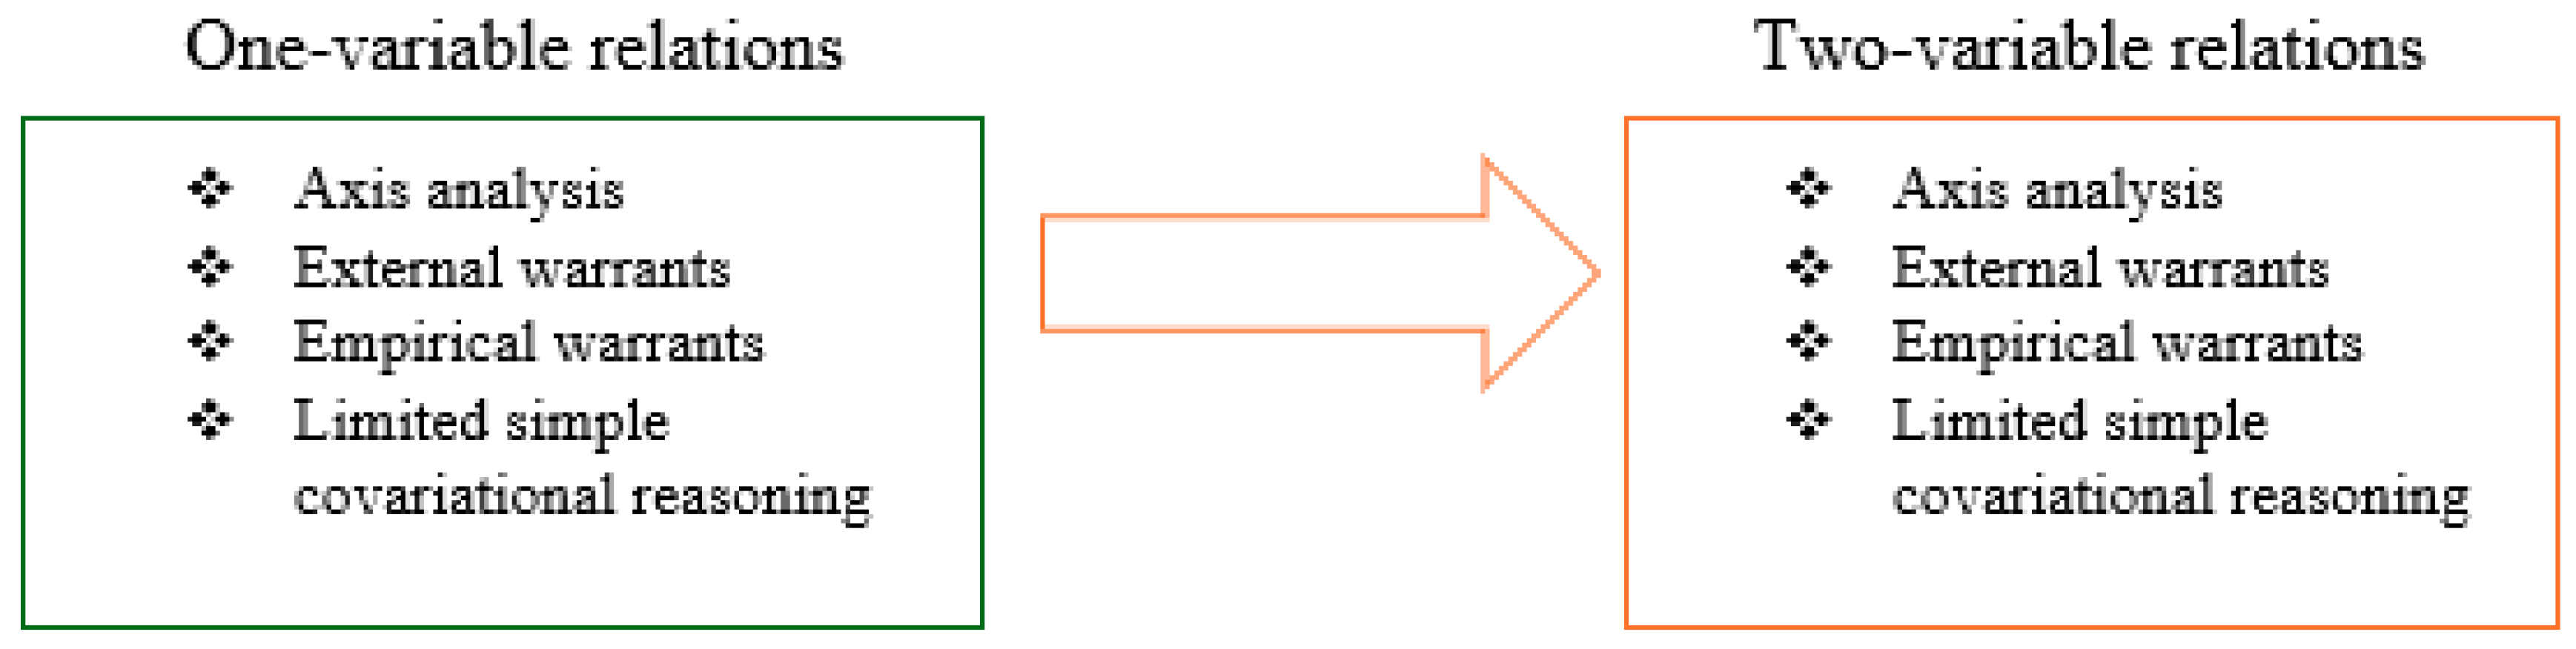
Based on the above discussions, it is suggested that one of the main reasons for pre-service teachers’ difficulties in transforming two-variable relations lies in their transfer of strategies developed for one-variable functions to the context of two-variable functions. In particular, strategies such as axis analysis, external reasoning, and point-by-point empirical evaluation, simple covariational reasoning—which are typically effective in interpreting one-variable relations—were inappropriately generalized to two-variable settings. These strategies are typically grounded in a one-directional, limited view of the dependent–independent variable relationship (limited simple covariational reasoning), where a dependent variable
y is determined solely by a single independent variable
x. The findings indicate that such strategies, when transferred directly to two-variable functions, often yield inaccurate or incomplete results. Among these, axis analysis and external warrants emerged as the most frequently used approaches. It can be argued that these strategies led to the development of a misconception characterized by the overgeneralization of one-variable representations to multivariable contexts. This can be interpreted as a form of negative transfer, in which prior knowledge about one-variable relations interferes with the understanding of two-variable relations. also apply to two-variable relations, pre-service teachers often struggle to navigate between the two due to the increased complexity and abstractness involved.
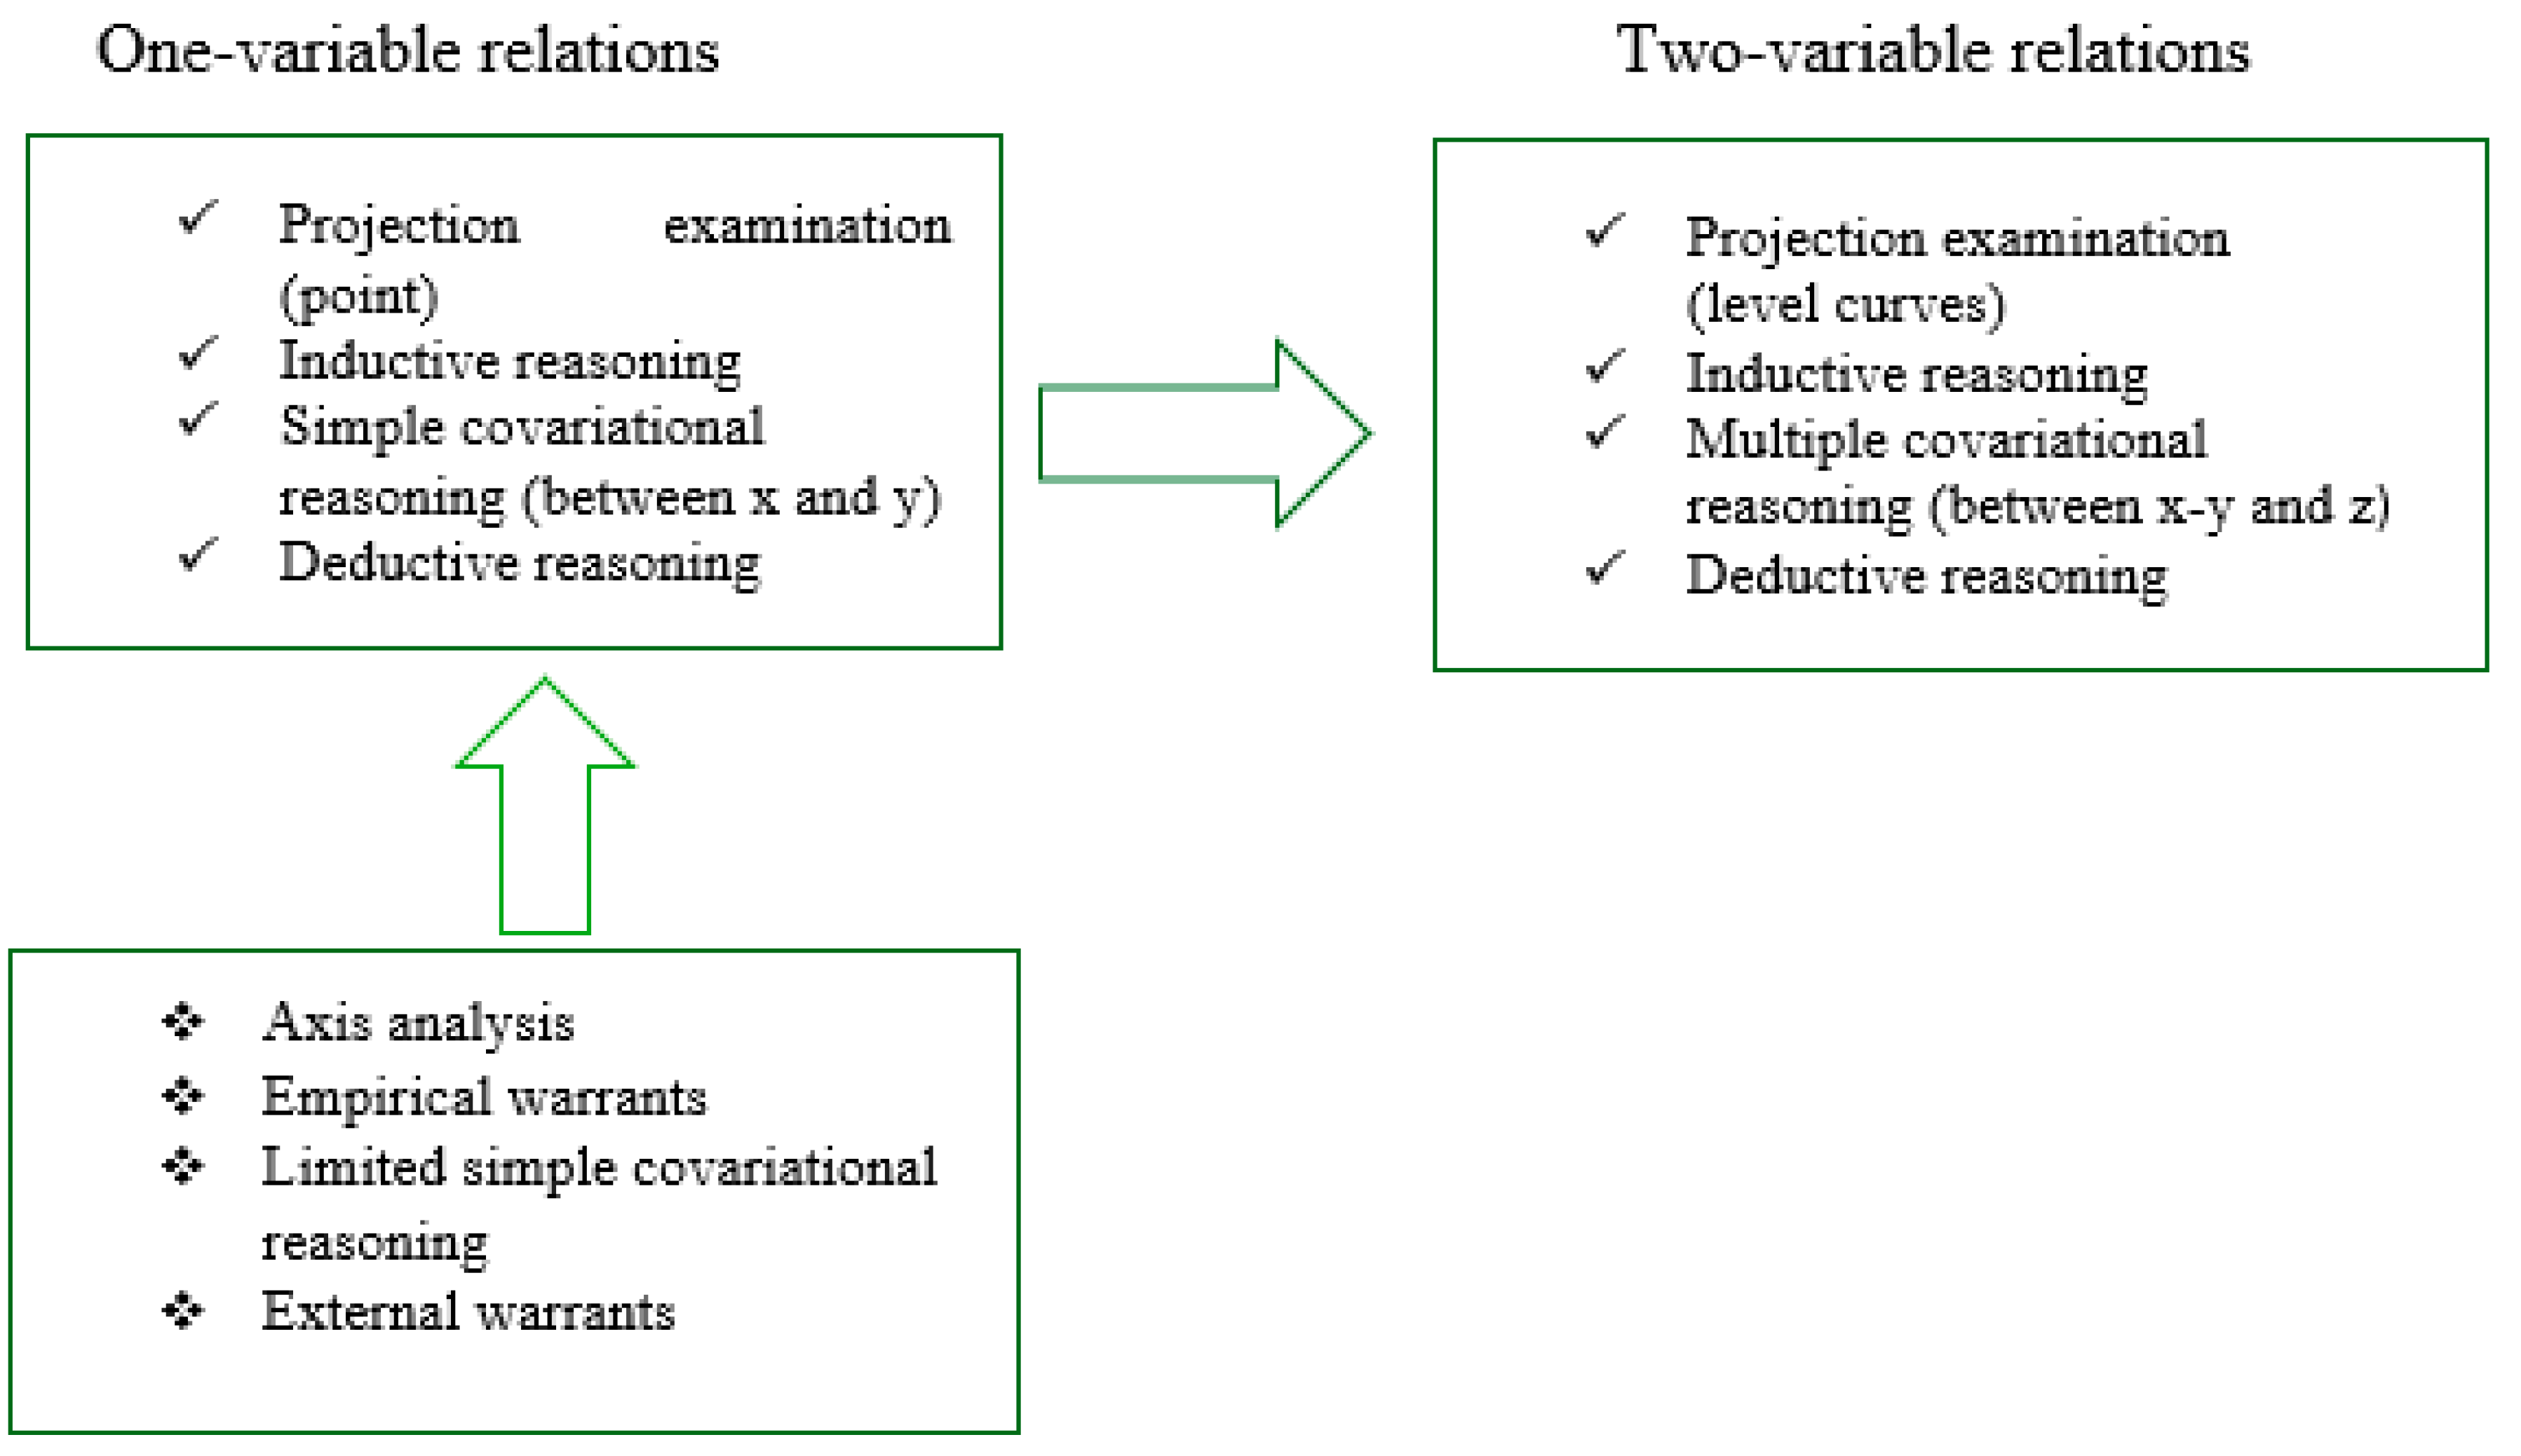
Figure 12 illustrates a conceptual model representing this negative transfer from one-variable to two-variable relation reasoning.
The success rate of pre-service teachers in matching algebraic and graphical representations for two-variable relations is approximately 33%. Accordingly, it can be said that, on average, one-third of pre-service teachers are successful in matching algebraic and graphical representations of two-variable relations. Only two pre-service teachers were able to match the algebraic representation of two-variable relations with their graphical representation. Successful pre-service teachers generally examined the projection of the surface on the xy-plane by assigning a value of zero to the dependent variable
z (projection examination), used contour lines for this purpose, conducted numerical experiments to find patterns between the dependent and independent variables (inductive reasoning), established relationships between the dependent variable and the independent variables, and used mathematical elements as justification to convince themselves (deductive warrant). In this sense, it can be said that pre-service teachers positively transferred their strategies in one-variable functions to two variables. Since learning is built on previous learning, correct understanding in a single variable will facilitate understanding in two variables. Furthermore, establishing relationships between mathematical concepts is part of relational understanding and supports lasting learning [
60,
61,
62,
63].
Understanding one-variable relations should be facilitated by understanding two variables. In this sense, it is useful to generalize the axis analysis in a one variable from the point where it intersects the axes to the projection of this situation on the other axis of the function. In this way, it can be understood that giving zero value to any variable in the algebraic expression of the surface indicated by the two-variable function is the projection of the plane indicated by the other two variables. In this case, it can be understood that the projections that emerge are points in one variable, while they correspond to curves in two variables. From this, it can be stated that the level curves, which are projections of the graph drawings, can be drawn. Similarly, the perception of limited dependence of the independent variable in a single variable can be expanded. Thus, it can be stated that the graph should be drawn as a result of considering the third dimension, the dependent variable
z, as a common independent variable of
x and
y. In addition, it can be emphasized that numerical reasoning used in one variable can be used to find a pattern that will give the relationship between
z and
x–y in two variables. In this way, external warrants in one variable can be transferred to deductive warrants. It was observed that pre-service teachers who were successful in the study applied similar strategies. Trigueros and Martínez-Planell [
7] state in their study that it is not easy for students to generalize what they know about one-variable functions directly to two-variable functions. For this reason, in order to understand two-variable functions, students need to generalize the knowledge they have acquired about one-variable functions [
7].
Figure 13 models positive transfers obtained from the study that support the relationship between one- and two-variable functions.