Article

Nourishing the Body and Mind of University Students: Using a Machine Learning Approach to Prioritize Outreach Strategies for a Campus Food Pantry


1
Department of Human Sciences, Sam Houston State University, Huntsville, TX 77341, USA
2
Department of Mathematics and Statistics, Sam Houston State University, Huntsville, TX 77341, USA
3
College of Health Sciences, Sam Houston State University, Huntsville, TX 77341, USA
*
Author to whom correspondence should be addressed.
Trends High. Educ. 2026, 5(1), 22; https://doi.org/10.3390/higheredu5010022
Submission received: 10 December 2025 / Revised: 11 February 2026 / Accepted: 24 February 2026 / Published: 26 February 2026

Abstract

Food insecurity (FI) may lead to lower academic achievement, yet college students with inadequate food underutilize campus food pantries. This research aimed to identify predictors of academic success among pantry shoppers (PSs) to inform outreach. Data from AY 2021–2022 (N = 847) and 2022–2023 (N = 951) were derived from swipes of student identification cards, merged with university student-provided data, and de-identified. Multiple regression, logistic regression, and Least Absolute Shrinkage and Selection Operator (LASSO) were employed to create and validate models using Machine Learning. Grade Point Averages (GPAs) were compared by two-sample t tests. The PSs demonstrated higher GPAs in the fall term than non-pantry shoppers (p = 0.04). Validation of the models indicated strong performance. Multiple regression yielded a low prediction error (0.05), and logistic regression achieved 71% accuracy (AUC = 0.776). LASSO identified positive predictors of academic success, including graduate and honors status, junior and senior classification, females, international residency, and frequency of pantry shopping. Negative predictors included part-time status, first-year status, Black or Hispanic ethnicity, and Pell Grant eligibility. Findings underscore the complex interplay between sociodemographic and academic factors that should be considered when planning pantry outreach programs and highlight the need for standardized measures of student pantry utilization, which may aid resource allocation and sustainability.

1. Introduction

Food insecurity (FI) in the emerging adult population (ages 18–25) is a significant concern for universities, with the total enrollment at postsecondary institutions in the U.S. projected to exceed 19.8 million students in the Fall of 2026 [1,2]. University students experience notably high rates of FI, with prevalence ranging from 19% to 56% [3], and even higher rates observed among student pantry users (81–83%) [4,5]. This broad range is largely due to the lack of standardized assessment methods for FI in university settings, such as differences in reference periods, study populations, and variations in USDA Food Security Survey modules used [6]. Nevertheless, FI prevalence among college students consistently exceeds that of U.S. households (13.5%) [7]. Students affected by FI are more likely to have lower academic performance, reduced graduation and retention rates, and an elevated risk for overweight/obesity, hypertension, type 2 diabetes, cardiovascular disease, and depression [3].
The first student-operated campus food pantry began at Michigan State University in 1993 in response to FI and reports of student hunger. In 2018, Goldrick—Rab conducted a national survey about campus food pantries (N = 217) and identified challenges for pantries, including insufficient funding, food, and volunteers [8]. Campus food pantries were a safety net for food-insecure students during the COVID-19 pandemic [9], and resources to assist students continue to increase [10]. Universities open campus food pantries to expand student access to healthy foods and reduce FI, aiming to promote improved academic performance and better physical and mental health [11,12,13,14]. However, student pantry participation rates are low, possibly due to students’ attitudes about asking for food assistance, lack of awareness about the campus pantry, perceived stigma, and other obstacles [15,16,17,18,19,20,21,22,23]. Universities must develop effective marketing programs that reach students who exhibit risk factors for FI, so campus food pantries can support students with the greatest need. This research aims to identify student factors associated with the need for food assistance and support further development of university outreach programs to increase pantry participation by food-insecure students.

1.1. Food Insecurity, Diet Quality, and Academic Performance

The impact of FI on the academic performance of students includes a lower attention span [24] and poorer executive functioning compared to food-secure students [25], ultimately increasing the likelihood that students will fail, withdraw from a course, or leave college [26]. Other research during the COVID pandemic shows that FI and lower academic performance are also associated [27,28,29,30]. The COVID-19 pandemic increased levels of disruption with regard to food access and food security for students, particularly for students with childhood FI [31]. Long-term FI may affect academic skills in adolescents who are nearing matriculation [32].
During the post-COVID period, diet quality has been researched in some studies, but it was not specifically related to academic outcomes in college students. Recently, Kent (2023) showed that food-insecure pantry shoppers had lower diet quality scores and consumed fewer fruits and vegetables than food-secure students [33]. Sklar and colleagues (2025) employed the Healthy Eating Index (HEI) and analyzed skin carotenoid levels in food-insecure college students, revealing poor diet quality and low consumption of fruit and vegetables containing carotenoid-rich antioxidants [34].
Research indicates that, in children, there is a moderate association between diet quality and academic achievement [35], particularly with breakfast [36]. Among college students, literature reviews report small to moderate positive associations between diet quality and academic achievement; however, these studies are limited by their small sample sizes [11,35,37]. Studies examining diet quality are complicated by environmental factors, such as the mental and physical health impacts of the COVID pandemic, where campus food pantries served as a safety net for student food security [4].
In Texas, a state with over 11 million residents, the average household FI prevalence rate from 2021 to 2023 was 16.9% [38]. The estimated prevalence of FI on college campuses (19–56%) remains higher than U.S. household prevalence rates in 2023 (13.5%) [39]. While there is a great need for campus food pantries to support students who are food-insecure, many students do not utilize the campus food pantry as a resource.
Some key barriers to student food pantry use include lack of awareness or information about pantry hours and location [15,22,39], stigma [15,17,20,22,39], transportation issues [15,22,23], and lack of time [15,22,23,39]. Other barriers include the perception that others need food more [17,20], a knowledge deficit of pantry eligibility criteria [22,39], and a shortage of cooking facilities [22,23]. These barriers contribute to students underutilizing campus food pantries and provide insight as to why student participation rates remain low. Students at high risk for FI, including women, freshmen, and first-generation students, may not be aware of the available assistance, which could lead to better educational outcomes, diet quality, and health [37,40].
In 2017, the University of Florida found that only 15% of surveyed students were using the campus food pantry despite nearly 70% being aware of it. Of those, 38% of food-insecure students reported shopping in the food pantry [39]. In prior research conducted in Texas, which is also the location of the present study, two recent student surveys reported FI rates of above 55% [41,42], but student participation in the pantry remains low at 3.5% of total enrollment [19]. Most students surveyed were aware of the pantry (71%), while 25% were not. However, of the 22% of students who reported visiting any food pantry (on-campus or off-campus), the on-campus food pantry was the most frequently chosen option (83%) [41]. Research about student outreach programs points to the need for collaboration between students and university leaders to develop cost-effective solutions that decrease the stigmatization of pantry use, combined with employee and student partnerships [43,44,45].

1.2. Machine Learning

Machine Learning is a type of Artificial Intelligence (AI) that uses algorithms to make predictions within large datasets across many fields, including healthcare, nutrition science, precision nutrition, and metabolomics [46]. In food pantries, ML enhanced operations through predictions of donation estimates, food demand and accessibility, supply forecasts, space utilization, and spoilage [47]. In related research, ML analyzed sociodemographic factors to predict levels of FI in Brazilian families [48], and ML was applied to study the relationship between student persistence and academic success in universities [49,50,51].
In this study, researchers built a model with a training dataset and analyzed the model with a test dataset to validate a model to predict academic success in pantry users. Datasets included sociodemographic and grade point average (GPA) data for student pantry users, collected over a two-year period, comprising 22 variables. Owing to the substantial volume of data, the researchers concluded that ML techniques would be the most effective for analyzing student predictors associated with the need for food assistance, validating the proposed model, and facilitating the advancement of university outreach programs.

1.3. Research Questions

Research findings show that there is a high prevalence of FI at universities, and that students underutilize on-campus food pantries, which provide critical access to healthy food and improve diet quality among college students. Also, there are gaps in the literature regarding approaches to identifying student factors associated with the need for food assistance and increasing student participation in food pantries through student outreach programs. This research aims to identify predictors for academic success among university students who shop at an on-campus pantry to inform the development of outreach programs to support students in need of food assistance. Researchers employed the following research questions for the project:
  • How do grade point average (GPA), student pantry participation rates, frequency of pantry shopping, and other sociodemographic factors of food pantry shoppers (PSs) compare for academic years 2021–2022 and 2022–2023?
  • How do GPA data compare for PSs and Non-Pantry Shoppers (NPS) in AY 2022–2023?
  • What are the most important factors (including sociodemographic factors and frequency of pantry shopping) to predict academic success in food PSs?
  • How well do the three ML models (multiple regression, logistic regression, and LASSO (least absolute shrinkage and selection operator) perform in the prediction of academic success?

2. Materials and Methods

2.1. Research Methods

Pantry workers provided both spoken and written details about the research study to pantry users, and students were given a chance to ask questions regarding the research. Students gave consent to participate by swiping a university-issued ID card. Student pantry users primarily visited the pantry on bimonthly distribution days during AY2021–22 and AY 2022–23. Two datasets, consisting of student PSs in AY21–22 (PS21-22) and AY22–23 (PS22-23), were derived from student PSs swipes of a university-issued ID card upon entry into the campus food pantry. Researchers combined the card swipe data with previously provided student data with Microsoft Excel (version 2402, Microsoft, Redmond, WA, USA).
Researchers selected twenty-two predictor variables from investigations of student characteristics associated with FI in university students, outlined in Table 1. Predictor Variables. The variables included ethnicity, biological sex (female), student classification (freshman), first-generation status, and financial need (Pell Grant eligible) [19,52,53,54]. Other variables that were accessible in the secondary data included student level (undergraduate, graduate, or doctoral), student type (continuing education; first-time freshman, masters, or doctoral student; returning or exchange student; and, non-degree seeking student), academic standing for beginning and end of the year (good standing, probation, suspension, or termination), and Evolve and Elite participation (academic support programs).
A GPA of 3.0 or greater was the indicator of students’ academic success. The GPA datasets (GPA21-22) and (GPA22-23) originated at the university and included undergraduate and graduate students enrolled in AY 2021–22 and AY 2022–23 by academic terms, cumulative GPA, and term GPA. For students who had both undergraduate and graduate records, the average GPA was used as their response variable.
The research protocol received expedited approval from the university’s Institutional Review Board. Also, the Office of Research and Sponsored Programs granted researchers permission to use student-provided university data as a secondary source in this research.

2.2. Statistical Methods

First, the researchers de-identified and coded the data, then they imported the pantry and GPA datasets into R Software (version 4.4.1, R Core Team, Vienna, Austria), where one researcher verified and cleaned the data for analysis. The datasets were PS21-22 (N = 847), PS22-23 (N = 951), GPA21-22 (N = 23,896), and GPA22-23 (N = 23,652). Information about the PS 21-22 dataset is found in a previously published article [19].
Then, the researchers analyzed descriptive data in the PS22-23 dataset. Using GPA22-23, researchers compared cumulative and term GPAs for the PSs and NPSs with a two-sample t-test to determine GPA differences by academic year and semester. The Welch two-sample t-test was used when variances were unequal. The two-sample test for equality of proportions without the continuity correction was used to compare biological sex across academic years. Finally, three models were created with multiple regression, logistic regression, and Least Absolute Shrinkage and Selection Operator (LASSO) using the PS21-22 (training) dataset. Then, multiple regression, logistic regression, and LASSO were used to validate the model using the PS22-23 (testing) dataset.

3. Results

3.1. Participants

Participants were primarily senior (29%), female (66%), Hispanic (32.8%), Texas residents (87.5%), and U.S. citizens (87.5%) enrolled as full-time (85.1%), first-generation students (42%), and a majority were in financial need (58.5%). Participants (9%) were graduate students. Students had a mean age of 22.6 years and a GPA > 3.0. Pantry shoppers were primarily enrolled in the College of Science and Engineering Technology (25.4%). Participants’ sociodemographic data is presented in Table 2. Attributes of Campus Food Pantry Shoppers in AY 2022–2023.
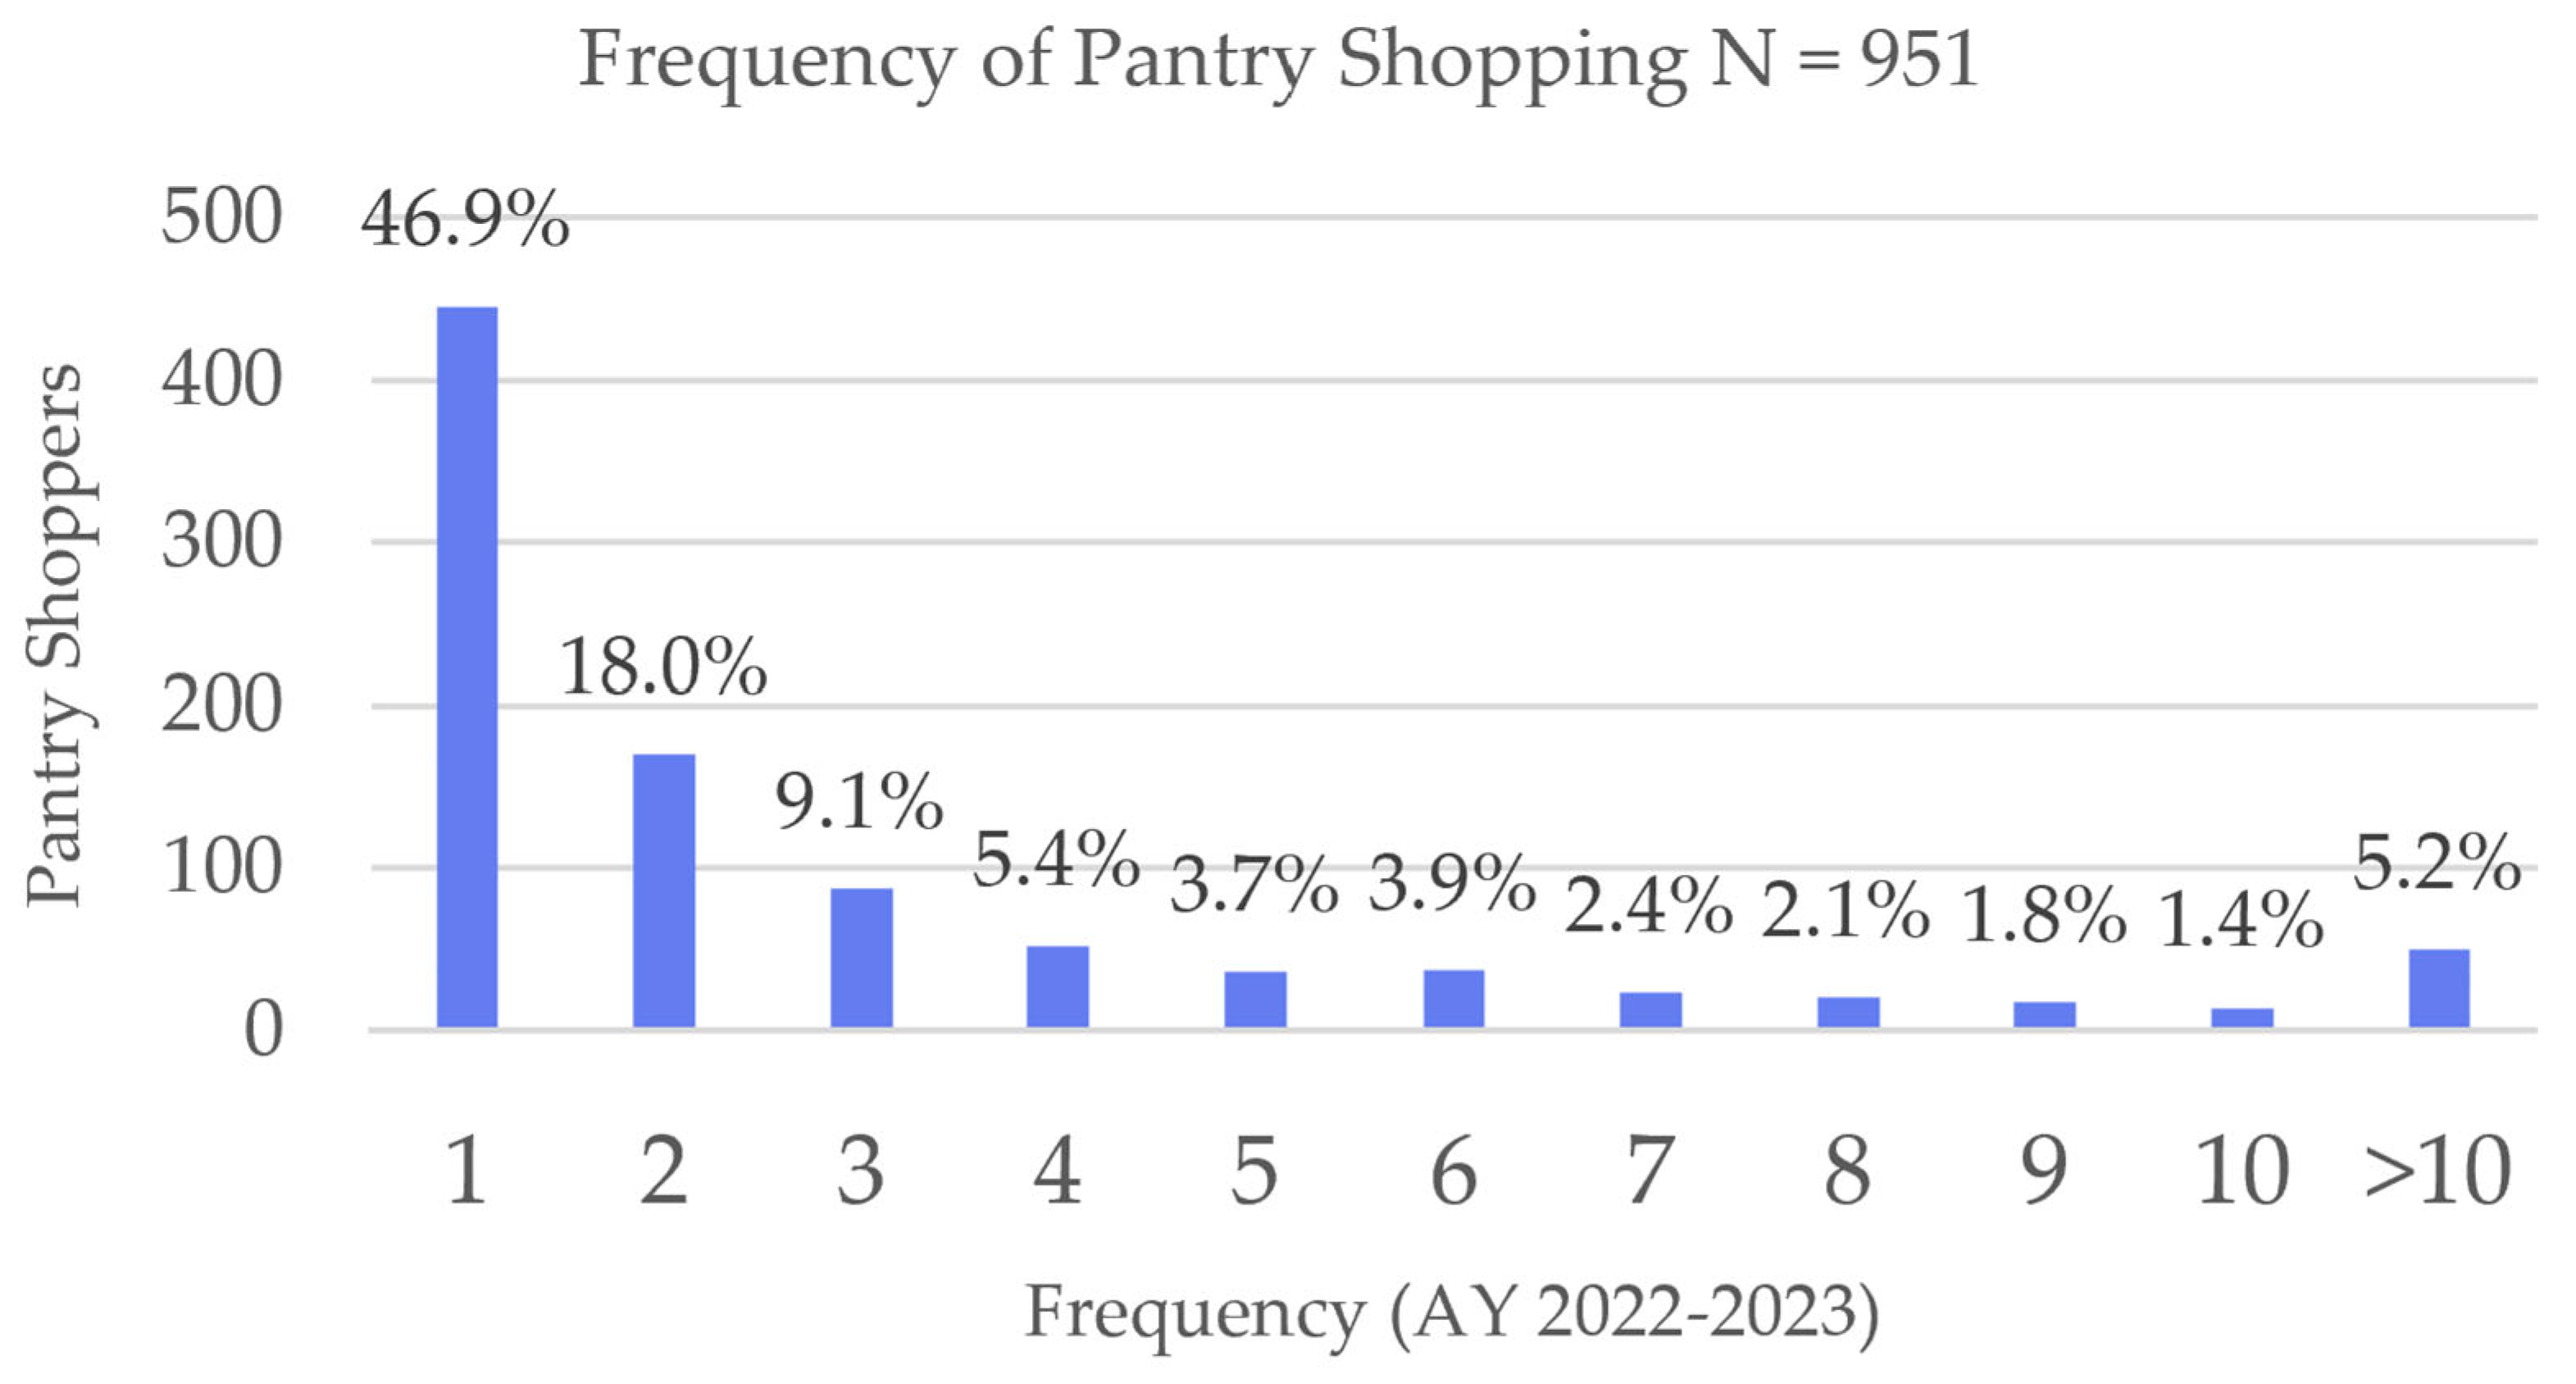
The mean frequency of pantry shopping in AY2022–2023 was 3.15 instances per student, with a range of 1–22 times (Figure 1. Frequency of Pantry Shopping). There was a statistically significant increase in the frequency of pantry shopping t(1481.4) = −7.0836, p < 0.0001) for AY21–22 (mean = 2.22) and AY22–23. In 2022–2023, four percent of the student body shopped in the campus food pantry on at least one occasion.
Researchers compared the GPA22-23 dataset for differences in cumulative and term GPAs between PSs and NPSs. The cumulative GPA dataset showed unequal variance (F(22,574, 963) = 1.3821, p < 0.0001). Next, the t-test demonstrated no difference in the cumulative GPA between PSs and NPSs for 2022–23. Then, researchers analyzed term GPAs for the fall term and found unequal variance (F(20,298, 922) = 1.349, p < 0.0001). Using the t-test, PSs showed a significantly higher fall-term GPA than NPSs. There were no significant differences in GPA between PSs and NPSs in the spring or summer terms as shown in GPA results for PS and Non-PS in Table 3.
To analyze year-to-year differences in GPA, researchers compared cumulative GPAs between PSs in AY 2021–22 and AY 2022–23. The data had unequal variance (F(846, 963) = 1.149, p = 0.03). There was no difference between cumulative GPAs in PSs by year (p = 0.47) or term. However, there was a significant difference in gender with a greater proportion of females in the PS22-23 sample than in the PS21-22 sample (Chi-squared (1, 1798) = 5.0327, p = 0.02).

3.2. Machine Learning Models and Validation

3.2.1. Multiple Regression Model

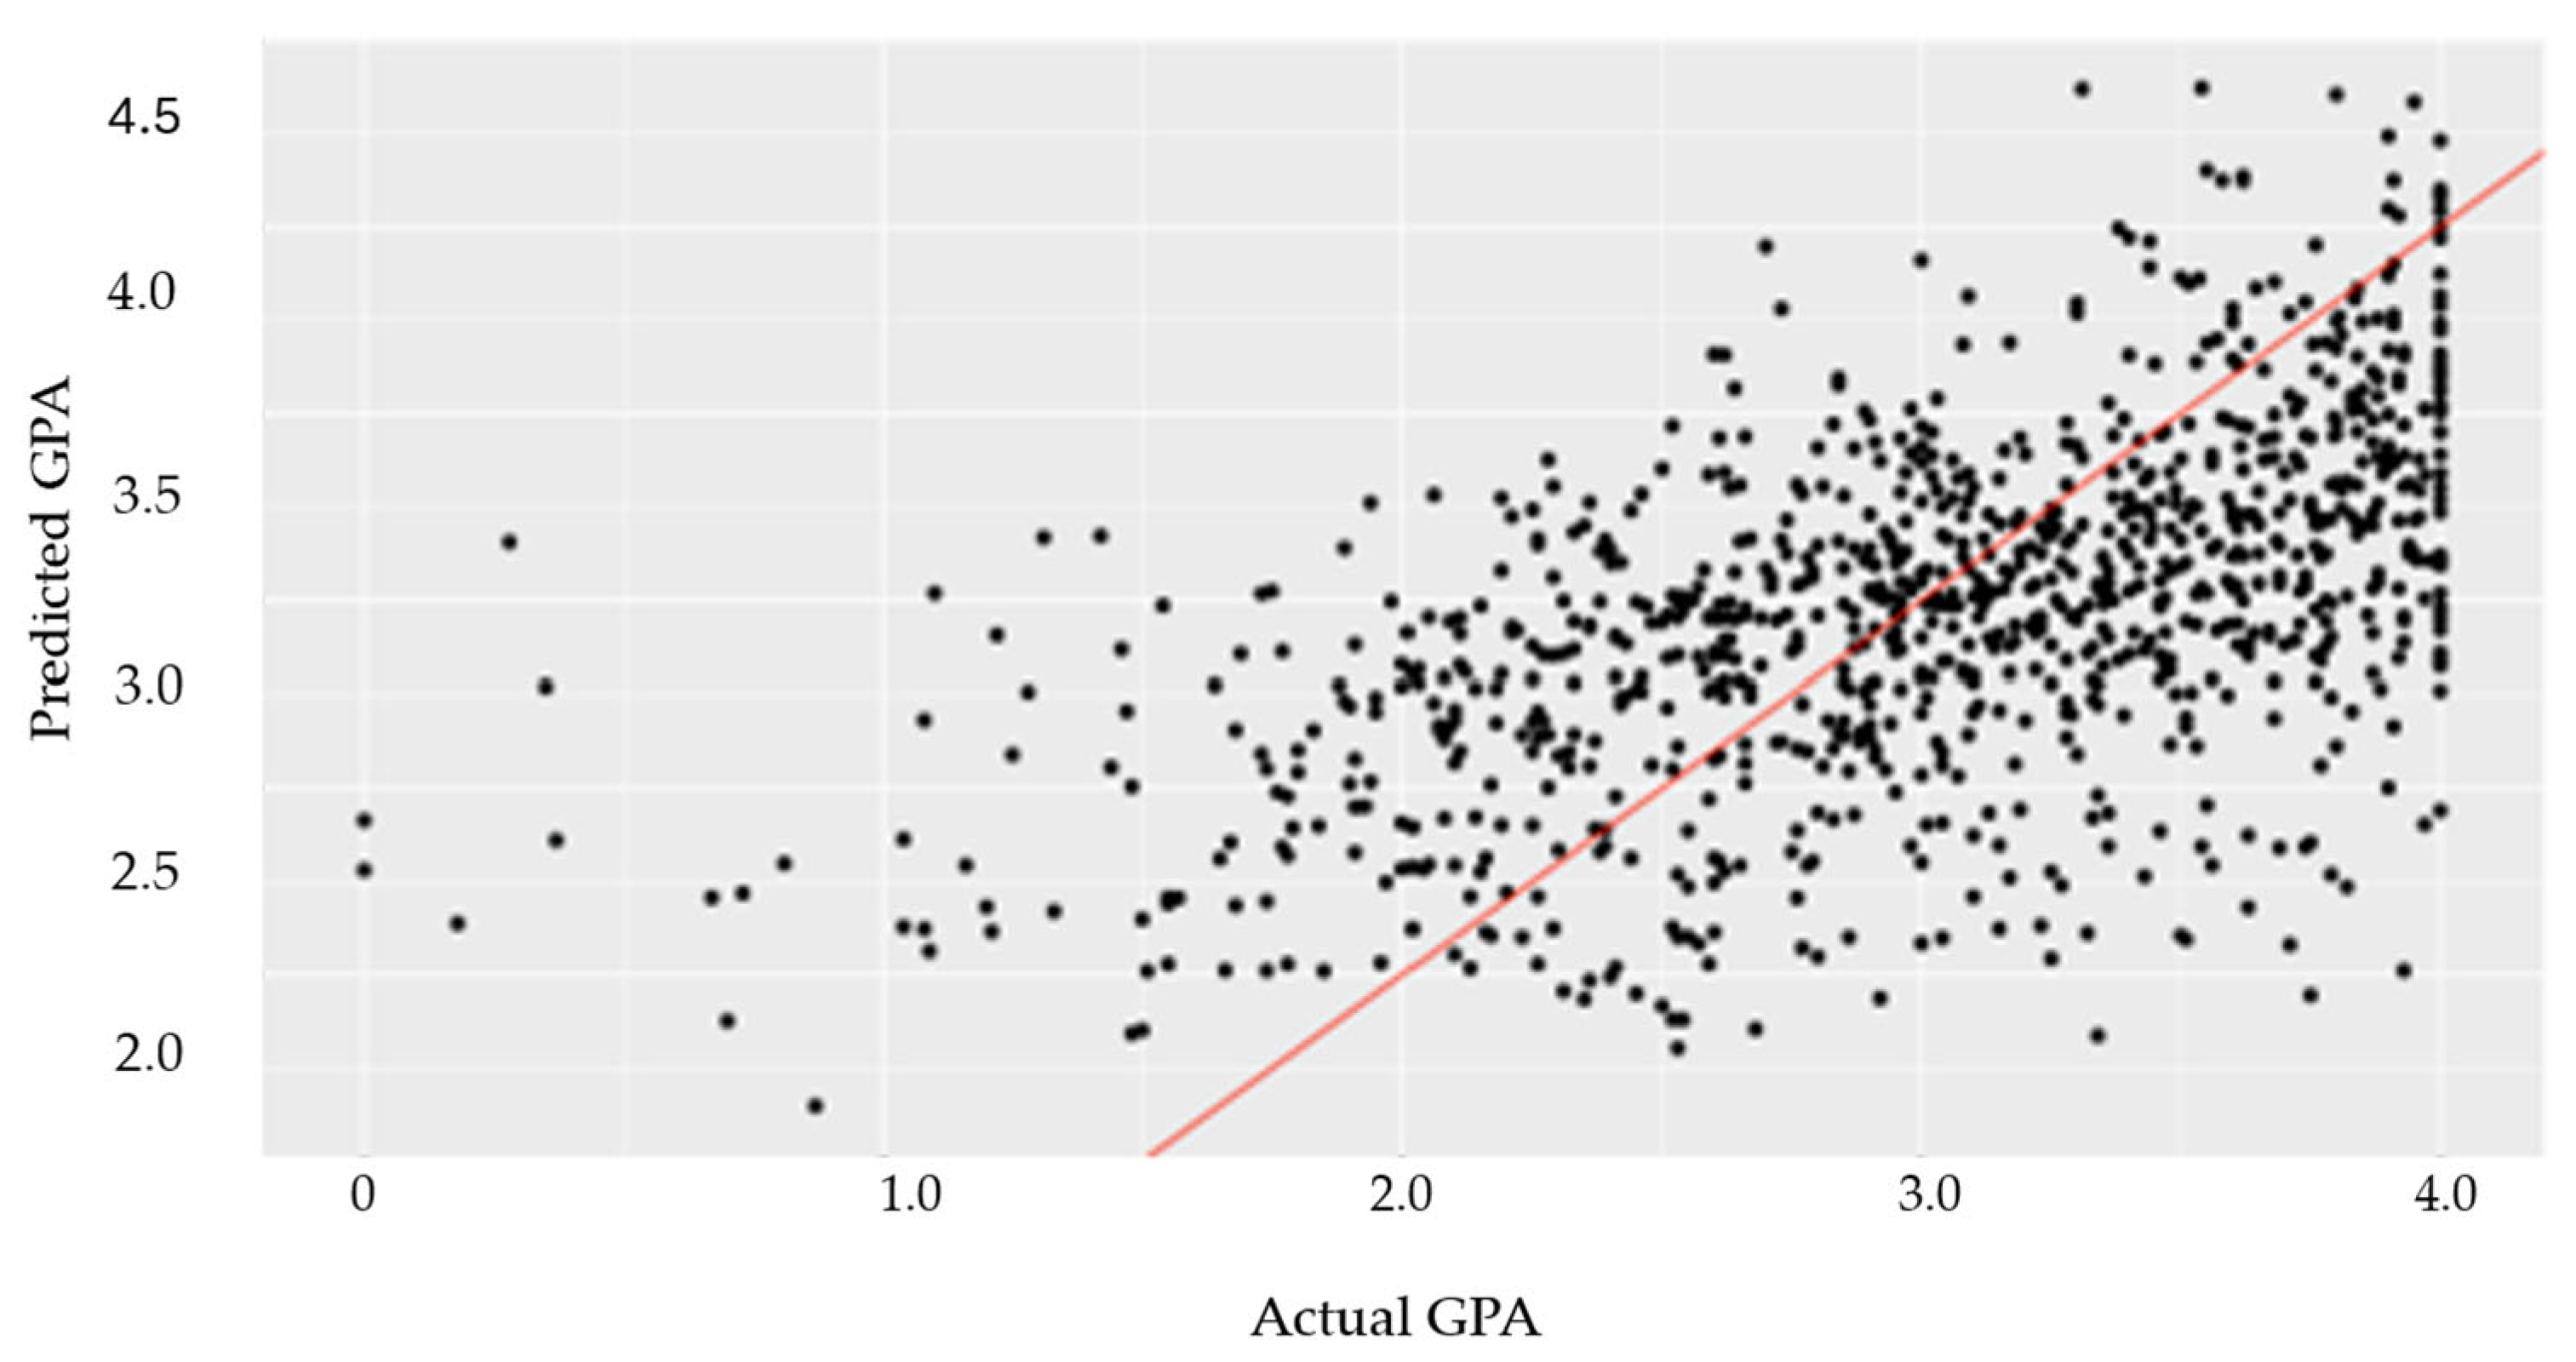
Researchers developed a regression model to predict academic success in PSs using the PS21-22 dataset (N = 847) to train the model. Academic success (GPA) was the continuous response variable. Prior to validating the model with the PS22-23 data, a researcher cleaned the data and removed 13 observations because of missing data. Then, the researcher employed PS 22-23 data (N = 951) as the testing set in the validation of the multiple regression model. The prediction error (0.05) indicated the model was a good fit for the data, as shown in Figure 2. Actual vs. Predicted Scatterplot. The plot was truncated because the true GPA is bounded between 0 and 4.0; however, the predictions had a slightly wider range.

3.2.2. Logistic Regression Model

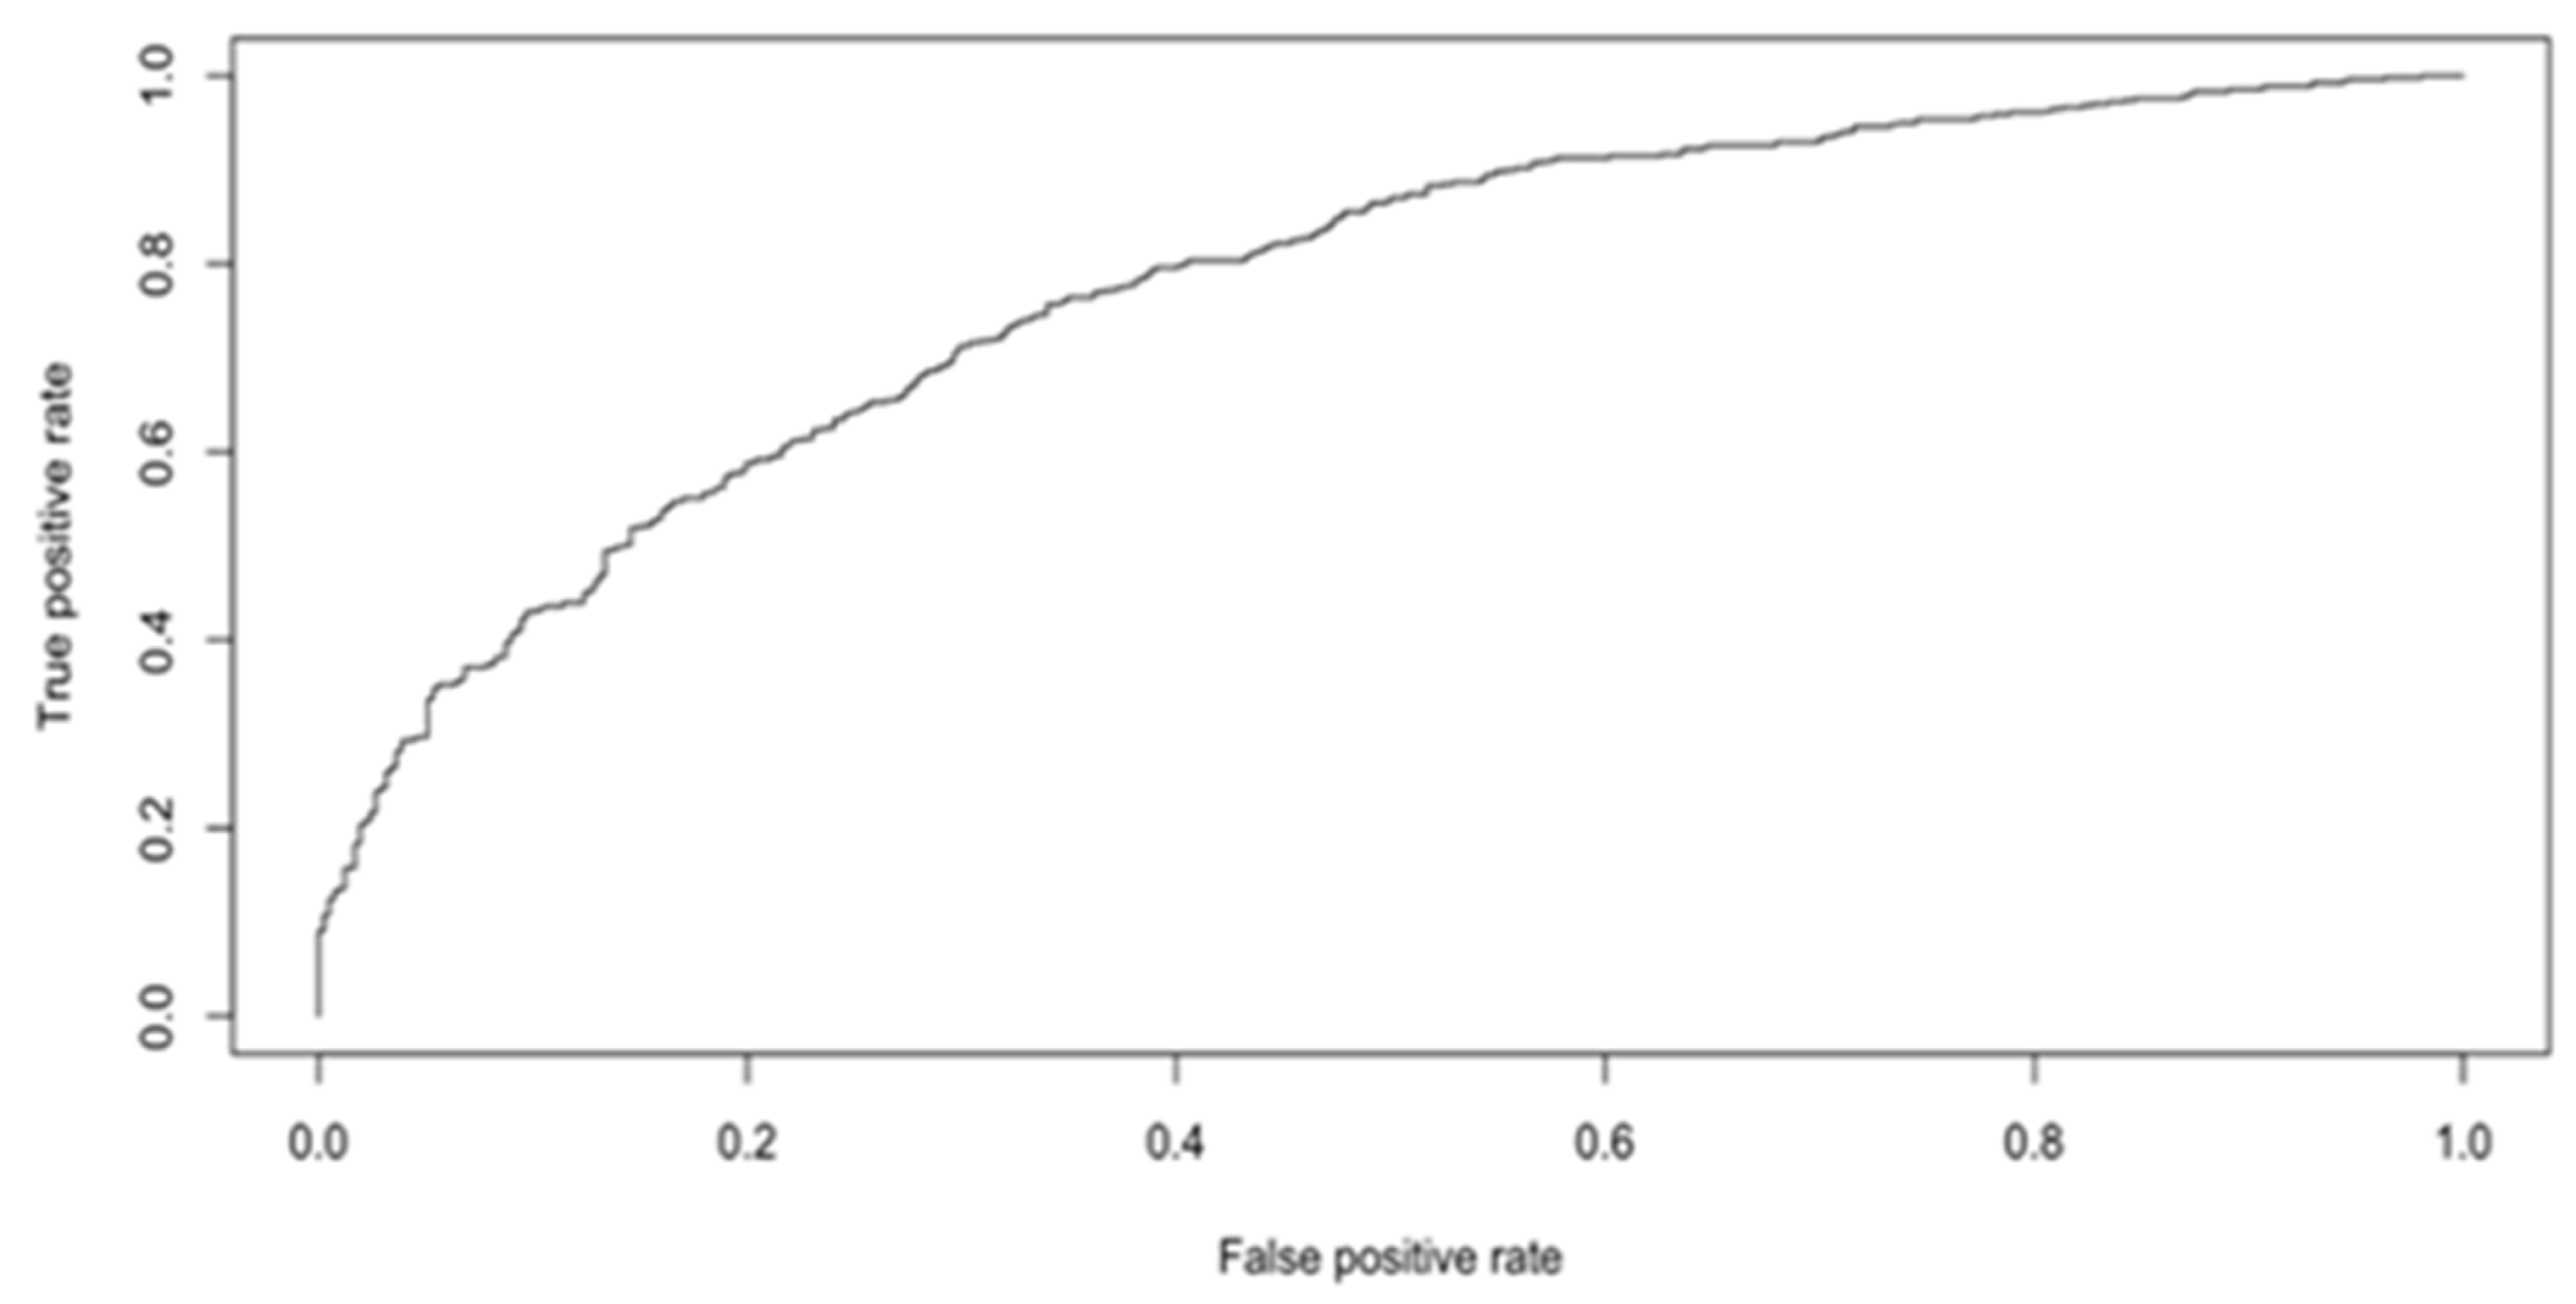
Researchers developed a logistic regression model with PS21-22 to train the data. Using PS22-23 data (N = 951), researchers conducted logistic regression with a response variable GPA > 3.0 as 1 and 0 if GPA was not >3.0 (academic success vs. not) to validate the model. When predicting a GPA > 3.0, the PS22-23 data showed accuracy at 0.71, supporting that the model was a good predictor of academic performance. Researchers plotted the receiver operating characteristic (ROC) curve and the area under the curve (AUC) with an absolute maximum of 1.0 (100%). The AUC was calculated (0.776), indicating the model was a good fit for the data (Figure 3, ROC Curve).

3.2.3. LASSO Model

Researchers applied the LASSO method for variable selection to develop a model for predicting academic performance. In this method, Lambda (λ), the tuning parameter, controls the strength of the shrinkage. As the value of Lambda increases, more predictors will be treated as unimportant. Lambda (1 s.e.) was chosen instead of Lambda (min) to obtain a more effective model. The positive predictors of academic success (highest to lowest coefficient) were graduate, honors, and senior students, female, Women’s track and field, junior classification, international ethnicity, international with waiver residency, and frequency of pantry shopping. Table 4 presents the variable selection matrix for predicting academic success among PSs, 2022–2023 (N = 951). Negative predictors were withdrawn students, part-time status, first-time freshmen, Black students, College of Science, Engineering, and Technology, Pell Grant-eligible students, College of Business Administration, and Hispanic students. Age, citizenship, first-generation, veteran status, elite, and evolve did not predict academic success in the LASSO model (Figure S1: LASSO Paths of Regression Shrinking Towards Zero AY2022–2023 (N = 951)). Using cross-validation, the researcher estimated the tuning parameter to be λ = 0.03.

4. Discussion

This study expands the evidence base about campus food pantry utilization by examining two consecutive years of institutional data and applying ML techniques to identify predictors of academic success among PSs. In alignment with previous studies conducted at this university, the majority of pantry users were female (66%), first-generation students (42%), Pell Grant eligible (58.5%), and represented diverse ethnic backgrounds: Hispanic (32.8%), White (27.2%), Black (22.3%), and international students (10.8%) [19]. These sociodemographic factors are consistent with previous studies identifying them as critical risk factors for FI [52,55].
During the Fall 2022 semester, the campus student population comprised 64.3% females, and the ethnic composition was 47% White, 27% Hispanic, and 15.8% Black. Notably, the pantry served proportionally more Hispanic and Black students and fewer White students than the overall student body representation. The ethnicities of PSs in this study are similar to those in previous research on our campus, where Hispanics, Whites, and Blacks shopped in comparable numbers in the pantry [19]. However, one national study from 2015 to 2019 found that 21% of Black students were food-insecure compared to 9% of White students [56]. Overall, the students in our study may have a greater need for food assistance due to the rural geographical location of the main campus, lack of public transportation, and limited access to full-service supermarkets in the surrounding environment.
Females accounted for two-thirds of the PSs and 64% of the student body in AY 2022–23, and their representation in PSs increased significantly from AY2021–2022 to AY2022–23, similar to a recent review [11]. Since women are more likely to experience food insecurity [23,57] and often have greater roles in caregiving and preparing food, focused outreach initiatives for women could also improve the family’s health [58].
From AY2021–22 to AY 2022–23, the total number of PSs increased by eleven percent. Additionally, the overall participation rate of students increased, and the mean frequency of pantry visits rose significantly to 3.15 visits/academic year, indicating greater engagement with campus food resources over time. Despite this upward trajectory, participation remains low relative to estimated FI prevalence on U.S. campuses, suggesting that barriers, such as stigma, lack of awareness, or limited accessibility, persist. These findings are consistent with other studies indicating a need for more research aimed at increasing the use of campus food pantries [17,22,28,59].
In the current study, factors that may contribute to an increase in pantry use include economic factors such as the increased cost of food and other goods in AY 2021–2023. Also, the upward trend in student pantry participation in our study may suggest a slight reduction in stigma regarding the use of college food pantries. Therefore, increases in pantry shopping frequency and student pantry participation may reflect normalization of using the pantry through effective campus outreach with environmental interventions that reduce stigma [60].
To aid in reducing the stigma associated with shopping in the pantry, periodic campus farmers’ markets are open to all students to receive free produce. In the Fall of 2024, the first farmers’ market served fresh produce to 256 university students, including 71% (n = 182) students who reported never shopping in the pantry. Also, in the Fall of 2025, the campus food pantry began taking online food orders and scheduled pickups, which made pantry shopping more convenient and accessible. Online ordering may reduce stigma for students because it results in less waiting in line to obtain food. Initiatives such as campus farmers’ markets and online ordering systems may mitigate these barriers by increasing visibility, reducing social exposure, and reframing pantry use as a routine form of resource access. Given that a majority of participants at the university’s first farmers’ market had never shopped in the pantry, such universal-access initiatives may serve as effective entry points for resource-insecure students.
Consistent with prior findings from AY21–22, PSs demonstrated significantly higher fall term GPAs than NPSs. While FI is generally associated with poorer academic outcomes, PSs may differ from FI students because receiving food assistance may mitigate the academic consequences of FI [61,62,63]. The larger number of PSs in the fall term may also have boosted the statistical power to detect GPA differences in that semester. These findings underscore the potential academic benefits of campus food assistance, an area warranting further prospective investigation.
Machine Learning approaches provided additional insights into predictors of academic success among PSs. Positive predictors of academic performance included graduate and honors students, seniors and juniors, female students, international students with waivers, women’s track-and-field athletes, and higher pantry-shopping frequency. The fact that pantry use frequency emerged as a positive predictor suggests that engagement with food support resources may help promote academic stability among vulnerable students. These patterns are consistent with the literature showing that academic maturity, engagement in structured programs, and stable financial or residency status contribute to improved academic outcomes [49,64].
Conversely, negative predictors included students who attended part-time, first-time freshmen, Black and Hispanic students, and Pell Grant-eligibility, all of which are sociodemographic factors often cited as risks for FI and lower academic performance [52,53,54]. The ML results align with other predictive analytics studies, demonstrating that sociodemographic variables reliably predict academic performance [49,50,51]. However, this research is among the first studies to apply ML methods specifically to predict academic success in PSs.
Among the most important findings is defining a target audience for outreach efforts. Early intervention strategies may be particularly important for part-time, first-year, and Pell Grant-eligible students, all groups with elevated academic risk and lower pantry engagement. Collaboration with academic support units, culturally responsive programming, and peer-led outreach through student organizations may be effective in increasing awareness and reducing stigma. Additionally, academic units with lower pantry participation (e.g., Business, Education, Health Sciences, Humanities) may benefit from tailored communication campaigns to ensure that students are aware of available support.
Finally, the lack of standardized measures for pantry utilization (e.g., pantry visit frequency, participation rate, intensity of use) represents a significant gap in the literature. Developing uniform metrics would enhance the comparability and rigor of pantry-based intervention research, strengthening the resource justification for campus food assistance programs. Establishing consistent measurement frameworks may also support long-term sustainability and allow institutions to assess the impact of food assistance on student success more effectively [65].
Overall, this study contributes to the emerging literature linking campus food pantry utilization to academic performance and demonstrates the utility of ML methods for identifying and prioritizing at-risk subpopulations within pantry users. Continued development of outreach strategies, standardized utilization metrics, and longitudinal designs will be essential to understand and enhance the role of campus food pantries in supporting student well-being and academic success more fully.

Study Limitations

This research has a few limitations that should be taken into consideration when interpreting the findings. First, although ML approaches offer advantages for identifying complex patterns, they are susceptible to issues such as overfitting, underfitting, and reduced generalizability if models are built on incomplete, imbalanced, or unmeasured variables. While cross-validation procedures in this study reduced the likelihood of overfitting, unobserved variables may still influence predictive accuracy. Additionally, ML models provide limited insight into the causal mechanisms underlying observed associations; therefore, the predictors identified in this study should not be interpreted as causal determinants of academic success. Bias in model training is also possible because ML algorithms learn directly from the structure of the available data, which may reflect underlying institutional or structural inequities [66].
Second, this study relied on secondary institutional data, which, despite being objective (e.g., GPA records, card-swipe pantry data), may still be subject to inaccuracies or administrative inconsistencies. Importantly, the dataset did not include direct measures of FI. As a result, pantry use served as a proxy for access to food assistance rather than FI status itself, limiting conclusions about the extent to which pantry use reduces FI or mediates academic performance.
Third, the study was conducted at a single public university in a rural Texas county, and the demographic composition of the sample, particularly the high proportion of female students and substantial ethnic diversity, may limit external generalizability to other institutional contexts, such as urban universities, community colleges, or campuses with different sociodemographic profiles. Although women were overrepresented among PSs, FI is disproportionately experienced by women, suggesting that the sample may accurately reflect the underlying population of students seeking assistance.
Finally, several potentially relevant covariates were unavailable in the institutional dataset, including indicators of employment status, number of work hours, access to federal or local food assistance programs, transportation barriers, housing instability, or detailed academic load beyond full-time/part-time designation. These contextual factors may influence both pantry utilization and academic outcomes. Future studies would benefit from incorporating direct FI assessments, longitudinal designs, and a broader set of academic, financial, and psychosocial variables to improve causal inference and deepen understanding of the mechanisms linking pantry use to student success.

5. Conclusions

This research generated and validated three ML models, multiple regression, logistic regression, and LASSO, to predict academic success among campus food PSs. The LASSO produced the most parsimonious and efficient model, identifying a set of positive predictors (graduate and honors status, junior and senior classification, female gender, women’s track and field, international ethnicity or waiver status, and frequency of pantry shopping). Also, negative predictors were identified: withdrawn or part-time status, first-time freshmen, Black and Hispanic students, Pell Grant eligibility, and enrollment in the Colleges of Science, Engineering, and Technology or the College of Business Administration. These findings underscore the complex interplay of sociodemographic and academic factors to consider when prioritizing subpopulations for outreach and during the development of pantry marketing strategies and programs at universities.
A significant gap highlighted in this study is the absence of standardized measures for college pantry utilization, such as frequency of shopping and student pantry participation rates. Developing markers to measure utilization would strengthen the reliability and comparability of future research, support program evaluation, and provide essential justification for resource allocation and long-term sustainability.
In the post-COVID-19 context, FI remains a critical challenge for university students. Campus food pantries continue to represent an important strategy for mitigating COVID-19’s physical, psychological, and academic impacts. As institutions seek to support vulnerable student populations, integrating evidence-based pantry interventions and systematically tracking utilization metrics can help maintain and improve academic performance among students at risk for FI.

Supplementary Materials

The following supporting information can be downloaded at: https://www.mdpi.com/article/10.3390/higheredu5010022/s1, Figure S1: LASSO Paths of Regression Shrinking Towards Zero AY2022–2023 (N = 951).

Author Contributions

Conceptualization, L.F., D.G., K.G., R.D. and T.L.; methodology, L.F., D.G., K.G., R.D. and T.L.; software, D.G.; formal analysis, D.G.; data curation, K.G., L.F., R.D. and D.G.; writing—original draft preparation, L.F., T.L., R.D. and K.G.; writing—review and editing, L.F., D.G., K.G. and T.L.; visualization, D.G. and L.F.; supervision, L.F.; project administration, L.F. All authors have read and agreed to the published version of the manuscript.

Funding

This research received funding from Sam Houston State University, College of Health Sciences, SHSU Food Pantry.

Institutional Review Board Statement

The study was conducted in accordance with the Declaration of Helsinki and approved by the Institutional Review Board (or Ethics Committee) of Sam Houston State University (2019-161, approved on 5 June 2019).

Informed Consent Statement

Informed consent was obtained from all subjects who shopped in the SHSU food pantry. Permission was granted from SHSU’s Office of Research and Sponsored Programs for authors to use previously collected university data in this research and publications related to the impact of the SHSU food pantry.

Data Availability Statement

The data presented in this study are available on request from the corresponding author due to use of university data.

Conflicts of Interest

The authors declare no conflicts of interest.

References

  1. National Center for Education Statistics. Total Fall Enrollment in Degree-Granting Postsecondary Institutions, by Level and Control of Institution, Attendance Status, and Sex of Student: Selected Years, 1970 Through 2031. Table 303.10 2022. 2025. Available online: https://nces.ed.gov/ (accessed on 7 March 2025).
  2. Arnett, J.J. Emerging adulthood: A theory of development from the late teens through the twenties. Am. Psychol. 2000, 55, 469–480. [Google Scholar] [CrossRef]
  3. Loofbourrow, B.M.; Scherr, R.E. Food insecurity in higher education: A contemporary review of impacts and explorations of solutions. Int. J. Environ. Res. Public Health 2023, 20, 5884. [Google Scholar] [CrossRef]
  4. Manboard, M.; Johnson, C.M.; Thornton, H.; Biediger-Friedman, L. The HOME study: Understanding how college students at a Hispanic serving institution coped with food insecurity in a pandemic. Int. J. Environ. Res. Public Health 2021, 18, 11087. [Google Scholar] [CrossRef]
  5. Kelly, T.; Pavela, G. Food Insecurity, MyPlate Recognition, and Meal Preparation Confidence Among College Food Pantry Users. J. Nutr. Educ. Behav. 2024, 56, 703–709. [Google Scholar] [CrossRef]
  6. Nikolaus, C.J.; Ellison, B.; Nickols-Richardson, S.M. Food insecurity among college students differs by questionnaire modality: An exploratory study. Am. J. Health Behav. 2020, 44, 82–89. [Google Scholar] [CrossRef]
  7. USDA, Economic Research Service. Food Security in the U.S. Available online: https://www.ers.usda.gov/topics/food-nutrition-assistance/food-security-in-the-u-s/interactive-charts-and-highlights/#States (accessed on 29 December 2024).
  8. Goldrick-Rab, S.; Cady, C.; Coca, V. Campus Food Pantries: Insights from a National Survey; The Hope Center, Temple University: Philadelphia, PA, USA, 2018. [Google Scholar]
  9. Broton, K.; Lenkaitis, C.; Henry, S. Universities as producers, managers, and opponents of poverty: The case of food insecurity on campus. Georget. J. Poverty Law Policy 2022, 29, 337–359. [Google Scholar]
  10. Swipe Out Hunger. Swipe Out Hunger FY2025 Impact Report; Swipe Out Hunger: Covina, CA, USA, 2025. [Google Scholar]
  11. Phelan, J.M.; Rosenkranz, R.R.; Logan, C.; Haub, M.D.; Mailey, E.L.; Ezzati, A.; Rosenkranz, S.K. The association of overall dietary quality on stress, anxiety, depression, and academic performance in college students: A systematic review. J. Am. Coll. Health 2025, 73, 977–988. [Google Scholar] [CrossRef] [PubMed]
  12. Haro-Contreras, C.; Torres, C.Z.; Ayon, C.; Enriquez, L. Examining the association of food insecurity with mental health and academic performance among Latinx immigration-impacted students. J. Am. Coll. Health 2025, 73, 4032–4040. [Google Scholar] [CrossRef]
  13. Martinez, S.M.; Chodur, G.M.; Esaryk, E.E.; Kaladijian, S.; Ritchie, L.D.; Grandner, M. Campus food pantry use is linked to better health among public university students. J. Nutr. Educ. Behav. 2022, 54, 491–498. [Google Scholar] [CrossRef] [PubMed]
  14. Leonard, T.; Andrews, D.; Pruitt, S.L. Impact of changes in the frequency of food pantry utilization on client food security and well-being. Appl. Econ. Perspect. Policy 2022, 44, 1049–1067. [Google Scholar] [CrossRef]
  15. Brito-Silva, F.D.K.; Wang, W.; Moore, C.E.; Warren, C.; Miketinas, D.C.; Tucker, W.J.; Davis, K.E. College campus food pantry program evaluation: What barriers do students face to access on-campus food pantries? Nutrients 2022, 14, 2807. [Google Scholar] [CrossRef] [PubMed]
  16. Daugherty, J.B.; Birnbaum, M.; Clark, A. ‘Having enough’: Students’ understanding of food insecurity and campus food pantry use. J. Poverty 2019, 23, 600–620. [Google Scholar] [CrossRef]
  17. DeBate, R.; Jarvis, J.E.; Jones, R.; Himmelgreen, D.; Conner, K.; Dumford, A.D.; Stern, M. Perceived self- and social stigma among campus-based food pantry users. J. Am. Coll. Health 2025, 73, 3306–3311. [Google Scholar] [CrossRef]
  18. El Zein, A.; Vilaro, M.J.; Shelnutt, K.P.; Walsh-Childers, K.; Mathews, A.E. Obstacles to university food pantry use and student-suggested solutions: A qualitative study. PLoS ONE 2022, 17, e0267341. [Google Scholar] [CrossRef]
  19. Fergus, L.; Gao, D.; Gilbert, K.; Lopez, T. The relationship between a campus food pantry and academic success at a public university. Soc. Sci. 2024, 13, 587. [Google Scholar] [CrossRef]
  20. McArthur, L.H.; Fasczewski, K.S.; Farris, A.R.; Petrone, M. Use and perceptions of a campus food pantry among food insecure college students: An exploratory study from Appalachia. J. Appalach. Health 2020, 2, 7–23. [Google Scholar] [CrossRef] [PubMed]
  21. Miller, M.; Middendorf, G.; Wood, S.; Lutter, S.; Jones, S.; Lindshield, B. Food insecurity and assistance on campus: A survey of the student body. Online J. Rural Res. Policy 2019, 14, 1. [Google Scholar] [CrossRef]
  22. Idehai, O.V.; Mbaya, P.; Chung, T.; Bhurosy, T. A systematic review of factors associated with student use of campus food pantries: Implications for addressing barriers and facilitating use. BMC Public Health 2024, 24, 97. [Google Scholar] [CrossRef]
  23. Weaver, R.R.; Hendricks, S.P.; Vaughn, N.A.; McPherson-Myers, P.E.; Willis, S.L.; Terry, S.N. Obstacles to food security, food pantry use, and educational success among university students: A mixed methods approach. J. Am. Coll. health 2022, 70, 2548–2559. [Google Scholar] [CrossRef]
  24. Aldaz, K.J.; Flores, S.O.; Ortiz, R.M.; Diaz Rios, L.K.; Dhillon, J. A cross-sectional analysis of food perceptions, food preferences, diet quality, and health in a food desert campus. Nutrients 2022, 14, 5215. [Google Scholar] [CrossRef]
  25. Guerithault, N.; McClure, S.M.; Ojinnaka, C.O.; Braden, B.B.; Bruening, M. Resting-state functional connectivity differences in college students with and without food insecurity. Nutrients 2022, 14, 2064. [Google Scholar] [CrossRef]
  26. Mechler, H.; Coakley, K.; Walsh-Dilley, M.; Cargas, S. Examining the Relationship Between Food Insecurity and Academic Performance: Implications for Diversity and Equity in Higher Education. J. Coll. Stud. Retent. Res. Theory Pract. 2024, 26, 3–18. [Google Scholar] [CrossRef]
  27. Umeda, M.; Kim, Y.; Park, S.-W.; Chung, E.; Ullevig, S.L. Food insecurity and academic function among college students during the COVID-19 pandemic: A moderating role of the first-generation college student status. J. Am. Coll. Health 2024, 72, 3576–3582. [Google Scholar] [CrossRef]
  28. Lemp, H.; Lanier, J.; Wodika, A.; Schalasky, G. Impact of food insecurity on the health and well-being of college students. J. Am. Coll. Health 2024, 72, 3671–3680. [Google Scholar] [CrossRef]
  29. Marmolejo, C.; Banta, J.E.; Siapco, G.; Baba Djara, M. Examining the association of student mental health and food security with college GPA. J. Am. Coll. Health 2024, 72, 819–825. [Google Scholar] [CrossRef]
  30. Tripathy, K.; Bhasin, R.; McKinzie, R.; Sackett, A.; Storrs, M.-E.; Janda, K.M. Food insecurity disparities and impact on academic and social experiences among college students at a large public university. J. Am. Coll. Health 2024, 72, 3740–3747. [Google Scholar] [CrossRef]
  31. Kopels, M.C.; Shattuck, E.C.; Rocha, J.; Roulette, C.J. The lasting impact of the COVID-19 pandemic on the basic-needs security and mental health on a sample of college students. J. Am. Coll. Health 2025, 73, 1761–1770. [Google Scholar] [CrossRef] [PubMed]
  32. Orihuela, C.A.; Cox, C.; Evans, R.; Mrug, S. Associations of household food insecurity with academic outcomes in early adolescents. J. Sch. Health 2023, 93, 883–890. [Google Scholar] [CrossRef] [PubMed]
  33. Kent, K.; Siu, Y.H.; Hutchesson, M.; Collins, C.E.; Charlton, K.E. Association between food insecurity status, campus food initiative use and diet quality in Australian university students. Nutr. Diet. J. Dietit. Assoc. Aust. 2023, 81, 170–179. [Google Scholar] [CrossRef]
  34. Sklar, E.; Radtke, M.D.; Steinberg, F.; Medici, V.; Fetter, D.; Scherr, R. Nutrition knowledge, food insecurity, and dietary biomarkers: Examining fruit and vegetable intake among college students. Nutrients 2025, 17, 584. [Google Scholar] [CrossRef] [PubMed]
  35. Burrows, T.; Whatnall, M.; Patterson, A.; Hutchesson, M. Associations between dietary intake and academic achievement in college students: A systematic review. Healthcare 2017, 5, 60. [Google Scholar] [CrossRef]
  36. Adolphus, K.; Lawton, C.L.; Dye, L. The effects of breakfast on behavior and academic performance in children and adolescents. Front. Hum. Neurosci. 2013, 7, 425. [Google Scholar] [CrossRef]
  37. Goldman, B.J.; Freiria, C.N.; Landry, M.J.; Arikawa, A.Y.; Wright, L. Research trends and gaps concerning food insecurity in college students in the United States: A scoping review. J. Am. Coll. Health 2025, 73, 2960–2999. [Google Scholar] [CrossRef] [PubMed]
  38. Rabbitt, M.P.; Reed-Jones, M.; Hales, L.J.; Burke, M.P. Household Food Security in the United States in 2023; USDA Economic Research Service: Washington, DC, USA, 2024.
  39. El Zein, A.; Mathews, A.; House, L.; Shelnutt, K. Why are hungry college students not seeking help? Predictors of and barriers to using an on-campus food pantry. Nutrients 2018, 10, 1163. [Google Scholar] [CrossRef]
  40. Radtke, M.D.; Steinberg, F.M.; Scherr, R.E. Methods for assessing health outcomes associated with food insecurity in the United States college student population: A narrative review. Adv. Nutr. 2024, 15, 100131. [Google Scholar] [CrossRef] [PubMed]
  41. Fletcher, C.; Cornett, A. Student Financial Wellness Survey Fall 2023 Semester Report; Trellis Strategies: Round Rock, TX, USA, 2024. [Google Scholar]
  42. Fletcher, C.; Cornett, A. Student Financial Wellness Survey Fall 2024 Semester Report; Trellis Strategies: Round Rock, TX, USA, 2025. [Google Scholar]
  43. Taniey, R.; Leyden, L. Feeding hungry students: College students’ experiences using food pantries and successful strategies for implementing on-campus food assistance programs. J. Am. Coll. Health 2024, 72, 1925–1940. [Google Scholar] [CrossRef] [PubMed]
  44. Hamerman, E.J.; Martins, C.M. Implementing a campus food pantry in the US: Strategies for operations and marketing communications. J. Philanthr. Mark. 2024, 29, e1823. [Google Scholar] [CrossRef]
  45. Scutts, T.; Farnaz, N.; Ganbold, G.; Bhatti, A.J.; Phan, S.; Williams, M.J.; Mihrshahi, S. Co-designing solutions to tackle food insecurity in higher education settings: A scoping review. Public Health Nutr. 2025, 28, e80. [Google Scholar] [CrossRef]
  46. Kirk, D.; Kok, E.; Tufano, M.; Tekinerdogan, B.; Feskens, E.J.M.; Camps, G. Machine learning in nutrition research. Adv. Nutr. 2022, 13, 2573–2589. [Google Scholar] [CrossRef]
  47. Yang, Y.; An, R.; Fang, C.; Ferris, D. Artificial intelligence in food bank and pantry services: A systematic review. Nutrients 2025, 17, 1461. [Google Scholar] [CrossRef]
  48. Coelho da Silva, T.L.; Furtado, L.S.; Fernandes, G.S.; Fernandes de Macêdo, J.A.; Cruz, L.A.; Magalhães, R.P.; Amorim Gomes, L.G. Machine Learning methods and models to predict food insecurity levels for families in Ceará, Brazil, based on employment, housing and other social indicators. J. Braz. Comput. Soc. 2025, 31, 203–218. [Google Scholar] [CrossRef]
  49. Zaiyong, T.; Jain, A.; Colina, F.E. A comparative study of machine learning techniques for college student success prediction. J. High. Educ. Theory Pract. 2024, 24, 101–116. [Google Scholar] [CrossRef]
  50. Guanin-Fajardo, J.H.; Guaña-Moya, J.; Casillas, J. Predicting academic success of college students using machine learning techniques. Data 2024, 9, 60. [Google Scholar] [CrossRef]
  51. Zeng, X. Predicting academic success among college students using machine learning techniques applied to online learning data. In Proceedings of the 2023 9th Annual International Conference on Network and Information Systems for Computers (ICNISC), Wuhan, China, 27–29 October 2023; pp. 39–43. [Google Scholar] [CrossRef]
  52. El Zein, A.; Shelnutt, K.P.; Colby, S.; Vilaro, M.J.; Zhou, W.; Greene, G.; Olfert, M.D.; Riggsbee, K.; Morrell, J.S.; Mathews, A.E. Prevalence and correlates of food insecurity among U.S. college students: A multi-institutional study. BMC Public Health 2019, 19, 660. [Google Scholar] [CrossRef]
  53. Weaver, R.R.; Vaughn, N.A.; Hendricks, S.P.; McPherson-Myers, P.E.; Jia, Q.; Willis, S.L.; Rescigno, K.P. University student food insecurity and academic performance. J. Am. Coll. Health 2020, 68, 727–733. [Google Scholar] [CrossRef]
  54. Woerden, I.; Hruschka, D.; Bruening, M. Food insecurity negatively impacts academic performance. Public Aff. 2019, 19, e1864. [Google Scholar] [CrossRef]
  55. Singh, S.; Esaryk, E.E.; Meza, E.; Britton, T.; Martinez, S.M. Disparities in food insecurity and academic achievement among california public university students: An intersectional approach. Nutrients 2024, 16, 3728. [Google Scholar] [CrossRef] [PubMed]
  56. Wolfson, J.A.; Insolera, N.; Laska, M.N.; Leung, C.W. High prevalence of food insecurity and related disparities among us college and university students from 2015–2019. J. Nutr. Educ. Behav. 2024, 56, 27–34. [Google Scholar] [CrossRef]
  57. Miles, R.; McBeath, B.; Brockett, S.; Sorenson, P. Prevalence and predictors of social work student food insecurity. J. Soc. Work Educ. 2017, 53, 651–663. [Google Scholar] [CrossRef]
  58. Shreffler, K.M.; Dressler, C.M.; Ciciolla, L.; Wetherill, M.S.; Croff, J.M. Maternal periconception food insecurity and postpartum parenting stress and bonding outcomes. Front. Nutr. 2024, 11, 1275380. [Google Scholar] [CrossRef]
  59. Jefferson, S.; Cafer, A.; Mann, G. Food pantry offerings and awareness at a southeastern public university. J. Am. Coll. Health 2024, 72, 1575–1582. [Google Scholar] [CrossRef] [PubMed]
  60. Appel, E.Y.; Halverson, M.M.; Earnshaw, V.A.; Cordero, T.C.; Rozin, M.; Powell, R.; Sands, G.; Chrisostam, N.; Katz, S.E.; Sharma, S.V.; et al. Mitigating food insecurity-related stigma: A review of intervention strategies. Del. J. Public Health 2025, 11, 8–21. [Google Scholar] [CrossRef]
  61. Harville, C.; James, D.C.S.; Burns, A. Profile of a food-insecure college student at a major southeastern university: A randomized cross-sectional study. Nutrients 2023, 15, 1108. [Google Scholar] [CrossRef]
  62. Payne-Sturges, D.C.; Tjaden, A.; Caldeira, K.M.; Vincent, K.B.; Arria, A.M. Student hunger on campus: Food insecurity among college students and implications for academic institutions. Am. J. Health Promot. 2018, 32, 349–354. [Google Scholar] [CrossRef]
  63. Haskett, M.E.; Majumder, S.; Kotter-Grühn, D.; Gutierrez, I. The role of university students’ wellness in links between homelessness, food insecurity, and academic success. J. Soc. Distress Homelessness 2021, 30, 59–65. [Google Scholar] [CrossRef]
  64. Johnston, P.W.; Vieira, R.; Cameron, I.M.; Kumwenda, B.; Walker, K.A.; Cleland, J.A. Big data analysis: Examination of the relationship between candidates’ sociodemographic characteristics and performance in the UK’s Membership of the Royal College of Physicians Part 1 examination. Adv. Health Sci. Educ. Theory Pract. 2025, 30, 53–68. [Google Scholar] [CrossRef]
  65. Landry, M.J.; Heying, E.; Qamar, Z.; Hagedorn-Hatfield, R.L.; Savoie-Roskos, M.R.; Cuite, C.L.; Zigmont, V.A.; OoNorasak, K.; Chen, S. Advancing college food security: Priority research gaps. Nutr. Res. Rev. 2024, 37, 108–120. [Google Scholar] [CrossRef]
  66. Barbierato, E.; Gatti, A. The challenges of machine learning: A critical review. Electronics 2024, 13, 416. [Google Scholar] [CrossRef]
Figure 1. Frequency of Pantry Shopping (Academic Year 2022–2023).
Higheredu 05 00022 g001
Figure 2. Actual vs. Predicted GPA Scatterplot for PSs in 2022–2023.
Higheredu 05 00022 g002
Figure 3. Receiver Operating Characteristic Curve.
Higheredu 05 00022 g003
Table 1. Predictor Variables in the Models.
Independent Variables (N = 22)
1. Biological Sex9. Classification16. Major
2. Age10. Student Type17. Pantry Shopping frequency
3. Ethnicity11. Beginning Academic Standing18. Veteran Status
4. Citizenship12. End Academic Standing19. Sport
5. Residency13. Time Status20. Elite Participation
6. First-Generation Status14. Athlete21. Evolve Participation
7. Student Level15. College22. Pell Grant Eligibility
8. Honors
Table 2. Attributes of Campus Food Pantry Shoppers in AY 2022–2023 (N = 951).
Variablen%
Biological Sex
Female63266.5
Male31933.5
Ethnicity/Race
Hispanic31232.8
White25927.2
Black21222.3
International10310.8
Multiple races373.9
Asian191.9
Unknown/Other90.9
Classification
Freshman15015.7
Sophomore18919.8
Junior24325.5
Senior28129.5
Master’s818.5
Doctoral70.7
Pell Grant eligible
No39441.4
Yes55758.5
Honors
No89393.9
Yes586.1
First Generation
First generation39942.0
Continuing generation33835.5
Unknown21422.5
Time Status
Full time81085.1
Part time12413.0
Citizen
Citizen83287.5
Non-resident alien10310.8
Resident alien161.68
Residency
In-state resident83287.5
International with waiver798.3
Other424.2
Table 3. Institution Cumulative and Term GPA Results 2022–2023 (Pantry Shoppers vs. Non-Pantry Shoppers).
GPAPantry Shopper (n = 963)
Mean GPA
SDNon-Pantry Shopper (n = 22,574)
Mean GPA
SDt Valuedfp Value
Cumulative3.030.753.000.89−1.051079.90.29
Fall Term2.970.962.911.11−2.041038.40.04 *
Spring Term2.931.042.951.090.7310510.47
Summer Term3.221.003.211.06−0.0679880.95
* p < 0.05.
Table 4. Variable Selection Matrix for predicting academic success in PSs, 2022–2023 (N = 951).
VariableParameter
Intercept2.857614742
Biological Sex Female0.204899016
Ethnicity Black/African American−0.225166738
Hispanic−0.020393197
International0.054332046
Residency—International with waiver0.020498918
Student Level Graduate0.568153711
Classification Junior0.083372071
Senior0.293192063
Student Type First-Time Freshman−0.229683075
Time Status Three-Quarter Time−0.233304915
Half-time−0.092289532
Withdrawn−0.239834575
College Business Administration−0.041244556
Science and Engineering Technology−0.076165589
Frequency of Pantry Shopping0.001259289
Sport Women’s Track and Field0.108088484
Pell Grant Eligible−0.058776439
Honors Student0.553383774
Disclaimer/Publisher’s Note: The statements, opinions and data contained in all publications are solely those of the individual author(s) and contributor(s) and not of MDPI and/or the editor(s). MDPI and/or the editor(s) disclaim responsibility for any injury to people or property resulting from any ideas, methods, instructions or products referred to in the content.