

Quantitative Assessment of Soldering-Induced PM2.5 Exposure Using a Distributed Sensor Network in Instructional Laboratory Settings
 , , ,
, , ,  ,
,
Abstract
:1. Introduction
- Soldering continues to be a hazardous activity in educational settings, consistently releasing PM2.5 particulates into the atmosphere.
- All purifiers tested successfully reduced PM2.5 concentrations in the user’s breathing zone and helped contain particulates near the soldering station.
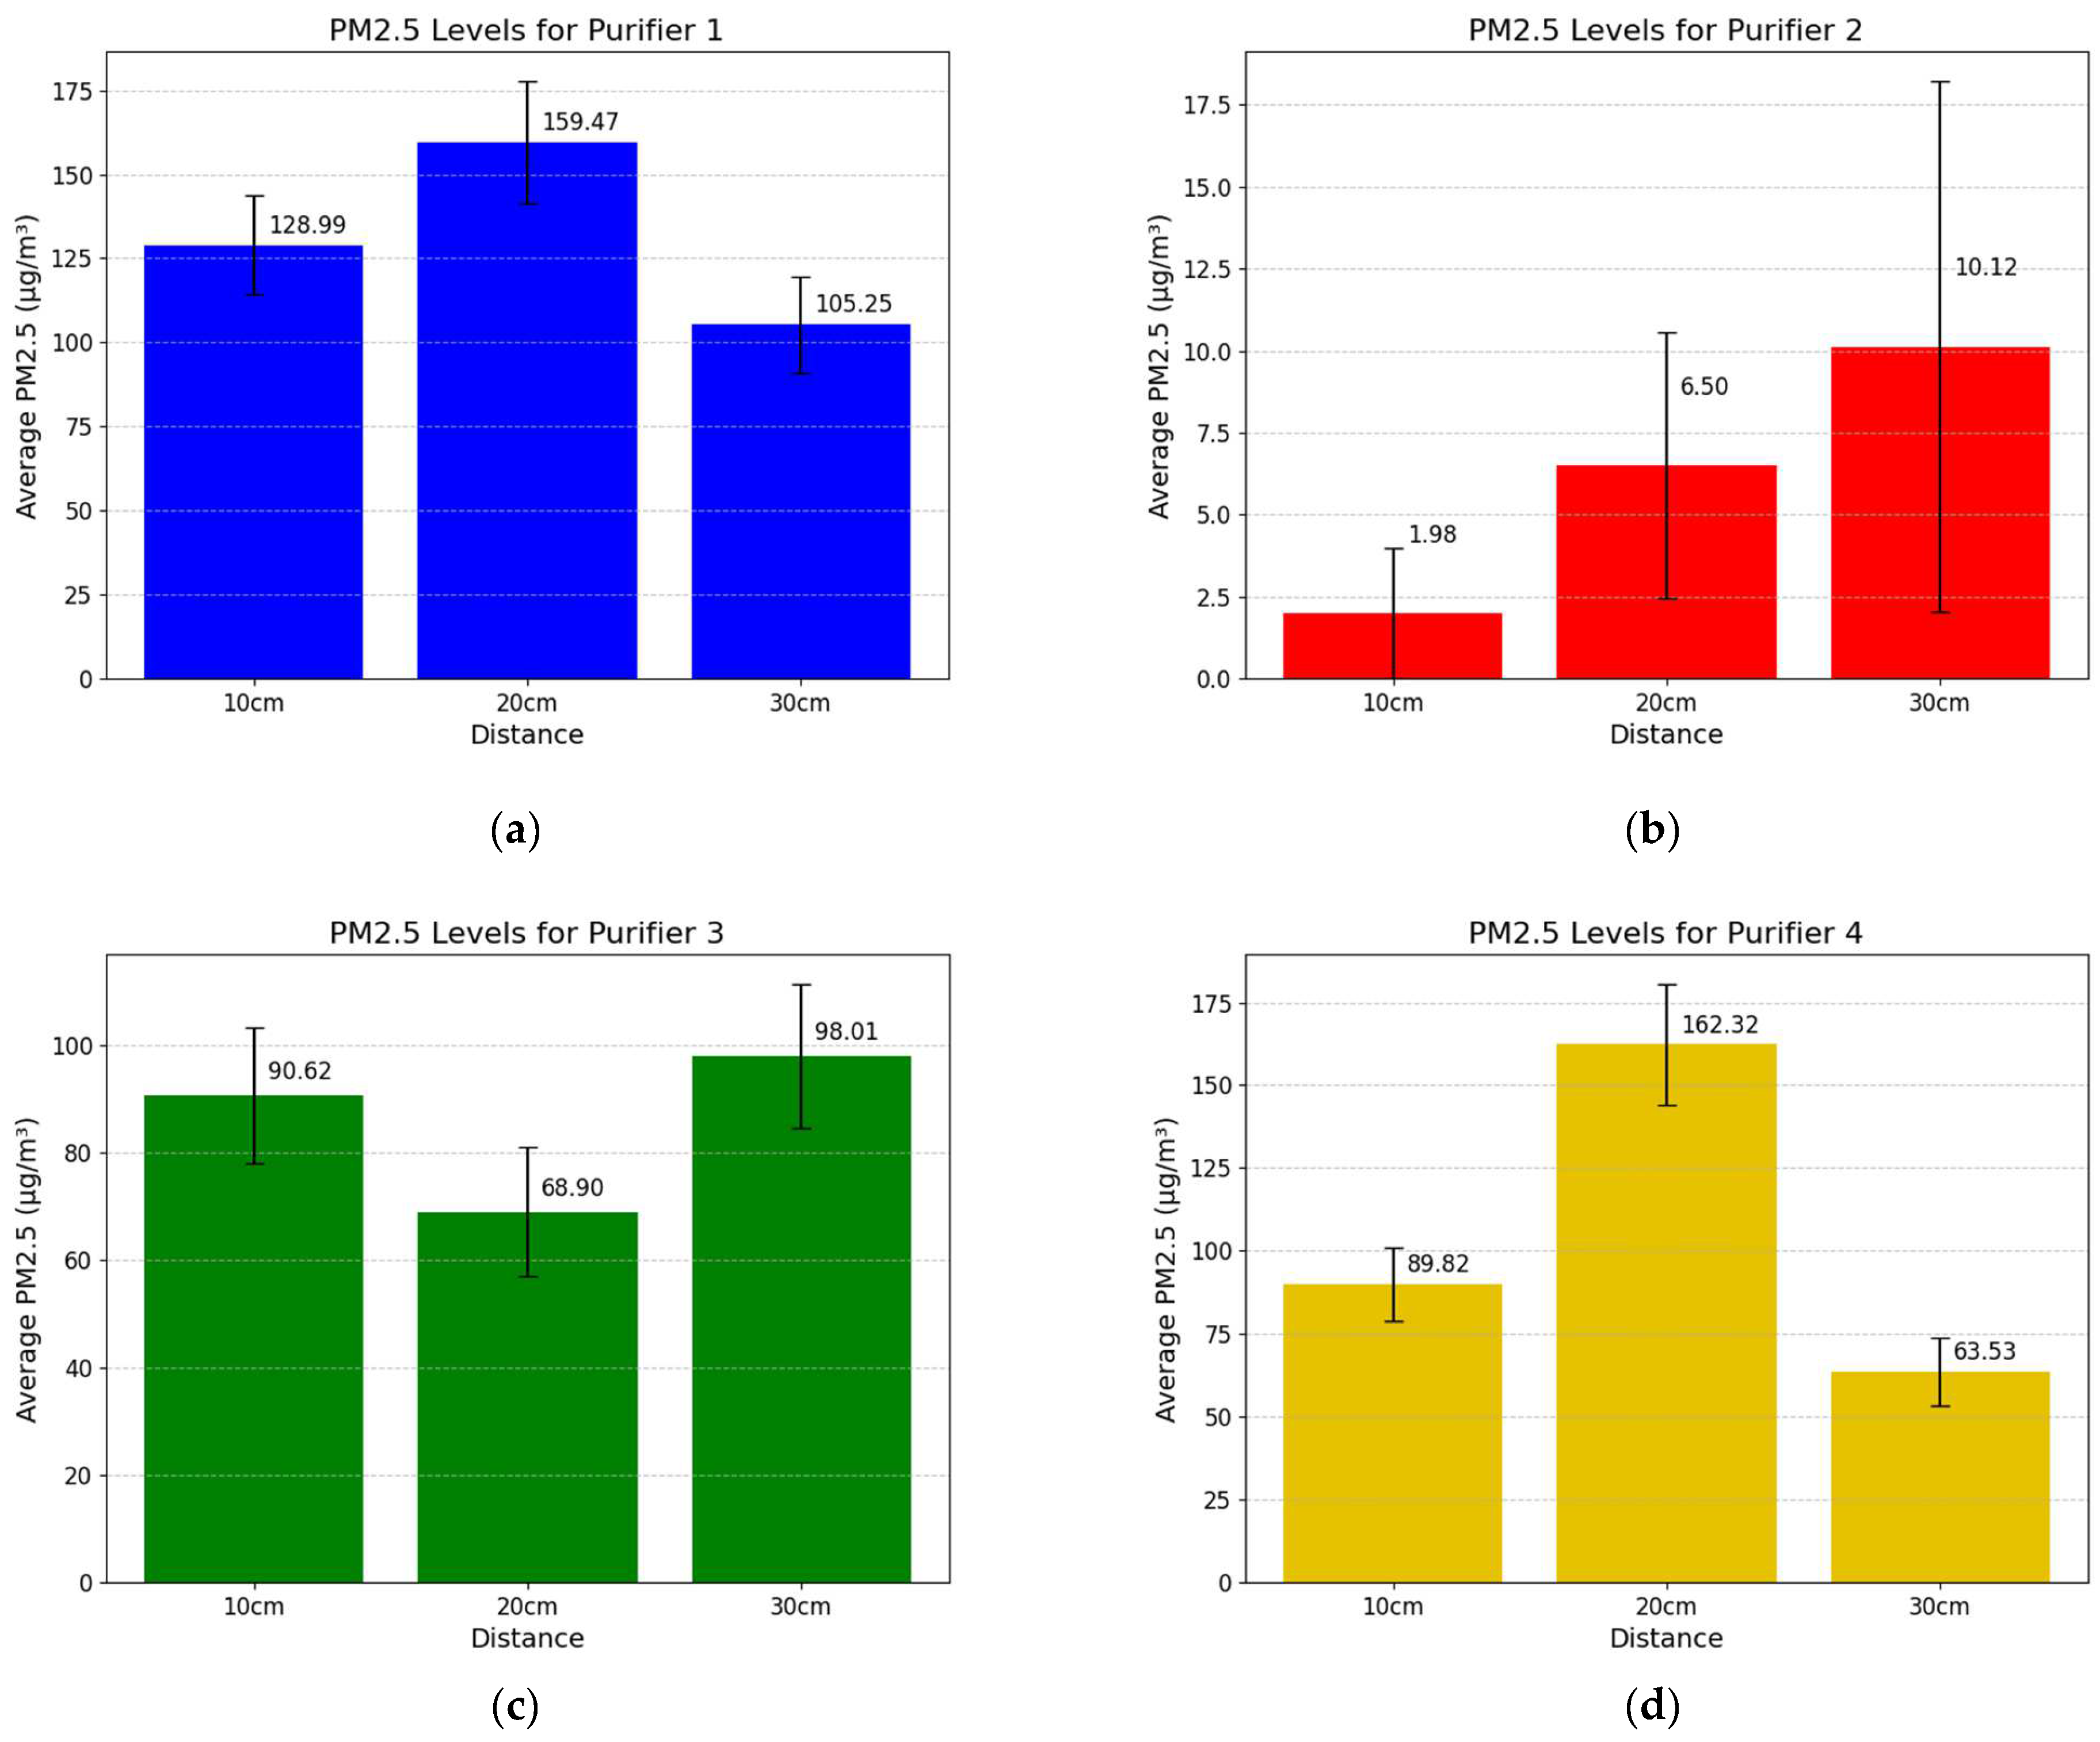
- Purifiers have an optimal distance for filtering PM2.5, as efficiency is not always linearly dependent on the distance between the inlet and the soldering station.
- The overhead air purifier demonstrated the highest efficiency in removing PM2.5 among all models tested.
2. Material and Methods
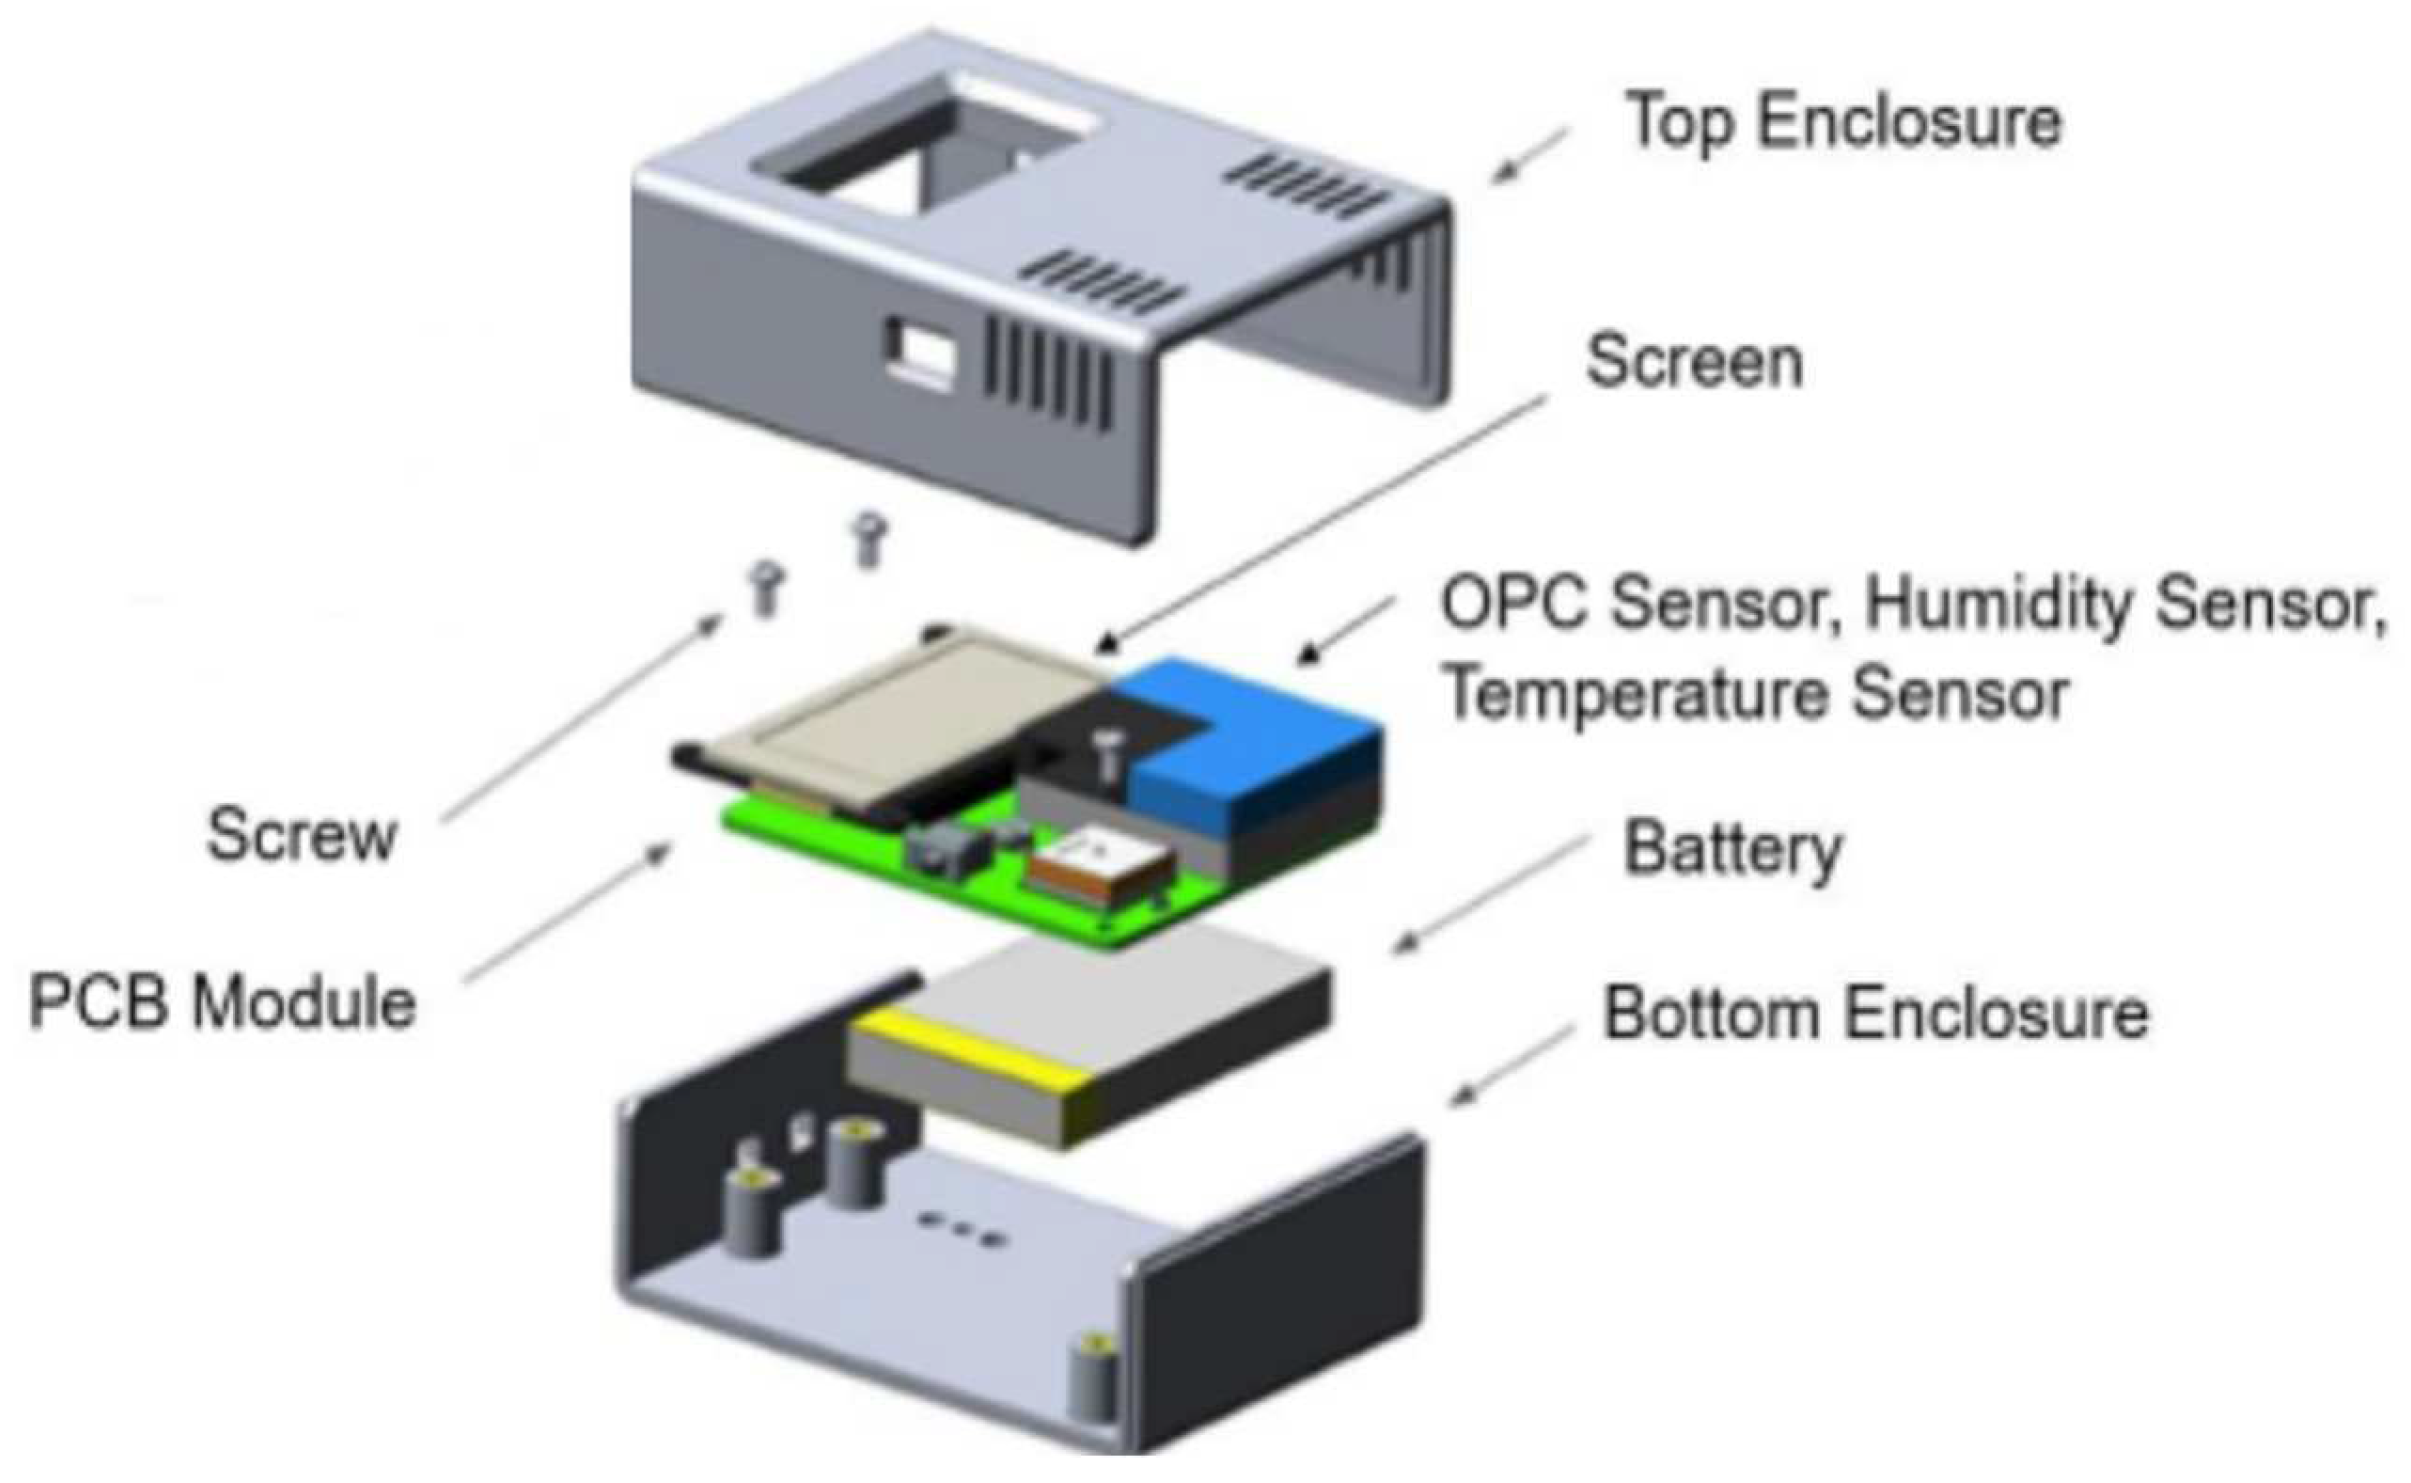
2.1. The AeroSpec Sensor System
2.2. Sensor Performance Validation
2.3. Experimental Procedure
2.3.1. Description of Study Area
2.3.2. Purifier Considerations and Sensor Arrangements
2.3.3. Particulate Matter Data Collection
2.4. Data Processing and Statistical Analysis Methodology
3. Experiment Results
3.1. PM Concentrations with No Purifier
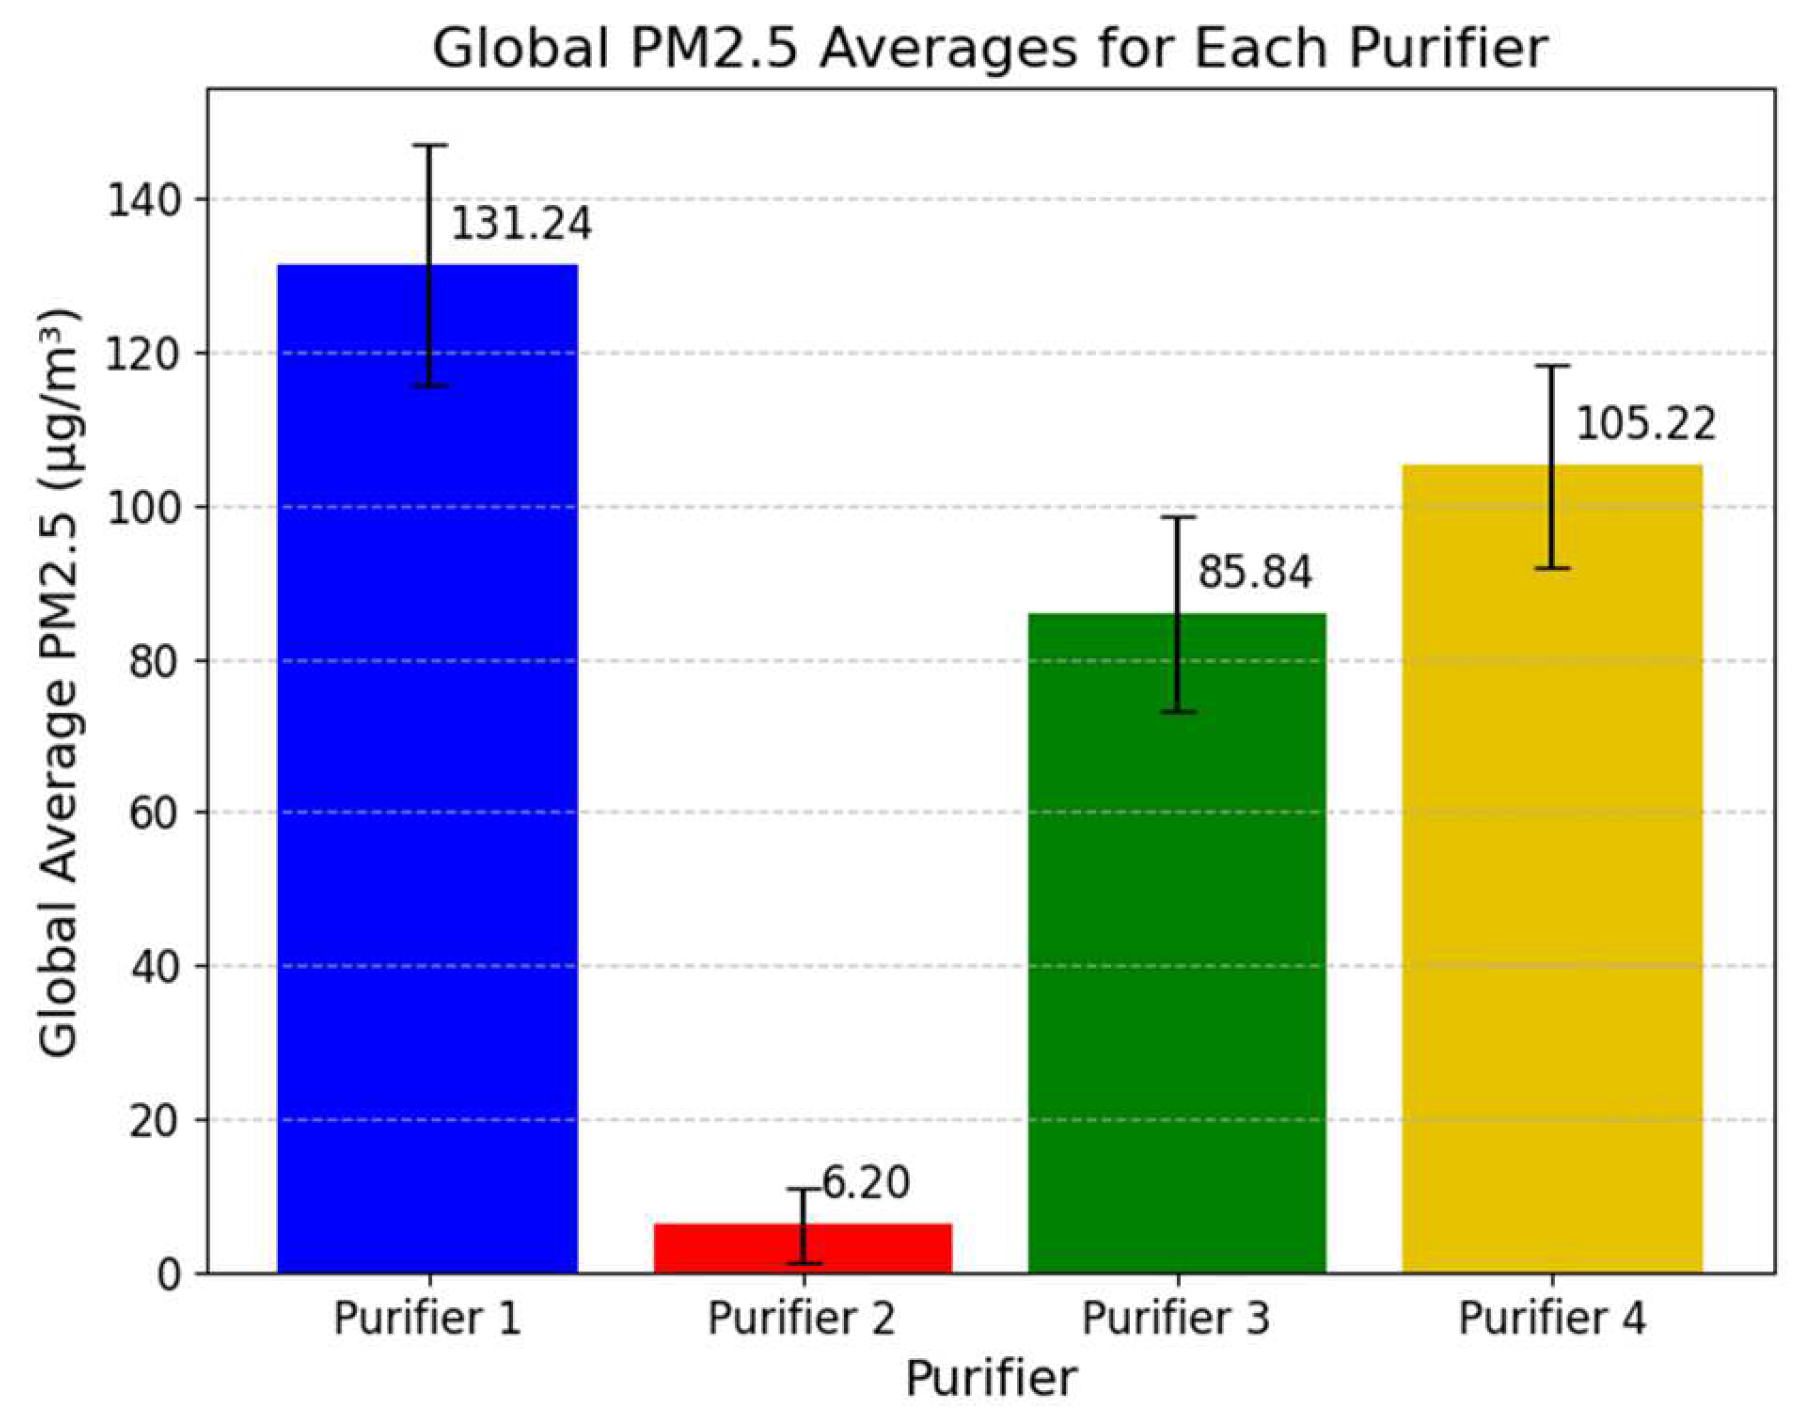
3.2. Analysis of Purifier Performance
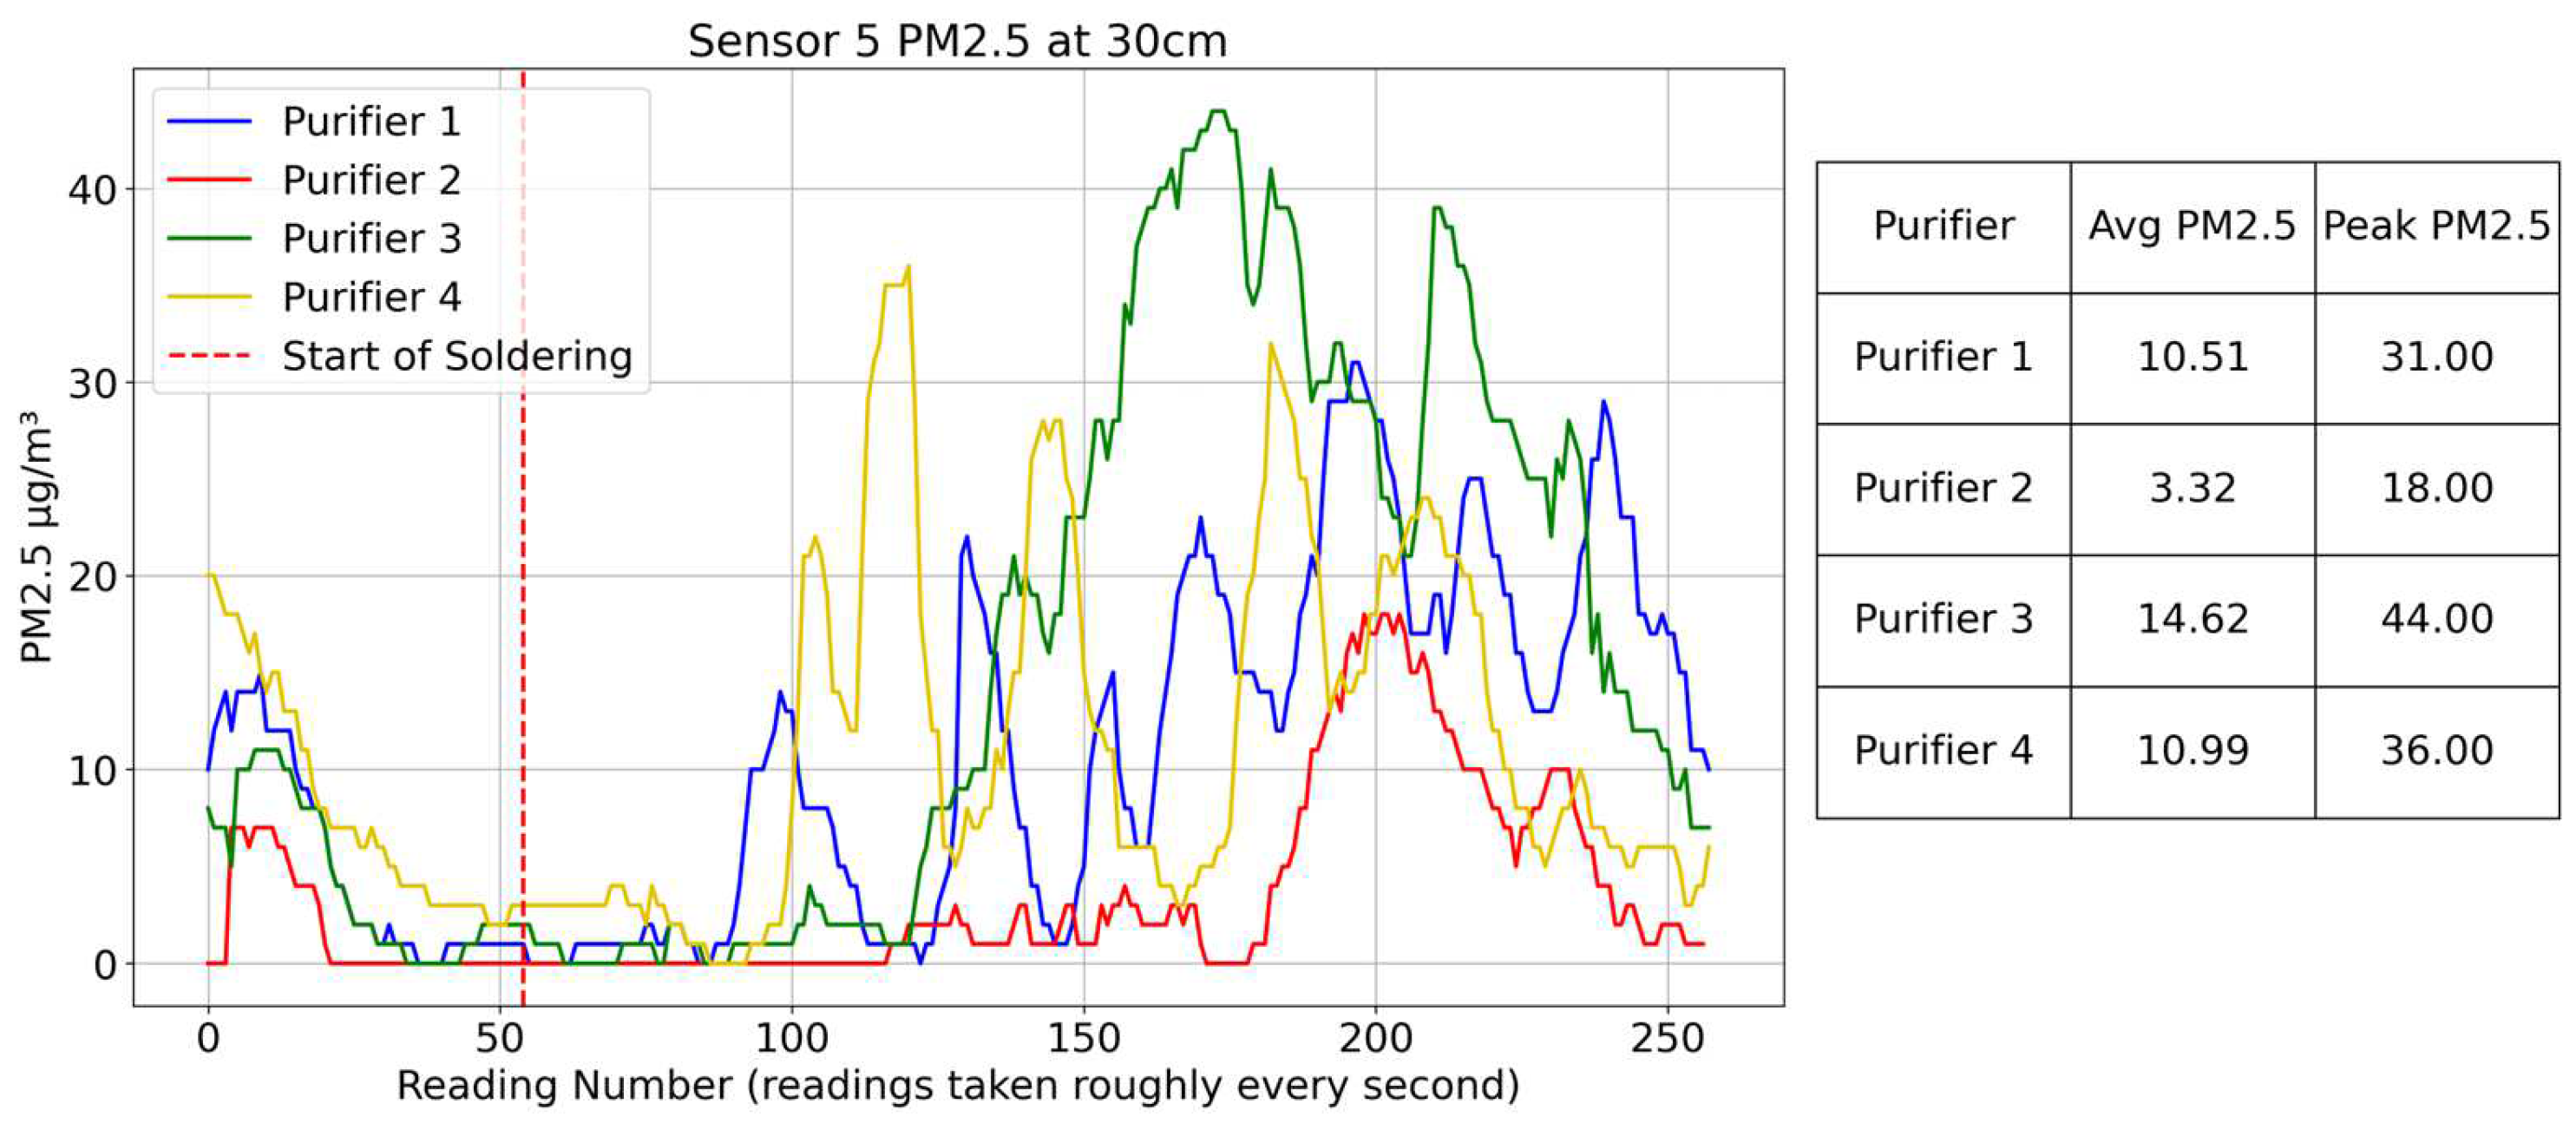
3.3. Variations in PM Concentrations by Sensor
4. Discussion
4.1. Protection Provided by All Purifiers
4.2. Statistical Differences Between Purifiers
4.3. Purifier Optimal Ranges
5. Conclusions and Recommendations
6. Limitations of the Study
7. Future Work
7.1. Sensor Network Expansion
7.2. Experimental Scope Expansion and Diversification of Soldering Scenarios
7.3. Involvement of Computational Fluid Dynamics (CFD)
7.4. Forming a Comprehensive Set of Mitigation Strategies
Author Contributions
Funding
Institutional Review Board Statement
Informed Consent Statement
Data Availability Statement
Use of Artificial Intelligence
Acknowledgments
Conflicts of Interest
References
- Laquatra, J. Indoor Air Quality in Homes. Int. J. Eng. Technol. Inform. 2023, 4, 1–3. [Google Scholar]
- Saini, J.; Dutta, M.; Marques, G. Indoor Air Quality: Impact on Public Health. In Internet of Things for Indoor Air Quality Monitoring; Springer: Cham, Switzerland, 2021. [Google Scholar]
- Shezi, B.; Mathee, A.; Cele, N. Occupational Exposure to Fine Particulate Matter (PM4 and PM2.5) during Hand-Made Cookware Operation: Personal, Indoor and Outdoor Levels. Int. J. Environ. Res. Public Health 2020, 17, 7522. [Google Scholar] [CrossRef]
- Huang, C.H.; Xiang, J.; Austin, E.; Shirai, J.; Liu, Y.; Simpson, C.; Karr, C.J.; Fyfe-Johnson, A.L.; Larsen, T.K.; Seto, E. Impacts of using auto-mode portable air cleaner on indoor PM2.5 levels: An intervention study. Build. Environ. 2021, 188, 107444. [Google Scholar] [CrossRef]
- Loupa, G.; Dabanlis, G.; Kostenidou, E.; Rapsomanikis, S. Air Quality and Energy Use in a Museum. Air 2025, 3, 5. [Google Scholar] [CrossRef]
- U.S. Environmental Protection Agency. Particulate Matter (PM) Basics. Available online: https://www.epa.gov/pm-pollution/particulate-matter-pm-basics (accessed on 4 November 2024).
- Goodman, P.; McGillicuddy, E.J.; Harrison, R.G.; Rich, D.Q.; Scott, J.A. Historical Research on Aerosol Number Concentrations, Classifications of Air Pollution Severity and Particle Retention: Lessons for Present-Day Researchers. Air 2024, 2, 439–443. [Google Scholar] [CrossRef]
- Li, X.; Liu, X. Effects of PM2.5 on Chronic Airway Diseases: A Review of Research Progress. Atmosphere 2021, 12, 1068. [Google Scholar] [CrossRef]
- Shiraiwa, M.; Ueda, K.; Pozzer, A.; Lammel, G.; Kampf, C.J.; Fushimi, A.; Enami, S.; Arangio, A.M.; Fröhlich-Nowoisky, J.; Fujitani, Y. Aerosol health effects from molecular to global scales. Environ. Sci. Technol. 2017, 51, 13545–13567. [Google Scholar] [CrossRef]
- Canha, N.; Correia, C.; Mendez, S.; Gamelas, C.A.; Felizardo, M. Monitoring Indoor Air Quality in Classrooms Using Low-Cost Sensors: Does the Perception of Teachers Match Reality? Atmosphere 2024, 15, 1450. [Google Scholar] [CrossRef]
- Khadim, H.J.; Obaed, F.K.; Abd Ali, Z.T. Application of MQ-Sensors to Indoor Air Quality Monitoring in Lab based on IoT. In Proceedings of the International Conference on Intelligent Technology, System and Service for Internet of Everything (ITSS-IoE), Sana’a, Yemen, 1–2 November 2021; pp. 1–5. [Google Scholar]
- Grineski, S.E.; Clark-Reyna, S.E.; Collins, T.W. School-based exposure to hazardous air pollutants and grade point average: A multi-level study. Environ. Res. 2016, 147, 164–171. [Google Scholar] [CrossRef]
- Bai, L.; He, Z.; Li, C.; Chen, Z. Investigation of yearly indoor/outdoor PM2. 5 levels in the perspectives of health impacts and air pollution control: Case study in Changchun, in the northeast of China. Sustain. Cities Soc. 2020, 53, 101871. [Google Scholar] [CrossRef]
- Leontjevaite, K. Air Pollution Effects on Mental Health Relationships: Scoping Review on Historically Used Methodologies to Analyze Adult Populations. Air 2024, 2, 258–291. [Google Scholar] [CrossRef]
- Agency, E.P. NAAQS Table. Available online: https://www.epa.gov/criteria-air-pollutants/naaqs-table (accessed on 28 December 2024).
- Logan IV, R.B. The Byproducts of Soldering Materials and the Potential for Health Impact. UCR Honors Capstones 2021–2022; University of California: Riverside, CA, USA, 2021. [Google Scholar]
- Aizezi, N.; Ye, Y.; Chen, Z.; Liu, Y. Impact of soldering temperatures on heavy metal and dust emissions: A LIBS-based environmental pollution analysis. Spectrochim. Acta Part B At. Spectrosc. 2025, 225, 107124. [Google Scholar] [CrossRef]
- Aamir, M.; Muhammad, R.; Tolouei-Rad, M.; Giasin, K.; Silberschmidt, V.V. A review: Microstructure and properties of tin-silver-copper lead-free solder series for the applications of electronics. Solder. Surf. Mt. Technol. 2020, 32, 115–126. [Google Scholar] [CrossRef]
- Li, J.; Qian, J.; Dai, D.; Yang, X.; Lang, L.; Jiang, P.; Chen, X. Improvement of the solderability of aluminum alloy, nickel, stainless steel and copper by metallization of silver and nickel for power semiconductors. In Proceedings of the 2023 24th International Conference on Electronic Packaging Technology (ICEPT), Shihezi City, China, 8–11 August 2023; pp. 1–6. [Google Scholar]
- Cavallotti, P.; Magagnin, L.; Sirtori, V.; Zambon, F.; Semea, I. Zinc influence on copper soldering and passivation. In Proceedings of the Symposia on Electrochemical Processing in ULSI Fabrication I and Interconnect and Contact Metallization: Materials, Processes, and Reliability, San Diego, CA, USA, 4–5 May 1998; pp. 262–269. [Google Scholar]
- Reuben, A.; Caspi, A.; Belsky, D.W.; Broadbent, J.; Harrington, H.; Sugden, K.; Houts, R.M.; Ramrakha, S.; Poulton, R.; Moffitt, T.E. Association of Childhood Blood Lead Levels with Cognitive Function and Socioeconomic Status at Age 38 Years and with IQ Change and Socioeconomic Mobility Between Childhood and Adulthood. JAMA 2017, 317, 1244–1251. [Google Scholar] [CrossRef] [PubMed]
- Reuben, A. Childhood lead exposure and adult neurodegenerative disease. J. Alzheimer’s Dis. 2018, 64, 17–42. [Google Scholar] [CrossRef]
- Mohammadyan, M.; Moosazadeh, M.; Borji, A.; Khanjani, N.; Rahimi Moghadam, S. Exposure to lead and its effect on sleep quality and digestive problems in soldering workers. Environ. Monit. Assess. 2019, 191, 184–189. [Google Scholar] [CrossRef]
- Harvard Campus Services Environmental Health & Safety. Soldering Safety Guideline; Harvard University: Cambridge, MA, USA, 2019; p. 2. [Google Scholar]
- Pasquet, R.; Siemiatycki, J.; Richardson, L.; Cardis, E.; Koushik, A. P-333 Using CANJEM to examine the association between occupational exposure to selected metals, metalloids, and welding fumes and brain cancer in the INTEROCC pooled international case-control study. Occup. Environ. Med. 2021, 78, A101. [Google Scholar] [CrossRef]
- Romeu-Moreno, A.; Aguilar, C.; Ll, A.; Mas, A. Respiratory Toxicity of Copper. Environ. Health Perspect. 1994, 102, 339–340. [Google Scholar] [CrossRef]
- Health and Safety Executive. Electronics (Soldering). Available online: https://www.hse.gov.uk/lung-disease/electronics-soldering.htm (accessed on 14 January 2025).
- American Society for Engineering Education by the Numbers. Engineering & Engineering Technology; American Society for Engineering Education: Washington, DC, USA, 2023. [Google Scholar]
- Bodrova, E.V.; Golovanova, N.B.; Kudzh, S.A.; Tsvetkov, V.Y. Developing pre-vocational profile training in the system of continuous engineering and technological education. J. Phys. Conf. Ser. 2020, 1691, 12023. [Google Scholar] [CrossRef]
- Venkittarayan, C.; Jayaprakash; Gopal, V.M.; Kartikkumar, R.; Nitin, B.S.; Madan, N.; Rajamani, K.; Achyutan, K.; Bijlani, B. Virtual soldering environment using touch and gesture for engineering labs education. In Proceedings of the 2010 IEEE Students Technology Symposium (TechSym), Kharagpur, India, 3–4 April 2010; pp. 206–210. [Google Scholar]
- Shepard, T.; Carlin, B.W. A First-Year Soldering and Analog Music to Light Modulator Electronics Lab Project. In Proceedings of the 2014 ASEE Annual Conference & Exposition, Indianapolis, IN, USA, 15–18 June 2014; p. 24.48.21. [Google Scholar]
- Millard, J.; Sorivelle, M.N.; Deljanin, S.; Unterfrauner, E.; Voigt, C. Is the Maker Movement Contributing to Sustainability? Sustainability 2018, 10, 2212. [Google Scholar] [CrossRef]
- Mohd Hannas, H.; Noor Anilizawatima, S.; Abang Annuar, E.; Khairul Nisha Mohd, K. Indoor Environmental Quality in Micro & Nanoelectronics Laboratories at IMEN, Research Complex, UKM. J. Adv. Res. Appl. Sci. Eng. Technol. 2023, 32, 342–354. [Google Scholar] [CrossRef]
- Holder, J.; Jordan, J.; Johnson, K.; Akinremi, A.; Roberts-Semple, D. Using Low-Cost Sensing Technology to Assess Ambient and Indoor Fine Particulate Matter Concentrations in New York during the COVID-19 Lockdown. Air 2023, 1, 196–206. [Google Scholar] [CrossRef]
- Szczotko, M.; Orych, I.; Mąka, Ł.; Solecka, J. A Review of Selected Types of Indoor Air Purifiers in Terms of Microbial Air Contamination Reduction. Atmosphere 2022, 13, 800. [Google Scholar] [CrossRef]
- Huang, C.-H.; He, J.; Austin, E.; Seto, E.; Novosselov, I. Assessing the value of complex refractive index and particle density for calibration of low-cost particle matter sensor for size-resolved particle count and PM2.5 measurements. PLoS ONE 2021, 16, e0259745. [Google Scholar] [CrossRef]
- Makhsous, S.; Segovia, J.M.; He, J.; Chan, D.; Lee, L.; Novosselov, I.V.; Mamishev, A.V. Methodology for Addressing Infectious Aerosol Persistence in Real-Time Using Sensor Network. Sensors 2021, 21, 3928. [Google Scholar] [CrossRef] [PubMed]
- Yoshida, E. Mitigation of Aerosol Particles During Composite Attachment Removal. Master’s Thesis, University of Washington, Washington, DC, USA, 2023. [Google Scholar]
- MathWorks. ThingSpeak IoT Analytics Platform. Available online: https://www.mathworks.com/products/thingspeak.html (accessed on 13 March 2025).
- Zhao, Z. Product Specification PMSA003-A; Plantower: Beijing, China, 2019. [Google Scholar]
- Alberto, B. Evaluation of a low-cost multi-channel monitor for indoor air quality through a novel, low-cost, and reproducible platform. Meas. Sens. 2021, 17, 100059. [Google Scholar] [CrossRef]
- Acker, S.J.; Holloway, T.; Harkey, M.K. Satellite Detection of NO2 Distributions and Comparison with Ground-Based Concentrations. EGUsphere 2025, 2025, 14–17. [Google Scholar] [CrossRef]
- Chacón-Mateos, M.; García-Salamero, H.; Laquai, B.; Vogt, U. Performance evaluation of air quality sensors for environmental epidemiology. EGUsphere 2025, 2025, 1–34. [Google Scholar] [CrossRef]
- John Volckens and Thomas, M.P. Counting and particle transmission efficiency of the aerodynamic particle sizer. J. Aerosol Sci. 2005, 36, 1400–1408. [Google Scholar] [CrossRef]
- Kelleher, S.; Quinn, C.; Miller-Lionberg, D.; Volckens, J. A low-cost particulate matter (PM2.5) monitor for wildland fire smoke. Atmos. Meas. Tech. 2018, 11, 1087–1097. [Google Scholar] [CrossRef]
- Nielsen, F. On the Jensen–Shannon Symmetrization of Distances Relying on Abstract Means. Entropy 2019, 21, 485. [Google Scholar] [CrossRef] [PubMed]
- Schober, P.; Boer, C.; Schwarte, L.A. Correlation coefficients: Appropriate use and interpretation. Anesth. Analg. 2018, 126, 1763–1768. [Google Scholar] [CrossRef] [PubMed]
- Corander, J.; Remes, U.; Koski, T. On the Jensen-Shannon divergence and the variation distance for categorical probability distributions. Kybernetika 2021, 57, 879–907. [Google Scholar] [CrossRef]
- Zusman, M.; Schumacher, C.S.; Gassett, A.J.; Spalt, E.W.; Austin, E.; Larson, T.V.; Carvlin, G.; Seto, E.; Kaufman, J.D.; Sheppard, L. Calibration of low-cost particulate matter sensors: Model development for a multi-city epidemiological study. Environ. Int. 2020, 134, 105329. [Google Scholar] [CrossRef] [PubMed]
- Xie, S.; Chen, Y.; Dong, S.; Zhang, G. Risk assessment of an oil depot using the improved multi-sensor fusion approach based on the cloud model and the belief Jensen-Shannon divergence. J. Loss Prev. Process Ind. 2020, 67, 104214. [Google Scholar] [CrossRef]
- Lionis, A.; Peppas, K.P.; Nistazakis, H.E.; Tsigopoulos, A. RSSI Probability Density Functions Comparison Using Jensen-Shannon Divergence and Pearson Distribution. Technologies 2021, 9, 26. [Google Scholar] [CrossRef]
- X-tronic. X-Tronic—Model 3060-PRO. Available online: https://xtronicusa.com/X-Tronic-Model-3060-PRO-Double-DigitalLED-Soldering-Station-Complete-Kit-with-5-Extra-Sizes-Styles-of-Soldering-Tips-Plus-some-Nice-Added-Accessories-p223043572 (accessed on 1 March 2025).
- De Vinck, M. Getting Started with Soldering: A Hands-On Guide to Making Electrical and Mechanical Connections; Maker Media: Sebastopol, CA, USA, 2017. [Google Scholar]
- Judd, M.; Brindley, K. Soldering in Electronics Assembly; Newnes: Oxford, UK, 1999. [Google Scholar]
- United States Environmental Protection Agency. A Citizen’s Guide to Activated Carbon Treatment; United States Environmental Protection Agency: Washington, DC, USA, 2012. [Google Scholar]
- United States Environmental Protection Agency. What Is a HEPA Filter? Available online: https://www.epa.gov/indoor-air-quality-iaq/what-hepa-filter (accessed on 4 March 2025).
- Yang, S.; Zhu, Z.; Wei, F.; Yang, X. Carbon nanotubes/activated carbon fiber based air filter media for simultaneous removal of particulate matter and ozone. Build. Environ. 2017, 125, 60–66. [Google Scholar] [CrossRef]
- Kim, M.-K.; Jang, Y.; Park, D. Determination of the Optimum Removal Efficiency of Fine Particulate Matter Using Activated Carbon Fiber (ACF). Int. J. Environ. Res. Public Health 2020, 17, 8230. [Google Scholar] [CrossRef]
- VEVOR. VEVOR Air Purifier Model: XF190U/XF180/XF190A/XF250U/XF250/XF250A User Manual; VEVOR: Shanghai, China, 2025; Available online: https://eur.vevor.com (accessed on 4 March 2025).
- VALTCAN. VALTCAN VALT921 Solder Smoke Fan Fume Extractor Absorber Remover Portable. Available online: https://www.valtcan.com/products/valtcan-solder-smoke-fan-fume-extractor (accessed on 4 March 2025).
- Valtcan Solder Fume Extractor Smoke Absorber Remover VALT921 Bench Top Tiltable Wide Fan Hood Workstation. Available online: https://www.amazon.ca/VALTCAN-Absorber-Extractor-Remover-Portable/dp/B07HPZ3FF6 (accessed on 4 March 2025).
- SUNON. SUNON 120x120x38 mm Fan Spec Sheet; 2025 SUNON: La Verne, CA, USA, 2025; Available online: https://sunonusa.com (accessed on 4 March 2025).
- Fonsoning. FAA-12038 Series Datasheet; Fonsoning: Shenzhen, China, 2017; Available online: https://fonsoning.com (accessed on 31 March 2025).
- AOYUE. 486 Fume Extractor and Smoke Absorber Fan Technical Datasheet; AOYUE International Limited: Zhongshan City, China. Available online: https://www.aoyue3d.com/ (accessed on 4 March 2025).
- Pheasant, S.; Haslegrave, C.M. Bodyspace: Anthropometry, Ergonomics and the Design of Work, 3rd ed.; CRC Press: Boca Raton, FL, USA, 2006. [Google Scholar]
- Stetefeld, J.; McKenna, S.A.; Patel, T.R. Dynamic light scattering: A practical guide and applications in biomedical sciences. Biophys. Rev. 2016, 8, 409–427. [Google Scholar] [CrossRef]
- Okinternational. Hand Soldering Basics; Okinternational: Cypress, CA, USA, 2007. [Google Scholar]
- World Health Organization. WHO Global Air Quality Guidelines: Particulate Matter (PM2. 5 and PM10), Ozone, Nitrogen Dioxide, Sulfur Dioxide and Carbon Monoxide; World Health Organization: Geneva, Switzerland, 2021. [Google Scholar]
- Wallace, L.; Zhao, T. Spatial Variation of PM2.5 Indoors and Outdoors: Results from 261 Regulatory Monitors Compared to 14,000 Low-Cost Monitors in Three Western States over 4.7 Years. Sensors 2023, 23, 4387. [Google Scholar] [CrossRef]
- Ma, Z.; Meng, X.; Chen, C.; Chao, B.; Zhang, C.; Li, W. Short-term effects of different PM2.5 ranges on daily all-cause mortality in Jinan, China. Sci. Rep. 2022, 12, 5665. [Google Scholar] [CrossRef] [PubMed]
- Liu, R.A.; Wei, Y.; Qiu, X.; Kosheleva, A.; Schwartz, J.D. Short term exposure to air pollution and mortality in the US: A double negative control analysis. Environ. Health 2022, 21, 81. [Google Scholar] [CrossRef] [PubMed]
- Austina, E.; Carmonaa, N.; Gouldb, T.; Shiraia, J.H.; Cummings, B.J.; Haywarda, L.; Larsona, T.; Seto, E. Healthy Air, Healthy Schools Study: Phase 1 Report; University of Washington: Washington, DC, USA, 2021. [Google Scholar]
- Yun, S.; Licina, D. Optimal sensor placement for personal inhalation exposure detection in static and dynamic office environments. Build. Environ. 2023, 241, 110459. [Google Scholar] [CrossRef]
- Taylor, S. Monitoring IAQ And Occupant Health. ASHRAE J. 2021, 63, 40–42. [Google Scholar]
- Adetona, A.M.; Adetona, O.; Chartier, R.T.; Paulsen, M.H.; Simpson, C.D.; Rathbun, S.L.; Naeher, L.P. Differences in Fine Particle Exposure and Estimated Pulmonary Ventilation Rate with Respect to Work Tasks of Wildland Firefighters at Prescribed Burns: A Repeated Measures Study. Ann. Work Expo. Health 2022, 66, 985–997. [Google Scholar] [CrossRef] [PubMed]
- Barbot, N.; Nikitin, P. Simple Open-Source UHF RFID Tag Platform. In Proceedings of the 2023 IEEE International Conference on RFID (RFID), Seattle, WA, USA, 13–15 June 2023; pp. 78–83. [Google Scholar]


| Particulate Diameter (µm) | Concentration Range (µg/m3) | Measurement Error |
|---|---|---|
| <1.0 (PM1.0) | 0–100 | ±15 µg/m3 |
| <1.0 (PM1.0) | 100–500 | ±15% |
| <2.5 (PM2.5) | 0–100 | ±10 µg/m3 |
| <2.5 (PM2.5) | 100–500 | ±10% |
| <10 (PM10) | 0–100 | ±25 µg/m3 |
| <10 (PM10) | 100–500 | ±25% |
| Sensor Number | Pearson Correlation Coefficient with the APS3321 | Spearman Correlation Coefficient with the APS3321 | Jensen–Shannon Divergence with the APS3321 |
|---|---|---|---|
| 1 | 0.96 | 0.94 | 0.0671 |
| 2 | 0.94 | 0.91 | 0.0743 |
| 3 | 0.97 | 0.91 | 0.0568 |
| 4 | 0.98 | 0.96 | 0.0522 |
| 5 | 0.98 | 0.97 | 0.0469 |
| 6 | 0.95 | 0.93 | 0.0885 |
| Purifier Number | Name | Maximum Airflow | Filter Type | Cost (USD) | Purifier Type | Dimensions (cm) |
|---|---|---|---|---|---|---|
| Purifier 1 | AOYUE 486 Fume Extractor | 115 ft3/min | Activated carbon | $36 | Desktop | 19.05 × 16.51 × 8.89 |
| Purifier 2 | Vevor Solder Fume Extractor XF250 | 147.1 ft3/min | HEPA | $293 | Overhead | 28 × 28 × 162.92 |
| Purifier 3 | Fonsoning FSY12038HA1 | 100 ft3/min | Activated carbon | $23.85 | Desktop | 12 × 12 × 3.8 |
| Purifier 4 | Valtcan VALT921 | Not specified | Activated carbon | $65 | Desktop | 27.94 × 24.13 × 16.51 |
| Sensor Number | Location |
|---|---|
| 1 | Hung around the neck of the person soldering (~20 cm below the nose) |
| 2 | Placed as close as possible to the tip of the soldering iron where fumes emanate from |
| 3 | Placed at the mouth of whatever fume extractor is being used; note that the example picture and drawing happen to show the large fume extractor |
| 4 | Placed halfway along an imaginary line connecting the nose of the person to the tip of the soldering iron when it is in use |
| 5 | Placed directly above the head of the person soldering, at a height of 127.75 cm |
| 6 | Placed 30.48 cm to the right of the soldering iron |
| Group Number | Sub-Trial Number | Purifier Used | Distance from Purifier |
|---|---|---|---|
| 1 | 1 | Purifier 1 | 10 cm |
| 1 | 2 | Purifier 1 | 20 cm |
| 1 | 3 | Purifier 1 | 30 cm |
| 2 | 4 | Purifier 2 | 10 cm |
| 2 | 5 | Purifier 2 | 20 cm |
| 2 | 6 | Purifier 2 | 30 cm |
| 3 | 7 | Purifier 3 | 10 cm |
| 3 | 8 | Purifier 3 | 20 cm |
| 3 | 9 | Purifier 3 | 30 cm |
| 4 | 10 | Purifier 4 | 10 cm |
| 4 | 11 | Purifier 4 | 20 cm |
| 4 | 12 | Purifier 4 | 30 cm |
| 5 | 13 | No Purifier | 10 cm |
| 5 | 14 | No Purifier | 20 cm |
| 5 | 15 | No Purifier | 30 cm |
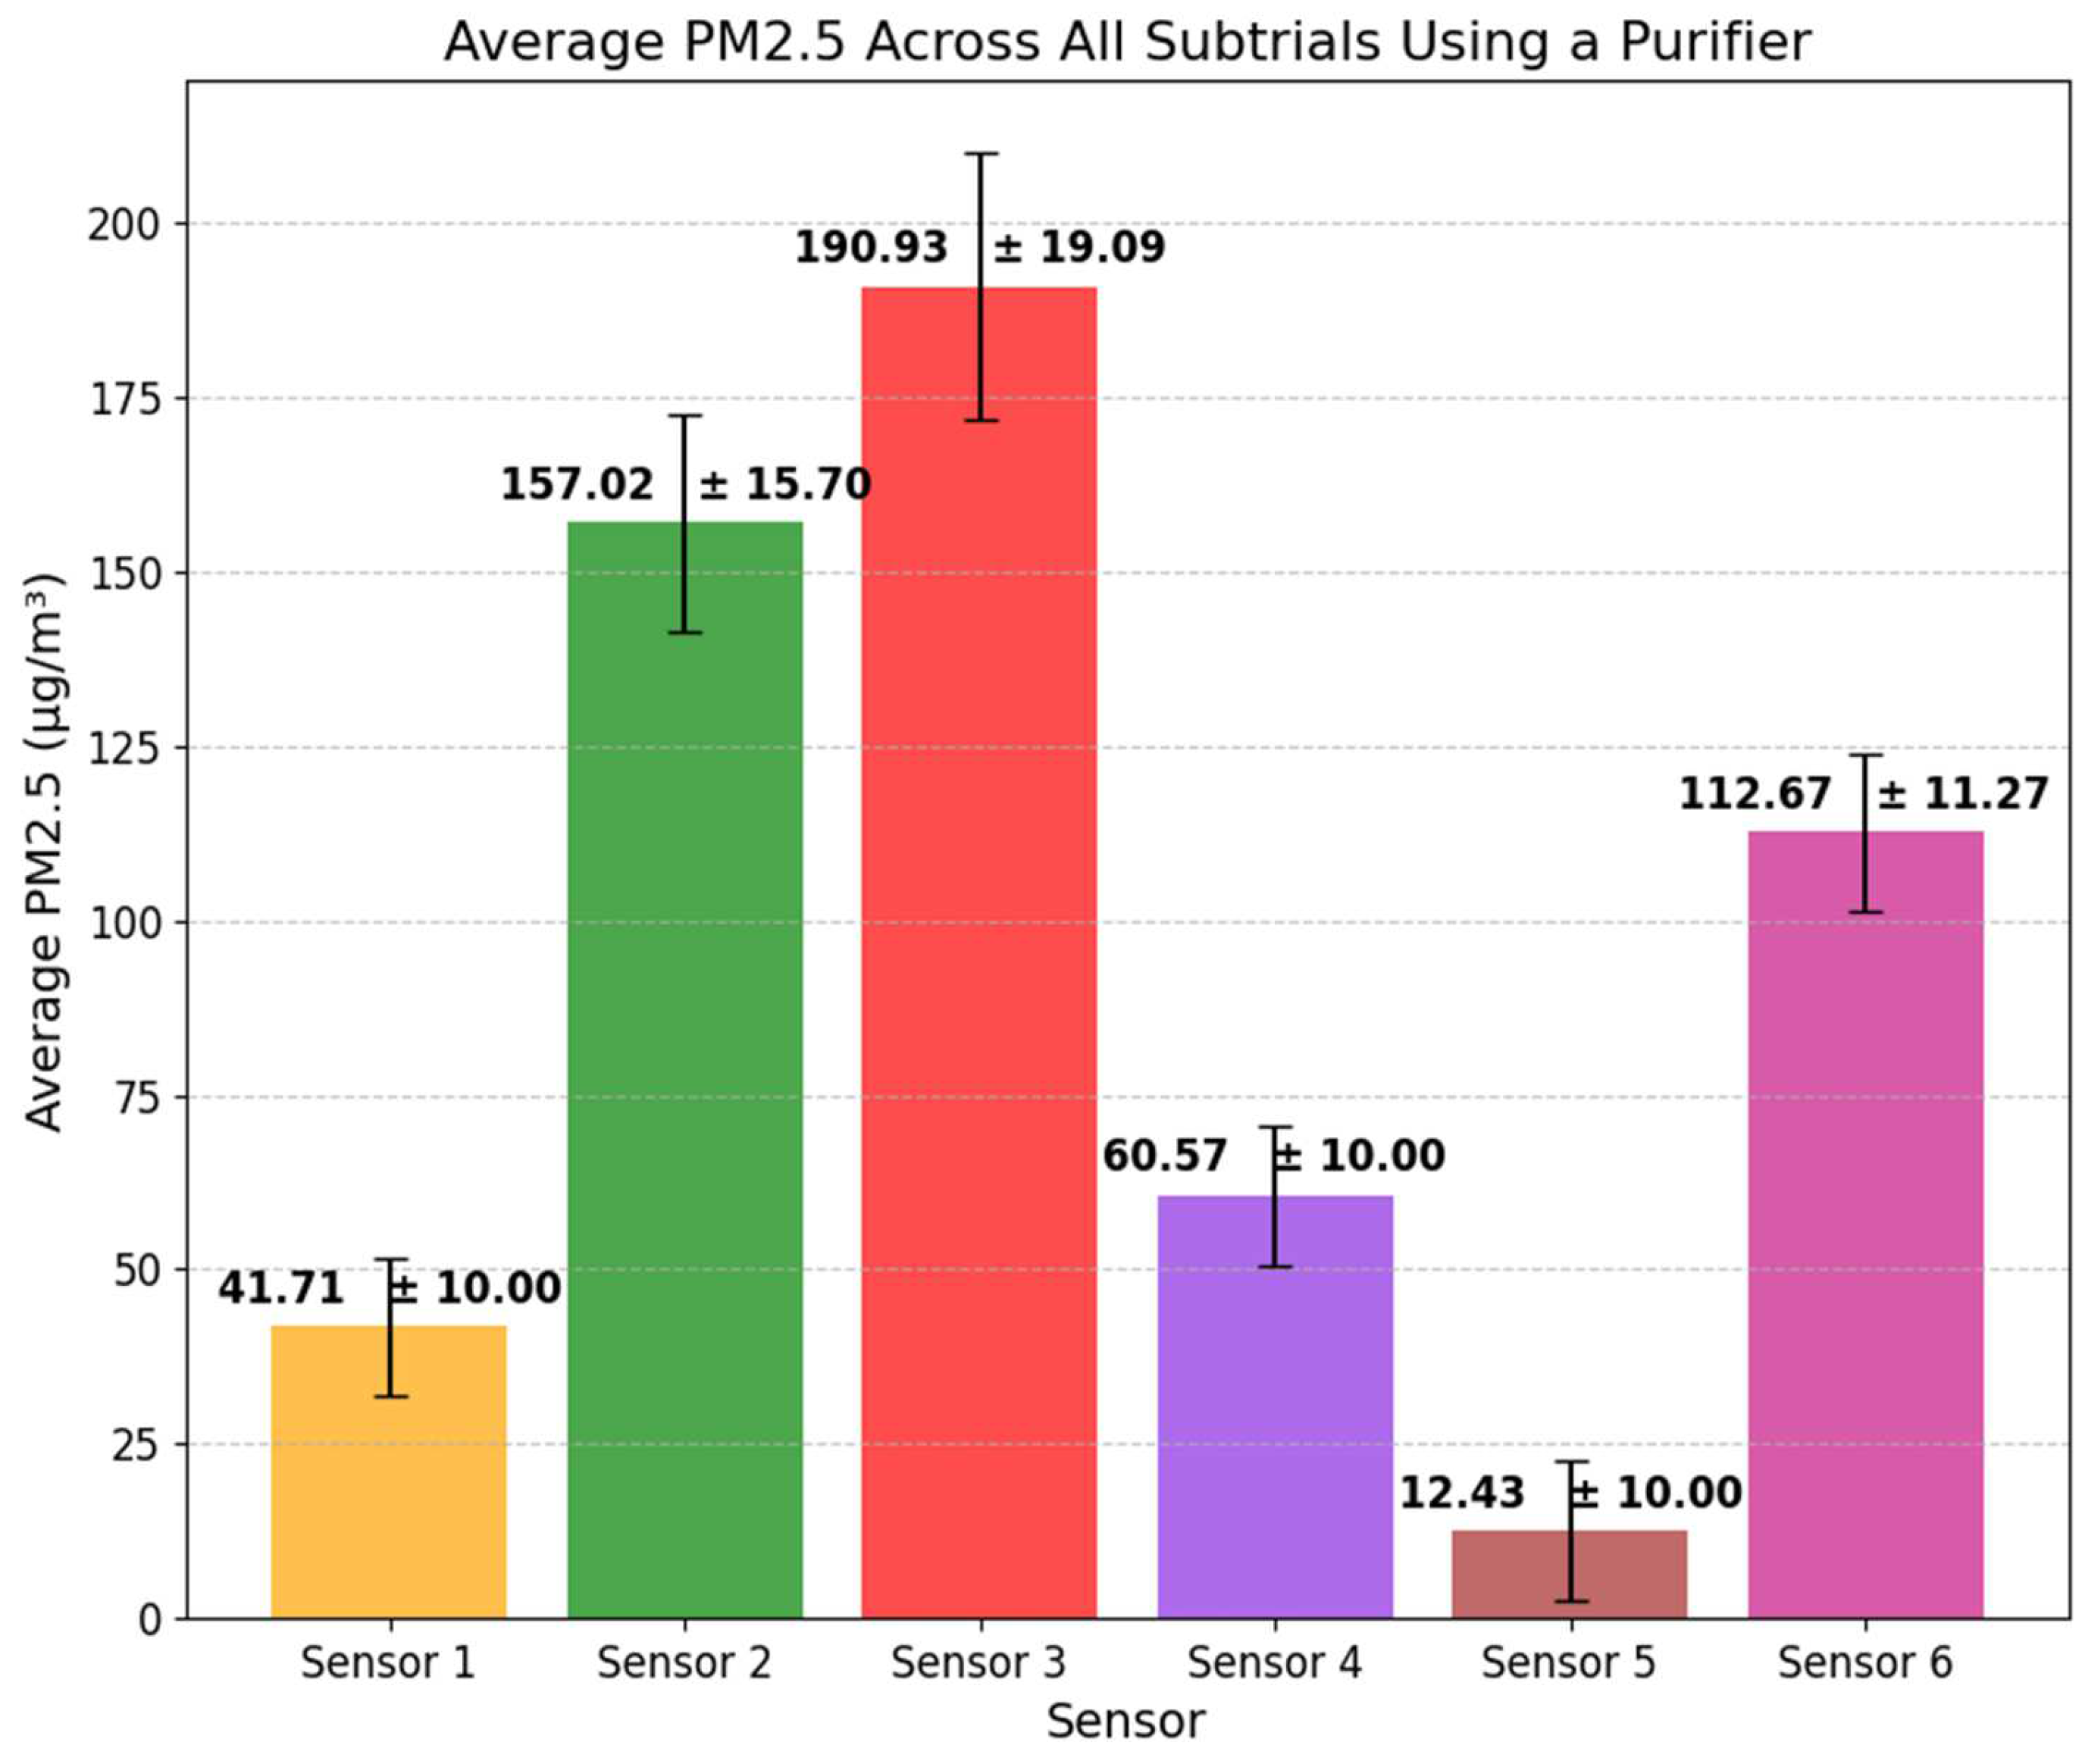
| Sensor Number | Average PM2.5 Reading with Purifier (µg/m3) | Average PM2.5 Reading without Purifier (µg/m3) |
|---|---|---|
| 1 | 41.71 | 252.06 |
| 2 * | 157.02 | 47.86 |
| 3 * | 190.93 | --- * |
| 4 | 60.57 | 40.961 |
| 5 | 12.43 | 32.36 |
| 6 * | 112.67 | 39.48 |
| Sensor Number | Without Purifier >100 µg/m3 | Without Purifier ≤100 µg/m3 | With Purifier >100 µg/m3 | With Purifier ≤100 µg/m3 |
|---|---|---|---|---|
| 1 | 38.45% | 61.55% | 12.19% | 87.81% |
| 2 | 30.35% | 69.65% | 35.71% | 64.29% |
| 3 | --- * | --- * | 38.00% | 62.00% |
| 4 | 15.49% | 84.51% | 18.28% | 81.72% |
| 5 | 0.62% | 99.38% | 0.44% | 99.56% |
| 6 | 25.61% | 74.39% | 30.97% | 69.03% |
| Comparison | t-Statistic | p-Value | Adjusted p-Value | Significant |
|---|---|---|---|---|
| Purifier 1 vs. Purifier 2 | 41.5 | 0 * | 0 * | True |
| Purifier 1 vs. Purifier 3 | 12.3 | True | ||
| Purifier 1 vs. Purifier 4 | 10.1 | True | ||
| Purifier 2 vs. Purifier 3 | −39.5 | 0 * | 0 * | True |
| Purifier 2 vs. Purifier 4 | −41.0 | 0 * | 0 * | True |
| Purifier 3 vs. Purifier 4 | −2.49 | False |
Disclaimer/Publisher’s Note: The statements, opinions and data contained in all publications are solely those of the individual author(s) and contributor(s) and not of MDPI and/or the editor(s). MDPI and/or the editor(s) disclaim responsibility for any injury to people or property resulting from any ideas, methods, instructions or products referred to in the content. |
© 2025 by the authors. Licensee MDPI, Basel, Switzerland. This article is an open access article distributed under the terms and conditions of the Creative Commons Attribution (CC BY) license (https://creativecommons.org/licenses/by/4.0/).
Share and Cite
Kinsella, I.M.; Petrbokova, A.N.; Yang, R.; Liu, Z.; Nathan, G.; Thompson, N.; Mamishev, A.V.; Makhsous, S. Quantitative Assessment of Soldering-Induced PM2.5 Exposure Using a Distributed Sensor Network in Instructional Laboratory Settings. Air 2025, 3, 16. https://doi.org/10.3390/air3020016
Kinsella IM, Petrbokova AN, Yang R, Liu Z, Nathan G, Thompson N, Mamishev AV, Makhsous S. Quantitative Assessment of Soldering-Induced PM2.5 Exposure Using a Distributed Sensor Network in Instructional Laboratory Settings. Air. 2025; 3(2):16. https://doi.org/10.3390/air3020016
Chicago/Turabian StyleKinsella, Ian M., Anna N. Petrbokova, Rongjie Yang, Zheng Liu, Gokul Nathan, Nicklaus Thompson, Alexander V. Mamishev, and Sep Makhsous. 2025. "Quantitative Assessment of Soldering-Induced PM2.5 Exposure Using a Distributed Sensor Network in Instructional Laboratory Settings" Air 3, no. 2: 16. https://doi.org/10.3390/air3020016
APA StyleKinsella, I. M., Petrbokova, A. N., Yang, R., Liu, Z., Nathan, G., Thompson, N., Mamishev, A. V., & Makhsous, S. (2025). Quantitative Assessment of Soldering-Induced PM2.5 Exposure Using a Distributed Sensor Network in Instructional Laboratory Settings. Air, 3(2), 16. https://doi.org/10.3390/air3020016