

Verification and Usability of Indoor Air Quality Monitoring Tools in the Framework of Health-Related Studies
 , , , ,
  and
and
Abstract
1. Introduction
2. Materials and Methods
2.1. Reference Equipment
- A Testo 440 multifunctional Air Quality Meter (Testo Industrial Services GmbH, Kirchzarten, Germany) was used for CO2 measurement as the reference instrument. It is equipped with a CO2 probe (Model 0632 1552) and was employed as the reference instrument to evaluate the performance of the low-cost sensors under study. This device integrates temperature and humidity sensors, providing high accuracy and reliability for IAQ measurements. Calibration was certified by ENAC (October 2024), ensuring traceability to international metrological standards. The calibration process included testing under controlled laboratory conditions (20 ± 5 °C and <80% RH) across multiple reference points to verify its precision. The expanded uncertainty of the CO2 measurements was determined according to EA-4/02 M:2022 guidelines (European Accreditation EA, 2022 [23]), with a 95% confidence level. This robust certification guarantees the suitability of the Testo 440 as a reliable reference for verifying the accuracy and performance of other air quality monitoring devices.
- A PCE-PQC 34 Air Quality Monitor (PCE Deutschland GmbH, Meschede, Germany) was employed for PM2.5 measurement as the reference instrument to evaluate the performance of the low-cost PM sensors included in this study. This device features advanced particle counting technology, capable of measuring concentrations of particulate matter with a diameter < 10 μm (PM10), particulate matter with a diameter < 5 μm (PM5), particulate matter with a diameter < 2.5 μm (PM2.5), and particulate matter with a diameter < 1 μm (PM1), with a flow rate of 2.83 L/min and a detection range from 0.3 to 25 μm. The system utilizes a long-life laser diode as the light source, ensuring high accuracy and repeatability in particle detection. Calibration of the instrument is traceable to standards, with particle size bins pre-configured for factory calibration, enabling compliance with ISO 21501-4 [24] (December 2022). The PCE-PQC 34’s high sensitivity and built-in mass concentration mode allow for precise particle mass calculations in μg/m3, making it a reliable reference for validating the accuracy of low-cost PM sensors under real-world conditions.
2.2. Low-Cost Sensors
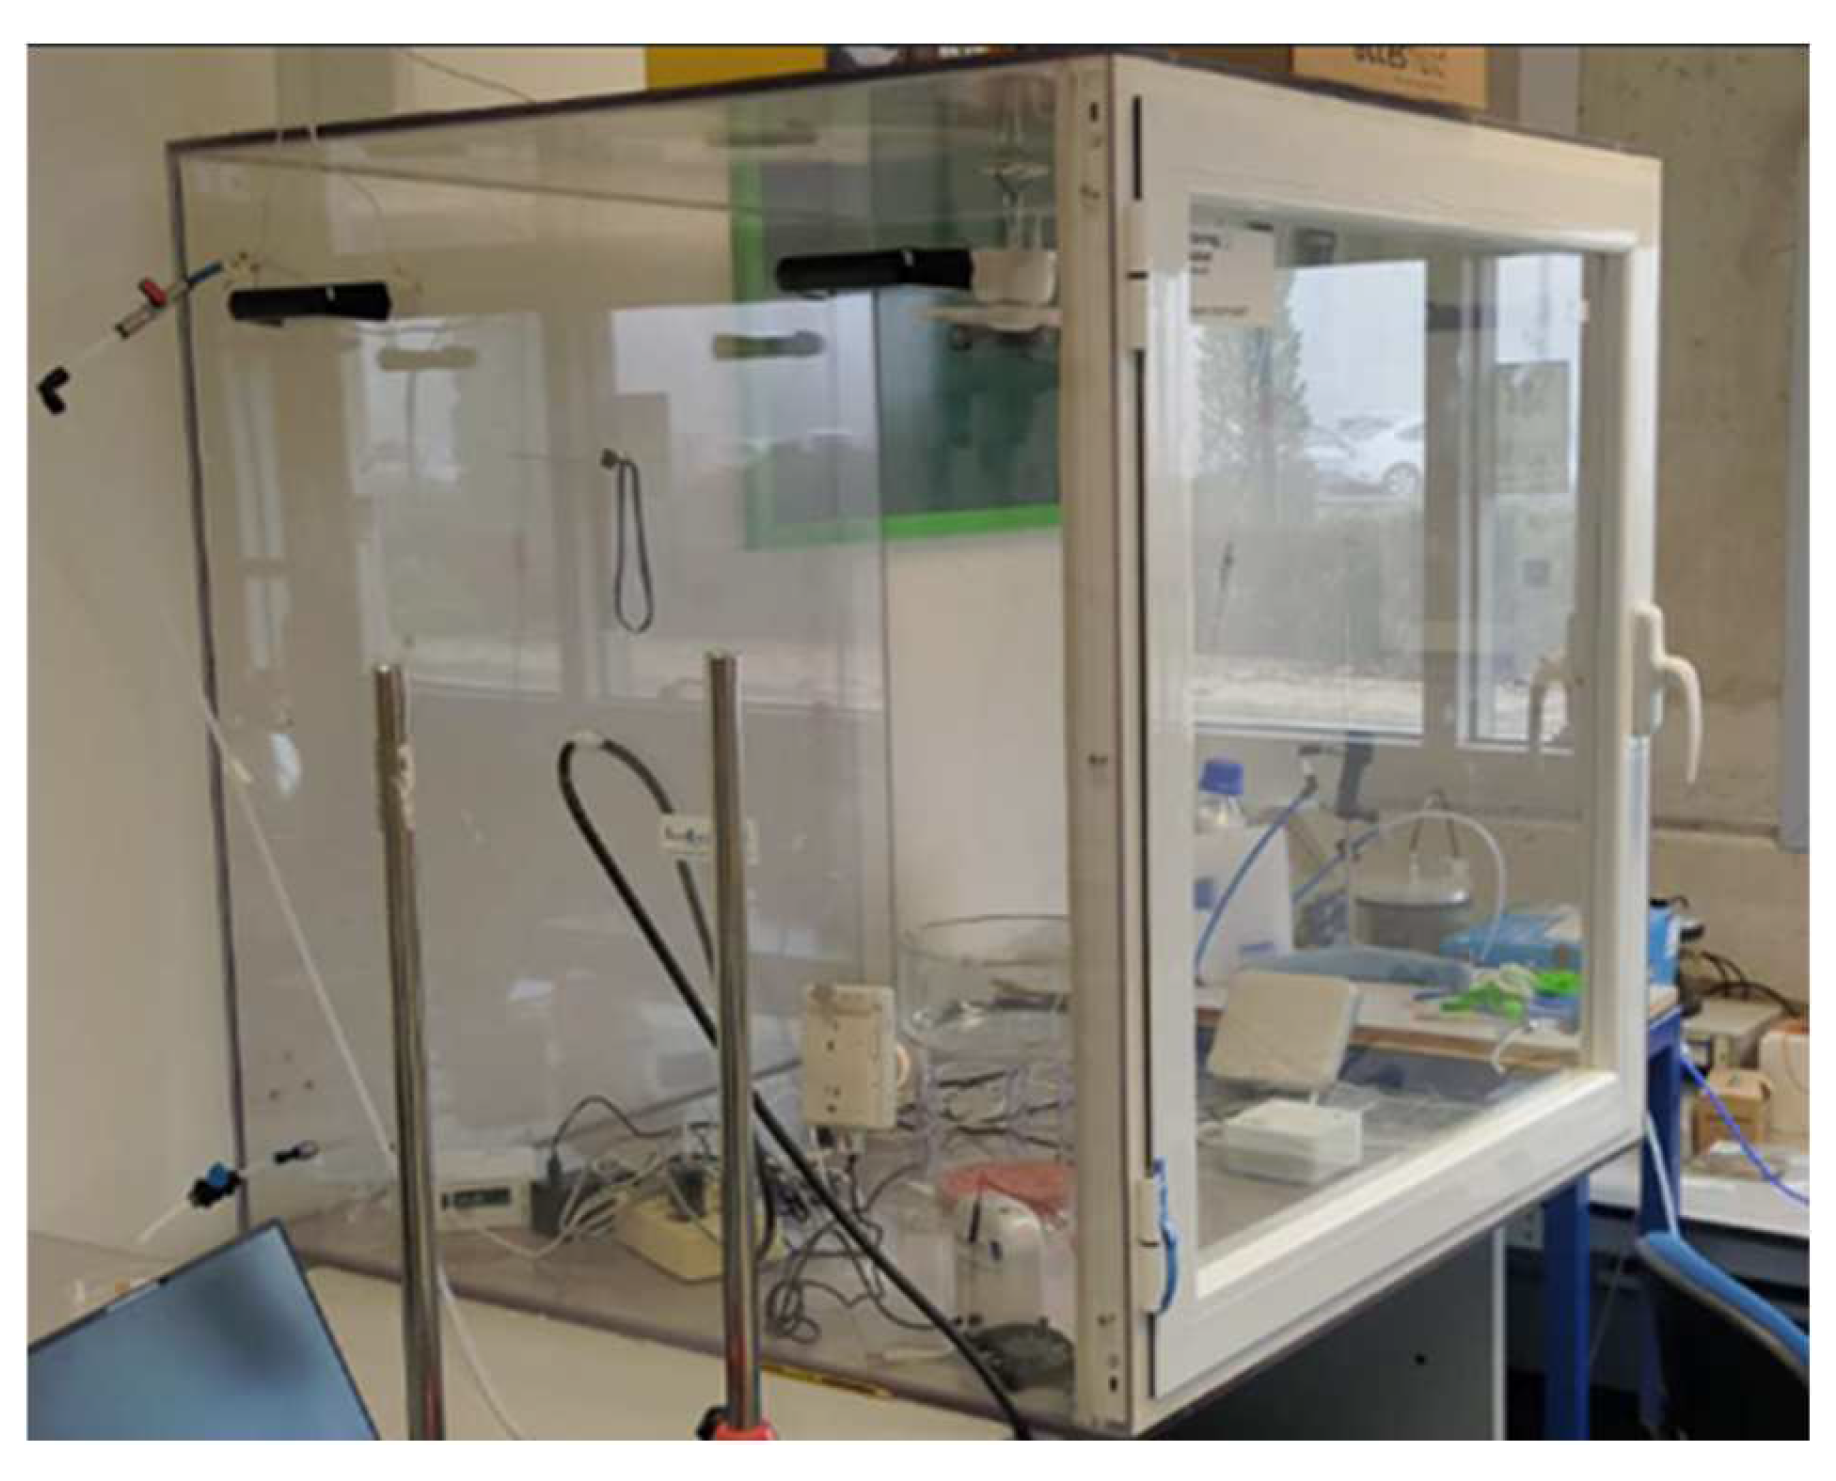
2.3. Chamber for Performance Tests
2.4. CO2 Sensor Verification
2.5. PM Sensor Verification
2.6. Data Analysis Methodology
- Error Calculation: Absolute error was computed as the difference between the low-cost sensor reading and the reference equipment measurement (i.e., |500 − 400| = 100 ppm). Relative error was then calculated as the percentage of the absolute error relative to the reference value (i.e., (100/500) × 100 = 20%).
- Temporal Stability Assessment: For each parameter (e.g., CO2, PM), measurements were collected over extended periods to evaluate the temporal stability of the sensors. Variability was quantified using standard deviation and interquartile range (IQR) metrics.
- Comparison with Intrinsic Accuracy: In the error assessment process, the intrinsic accuracy of both the reference device (inherent uncertainty stated in its calibration certificate and interpolated with the verified values) and the low-cost sensors was considered. For each measurement, the specified accuracy ranges of the devices were used to establish acceptable discrepancies. To interpret such discrepancies, the combined accuracy of both devices was considered as a potential source of variability. For example, for the INB01 with a measurement of 473 ppm (trial #1) CO2, the expected range would be 50 + 0.03 × 473 + 13 (from the reference device) = 77 ppm. If the reference value for this trial is 493 ppm, the measurement is OK. This approach allowed accounting for the inherent uncertainties in the measurements and assessing whether the observed errors exceeded the expected ranges based on device specifications.
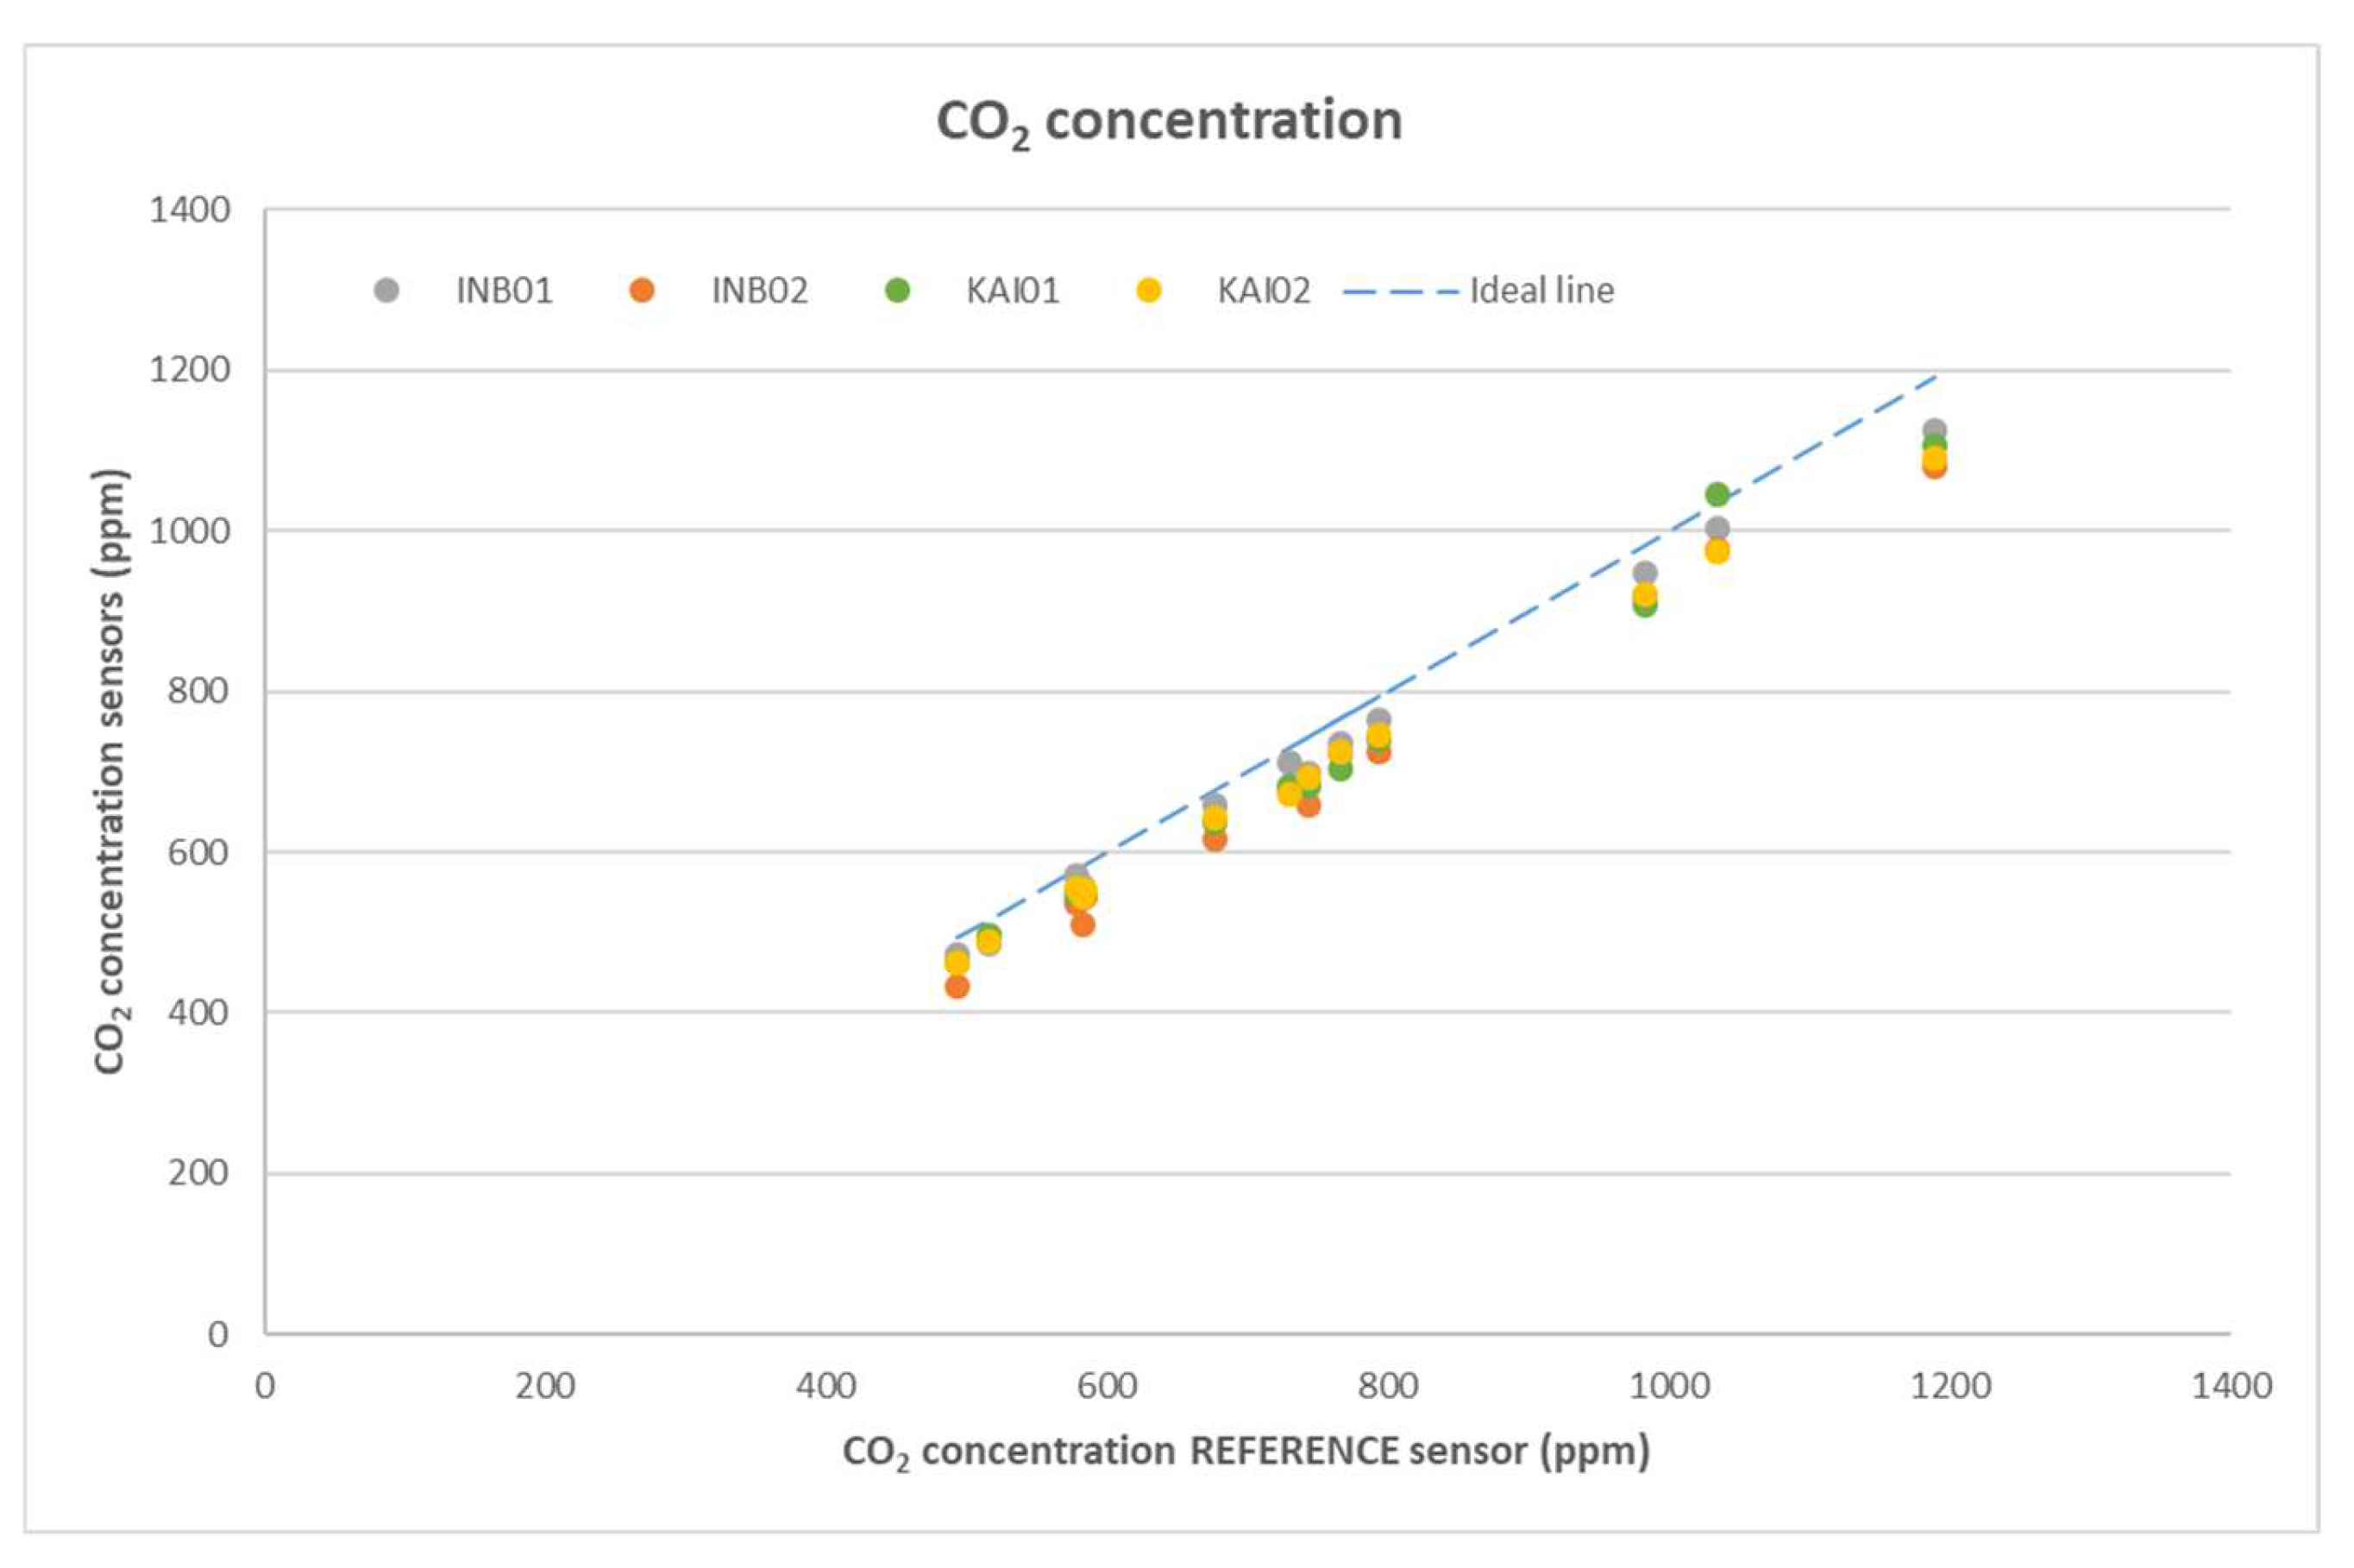
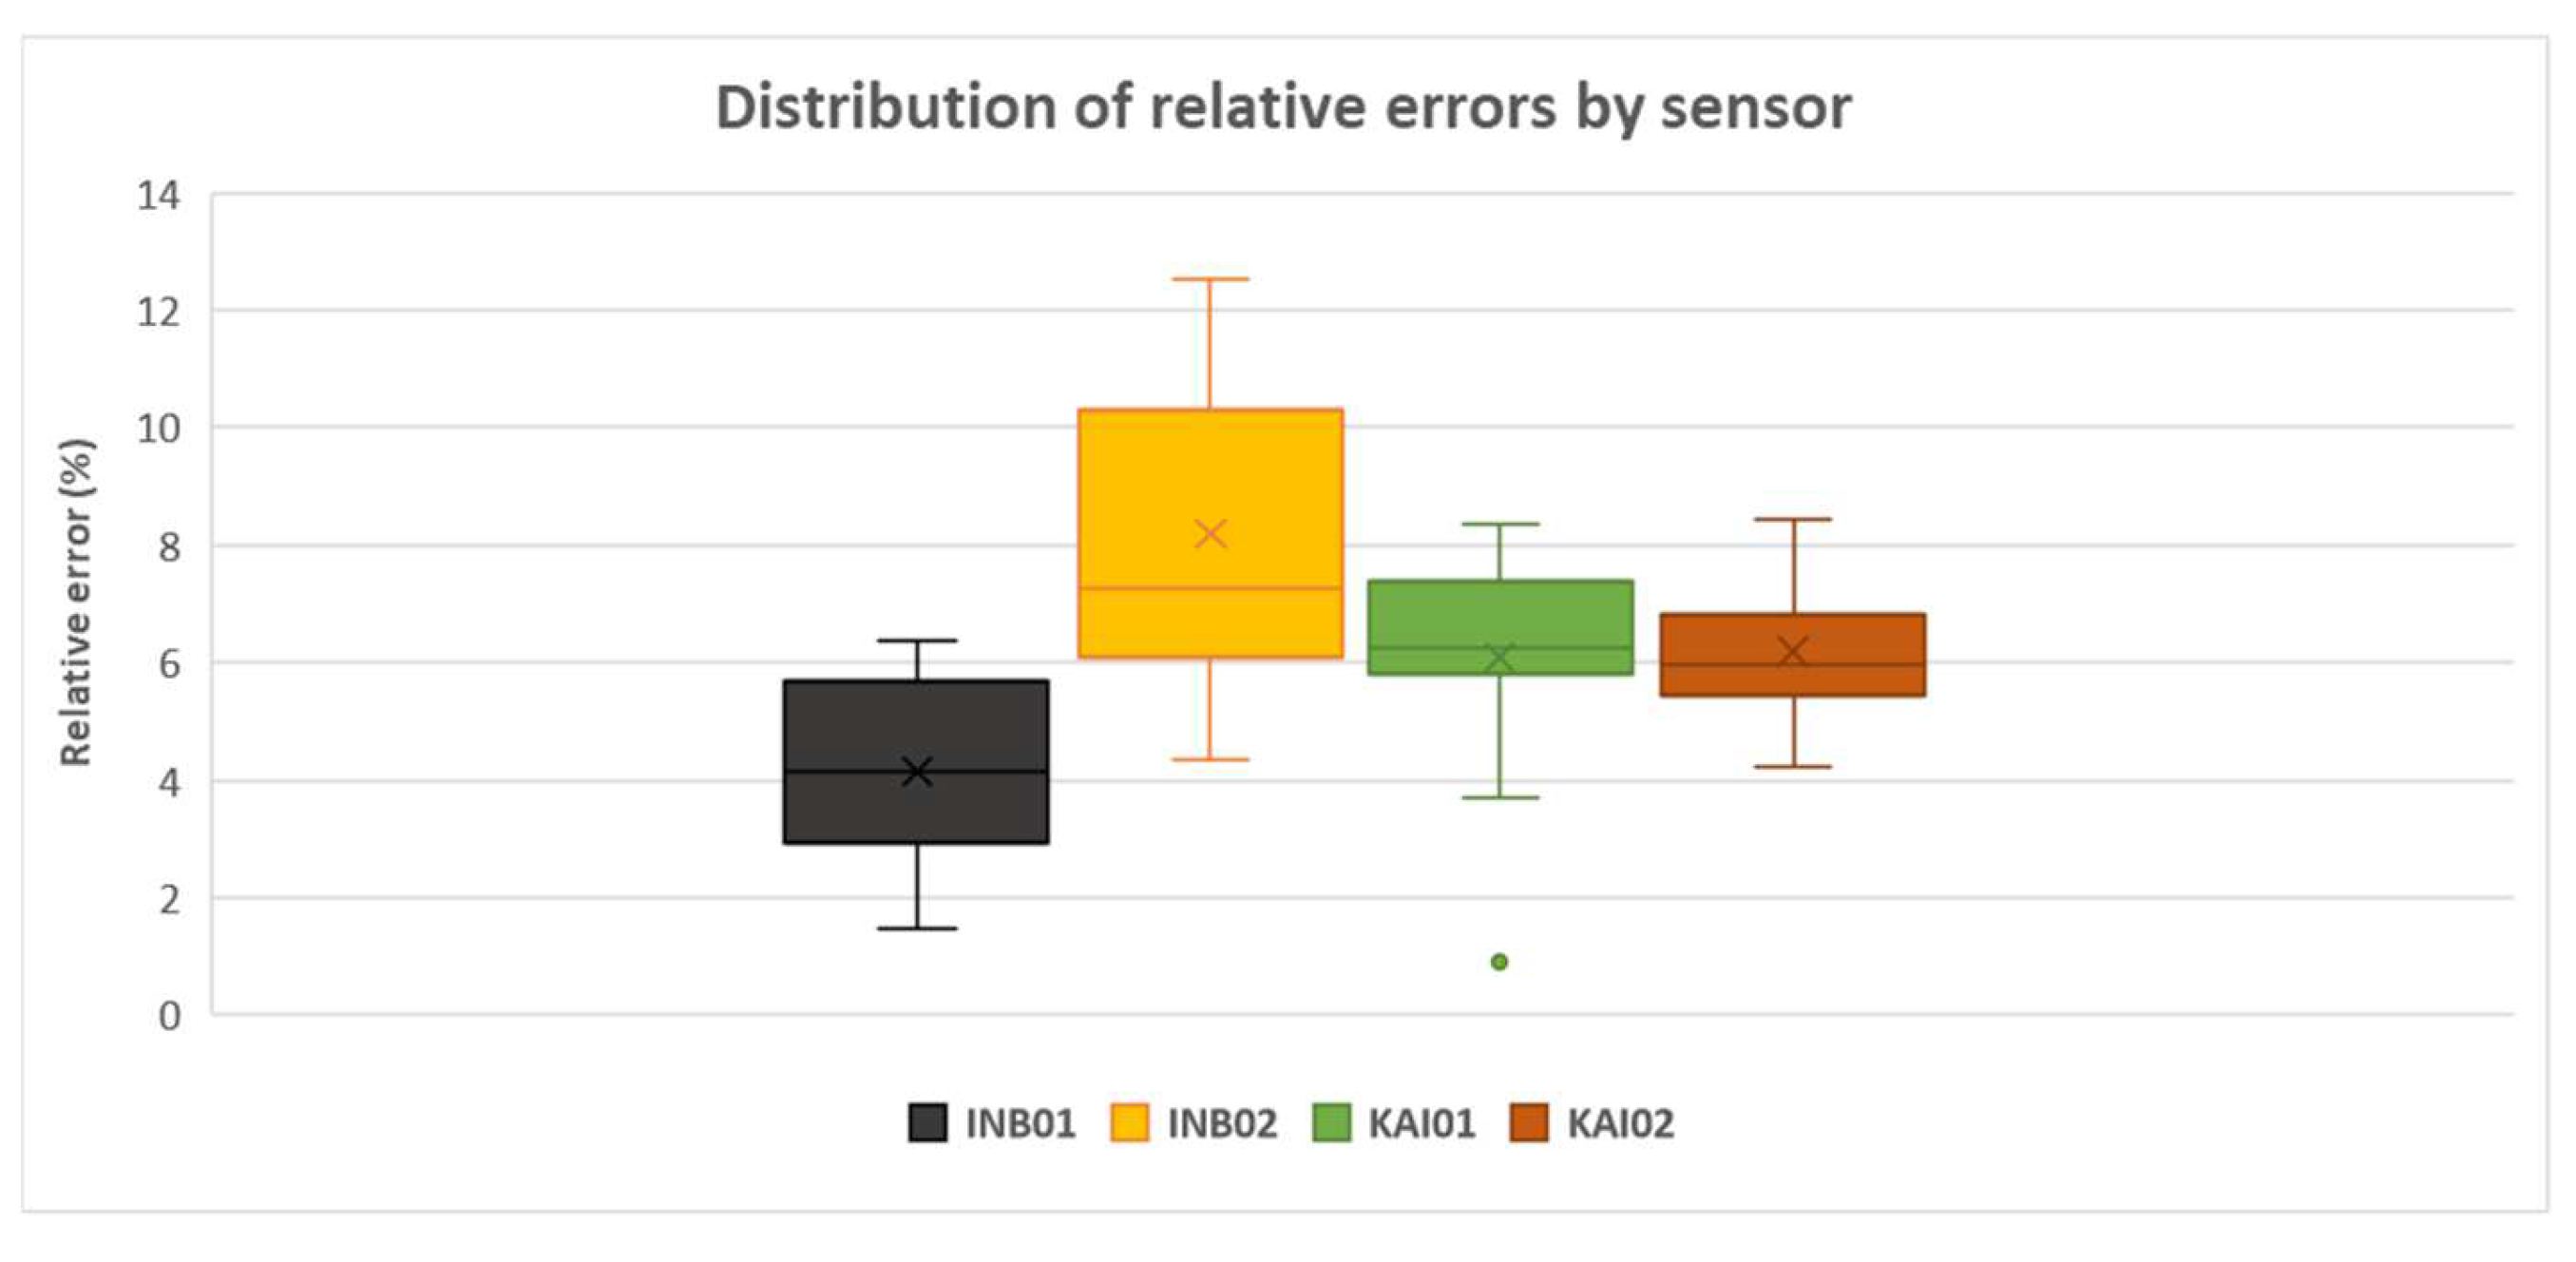
- Graphical Representation: Box plots and scatterplots were used to visualize the error distributions, highlighting median values, interquartile ranges, and outliers for each sensor.
3. Results
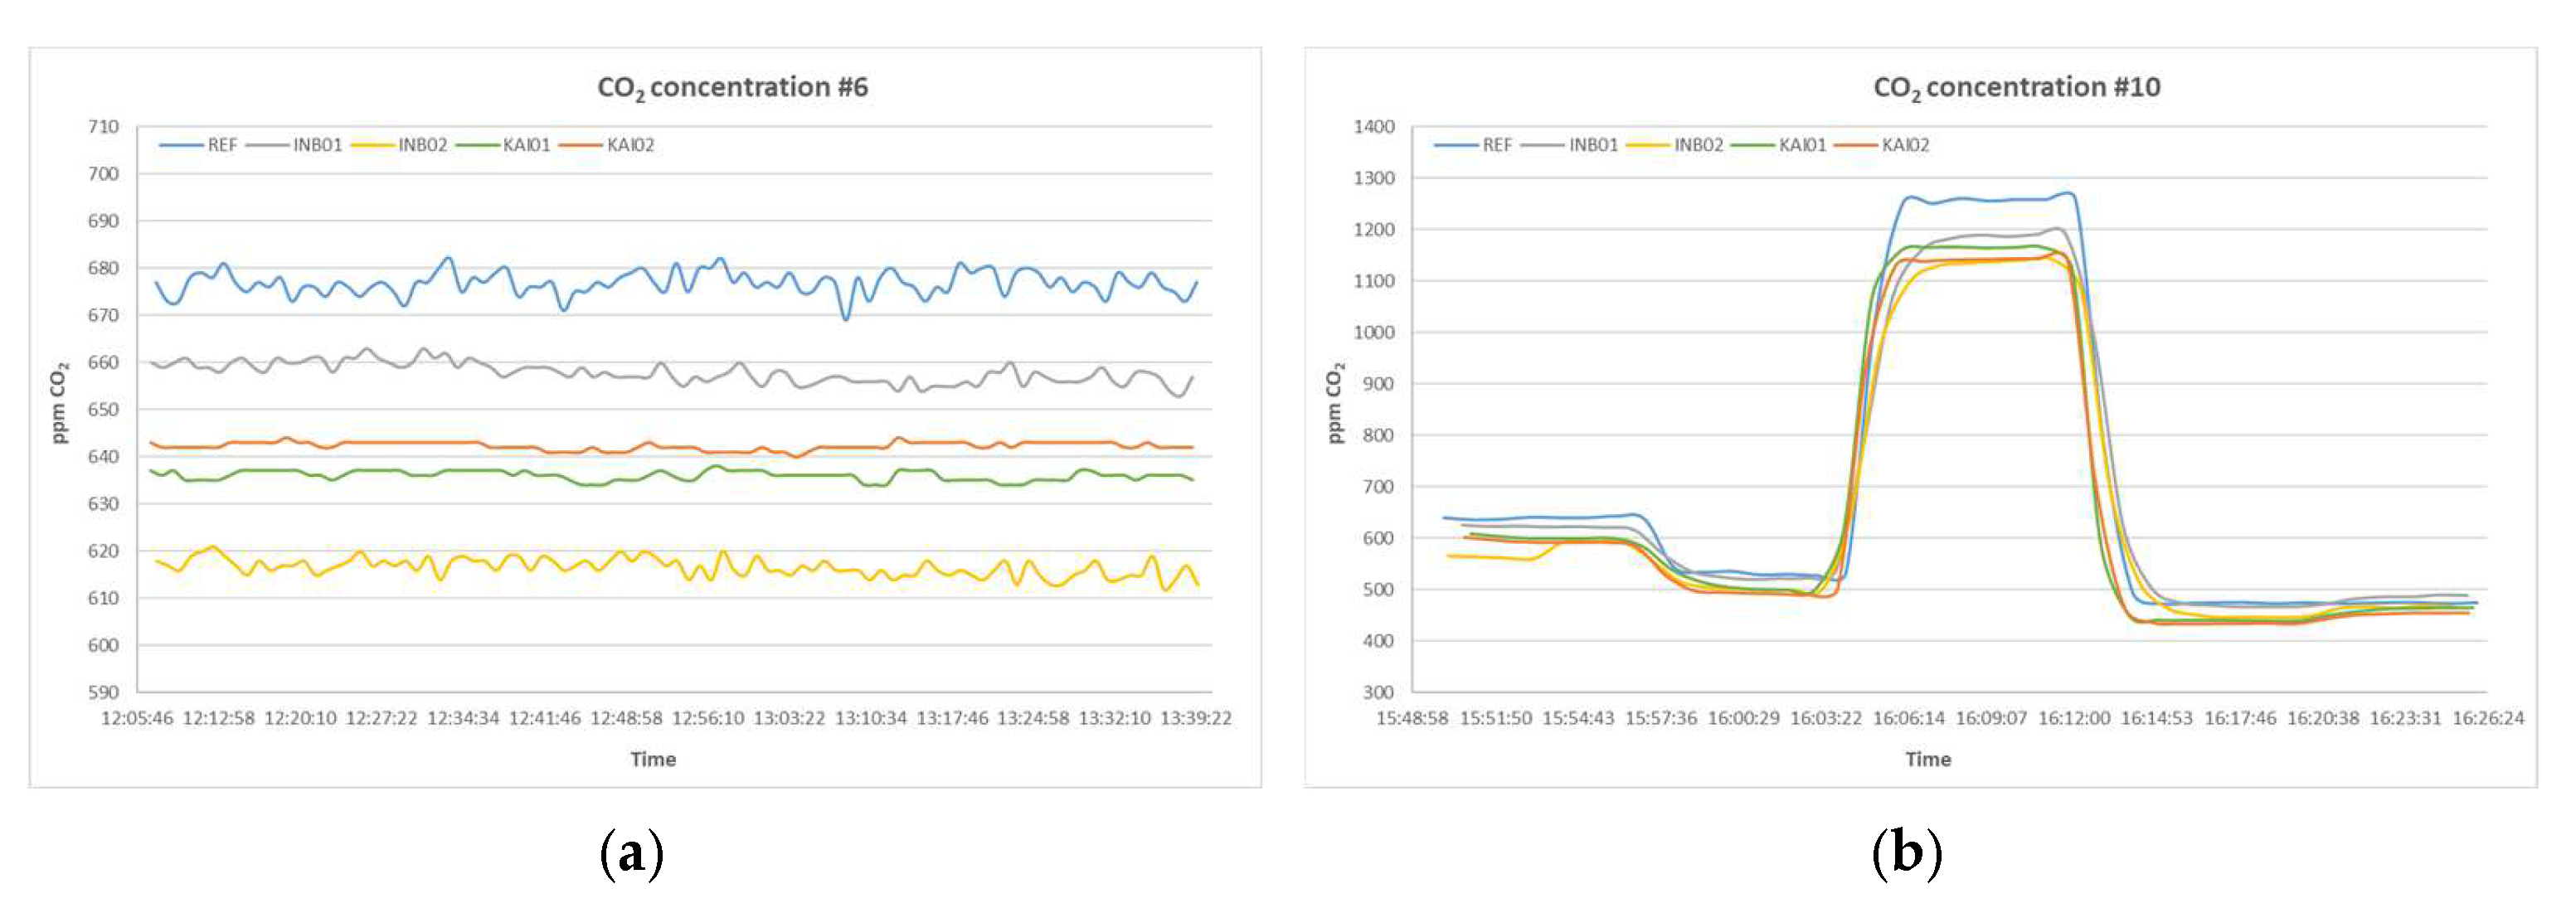
3.1. CO2
3.2. PM
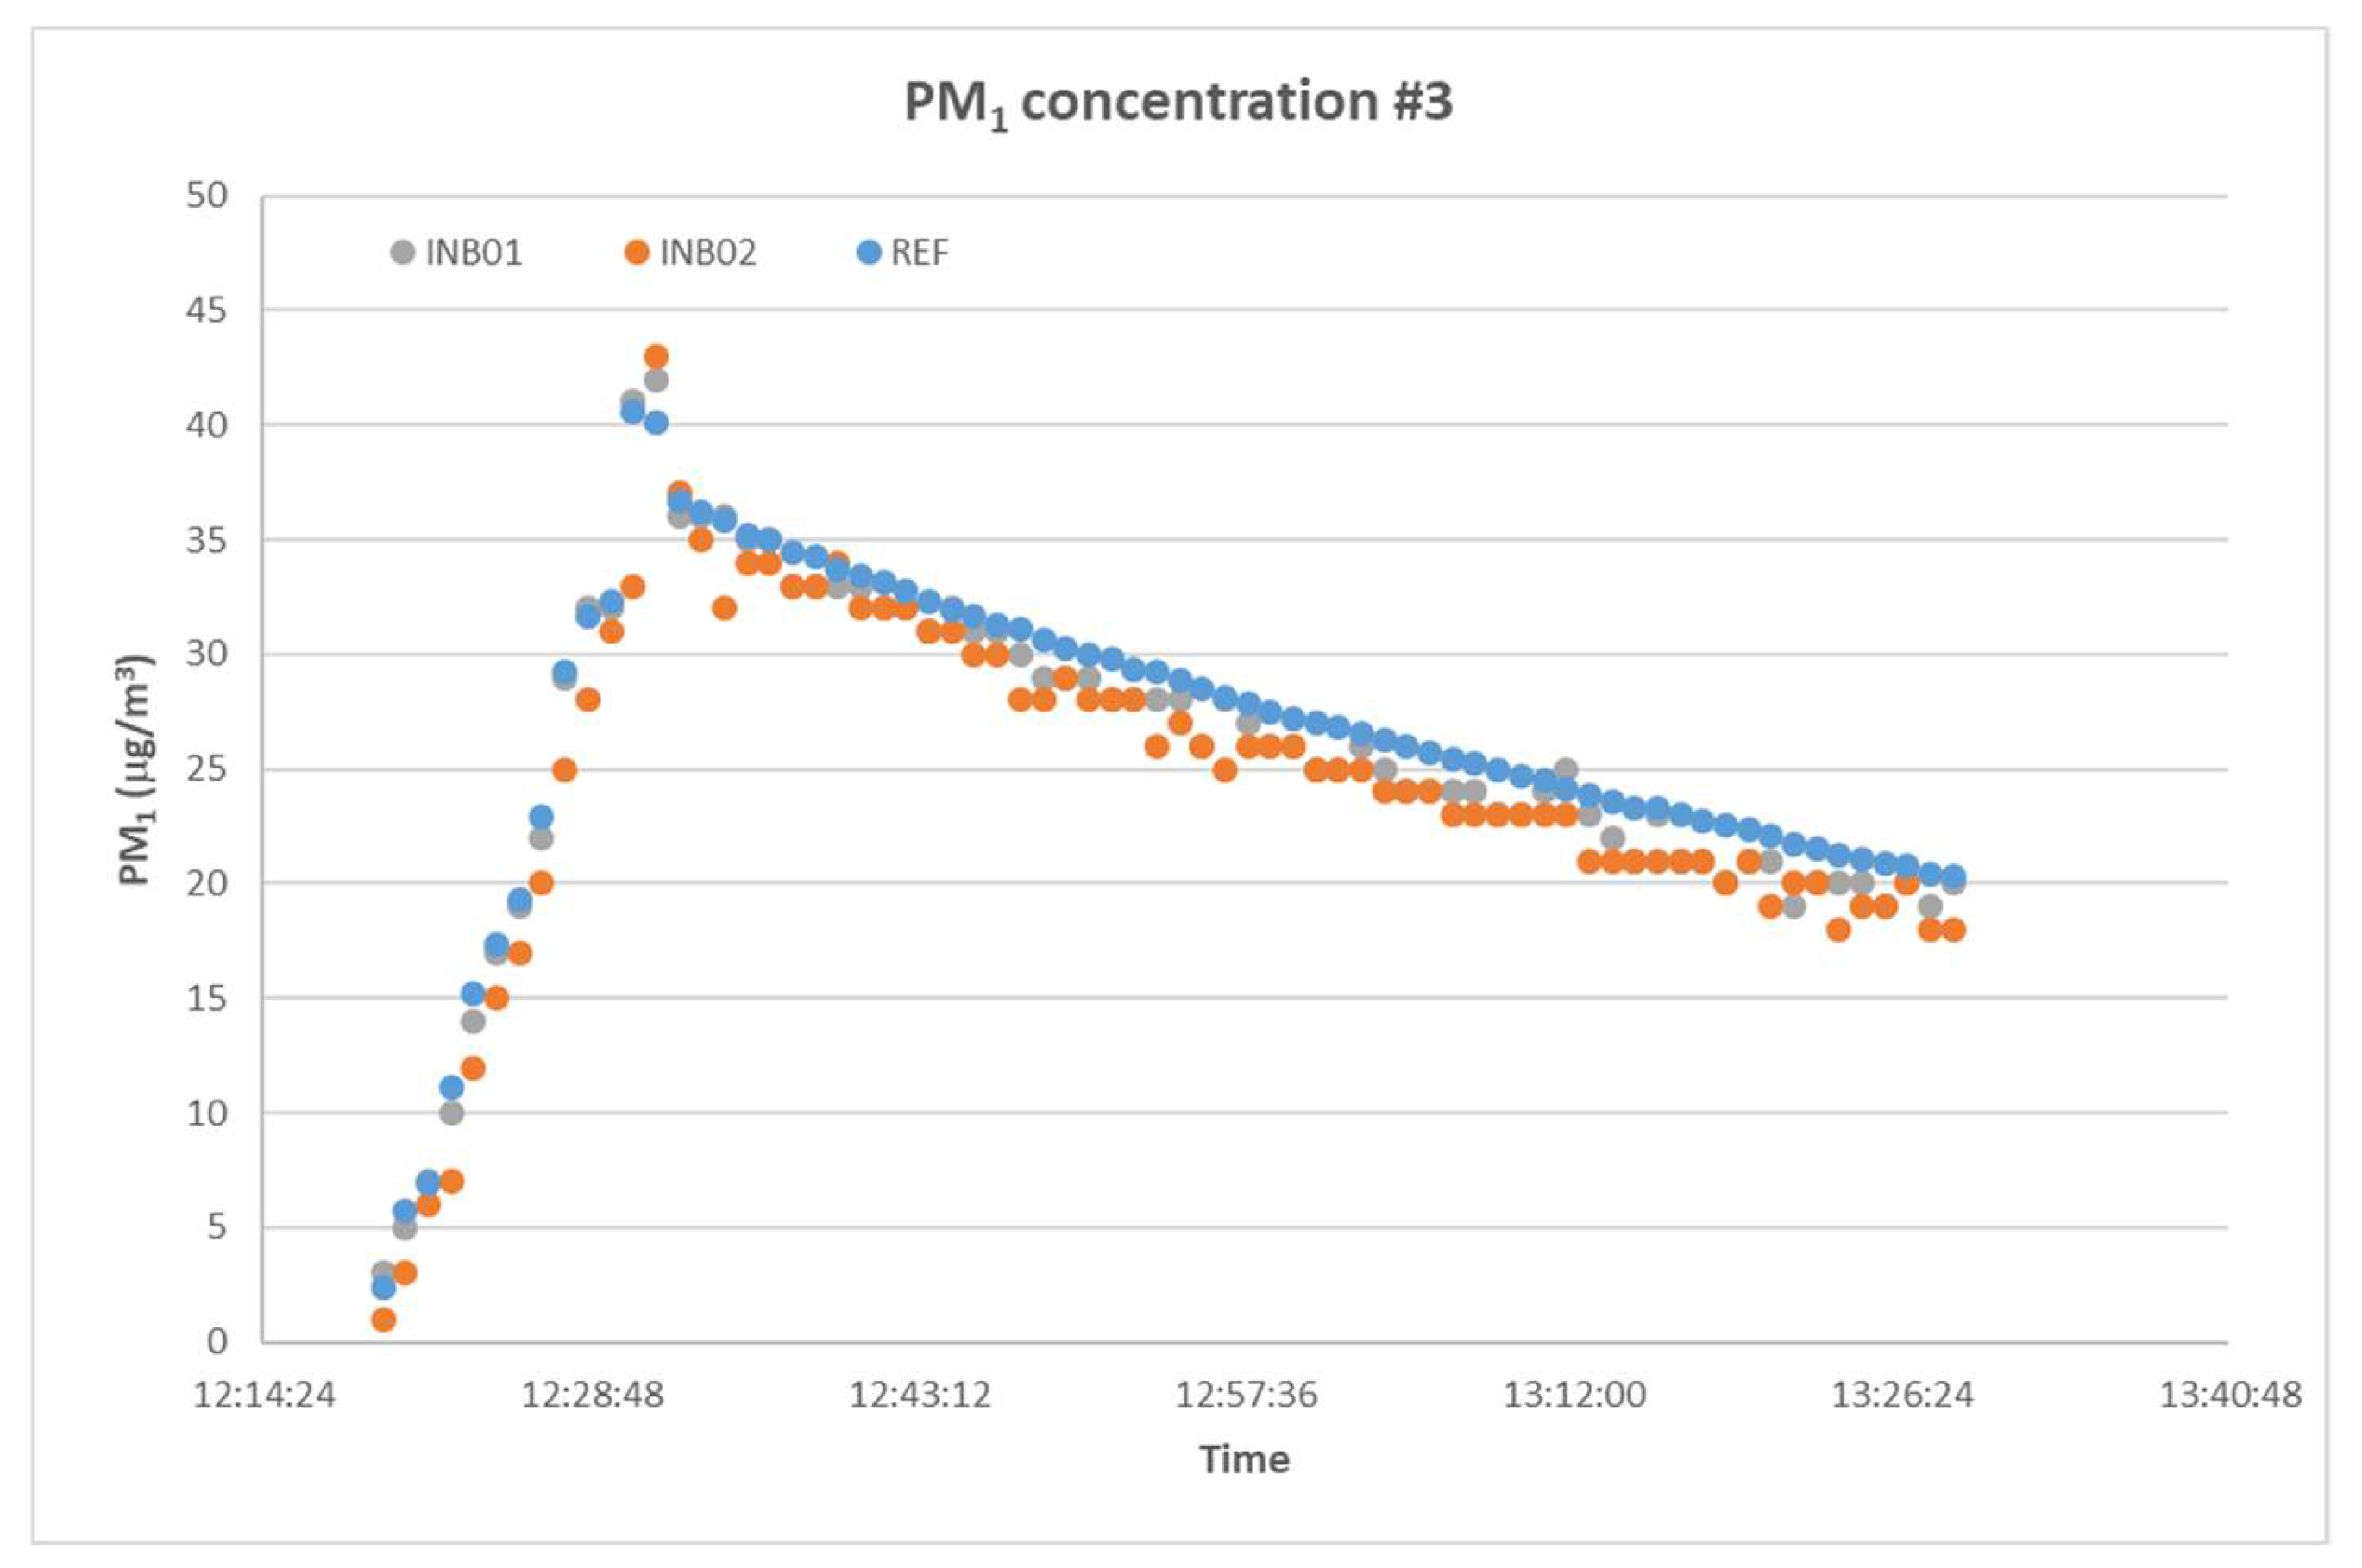
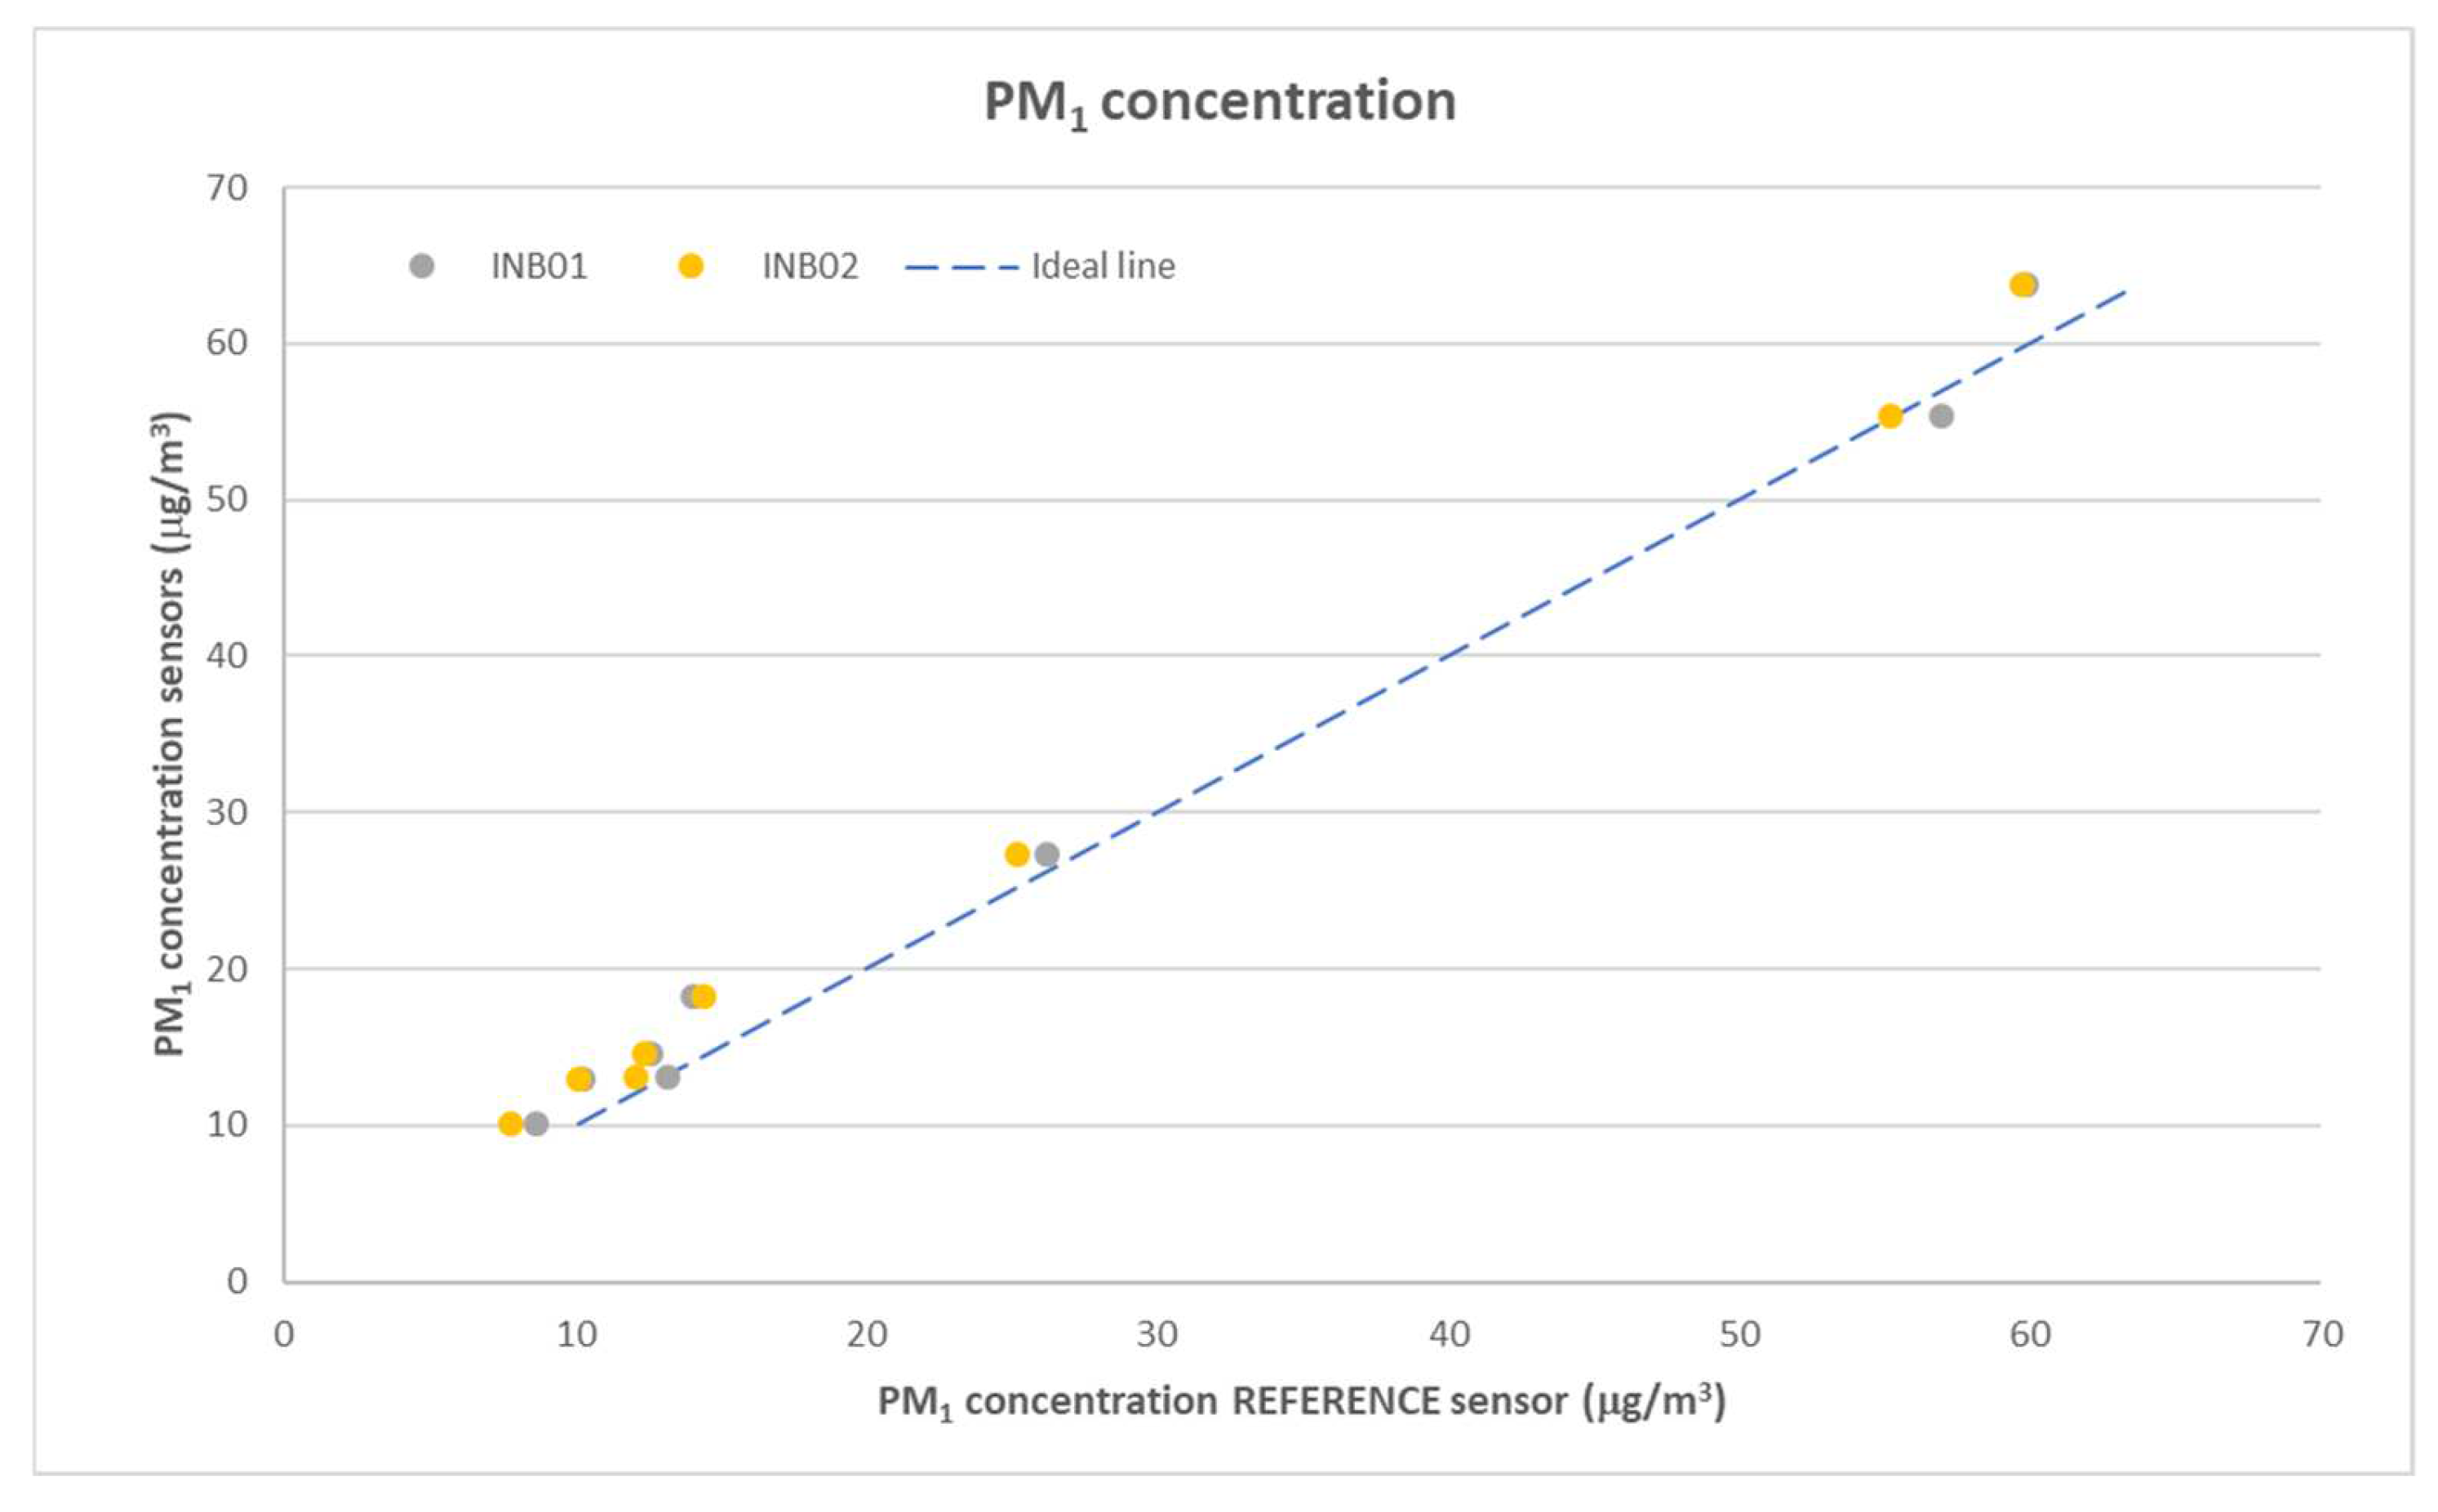
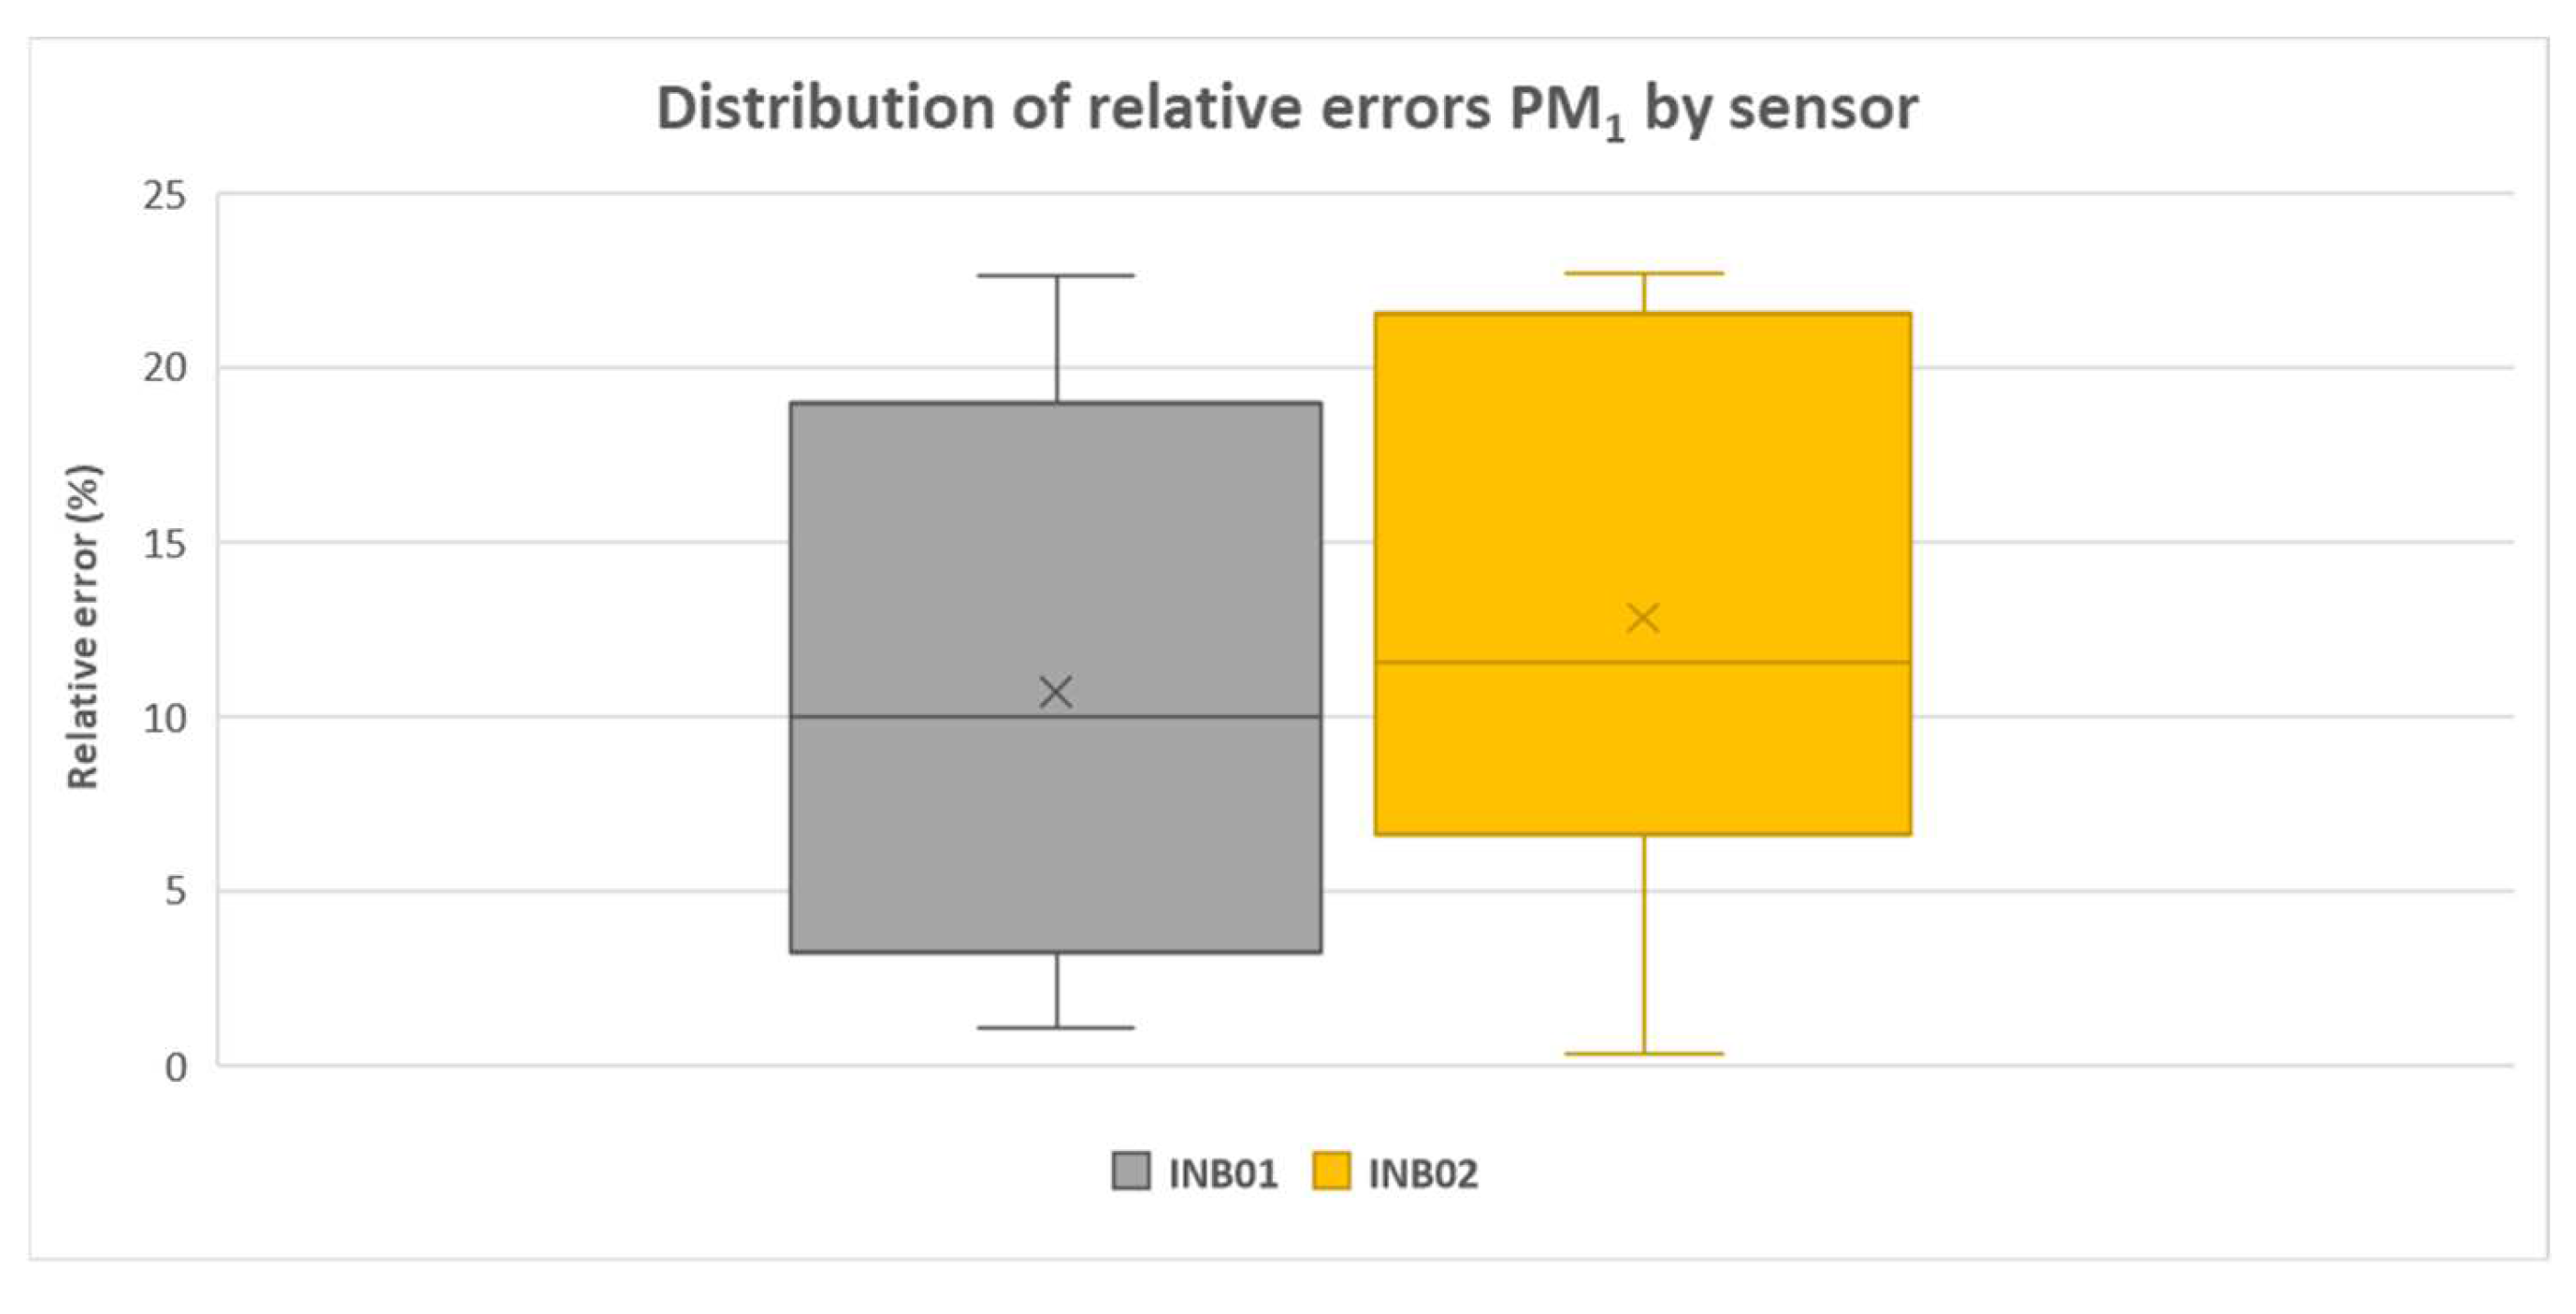
3.2.1. PM1 Results
3.2.2. PM2.5 Results
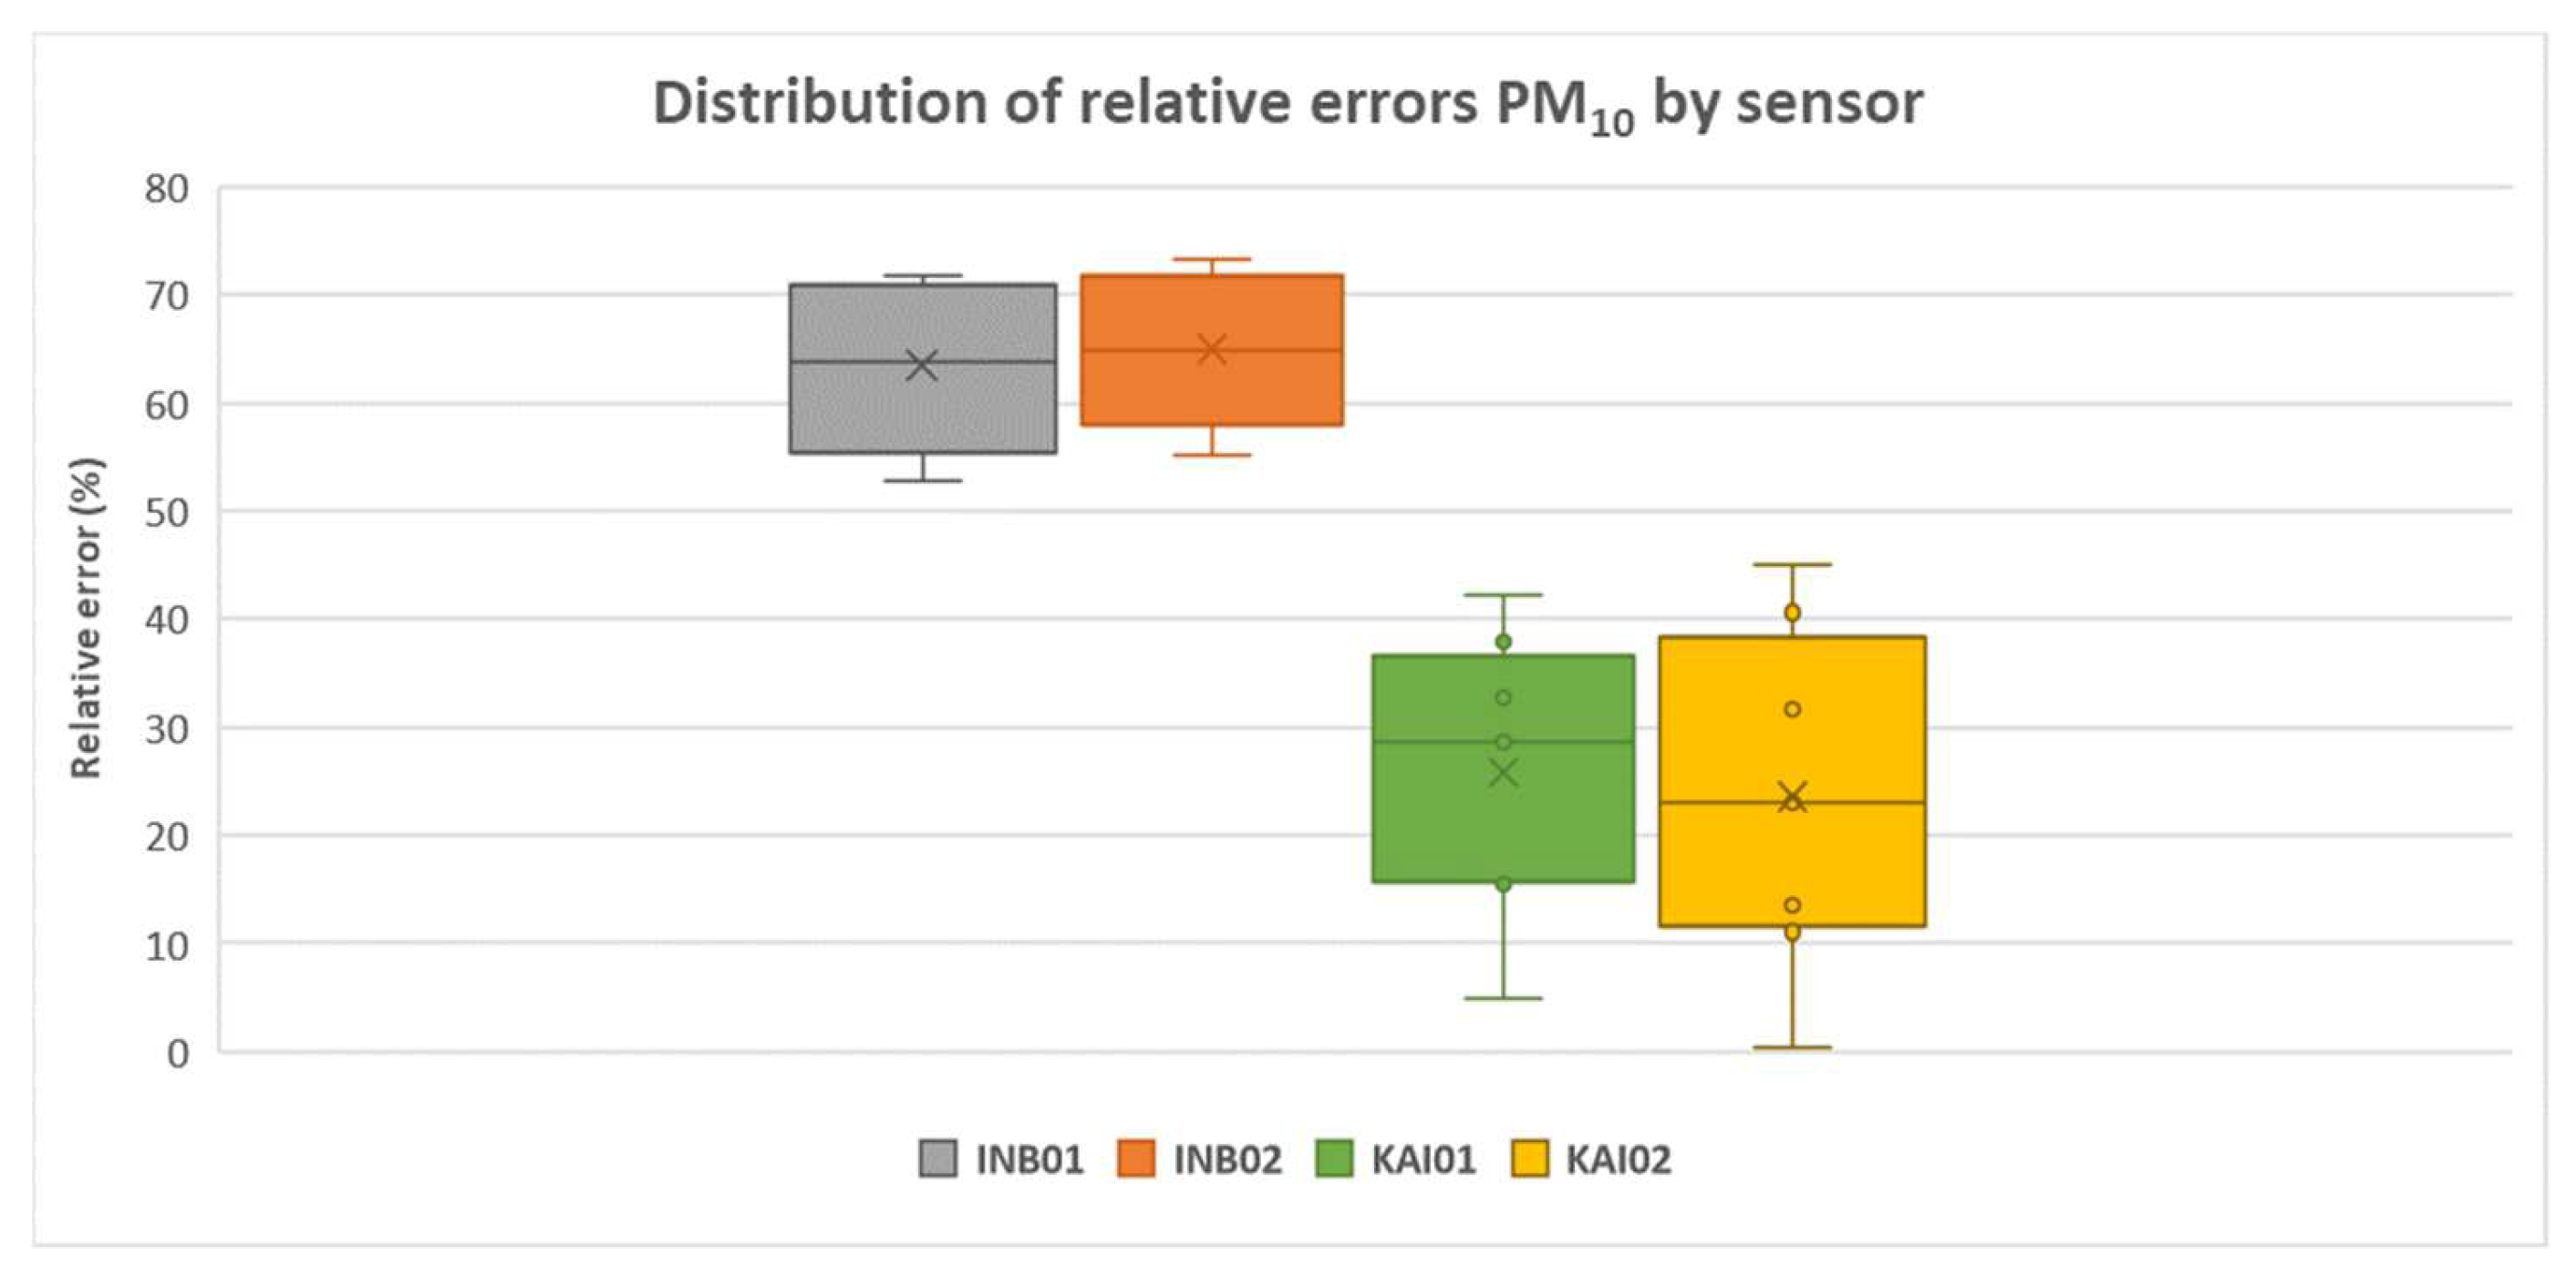
3.2.3. PM10 Results
4. Discussion
Relevance to Air Quality and Health Research
- Early Detection of Poor Ventilation: Elevated CO2 levels can indicate inadequate ventilation, prompting timely interventions to improve air exchange and reduce pollutant build-up.
- Personalized Patient Education: Providing patients with feedback on their indoor CO2 and PM levels can empower them to adopt behaviors that enhance IAQ, such as opening windows or using exhaust fans.
- Data-Driven Clinical Decisions: Continuous IAQ monitoring data can inform clinicians about environmental factors contributing to respiratory symptoms, allowing for tailored management plans.
- Resource Allocation: Identifying homes with consistently poor IAQ can help prioritize resources and interventions for patients at higher risk of exacerbations.
5. Conclusions
- Sensor Performance: Low-cost sensors showed a strong correlation with reference equipment across all tested parameters, particularly for CO2 measurements at lower concentrations. However, deviations were observed at higher CO2 concentrations and for PM measurements, particularly for PM2.5 and PM10, where underestimations were common.
- Environmental Robustness: Temperature and relative humidity had minimal impact on sensor performance under common environmental conditions, underscoring their robustness for diverse indoor environments. This suggests that low-cost sensors can reliably operate in real-world conditions, provided their limitations are accounted for.
- Usability in Health Studies: The integration of low-cost sensors into health-related studies offers a cost-effective approach to IAQ monitoring, enabling continuous data collection that supports the identification of trends and critical exposure periods. While the accuracy of these sensors may not match that of reference-grade equipment, their affordability and accessibility make them valuable tools for large-scale deployment in studies assessing the health impacts of IAQ.
- Regarding future directions, to enhance the usability of low-cost sensors in health-related research, several avenues for future work have been identified:
- Evaluation of Additional Sensors: Beyond the current focus on CO2 and particulate matter, further evaluations will be conducted on other sensors integrated into IAQ monitoring devices, including those measuring formaldehyde and TVOCs. These additional parameters are critical for a more comprehensive assessment of indoor air quality and its potential health impacts.
- Development of Alarm Thresholds: Strategies will be developed to establish concentration thresholds provided by the sensors that can serve as early warning signals for short-term exposures. These thresholds will help identify critical moments where immediate action may be required to reduce exposure risks.
- Assessment of Long-Term Exposure: The data collected from these sensors will also be used to evaluate medium- and long-term exposure levels for patients in their homes. This analysis will provide insights into the chronic effects of IAQ on health and support personalized interventions based on individual exposure profiles.
- Sensor Integration and Calibration: Efforts will focus on refining calibration methods and integrating sensor data with reference-grade instruments to enhance data reliability and usability. This will include exploring hybrid approaches that leverage both low-cost and high-precision monitoring tools.
Author Contributions
Funding
Data Availability Statement
Use of Artificial Intelligence
Conflicts of Interest
References
- Wesseling, J.; de Ruiter, H.; Blokhuis, C.; Drukker, D.; Weijers, E.; Volten, H.; Vonk, J.; Gast, L.; Voogt, M.; Zandveld, P.; et al. Development and Implementation of a Platform for Public Information on Air Quality, Sensor Measurements, and Citizen Science. Atmosphere 2019, 10, 445. Available online: https://www.mdpi.com/2073-4433/10/8/445/htm (accessed on 22 November 2024). [CrossRef]
- Ródenas García, M.; Spinazzé, A.; Branco, P.T.B.S.; Borghi, F.; Villena, G.; Cattaneo, A.; Di Gilio, A.; Mihucz, V.G.; Álvarez, E.G.; Lopes, S.I.; et al. Review of low-cost sensors for indoor air quality: Features and applications. Appl. Spectrosc. Rev. 2022, 57, 747–779. Available online: https://www.tandfonline.com/doi/abs/10.1080/05704928.2022.2085734 (accessed on 22 November 2024). [CrossRef]
- Moreno-Rangel, A.; Sharpe, T.; Musau, F.; McGill, G. Field evaluation of a low-cost indoor air quality monitor to quantify exposure to pollutants in residential environments. J. Sens. Sens. Syst. 2018, 7, 373–388. [Google Scholar] [CrossRef]
- Boldo, E.; Medina, S.; LeTertre, A.; Hurley, F.; Mücke, H.G.; Ballester, F.; Aguilera, I.; Eilstein, D.; Apheis Group. Apheis: Health impact assessment of long-term exposure to PM(2.5) in 23 European cities. Eur. J. Epidemiol. 2006, 21, 449–458. Available online: https://pubmed.ncbi.nlm.nih.gov/16826453/ (accessed on 25 November 2024). [CrossRef]
- Tiele, A.; Esfahani, S.; Covington, J. Design and development of a low-cost, portable monitoring device for indoor environment quality. J. Sens. 2018, 2018, 1–14. Available online: https://www.researchgate.net/publication/323556067_Design_and_Development_of_a_Low-Cost_Portable_Monitoring_Device_for_Indoor_Environment_Quality (accessed on 25 November 2024). [CrossRef]
- Liu, H.; Kim, M.; Kang, O.; Sankararao, B.; Kim, J.; Kim, J.C.; Yoo, C.K. Sensor Validation for Monitoring Indoor Air Quality in a Subway Station. J. Indoor Built Environ. 2011, 21, 205–211. [Google Scholar] [CrossRef]
- Chen, J.; Hoek, G. Long-term exposure to PM and all-cause and cause-specific mortality: A systematic review and meta-analysis. Environ. Int. 2020, 143, 105974. Available online: https://pubmed.ncbi.nlm.nih.gov/32703584/ (accessed on 22 November 2024). [CrossRef] [PubMed]
- Nair, A.N.; Anand, P.; George, A.; Mondal, N. A review of strategies and their effectiveness in reducing indoor airborne transmission and improving indoor air quality. Environ. Res. 2022, 213, 113579. [Google Scholar] [CrossRef]
- Formaldehyde and Cancer Risk | American Cancer Society. Available online: https://www.cancer.org/cancer/risk-prevention/chemicals/formaldehyde.html (accessed on 27 November 2024).
- Rouf, Z.; Dar, I.Y.; Javaid, M.; Dar, M.Y.; Jehangir, A. Volatile Organic Compounds Emission from Building Sector and Its Adverse Effects on Human Health. In Ecological and Health Effects of Building Materials; Springer: Berlin/Heidelberg, Germany, 2022; pp. 67–86. Available online: https://link.springer.com/chapter/10.1007/978-3-030-76073-1_5 (accessed on 25 November 2024).
- Tietjen, G.E.; Khubchandani, J.; Ghosh, S.; Bhattacharjee, S.; Kleinfelder, J.A. Headache symptoms and indoor environmental parameters: Results from the EPA BASE study. Ann. Indian. Acad. Neurol. 2012, 15, 95–99. Available online: https://journals.lww.com/annalsofian/fulltext/2012/15001/headache_symptoms_and_indoor_environmental.15.aspx (accessed on 27 November 2024).
- Bhui, K.; Newbury, J.B.; Latham, R.M.; Ucci, M.; Nasir, Z.A.; Turner, B.; O’Leary, C.; Fisher, H.L.; Marczylo, E.; Douglas, P. Air quality and mental health: Evidence, challenges and future directions. BJPsych Open 2023, 9, e120. Available online: https://www.cambridge.org/core/journals/bjpsych-open/article/air-quality-and-mental-health-evidence-challenges-and-future-directions/FF3A143292CD1783BA7DC7B744573C5C (accessed on 25 November 2024). [CrossRef] [PubMed]
- Cedeño Laurent, J.G.; Macnaughton, P.; Jones, E.; Young, A.S.; Bliss, M.; Flanigan, S.; Vallarino, J.; Chen, L.J.; Cao, X.; Allen, J.G. Associations between acute exposures to PM2.5 and carbon dioxide indoors and cognitive function in office workers: A multicountry longitudinal prospective observational study. Environ. Res. Lett. 2021, 16, 094047. Available online: https://iopscience.iop.org/article/10.1088/1748-9326/ac1bd8 (accessed on 25 November 2024). [CrossRef] [PubMed]
- Peng, Z.; Jimenez, J.L. Exhaled CO2 as a COVID-19 Infection Risk Proxy for Different Indoor Environments and Activities. Environ. Sci. Technol. Lett. 2021, 8, 392–397. Available online: https://pubmed.ncbi.nlm.nih.gov/37566374/ (accessed on 22 November 2024). [CrossRef]
- Chojer, H.; Branco, P.T.B.S.; Martins, F.G.; Alvim-Ferraz, M.C.M.; Sousa, S.I.V. Development of low-cost indoor air quality monitoring devices: Recent advancements. Sci. Total Environ. 2020, 727, 138385. [Google Scholar] [CrossRef]
- Jagatha, J.V.; Klausnitzer, A.; Chacón-Mateos, M.; Laquai, B.; Nieuwkoop, E.; van der Mark, P.; Vogt, U.; Schneider, C. Calibration Method for Particulate Matter Low-Cost Sensors Used in Ambient Air Quality Monitoring and Research. Sensors 2021, 21, 3960. Available online: https://www.mdpi.com/1424-8220/21/12/3960/htm (accessed on 22 November 2024). [CrossRef]
- Sousan, S.; Koehler, K.; Hallett, L.; Peters, T.M. Evaluation of the Alphasense optical particle counter (OPC-N2) and the Grimm portable aerosol spectrometer (PAS-1.108). Aerosol Sci. Technol. 2016, 50, 1352–1365. Available online: https://www.tandfonline.com/doi/abs/10.1080/02786826.2016.1232859 (accessed on 25 November 2024). [CrossRef] [PubMed]
- Crilley, L.R.; Singh, A.; Kramer, L.J.; Shaw, M.D.; Alam, M.S.; Apte, J.S.; Sun, Y.; Whitty, R.C.W.; Yue, S.; Young, S.; et al. Effect of aerosol composition on the performance of low-cost optical particle counter correction factors. Atmos. Meas. Tech. 2020, 13, 1181–1193. [Google Scholar] [CrossRef]
- SEK-SPS30-Particulate Matter Evaluation Kit SPS30. Available online: https://sensirion.com/products/catalog/SEK-SPS30 (accessed on 27 November 2024).
- Wallace, L. Cracking the code-Matching a proprietary algorithm for a low-cost sensor measuring PM1 and PM2.5. Sci. Total Environ. 2023, 893, 164874. Available online: https://pubmed.ncbi.nlm.nih.gov/37336395/ (accessed on 25 November 2024). [CrossRef]
- European Environment Agency. EEA Report No 19/2019. Assessing Air Quality Through Citizen Science. 2019. Available online: https://www.eea.europa.eu/publications/assessing-air-quality-through-citizen-science (accessed on 28 November 2024).
- Gómez-López, A.; Arismendi, E.; Cano, I.; Farré, R.; Figols, M.; Hernández, C.; Benavent, J.; Fermoso, J.; Roca, J.; González-Colom, R.; et al. Protocol for the Enhanced Management of Multimorbid Patients with Chronic Pulmonary Diseases: Role of Indoor Air Quality. medRxiv 2025. [Google Scholar] [CrossRef]
- European Accreditation (EA). Evaluation of the Uncertainty of Measurement in Calibration (EA-4/02 M: 2022, Rev. 03). European Accreditation. 2022. Available online: http://www.european-accreditation.org (accessed on 22 November 2024).
- ISO 21501-4:2018; Determination of particle size distribution—Single particle light interaction methods—Part 4: Light scattering airborne particle counter for clean spaces. International Organization for Standardization: Geneva, Switzerland, 2018. Available online: https://www.iso.org/standard/58073.html (accessed on 22 November 2024).
- inBiot—Monitorización y Mejora de la Calidad del Aire Interior. Available online: https://www.inbiot.es/es (accessed on 28 November 2024).
- Smart Air Quality Monitors for Commercial Use | Kaiterra. Available online: https://www.kaiterra.com/ (accessed on 28 November 2024).
- Pagels, J.; Wierzbicka, A.; Nilsson, E.; Isaxon, C.; Dahl, A.; Gudmundsson, A.; Swietlicki, E.; Bohgard, M. Chemical composition and mass emission factors of candle smoke particles. J. Aerosol Sci. 2009, 40, 193–208. [Google Scholar] [CrossRef]


| Device | MICA (inBiot) [25] | Sensedge Mini (Kaiterra) [26] |
|---|---|---|
| Measurement Parameters | CO2, PM1, PM2.5, PM4.0, PM10, Formaldehyde, TVOC, Temp, RH | CO2, PM2.5, PM10, TVOC, Temp, RH |
| CO2 Accuracy | ±50 ppm + ±3% (0–5000 ppm) | ±40 ppm + ±3% (400–10,000 ppm) |
| CO2 technology | NDIR sensor | NDIR sensor |
| PM Accuracy | ±5 μg/m3 + ±5% (0–100 μg/m3); ±10% (100–1000 μg/m3) | ±3 μg/m3 (0–30 μg/m3); ±10% (30–1000 μg/m3) |
| PM technology | laser-based optical sensor | Laser-based optical sensor |
| Certifications | RESET, WELL | RESET, WELL |
| Connectivity | My inBiot platform | Mobile app and web platform |
| Estimated Cost (€) | ~500 | ~750 |
| REF | INB01 | INB02 | KAI01 | KAI02 | |||||||
|---|---|---|---|---|---|---|---|---|---|---|---|
| Trial | T | RH | CO2 (ppm) | CO2 (ppm) | Errrel (%) | CO2 (ppm) | Errrel (%) | CO2 (ppm) | Errrel (%) | CO2 (ppm) | Errrel (%) |
| #1 | 21 | 44 | 493 | 473 | 4.13 | 433 | 12.23 | 463 | 6.23 | 462 | 6.39 |
| #2 | 23 | 45 | 516 | 486 | 5.88 | 494 | 4.33 | 497 | 3.71 | 489 | 5.29 |
| #3 | 25 | 72 | 579 | 570 | 1.49 | 537 | 7.25 | 546 | 5.67 | 554 | 4.23 |
| #4 | 22 | 41 | 582 | 557 | 4.32 | 509 | 12.53 | 546 | 6.24 | 543 | 6.69 |
| #5 | 24 | 37 | 584 | 546 | 6.38 | 543 | 6.88 | 549 | 5.91 | 551 | 5.60 |
| #6 | 25 | 81 | 677 | 658 | 2.79 | 617 | 8.89 | 636 | 6.03 | 642 | 5.10 |
| #7 | 25 | 27 | 744 | 699 | 6.01 | 659 | 11.43 | 683 | 8.15 | 692 | 6.91 |
| #8 | 24 | 59 | 766 | 734 | 4.18 | 722 | 5.75 | 702 | 8.36 | 724 | 5.56 |
| #9 | 25 | 64 | 794 | 765 | 3.66 | 725 | 8.75 | 739 | 6.93 | 747 | 5.98 |
| #10 | 22 | 50 | 730 | 710 | 2.70 | 678 | 7.13 | 683 | 6.41 | 671 | 8.08 |
| #11 | 24 | 78 | 982 | 946 | 3.68 | 919 | 6.46 | 907 | 7.69 | 921 | 6.26 |
| #12 | 24 | 92 | 1035 | 1003 | 3.06 | 977 | 5.66 | 1044 | 0.89 | 974 | 5.92 |
| #13 | 22 | 43 | 1190 | 1125 | 5.46 | 1081 | 9.17 | 1106 | 7.06 | 1090 | 8.43 |
| REF | INB01 | INB02 | |||||
|---|---|---|---|---|---|---|---|
| Trial | T | RH | PM1 (μg/m3) | PM1 (μg/m3) | Errrel (%) | PM1 (μg/m3) | Errrel (%) |
| #1 | 27 | 46 | 10.12 | 8.67 | 14.29 | 7.82 | 22.72 |
| #2 | 27 | 42 | 12.98 | 10.32 | 20.49 | 10.15 | 21.77 |
| #3 | 27 | 51 | 13.07 | 13.21 | 1.08 | 12.10 | 7.45 |
| #4 | 26 | 52 | 14.62 | 12.59 | 13.86 | 12.39 | 15.20 |
| #5 | 26 | 45 | 18.22 | 14.10 | 22.59 | 14.42 | 20.85 |
| #6 | 28 | 40 | 27.35 | 26.20 | 4.21 | 25.20 | 7.87 |
| #7 | 27 | 50 | 55.38 | 56.98 | 2.89 | 55.20 | 0.32 |
| #8 | 26 | 43 | 63.73 | 59.83 | 6.12 | 59.69 | 6.35 |
| REF | INB01 | INB02 | KAI01 | KAI02 | |||||||
|---|---|---|---|---|---|---|---|---|---|---|---|
| Trial | T | RH | PM2.5 (μg/m3) | PM2.5 (μg/m3) | Errrel (%) | PM2.5 (μg/m3) | Errrel (%) | PM2.5 (μg/m3) | Errrel (%) | PM2.5 (μg/m3) | Errrel (%) |
| #1 | 27 | 46 | 26.43 | 9.36 | 64.59 | 8.51 | 67.81 | 16.89 | 36.12 | 15.67 | 40.71 |
| #2 | 27 | 42 | 31.22 | 11.17 | 64.23 | 11.00 | 64.77 | 23.72 | 24.03 | 22.80 | 26.97 |
| #3 | 27 | 51 | 22.32 | 13.84 | 38.00 | 12.72 | 42.99 | 30.67 | 37.45 | 27.20 | 21.87 |
| #4 | 26 | 52 | 31.74 | 13.38 | 57.86 | 13.21 | 58.38 | 34.18 | 7.67 | 32.79 | 3.28 |
| #5 | 26 | 45 | 41.81 | 15.28 | 63.45 | 15.52 | 62.89 | 30.18 | 27.81 | 32.35 | 22.63 |
| #6 | 28 | 40 | 53.26 | 27.57 | 48.24 | 26.39 | 50.45 | 82.77 | 55.39 | 80.05 | 50.30 |
| #7 | 27 | 50 | 109.75 | 60.14 | 45.20 | 58.39 | 46.80 | 137.00 | 24.83 | 135.98 | 23.90 |
| #8 | 26 | 43 | 200.35 | 71.06 | 64.53 | 70.59 | 64.77 | 133.65 | 33.29 | 142.28 | 28.99 |
| REF | INB01 | INB02 | KAI01 | KAI02 | |||||||
|---|---|---|---|---|---|---|---|---|---|---|---|
| Trial | T | RH | PM10 (μg/m3) | PM10 (μg/m3) | Errrel (%) | PM10 (μg/m3) | Errrel (%) | PM10 (μg/m3) | Errrel (%) | PM10 (μg/m3) | Errrel (%) |
| #1 | 27 | 46 | 33.49 | 9.72 | 70.97 | 8.92 | 73.37 | 20.79 | 37.93 | 18.43 | 44.98 |
| #2 | 27 | 42 | 69.89 | 27.57 | 60.55 | 26.45 | 62.16 | 89.86 | 28.57 | 86.02 | 23.08 |
| #3 | 27 | 51 | 29.39 | 13.87 | 52.81 | 12.77 | 56.54 | 33.95 | 15.53 | 29.30 | 0.31 |
| #4 | 26 | 52 | 40.90 | 13.57 | 66.81 | 13.34 | 67.38 | 38.87 | 4.97 | 36.38 | 11.06 |
| #5 | 26 | 45 | 53.10 | 15.58 | 70.65 | 15.73 | 70.37 | 35.70 | 32.77 | 36.28 | 31.67 |
| #6 | 28 | 40 | 69.89 | 27.57 | 60.55 | 26.45 | 62.16 | 89.86 | 28.57 | 86.02 | 23.08 |
| #7 | 27 | 50 | 130.99 | 60.61 | 53.73 | 58.71 | 55.18 | 152.27 | 16.24 | 148.73 | 13.55 |
| #8 | 26 | 43 | 289.33 | 81.50 | 71.83 | 80.61 | 72.14 | 167.19 | 42.22 | 171.91 | 40.58 |
Disclaimer/Publisher’s Note: The statements, opinions and data contained in all publications are solely those of the individual author(s) and contributor(s) and not of MDPI and/or the editor(s). MDPI and/or the editor(s) disclaim responsibility for any injury to people or property resulting from any ideas, methods, instructions or products referred to in the content. |
© 2025 by the authors. Licensee MDPI, Basel, Switzerland. This article is an open access article distributed under the terms and conditions of the Creative Commons Attribution (CC BY) license (https://creativecommons.org/licenses/by/4.0/).
Share and Cite
Aguado, A.; Rodríguez-Sufuentes, S.; Verdugo, F.; Rodríguez-López, A.; Figols, M.; Dalheimer, J.; Gómez-López, A.; González-Colom, R.; Badyda, A.; Fermoso, J. Verification and Usability of Indoor Air Quality Monitoring Tools in the Framework of Health-Related Studies. Air 2025, 3, 3. https://doi.org/10.3390/air3010003
Aguado A, Rodríguez-Sufuentes S, Verdugo F, Rodríguez-López A, Figols M, Dalheimer J, Gómez-López A, González-Colom R, Badyda A, Fermoso J. Verification and Usability of Indoor Air Quality Monitoring Tools in the Framework of Health-Related Studies. Air. 2025; 3(1):3. https://doi.org/10.3390/air3010003
Chicago/Turabian StyleAguado, Alicia, Sandra Rodríguez-Sufuentes, Francisco Verdugo, Alberto Rodríguez-López, María Figols, Johannes Dalheimer, Alba Gómez-López, Rubèn González-Colom, Artur Badyda, and Jose Fermoso. 2025. "Verification and Usability of Indoor Air Quality Monitoring Tools in the Framework of Health-Related Studies" Air 3, no. 1: 3. https://doi.org/10.3390/air3010003
APA StyleAguado, A., Rodríguez-Sufuentes, S., Verdugo, F., Rodríguez-López, A., Figols, M., Dalheimer, J., Gómez-López, A., González-Colom, R., Badyda, A., & Fermoso, J. (2025). Verification and Usability of Indoor Air Quality Monitoring Tools in the Framework of Health-Related Studies. Air, 3(1), 3. https://doi.org/10.3390/air3010003