Abstract
This study investigates the performance of different demand-controlled ventilation strategies for improving indoor air quality while optimizing energy efficiency. The experimental research was conducted at the Indoor Live Lab at the University of Coimbra using a smart window equipped with mechanical ventilation boxes, occupancy sensors, and a real-time CO2 monitoring system. Several occupancy-based and CO2-based ventilation control strategies were implemented and tested to dynamically adjust ventilation rates according to real-time indoor conditions, including (1) occupancy period-based control, (2) occupancy level-based control, (3) ON-OFF CO₂-based control, (4) multi-level CO₂-based control, and (5) modulating CO₂-based control. The results indicate that intelligent control strategies can significantly reduce energy consumption while maintaining indoor air quality within acceptable limits. Among the CO₂-based controls, strategy 5 achieved optimal performance, reducing energy consumption by 60% compared to the simple ON-OFF strategy, while maintaining satisfactory indoor air quality. Regarding occupancy-based strategies, strategy 2 showed 58% energy savings compared to the simple occupancy period-based control, but with greater CO₂ concentration fluctuation. The results demonstrate that intelligent DCV systems can simultaneously reduce ventilation energy use by 60% and maintain compliant indoor air quality levels, with modulating CO₂-based control proving most effective. The findings highlight the potential of integrating sensor-based ventilation controls in office spaces to achieve energy savings, enhance occupant comfort, and contribute to the development of smarter, more sustainable buildings. Future research should explore the integration of predictive analytics and multi-pollutant sensing to further optimize demand-controlled ventilation performance.
1. Introduction
In modern society, people spend the majority of their time indoors, whether at home, in offices, or in other enclosed environments [1]. The COVID-19 pandemic further increased indoor occupancy time, highlighting the critical importance of maintaining good indoor air quality (IAQ) to ensure occupant health, well-being, and productivity [2,3]. Poor IAQ has been associated with various health problems, including respiratory issues, headaches, and decreased cognitive function, which can significantly impact occupants’ overall performance and comfort [4], and may result in Sick Building Syndrome (SBS) [5,6].
Ventilation plays a crucial role in maintaining IAQ by diluting and removing indoor pollutants. While natural ventilation is a passive, energy-efficient, and sustainable approach, it is highly dependent on external factors such as wind pressure and temperature differences, making it unreliable and difficult to control [7]. Furthermore, fluctuating weather conditions as well as dissimilar occupant behavior can lead to inconsistent ventilation rates, which may either result in inadequate fresh air supply or excessive energy loss due to over-ventilation [8]. To address these limitations, mechanical ventilation systems provide a controlled means of ensuring adequate air exchange. However, mechanical ventilation requires energy input, making it essential to develop smart and efficient control strategies to optimize ventilation performance while minimizing energy consumption [9]. This is particularly important given the European Union’s ambitious energy efficiency targets and the global push towards more sustainable building operations [10].
Several strategies can be employed to enhance IAQ, including source removal, localized extraction, air purification, and ventilation. Among these, ventilation remains one of the most effective approaches for maintaining a healthy indoor environment, especially in office spaces where occupant density can vary significantly throughout the day [11]. Over the past two decades, advancements in sensor technology and smart control systems have enabled the development of intelligent ventilation strategies that dynamically adjust air exchange rates based on real-time indoor conditions [12,13]. By integrating demand-controlled ventilation (DCV) systems that respond to occupancy levels and indoor pollutant concentrations, buildings can achieve a balanced trade-off between IAQ improvement and energy efficiency.
DCV systems dynamically regulate ventilation rates based on real-time measurements of indoor pollutants, such as carbon dioxide (CO2) [14,15], and occupancy levels [16,17,18], ensuring optimal energy use while maintaining acceptable IAQ. These systems operate using either constant air volume (CAV) or variable air volume (VAV) approaches, depending on the control strategy employed. CAV systems maintain a steady airflow rate, adjusting ventilation only through ON-OFF control mechanisms, while VAV systems modulate airflow in response to fluctuating indoor conditions, providing a more adaptive and energy-efficient solution [19,20]. By integrating advanced control algorithms [13], DCV systems can optimize ventilation performance, reducing energy waste while ensuring a healthy indoor environment [21].
This study experimentally evaluates several DCV strategies to optimize energy efficiency and IAQ in office environments. The primary objectives are as follows: (1) to compare the performance of occupancy-based and CO₂-based ventilation controls; (2) to quantify energy savings while maintaining IAQ thresholds (e.g., CO₂ <1000 ppm); and (3) to demonstrate the feasibility of real-time sensor-driven automated control. Experiments were conducted at the Indoor Live Lab (I2L) [22] at the Department of Mechanical Engineering (DEM) at the University of Coimbra (UC), using a smart window system integrated with mechanical ventilators, calibrated CO₂ sensors, and infrared occupancy detectors. Five control strategies—ranging from simple ON-OFF logic to fully dynamic modulation—were tested to identify the optimal approach for maintaining IAQ while minimizing energy consumption. The remainder of this paper is organized as follows: Section 2 describes the methodology, including the experimental setup and data collection approach, and presents the ventilation control strategies evaluated in this study. Section 3 discusses the results and provides a comparative analysis of energy efficiency and IAQ performance. Finally, Section 4 concludes the study and outlines future research directions.
2. Methodology and Experimental Setup
2.1. Method
There are several methods for measuring and evaluating the air exchange rate (AER) caused by infiltration and/or ventilation (both for mechanical and natural ventilation systems) [23]. The most accurate, common, and widely used method is the tracer gas method, in which tracer gas concentration is measured over time with an appropriate gas analyzer. Once the tracer concentration evolution with time is measured, it is possible to evaluate and calculate the air flow rate with an appropriate mathematical analysis. The experiment can be implemented using different methods, such as constant concentration, constant tracer emission, and decay methods [24,25,26]. In this work, the tracer gas decay method is used, being the most common method for single zones.
By means of the recorded concentration over time, the AER can be calculated using the following equation [27]:
where C(t) is the indoor CO2 concentration at the time instant t, Cext is the outdoor environment CO2 concentration, C0 is the indoor initial CO2 concentration at time t = 0, and λ is the AER (symmetrical to the numerical constant in the exponent). Equation (1) can be simplified as follows:
Alternatively, logarithms can be applied to Equation (1) to obtain Equation (3), which allows the linearization of the concentration evolution, as simply described in Equation (4).
Here, the fitting can be performed through linear regression, and the AER is the symmetric of the slope of the obtained line. It should be noted that an outdoor ambient CO2 concentration of 450 ppm is assumed for all tests in this research.
The objective of this research is to develop, test, and evaluate the performance of several mechanical DCV strategies. The mechanical DCV strategies are defined considering the indoor concentration of CO2 and the occupancy level as the input signals and the fan speed/power as the output signal. The ventilation control strategies are settled and implemented using the applications developed in LabVIEW 2016, and are tested on the experimental prototypes of ventilator boxes at the I2L. The I2L has been developed as a new platform for research and technology demonstration related to indoor environmental quality (IEQ) and energy consumption at DEM, UC, enabling researchers to access continuously monitored data on IEQ and energy use for all aspects of building functioning.
2.2. Experimental Setup and Functionality Test
For this research, the first step was to design and build the mechanical ventilator boxes. Two ventilator boxes were built using both linear (tangential) and centrifugal blowers (ebm-papst, Mulfingen, Germany). One was equipped with a DC centrifugal blower with 14 watts of input power and a nominal voltage ranging from 16 to 28 volts, and the other was equipped with a DC linear blower with 8.7 watts of input power and a nominal voltage ranging from 8 to 14 volts. The mechanical ventilator boxes were installed in the I2L in order to be tested. Figure 1 presents the prototype installation process at the I2L office.
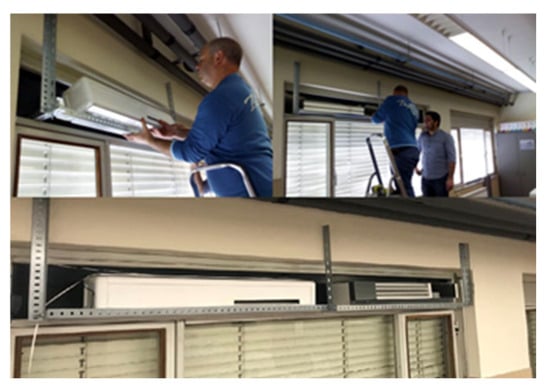
Figure 1.
Installation of ventilator boxes at I2L.
Moreover, an infrared occupancy counter sensor [28,29] was developed and installed at the entrance of the I2L. This was implemented with two units of SHARP infrared distance sensors, installed next to each other at the entrance and perpendicular to the occupants’ movement direction. The occupancy counter detects the direction of movement of the occupants when passing through the office door (entering/leaving). Then, the signals from the infrared sensors were treated using the application developed in LabVIEW, resulting in the real-time occupancy level being presented on the screen. Figure 2 shows the development phase of the occupancy counter and the installed sensor at the entrance of the I2L. This counter is used to collect information about the occupancy level in the room to pilot the ventilation strategy algorithms.
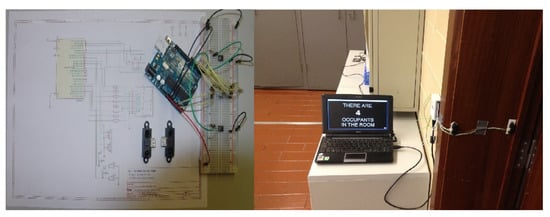
Figure 2.
The occupancy counter sensor development and installation at the I2L entrance, and the screen showing real-time occupancy level.
Furthermore, as shown in Figure 3, the I2l was equipped with an Extech (Pittsburgh, PA, USA) SD800 device which was used to record CO2 concentration at a rate of one sample per minute. This sensor enabled testing the CO2-based ventilation strategies using the accurate real-time concentration level recorded by the sensor.
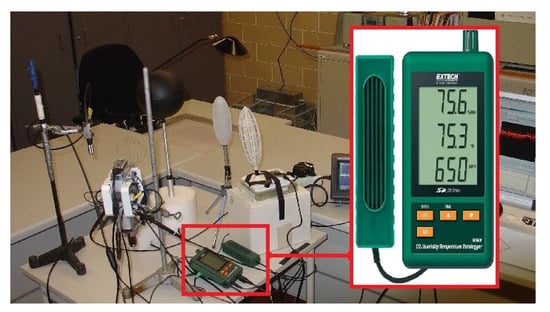
Figure 3.
The Extech SD800 device, among other IEQ instrumentation and data acquisition tools at the I2L.
Before running the tests for ventilation control strategies and in order to check the functionality of the developed testing platform, an example test was performed overnight. To undertake this, when all windows were closed, as shown in Figure 4, CO2 was injected into the room environment using a fire extinguisher and mixed.
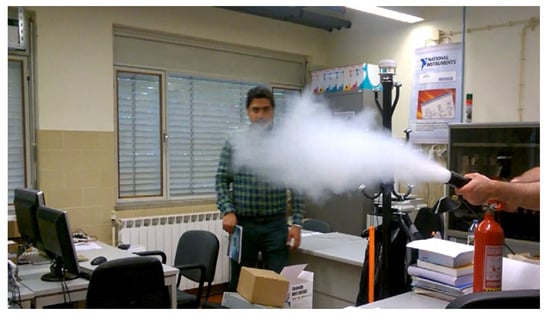
Figure 4.
Releasing CO2 into the I2L office for the evaluation of AER.
When the concentration reached an amount around 1800 ppm, the ventilator was switched on at maximum power and everyone left the room to assess the AER of concentration decay during a non-occupancy period. This example test enabled us to find out the possible errors in the experimental setup and troubleshoot them to achieve more precise results. Figure 5 illustrates the concentration decay observed during this test, along with the linear regression of the concentration difference between the indoor and outdoor environments. The red line represents the selected profile chosen for the calculation of the AER. The AER was determined to be 0.59 h⁻1, and the coefficient of determination (R2 = 0.9978) indicates a strong correlation between the data and the fitted regression line.
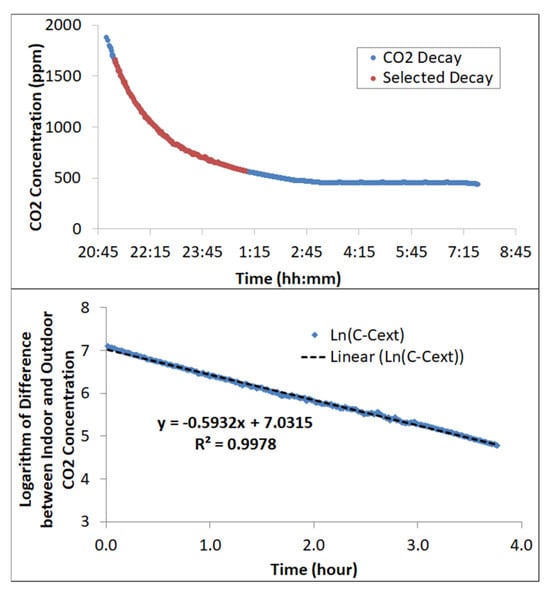
Figure 5.
Example test of CO2 concentration decay and linear regression of the concentration difference between indoor and outdoor environments (linear blower).
Additionally, a test was conducted with the ventilator switched off to evaluate the air exchange rate under natural ventilation conditions. Including both scenarios—maximum fan power and complete shutdown—provides a representation of two operational extremes. This approach offers a more comprehensive understanding of the full range of achievable AER values, as well as insight into the baseline ventilation performance of the space in the absence of mechanical support. In comparison, while the fan-assisted condition yielded an AER of 0.59 h⁻1 and reduced the CO₂ concentration to 500 ppm in approximately 4 h, the latter case resulted in a considerably lower AER of 0.18 h⁻1, requiring over 16 h to reach the same concentration level. This difference underscores the significant contribution of mechanical ventilation to air renewal in the room.
Although the example test was carried out using both centrifugal and linear ventilator boxes, only the results from the linear blower are presented above. This is due to better performance of the linear fan compared to the centrifugal one, as well as its lower energy consumption and reduced noise level, which enhances occupants’ acoustic comfort. For the same reason, the results from the DCV strategies using the linear ventilator box are presented in this article.
2.3. Control Strategies
2.3.1. Control Strategy 1 (Occupancy Period-Based)
In this strategy, regardless of the number of occupants, the linear fan operates at maximum power whenever the room is occupied, and when the room is unoccupied, the ventilation system remains off. This approach follows a CAV ventilation principle, ensuring a consistent airflow rate whenever the space is in use.
2.3.2. Control Strategy 2 (Occupancy Level-Based)
Unlike the previous strategy, this approach adjusts the fan speed based on the number of occupants in the room. The linear fan operates at a specific percentage of its maximum power, set at 20% per occupant, ensuring a more dynamic and efficient ventilation response. This strategy follows the VAV principle, modulating airflow in real time to match occupancy levels. Figure 6 shows the flowchart of the two control strategies.
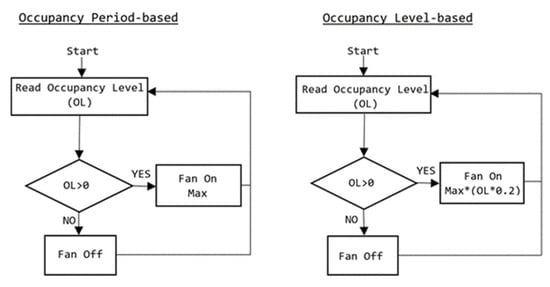
Figure 6.
Flowchart of ventilation control strategies 1 and 2.
2.3.3. Control Strategy 3 (Double Set-Point ON-OFF CO2-Based)
This strategy regulates ventilation based on indoor CO2 concentration levels, ensuring that fresh air is supplied only when needed. Two set-points are defined: a maximum threshold of 1000 ppm and a minimum threshold of 500 ppm. The ventilation system remains off until the CO2 concentration exceeds the maximum set-point, at which point the fan is activated to reduce indoor pollutant levels. Once the concentration decreases to 500 ppm or below, the fan switches off, preventing unnecessary energy consumption. This approach also follows the CAV ventilation principle, as the fan always operates at full capacity when activated.
2.3.4. Control Strategy 4 (Multi-Level CO2-Based)
This strategy dynamically adjusts ventilation rates based on indoor CO2 concentration levels using three predefined set-points: 1000 ppm, 750 ppm, and 500 ppm. Unlike the ON-OFF approach, the ventilator operates at different power levels depending on the CO2 concentration, following a VAV control principle.
- -
- Above 1000 ppm: The ventilator runs at maximum power to quickly reduce CO2 levels.
- -
- Between 750 ppm and 1000 ppm: The fan operates at a moderate power level to maintain adequate IAQ.
- -
- Between 500 ppm and 750 ppm: The ventilator runs at a lower power setting, ensuring minimal energy use while still providing fresh air.
- -
- Below 500 ppm: The fan turns off.
2.3.5. Control Strategy 5 (Modulating CO2-Based)
This strategy regulates ventilation by continuously adjusting the fan speed based on real-time CO2 concentration levels, following a VAV control principle. Two set-points are defined: a maximum threshold of 1000 ppm and a minimum threshold of 500 ppm. The ventilator’s operation is modulated as follows:
- -
- Above 1000 ppm: The fan runs at maximum power to rapidly lower CO2 levels.
- -
- Between 500 ppm and 1000 ppm: The fan operates at a variable speed, adjusting proportionally to the difference between the measured CO2 concentration and the two set-points. The closer the concentration is to 1000 ppm, the higher the fan speed, and vice versa.
- -
- Below 500 ppm: The fan turns off.
Figure 7 shows the flowchart of the three control strategies.

Figure 7.
Flowchart of ventilation control strategies 3, 4, and 5.
3. Results and Discussion
The two occupancy-based strategies were evaluated over two entire days at the I2L. Figure 8 and Figure 9 show the indoor CO2 concentration and the occupancy level in the test room for strategies 1 and 2, respectively.
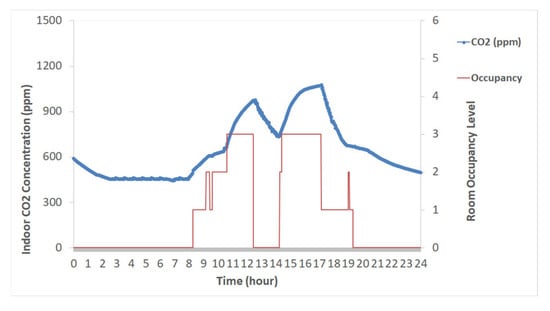
Figure 8.
CO2 concentration and occupancy level over a day for control strategy 1.
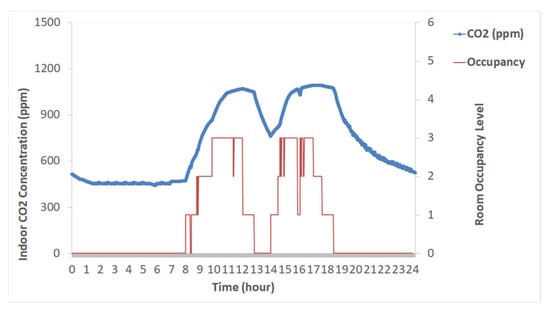
Figure 9.
CO2 concentration and occupancy level over a day for control strategy 2.
These figures show that during the occupancy period, the concentration slightly exceeded the popular value (1000 ppm) [30], but still maintained a good IAQ, while the fan energy consumption in the first strategy is more than twice that of the second strategy. While control strategy 1 is simple to implement, it does not account for variations in occupancy levels or indoor air quality fluctuations, potentially leading to over-ventilation and unnecessary energy consumption when fewer occupants are present. However, it guarantees that fresh air is supplied during occupancy, contributing to improved IAQ and occupant comfort. This emphasizes the importance of well designed and implemented DCV to avoid over ventilation. In control strategy 2, by scaling ventilation rates according to the number of occupants, this approach optimizes energy consumption while maintaining IAQ. Compared to CAV ventilation, it reduces over-ventilation during periods of low occupancy and enhances energy efficiency. However, the effectiveness of this strategy depends on accurate and real-time occupancy detection to ensure appropriate air exchange rates. Table 1 represents the maximum and average CO2 concentration and average occupancy level in the I2L during the occupancy period, as well as the energy consumption for each strategy. As the occupancy level is not the same in the two experiments, a definite comparison of the results cannot be made, but it is obvious that the second strategy performed at almost the same level considering IAQ, while delivering a noticeable energy saving of about 58%. Although the preliminary results suggest strategy 2′s efficiency, larger-scale studies are still needed to confirm robustness across diverse occupancy patterns.

Table 1.
Results of occupancy-based ventilation control strategies.
The performance of the three CO2-based control strategies (control strategies 3, 4, and 5) was evaluated during unoccupied periods over three consecutive nights. During these tests, all windows and doors remained closed to ensure a controlled environment. Unlike the occupancy-based tests, where metabolic CO2 was the primary source, a fire extinguisher was used to inject CO2 into the room, raising the concentration to approximately 2000 ppm before leaving. This setup allowed for a controlled and repeatable evaluation of the ventilation strategies by monitoring the concentration decay between 1500 ppm and 500 ppm, ensuring a fair comparison of each approach. Figure 10 presents the concentration decay curves, the corresponding linear regression fits, and the fan operation power levels for each control strategy. The data revealed key differences in how each strategy managed CO₂ levels and energy consumption.
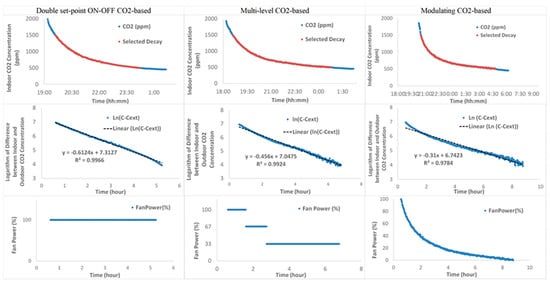
Figure 10.
CO2 concentration decay, logarithm regression, and fan power for control strategies 3, 4, and 5.
The comparison of ventilation performance in the CO2-based control strategies shows that the choice of control logic significantly impacts both energy efficiency and IAQ. The double set-point ON-OFF strategy (control strategy 3) effectively maintained IAQ, but at the cost of higher energy consumption due to its binary operation mode. The fan remained inactive until CO2 levels exceeded 1000 ppm, at which point it switched on at full power until the concentration dropped below 500 ppm, leading to frequent activation cycles and noticeable fluctuations in IAQ. In contrast, the multi-level CO2-based strategy (control strategy 4) introduced intermediate set-points at 1000 ppm, 750 ppm, and 500 ppm, allowing the fan to operate at three discrete power levels. This approach smoothed out concentration variations and improved energy efficiency, consuming 33% less energy than strategy 3.
Among the tested strategies, the modulating CO2-based control (control strategy 5) demonstrated the best overall performance, dynamically adjusting the fan speed proportionally to real-time CO2 concentrations between the two set-points. This method provided a continuous and adaptive ventilation response, preventing abrupt changes in IAQ while minimizing energy use. As a result, control strategy 5 achieved the lowest energy consumption, reducing energy consumption by 60% compared to control strategy 3 and 40% compared to control strategy 4, while maintaining stable CO2 levels throughout the test period.
Although these three ventilation strategies were tested during the non-occupancy period, the results, summarized in Table 2, show that the strategies were well implemented and completely functional. Moreover, the results indicated that linking ventilation power to multiple set-points or continuously modulating it in response to air quality fluctuations (proportional to the real concentration level) is a more effective approach for optimizing both IAQ and energy efficiency in demand-controlled ventilation systems.

Table 2.
Results of CO2-based ventilation control strategies.
4. Conclusions and Future Work
This study experimentally evaluated different demand-controlled ventilation strategies to improve indoor air quality while optimizing energy consumption in an office environment. The results highlight the significant role of smart ventilation control in balancing IAQ and energy efficiency, demonstrating that integrating sensor-based control mechanisms can lead to substantial improvements compared to traditional ventilation approaches. By employing occupancy-based and CO2-based ventilation strategies, the study investigated how real-time monitoring and automated control can enhance ventilation efficiency while ensuring occupant comfort.
The findings indicate that occupancy-based strategies, which rely on simple sensor triggers, provide an effective means of reducing ventilation energy use by 58% compared to CAV systems that operate continuously. However, more sophisticated CO2-based strategies allow for better adaptability to indoor pollutant levels, thereby ensuring that ventilation rates dynamically respond to actual IAQ conditions rather than just occupancy presence. Among the tested strategies, modulating CO2-based control (control strategy 5) proved to be the most effective, offering a dynamic and proportional response to pollutant levels, minimizing both over-ventilation and under-ventilation, and achieving the highest energy savings (about 60%).
Despite the advantages of intelligent ventilation strategies, their performance and effectiveness depend on several key factors, including accurate sensor calibration, real-time data processing, and responsive control algorithms. Reliable CO2 sensors are essential for ensuring precise measurements, as any calibration errors can lead to over-ventilation or insufficient air exchange, compromising both energy efficiency and occupant health. Additionally, the adaptability of DCV strategies to dynamic occupancy patterns, environmental conditions, and system constraints further influences their efficiency. While simpler ON-OFF control strategies (such as control strategy 3) may be easier to implement, they tend to create more ventilation cycles that lead to unnecessary energy consumption. More advanced approaches (such as control strategies 4 and 5) require well-calibrated sensors and fine-tuned control mechanisms to prevent system inefficiencies and ensure stable IAQ, with average CO2 concentrations of 747 and 716 ppm, respectively. Therefore, the choice of ventilation strategy should be carefully considered based on installation complexity, sensor reliability, and operational goals.
This study has several limitations: (1) As a single-site lab experiment in a 25 m2 test room, the results may not fully represent real offices with diverse layouts or HVAC systems. (2) Focusing solely on CO₂ excludes other pollutants (VOCs/PM2.5) needing different ventilation responses. (3) The findings may not scale directly to larger spaces. (4) Occupant behaviors (window-opening, personal adjustments) were not assessed. We recommend community trials to verify energy savings, evaluate multi-zone contamination risks, and test maintenance requirements in real workplaces.
As the global demand for energy-efficient buildings grows, future research should focus on further enhancing DCV strategies through machine learning and predictive analytics. Real-time data-driven models could improve ventilation efficiency by anticipating occupancy patterns and adjusting air exchange rates proactively. Additionally, integrating multi-pollutant sensing (e.g., VOCs, humidity, and particulate matter) into ventilation control algorithms could provide a more comprehensive approach to IAQ management.
Future work should also explore the impact of climate conditions and building characteristics on the performance of DCV strategies. Expanding experimental studies to different building types, including residential and commercial spaces, could provide valuable insights into how these strategies perform under varying conditions. Furthermore, hybrid ventilation systems that combine natural and mechanical ventilation in an intelligent manner could be investigated to maximize both sustainability and operational efficiency [31]. Building on this research, the authors are developing EnviroSense—Smart Well-being for Every Space, an innovative project designed to develop a portable set of sensors monitoring IEQ and occupant health in real time, focused on enhancing well-being and energy efficiency. By leveraging advanced technologies for environmental monitoring and control, the project aims to propose smart solutions that promote healthier and more sustainable indoor environments. Moreover, complementary to this study, which demonstrated the technical feasibility of the proposed strategies, future research should include comprehensive cost–benefit analyses encompassing equipment, installation, and maintenance costs versus energy savings to facilitate real-world adoption by building operators.
In summary, this study reinforces the importance of smart control systems in buildings, demonstrating that linking ventilation power to real-time environmental conditions can significantly improve both energy efficiency and IAQ. As technology advances, the continued development of adaptive, data-driven control strategies will be essential for creating healthier and more sustainable indoor environments.
Author Contributions
B.C.: Conceptualization, Data curation, Formal analysis, Investigation, Methodology, Validation, Funding acquisition, Visualization, and Writing—original draft. S.S.: Investigation, Visualization, and Writing—review and editing. M.G.d.S.: Supervision and Writing—review and editing. All authors have read and agreed to the published version of the manuscript.
Funding
This research was funded by the Association for the Development of Industrial Aerodynamics (ADAI), the Associate Laboratory of Energy, Transports and Aeronautics (LAETA) and the Portuguese Foundation for Science and Technology (FCT) through the projects UIDB/50022/2020 (DOI: 10.54499/UIDB/50022/2020), UIDP/50022/2020 (DOI: 10.54499/UIDP/50022/2020) and LA/P/0079/2020 (DOI: 10.54499/LA/P/0079/2020).
Institutional Review Board Statement
Not applicable.
Informed Consent Statement
Not applicable.
Data Availability Statement
Data are available on request from the corresponding author.
Use of Artificial Intelligence
AI or AI-assisted tools were not used in drafting any aspect of this manuscript.
Acknowledgments
The first author wishes to acknowledge the DRIVOLUTION project Transição para a fábrica do futuro (7141 02/C05-i01.02/2022.PC644913740–00000022-23), which was financed by the PRR Recovery and Resilience Plan and by NextGenerationEU European Funds, following NOTICE No 02/C05-i01/2022 and the EnviroSense Project funded by Santander Portugal Foundation under the 6th Edition of “Seed Projects for Interdisciplinary Research”, promoted by the University of Coimbra (PEP: PT0058.A.12.D), for supporting his research.
Conflicts of Interest
The authors state no conflicts of interest.
Abbreviations
The following abbreviations are used in this manuscript:
| AER | Air Exchange Rate |
| CAV | Constant Air Volume |
| CO2 | Carbon Dioxide |
| DC | Direct Current |
| DCV | Demand-Controlled Ventilation |
| DEM | Department of Mechanical Engineering |
| I2L | Indoor Live Lab |
| IAQ | Indoor Air Quality |
| IEQ | Indoor Environmental Quality |
| OL | Occupancy Level |
| SBS | Sick Building Syndrome |
| UC | University of Coimbra |
| VAV | Variable Air Volume |
| VOCs | Volatile Organic Compounds |
References
- Aguado, A.; Rodríguez-Sufuentes, S.; Verdugo, F.; Rodríguez-López, A.; Figols, M.; Dalheimer, J.; Gómez-López, A.; González-Colom, R.; Badyda, A.; Fermoso, J. Verification and Usability of Indoor Air Quality Monitoring Tools in the Framework of Health-Related Studies. Air 2025, 3, 3. [Google Scholar] [CrossRef]
- Correia, G.; Rodrigues, L.; Afonso, M.; Mota, M.; Oliveira, J.; Soares, R.; Tomás, A.L.; Reichel, A.; Silva, P.M.; Costa, J.J.; et al. SARS-CoV-2 air and surface contamination in residential settings. Sci. Rep. 2022, 12, 18058. [Google Scholar] [CrossRef] [PubMed]
- Chenari, B.; Carrilho, J.D.; Da Silva, M.G. Towards sustainable, energy-efficient and healthy ventilation strategies in buildings: A review. Renew. Sustain. Energy Rev. 2016, 59, 1426–1447. [Google Scholar] [CrossRef]
- Holder, J.; Jordan, J.; Johnson, K.; Akinremi, A.; Roberts-Semple, D. Using Low-Cost Sensing Technology to Assess Ambient and Indoor Fine Particulate Matter Concentrations in New York during the COVID-19 Lockdown. Air 2023, 1, 196–206. [Google Scholar] [CrossRef]
- Shao, Z.; Wu, C.; Shao, Q.; Yang, J.; Xie, M. Prevalence of Sick Building Syndrome Symptoms in Residents During the COVID-19 Pandemic—A Case Study of Suzhou City, China. Buildings 2024, 14, 3388. [Google Scholar] [CrossRef]
- Wang, M.; Li, L.; Hou, C.; Guo, X.; Fu, H. Building and Health: Mapping the Knowledge Development of Sick Building Syndrome. Buildings 2022, 12, 287. [Google Scholar] [CrossRef]
- Honan, D.; Gallagher, J.; Garvey, J.; Littlewood, J. Indoor Air Quality in Naturally Ventilated Primary Schools: A Systematic Review of the Assessment & Impacts of CO2 Levels. Buildings 2024, 14, 4003. [Google Scholar] [CrossRef]
- Pourtangestani, M.; Izadyar, N.; Jamei, E.; Vrcelj, Z. Linking Occupant Behavior and Window Design through Post-Occupancy Evaluation: Enhancing Natural Ventilation and Indoor Air Quality. Buildings 2024, 14, 1638. [Google Scholar] [CrossRef]
- Tronchin, L.; Fabbri, K.; Bertolli, C. Controlled Mechanical Ventilation in Buildings: A Comparison between Energy Use and Primary Energy among Twenty Different Devices. Energies 2018, 11, 2123. [Google Scholar] [CrossRef]
- Proposal for a Directive of the European Parliament and of the Council Amending Directive 2010/31/EU on the Energy Performance of Buildings. COM (2016) 765 Final. Available online: http://eur-lex.europa.eu/resource.html?uri=cellar:4908dc52-b7e5-11e6-9e3c-01aa75ed71a1.0023.02/DOC_1&format=PDF (accessed on 28 March 2025).
- Kuutti, J.; Blomqvist, K.H.; Sepponen, R.E. Evaluation of Visitor Counting Technologies and Their Energy Saving Potential through Demand-Controlled Ventilation. Energies 2014, 7, 1685–1705. [Google Scholar] [CrossRef]
- Chaudhari, P.; Xiao, Y.; Cheng, M.M.C.; Li, T. Fundamentals, Algorithms, and Technologies of Occupancy Detection for Smart Buildings Using IoT Sensors. Sensors 2024, 24, 2123. [Google Scholar] [CrossRef]
- Cano-Suñén, E.; Martínez, I.; Fernández, Á.; Zalba, B.; Casas, R. Internet of Things (IoT) in Buildings: A Learning Factory. Sustainability 2023, 15, 12219. [Google Scholar] [CrossRef]
- Pistochini, T.; Ellis, M.; Meyers, F.; Frasier, A.; Cappa, C.; Bennett, D. Method of test for CO2-based demand control ventilation systems: Benchmarking the state-of-the-art and the undervalued potential of proportional-integral control. Energy Build. 2023, 301, 113717. [Google Scholar] [CrossRef]
- Lu, T.; Lü, X.; Viljanen, M. A novel and dynamic demand-controlled ventilation strategy for CO2 control and energy saving in buildings. Energy Build. 2011, 43, 2499–2508. [Google Scholar] [CrossRef]
- Mysen, M.; Berntsen, S.; Nafstad, P.; Schild, P.G. Occupancy density and benefits of demand-controlled ventilation in Norwegian primary schools. Energy Build. 2005, 37, 1234–1240. [Google Scholar] [CrossRef]
- Chenari, B.; Lamas, F.B.; Gaspar, A.R.; Da Silva, M.G. Simulation of Occupancy and CO2-based Demand-controlled Mechanical Ventilation Strategies in an Office Room Using EnergyPlus. Energy Procedia 2017, 113, 51–57. [Google Scholar] [CrossRef]
- Jin, M.; Bekiaris-Liberis, N.; Weekly, K.; Spanos, C.J.; Bayen, A.M. Occupancy Detection via Environmental Sensing. IEEE Trans. Autom. Sci. Eng. 2018, 15, 443–455. [Google Scholar] [CrossRef]
- Lin, X.; Lau, J. Applying Demand-Controlled Ventilation. ASHRAE January 2016. Available online: https://www.aircuity.com/wp-content/uploads/Applying-Demand-Control-Ventilation-ASHRAE-Journal-Jan-2016.pdf (accessed on 28 March 2025).
- O’Neill, Z.D.; Li, Y.; Cheng, H.C.; Zhou, X.; Taylor, S.T. Energy savings and ventilation performance from CO2-based demand controlled ventilation: Simulation results from ASHRAE RP-1747 (ASHRAE RP-1747). Sci. Technol. Built Environ. 2020, 26, 257–281. [Google Scholar] [CrossRef]
- Fisk, W.J.; De Almeida, A.T. Sensor-based demand-controlled ventilation: A review. Energy Build. 1998, 29, 35–45. [Google Scholar] [CrossRef]
- Pereira, L.D.; Carrilho, J.D.; Brito, N.S.; Gomes, M.R.; Mateus, M.; Chenari, B.; da Silva, M.G. Teaching and researching the indoor environment: From traditional experimental techniques towards web-enabled practices. Sustain. Cities Soc. 2016, 26, 543–554. [Google Scholar] [CrossRef]
- Charlesworth, P.S. Air Exchange Rate and Airtightness Measurement Techniques—An Application Guide; Air Infiltration and Ventilation Centre: Coventry, UK, 1988; Available online: https://www.aivc.org/resource/ag-air-exchange-rate-and-airtightness-measurement-techniques-application-guide (accessed on 29 March 2025).
- Claude-Alain, R.; Foradini, F.; Roulet, C.-A. Simple and Cheap Air Change Rate Measurement Using CO2 Concentration Decays. Int. J. Vent. 2002, 1, 39–44. [Google Scholar] [CrossRef]
- Godwin, C.; Batterman, S. Indoor air quality in Michigan schools. Indoor Air 2007, 17, 109–121. [Google Scholar] [CrossRef] [PubMed]
- Coley, D.A.; Beisteiner, A. Carbon Dioxide Levels and Ventilation Rates in Schools. Int. J. Vent. 2002, 1, 45–52. [Google Scholar] [CrossRef]
- Asadi, E.; Costa, J.J.; da Silva, M.G. Indoor air quality audit implementation in a hotel building in Portugal. Build. Environ. 2011, 46, 1617–1623. [Google Scholar] [CrossRef]
- Nguyen, T.A.; Aiello, M. Energy intelligent buildings based on user activity: A survey. Energy Build. 2013, 56, 244–257. [Google Scholar] [CrossRef]
- Jin, M.; Jia, R.; Spanos, C.J. Virtual Occupancy Sensing: Using Smart Meters to Indicate Your Presence. IEEE Trans. Mob. Comput. 2017, 16, 3264–3277. [Google Scholar] [CrossRef]
- Alalawi, M.; Krarti, M. Experimental evaluation of CO2-based demand-controlled ventilation strategies. ASHRAE Trans. 2002, 108, 307–317. [Google Scholar]
- Otoo, C.; Lu, T.; Lü, X. Application of Mixed-Mode Ventilation to Enhance Indoor Air Quality and Energy Efficiency in School Buildings. Energies 2024, 17, 6097. [Google Scholar] [CrossRef]
Disclaimer/Publisher’s Note: The statements, opinions and data contained in all publications are solely those of the individual author(s) and contributor(s) and not of MDPI and/or the editor(s). MDPI and/or the editor(s) disclaim responsibility for any injury to people or property resulting from any ideas, methods, instructions or products referred to in the content. |
© 2025 by the authors. Licensee MDPI, Basel, Switzerland. This article is an open access article distributed under the terms and conditions of the Creative Commons Attribution (CC BY) license (https://creativecommons.org/licenses/by/4.0/).