Abstract
It is crucial to assess health impacts of PM2.5, especially from wildfire smoke, to ensure proper planning for healthcare services. Studies often focus on respiratory conditions; fewer estimate the additional burden of cardiovascular complications. This study aims to extend previous work on the impacts of wildfire smoke and associated PM2.5 on health in Southern Oregon by expanding study areas and timeframes, including cardiovascular conditions, and applying improved and novel air quality measurement data. This study adopts a case-crossover approach using conditional Poisson regression to analyze time stratified patient counts while controlling for mean temperature. Every 10 μg/m3 increase in PM2.5 is associated with a 1.6% increase in same-day hospital or emergency room admission rates for respiratory conditions (OR = 1.0157; 95% CI: 1.0024–1.0287) and no significant increase in admission rates for cardiovascular conditions. A 10 μg/m3 increase in PM2.5 lasting fifteen days is associated with a 6.5% increase in hospital or emergency room admission rates for respiratory conditions (OR = 1.0645; 95% CI: 1.0400–1.0894) and a 4.9% increase in hospital or emergency room admission rates for cardiovascular conditions (OR = 1.0493; 95% CI: 1.0265–1.0723). As the duration of poor air quality increases, the risk of negative respiratory and cardiovascular health outcomes increases.
1. Introduction
Wildfires pose a significant and growing threat across the United States, with climate-induced increases in temperature and dryness likely to further escalate these risks [1,2,3]. In the western United States, wildfires may account for up to half of all fine particulate matter (PM2.5) pollution, representing a major contribution to air quality degradation [4]. As the wildfire threat grows, communities face mounting challenges from smoke exposure and the associated health impacts [5,6].
Wildfire smoke exposure has been consistently linked to adverse health outcomes, particularly respiratory conditions. A systematic review found increased risks for emergency department visits related to smoke exposure in North America (OR = 1.10; 95% CI: 1.09, 1.12), and elevated risks for both cardiovascular disease (OR = 1.05; 95% CI: 1.03, 1.08) and respiratory disease (OR = 1.07; 95% CI: 1.06, 1.09) globally [7]. These findings align with meta-analyses showing a risk ratio of 1.07 (95% CI: 1.04—1.09) for asthma-related emergency department visits, given a 10 μg/m3 increase in PM2.5 [8]. Emergency department visits for asthma and COPD may increase by 30% to 110% in the week following an extreme smoke day [9], with elevated PM2.5 levels particularly impacting patients with pre-existing respiratory conditions [10,11]. While studies have documented clear evidence of impacts on respiratory outcomes [12,13,14,15,16,17], findings regarding cardiovascular outcomes have been less consistent [1,9]. Though Wettstein et al. [18] found that respiratory, cardiovascular, and cerebrovascular emergency department visits all increase with dense smoke exposure lasting up to four days. Importantly, health impacts can vary based on factors including fuel composition, population behavior [10], and temporal patterns, with potential nonlinear relationships between exposure and health outcomes [1].
The choice of an air quality measurement approach may influence our understanding of smoke-related health impacts. Traditional methods rely on PM2.5 measurements from stationary monitors, but these monitors are often too sparsely distributed to capture the complex spatial and temporal patterns of wildfire smoke dispersion [1,19]. While satellite-based measurements and dispersion modeling can provide broader spatial coverage, they may miss important local variations in smoke concentrations [1,20]. Techniques that blend monitor and modelling approaches may be useful for deriving more accurate exposure estimates [6,21]. Estimating wildfire smoke pollution across a landscape is challenging, highlighting the need to carefully consider measurement approaches when designing studies and interpreting results.
This study addresses two ongoing gaps in the literature: (1) findings related to the impact of cardiovascular complications are largely mixed. We examine the impact of wildfire smoke exposure on cardiovascular issues, in addition to the more commonly studied respiratory problems. This approach builds upon prior research in the region focused on the impact of smoke exposure on respiratory illnesses alone [16,17]. (2) This study uses a novel exposure dataset to account for challenges related to measuring pollution dispersion across varied landscapes. The analysis controlled for mean temperature and used daily mean PM2.5 concentrations derived from airshed scaling factors applied to monitor values at a 4 km resolution. To maintain consistency with recent papers, we employed a time-stratified case-crossover design with conditional Poisson regression to analyze the respiratory and cardiovascular health impacts of wildfire smoke exposure across Josephine, Jackson, and Klamath Counties in southwestern Oregon from 2016 through 2022.
2. Materials and Methods
In this study, we employed a time-stratified case-crossover design with conditional Poisson regression to analyze the health impacts of air pollution. Following Armstrong, Gasparrini, and Tobias [22], we applied conditional Poisson regression to aggregated daily patient counts within time strata defined by year, month, and day of week. This approach maintains the self-matching property of case-crossover designs while appropriately handling count data. This analytical approach has been used for studying air pollution health impacts [22,23,24,25,26,27,28,29,30]. This approach is equivalent to using conditional logistic regression in a case-crossover framework when analyzing aggregated count data [22,24] and produces results comparable to Poisson time-series analyses [24,25]. In this design, the study population serves as their own controls [26], with each stratum comparing days with varying pollution levels but identical temporal characteristics, such as all Mondays in January 2016. This self-matching approach effectively controls for time-varying covariates, including seasonal patterns, day-of-week effects, and year-specific trends [27,28,29,30]. Compared to traditional time-series regressions, this method offers better control of temporal confounding by design and requires fewer arbitrary analytical decisions [23,25,27].
The analysis was conducted using the R code in the Supplemental Materials and was based on the gnm library, modeling patient counts as a function of PM2.5 and mean temperature, while controlling for time using strata defined by day of week, month, and year (gnm(formula = PatientCount ~ PM2.5 + MeanTemperature, eliminate = factor(TimeStrata), family = poisson(), data = DataTable)). We focused specifically on PM2.5 as the primary indicator of wildfire smoke exposure, with temperature included as a control variable due to its known association with respiratory outcomes, while other variables, such as relative humidity, were excluded due to their strong correlation with temperature and limited spatial variation across the study area. We modeled the relationship between PM2.5 exposure and health outcomes using a nonlinear approach to account for the documented nonlinear dose–response relationship between air pollution and health effects [9].
Temperature data were obtained from weather stations located in Grants Pass, Klamath Falls, and Medford, with temperature values associated with the nearest air quality monitors. These temperature measurements were then assigned to patients based on the same air quality monitor pairings used for their PM2.5 exposure assessment.
The study area comprises Josephine, Jackson, and Klamath Counties in southwestern Oregon. The study timeframe encompasses the years 2016 through 2022 rather than focusing solely on traditional wildfire seasons. This approach was chosen because elevated PM2.5 concentrations in the study region do not align well with the traditional May through September wildfire season classification. In addition, including year-round data establishes important baseline conditions for comparison. The case-crossover design inherently controls for seasonal effects within the analysis, allowing for this approach. Additionally, by using PM2.5 as our exposure variable rather than attempting to classify specific days as “wildfire” or “non-wildfire” days, we avoid potential misclassification issues while maintaining a focus on the health impacts of poor air quality regardless of source.
2.1. Health Data
Patient diagnoses and home coordinates at a 4 km resolution were obtained from four of the five hospitals in the study area, including Sky Lakes Medical Center, Ashland Community Hospital, Rogue Regional Medical Center, and Three Rivers Medical Center. Patient records with a primary discharge diagnosis within the I00-I99 (cardiovascular disease) and J00-J99 (respiratory disease) ICD-10 codes within the study timeframe were retained for a total N = 24,421 with a home location within the study area. This study was deemed exempt from IRB oversight by the Southern Oregon IRB on 12 January 2023.
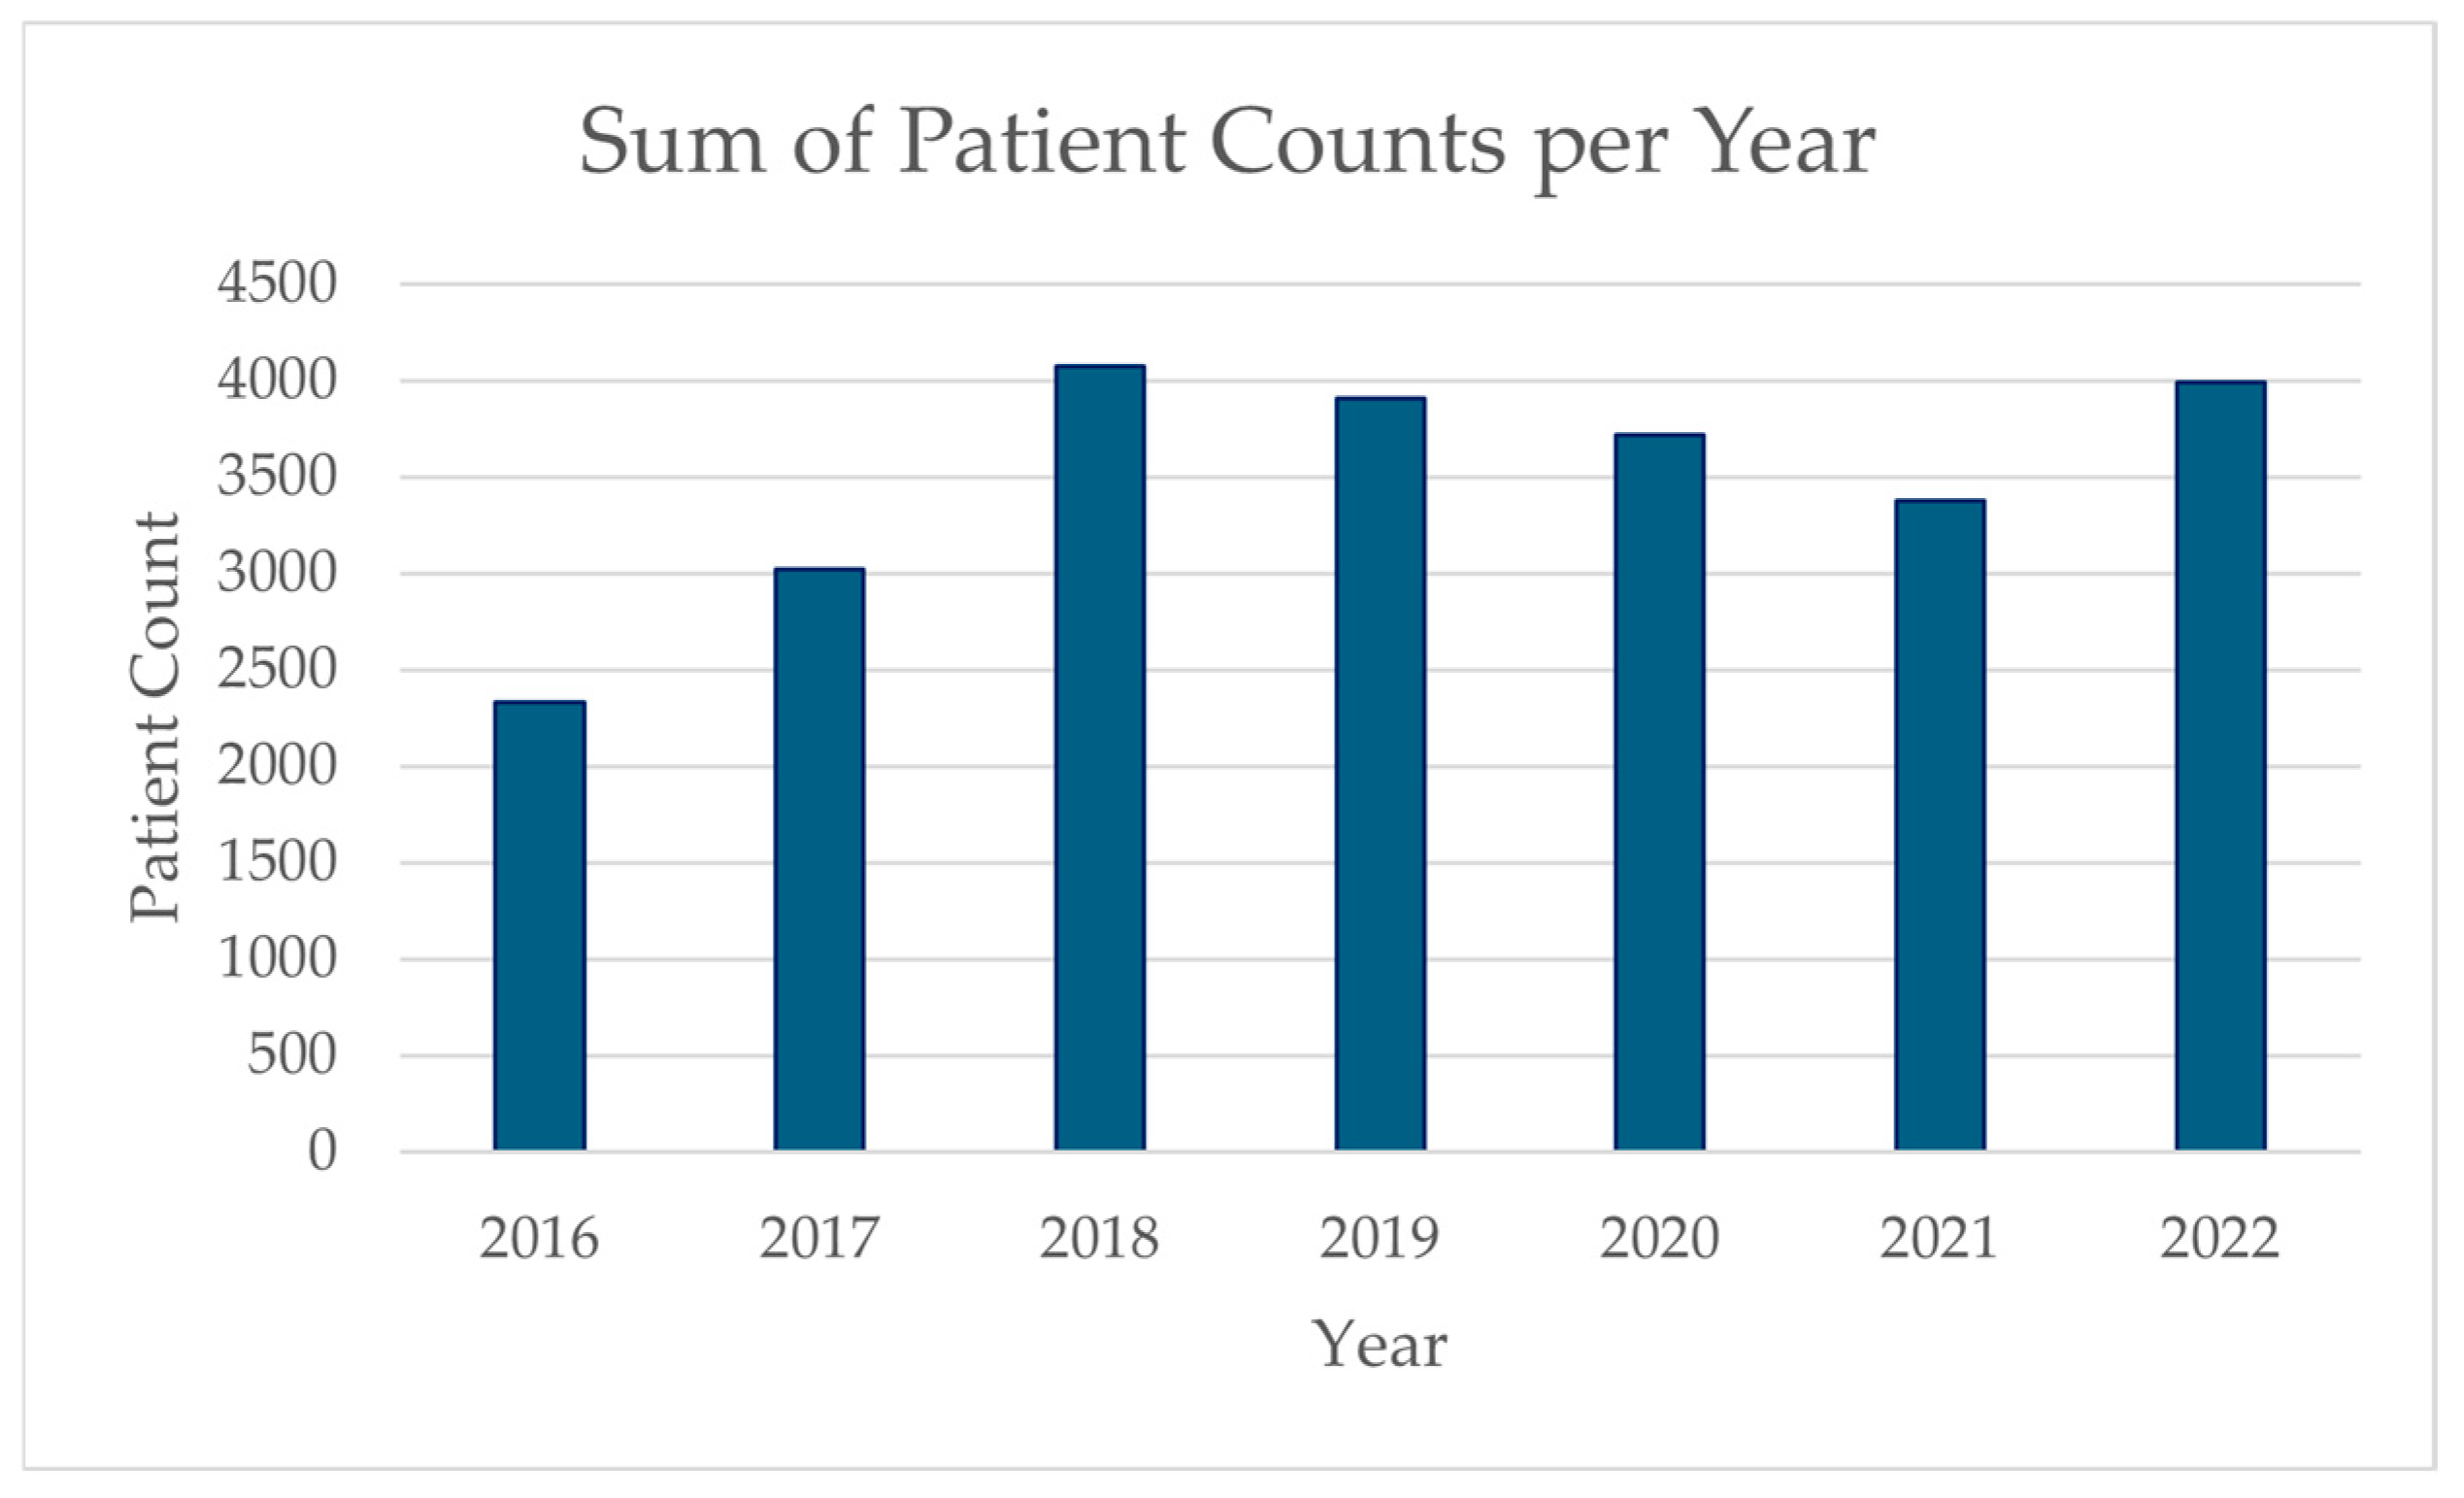
Figure 1 shows the annual distribution of patient counts throughout the study period. Variations can be observed during the COVID-19 pandemic years (2020–2021). We observed a 4.8% decrease in admissions in 2020 compared to 2019, and a further 9.1% decrease in 2021 compared to 2019 levels, likely reflecting the impact of the pandemic on healthcare utilization patterns. However, our case-crossover design inherently controls for these temporal trends by comparing exposures within the same month, thereby adjusting for pandemic effects on overall admission rates. Additionally, our time stratification by day of week, month, and year further accounts for these systematic temporal variations. The 2022 data show a return to pre-pandemic admission levels, which provides another useful reference period within our analysis.

Figure 1.
Yearly sum of patient counts during the study period.
2.2. Exposure Data
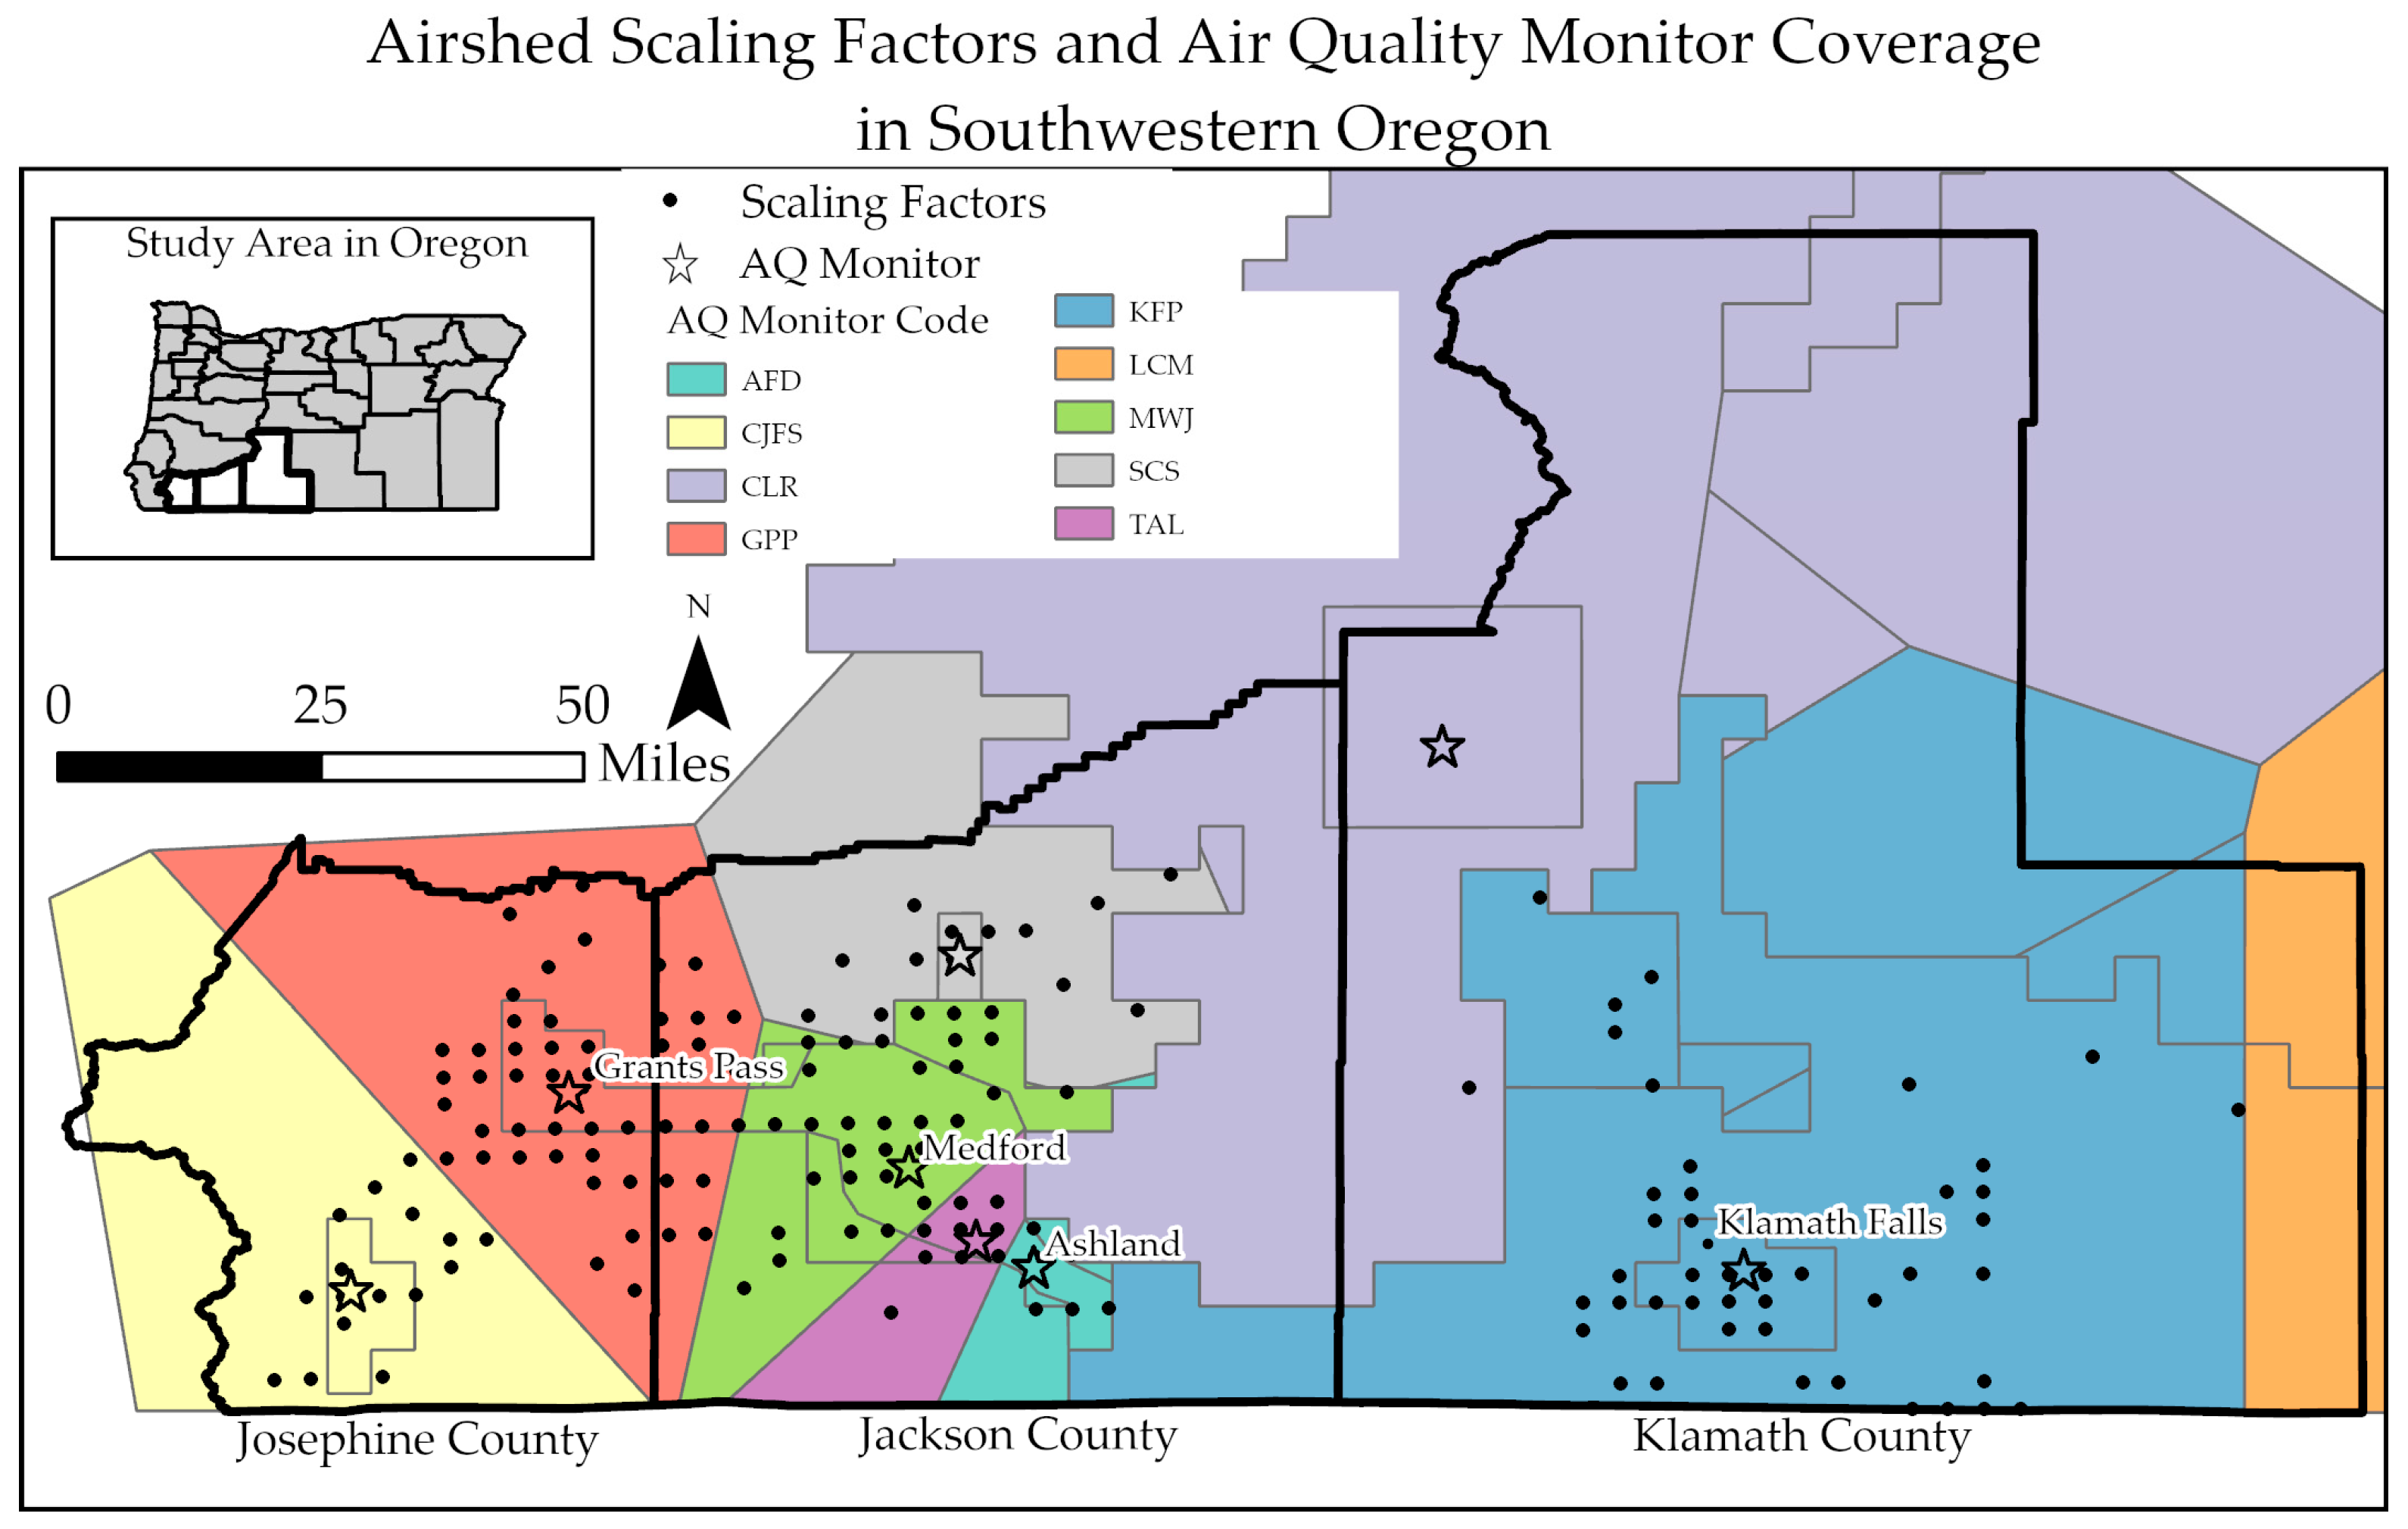
Airshed scaling factors were obtained from the Oregon Department of Environmental Quality. These scaling factors, shown in Figure 2, represent the proportion of pollution expected at a given point relative to the most relevant air monitor, provided on a 4 km grid across the state.
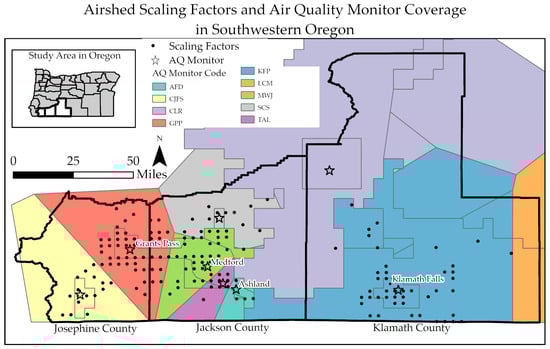
Figure 2.
Map of the study area, including Josephine, Jackson, and Klamath Counties, Oregon, displaying the airshed scaling factors as the 4 km grid points in populated areas and the coverage zones associated with each air quality (AQ) monitor. The monitor coverage areas are delineated by different boundary colors, and the associated monitor location is shown with the same color star, including Ashland Fire Department (AFD), Cave Junction Forest Service (CJF), Crater Lake (CLR), Grants Pass Parkside (GPP), Klamath Falls Peterson School (KFP), Lakeview Center and M St (LCM), Medford Welch and Jackson (MWJ), Shady Cove School (SCS), and Talent (TAL).
While this dataset is relatively new and may be updated over time, our decision to use it was informed by a comparative analysis [31], which found that airshed-level data outperformed zip code-level data in identifying the relationship between PM2.5 exposure and respiratory health outcomes in southwestern Oregon’s complex terrain. The airshed data produced statistically significant results in regression analyses (p < 0.0001), while zip code-level aggregations failed to detect this established relationship. The airshed data also demonstrated lower variance (725.6) compared to that of the zip code data (1200.1), indicating that they more effectively captured exposure variation across the landscape.
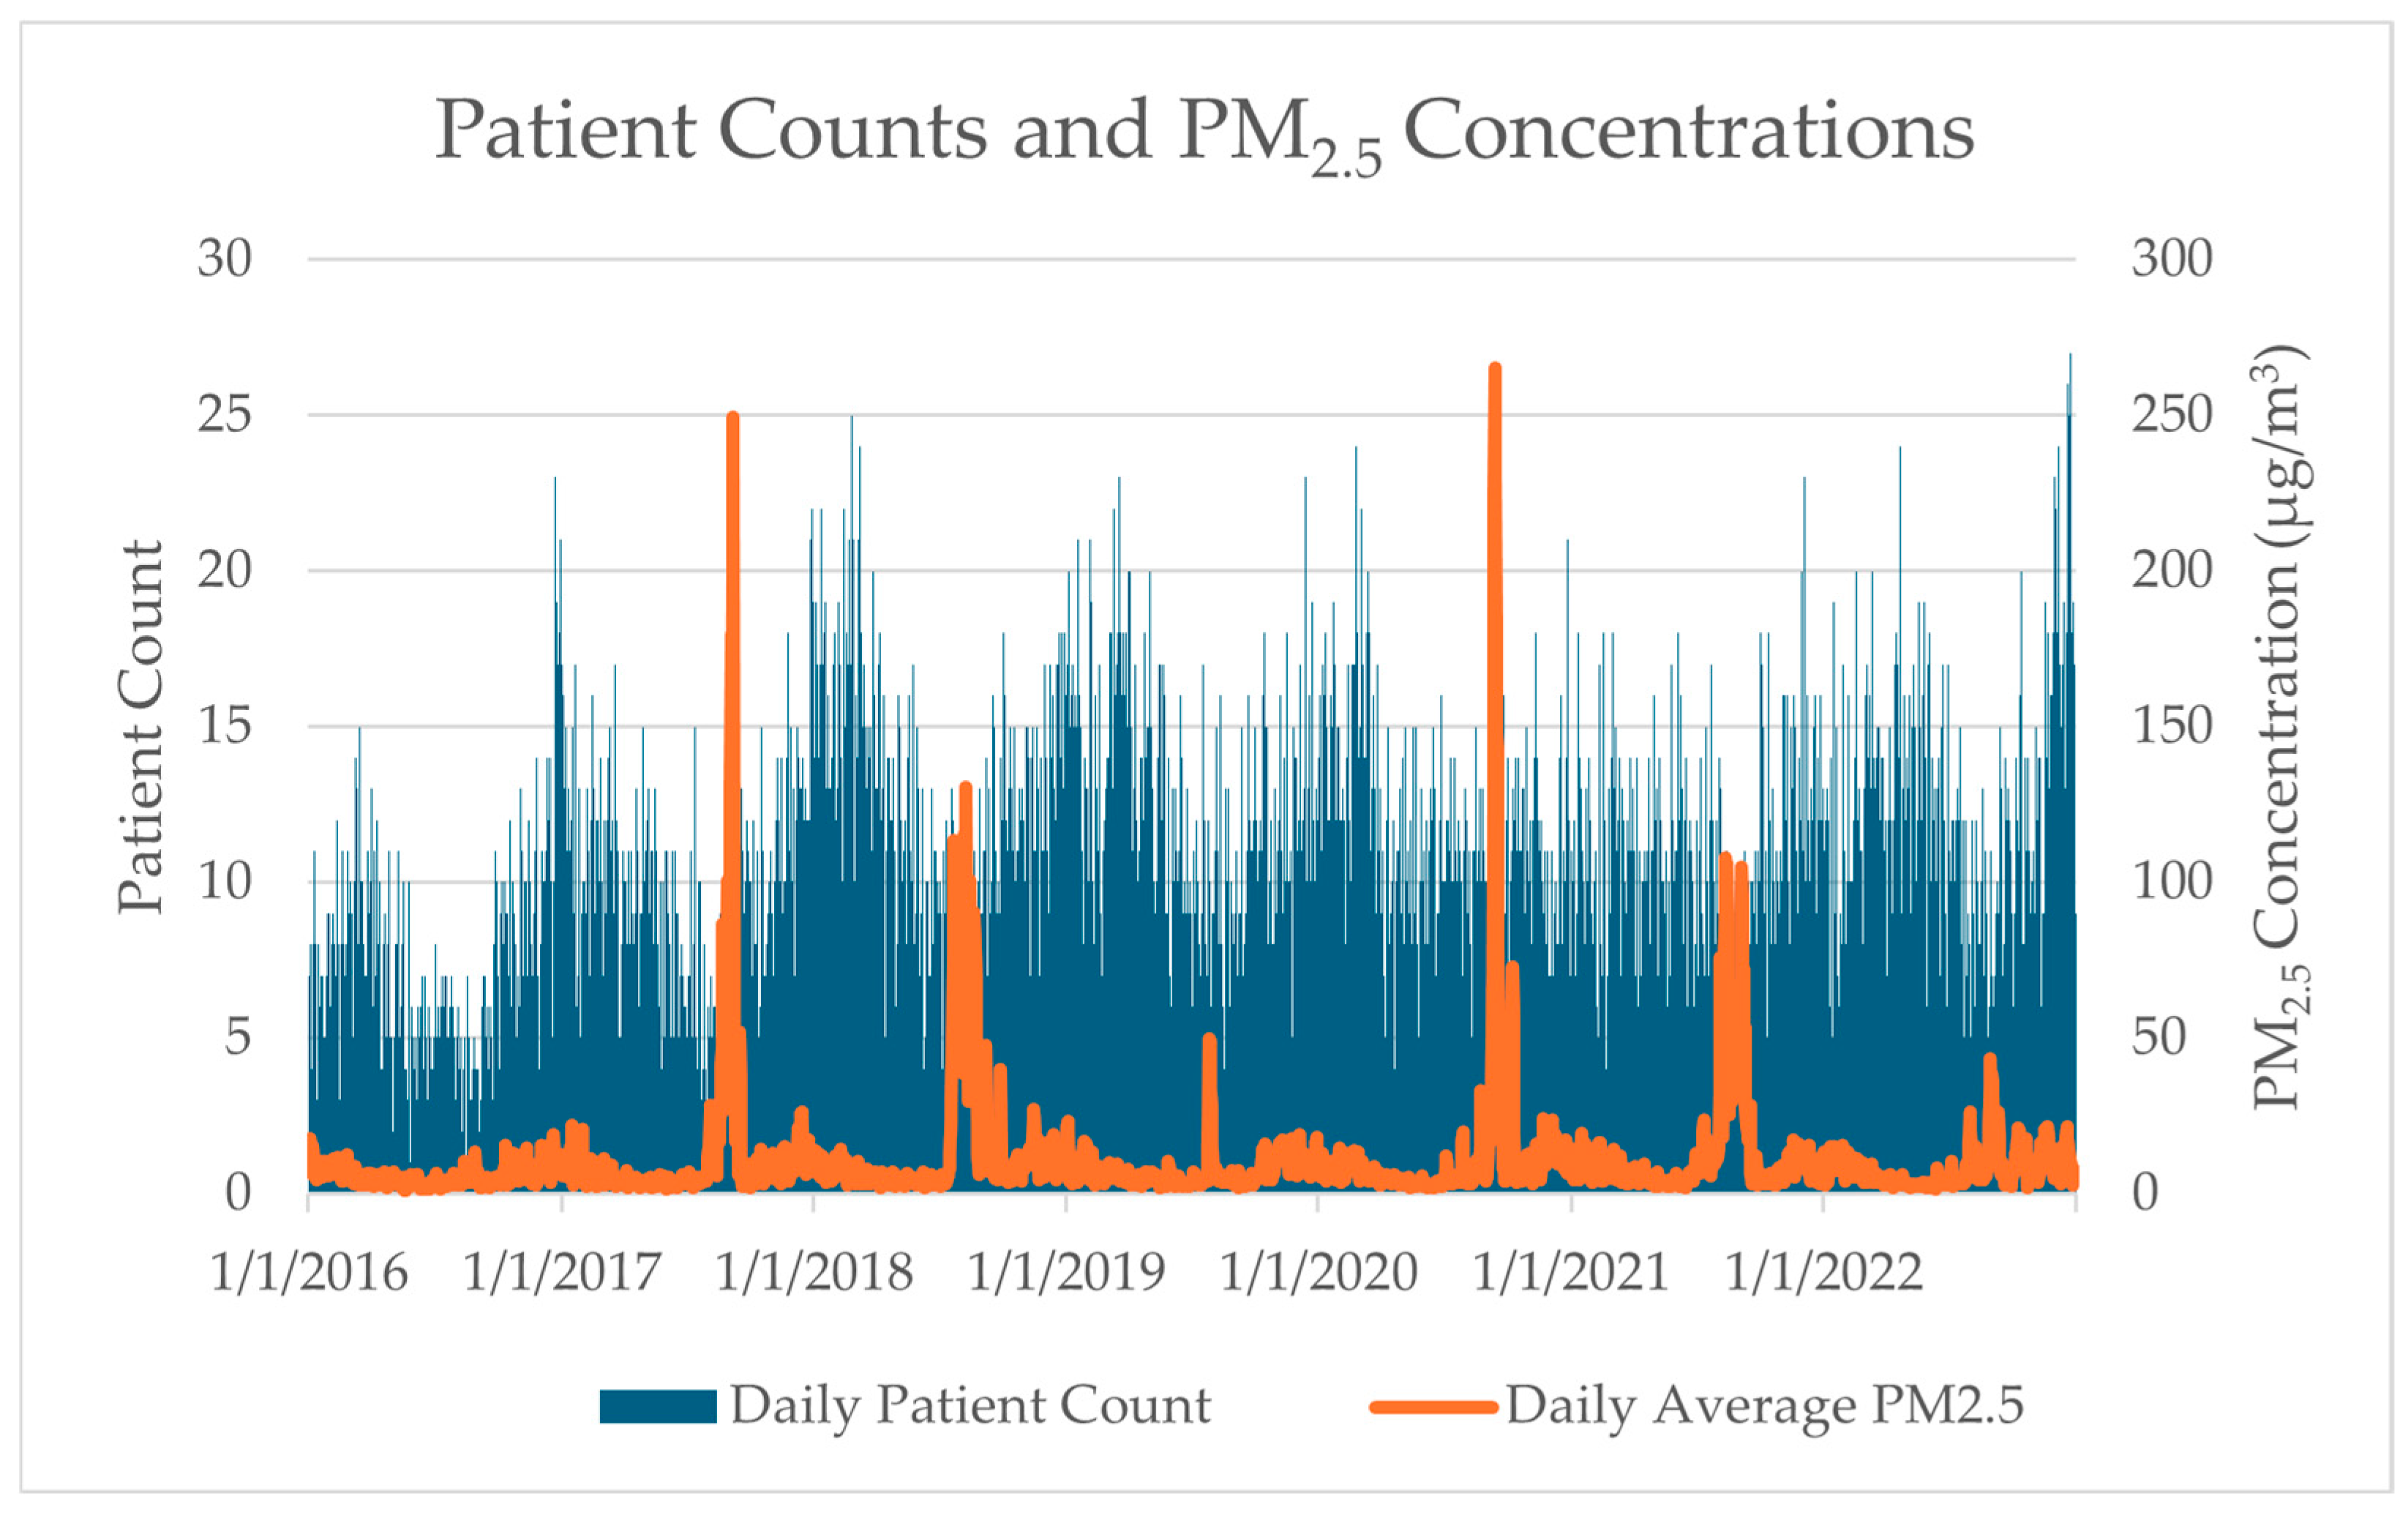
Figure 3 presents daily patient counts and average PM2.5 concentrations across the study period (2016–2022). Patient counts ranged from 0 to 27 per day (mean = 10). PM2.5 concentrations exhibited pronounced seasonal patterns with distinct spikes during wildfire seasons, ranging from 1.01 to 265.42 μg/m3 (mean = 10.37 μg/m3). Notably, several major smoke events exceeded 100 μg/m3, particularly during the 2017, 2018, 2020, and 2021 wildfire seasons. While the average PM2.5 concentration remained below EPA’s 24 h standard of 35 μg/m3, approximately 4.4% of days in the study period exceeded the EPA’s 24 hr standard of 35 μg/m3, all occurring during July, August, September, and October.
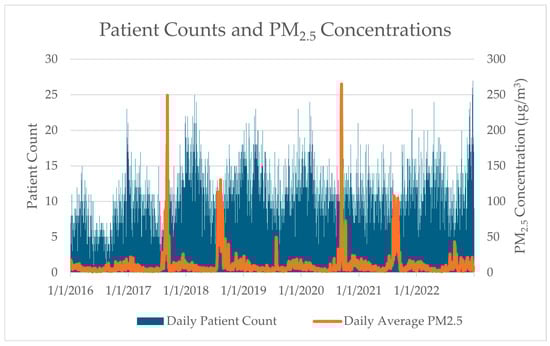
Figure 3.
Daily average patient counts compared to daily average PM2.5 concentrations across all study monitors during the study time frame.
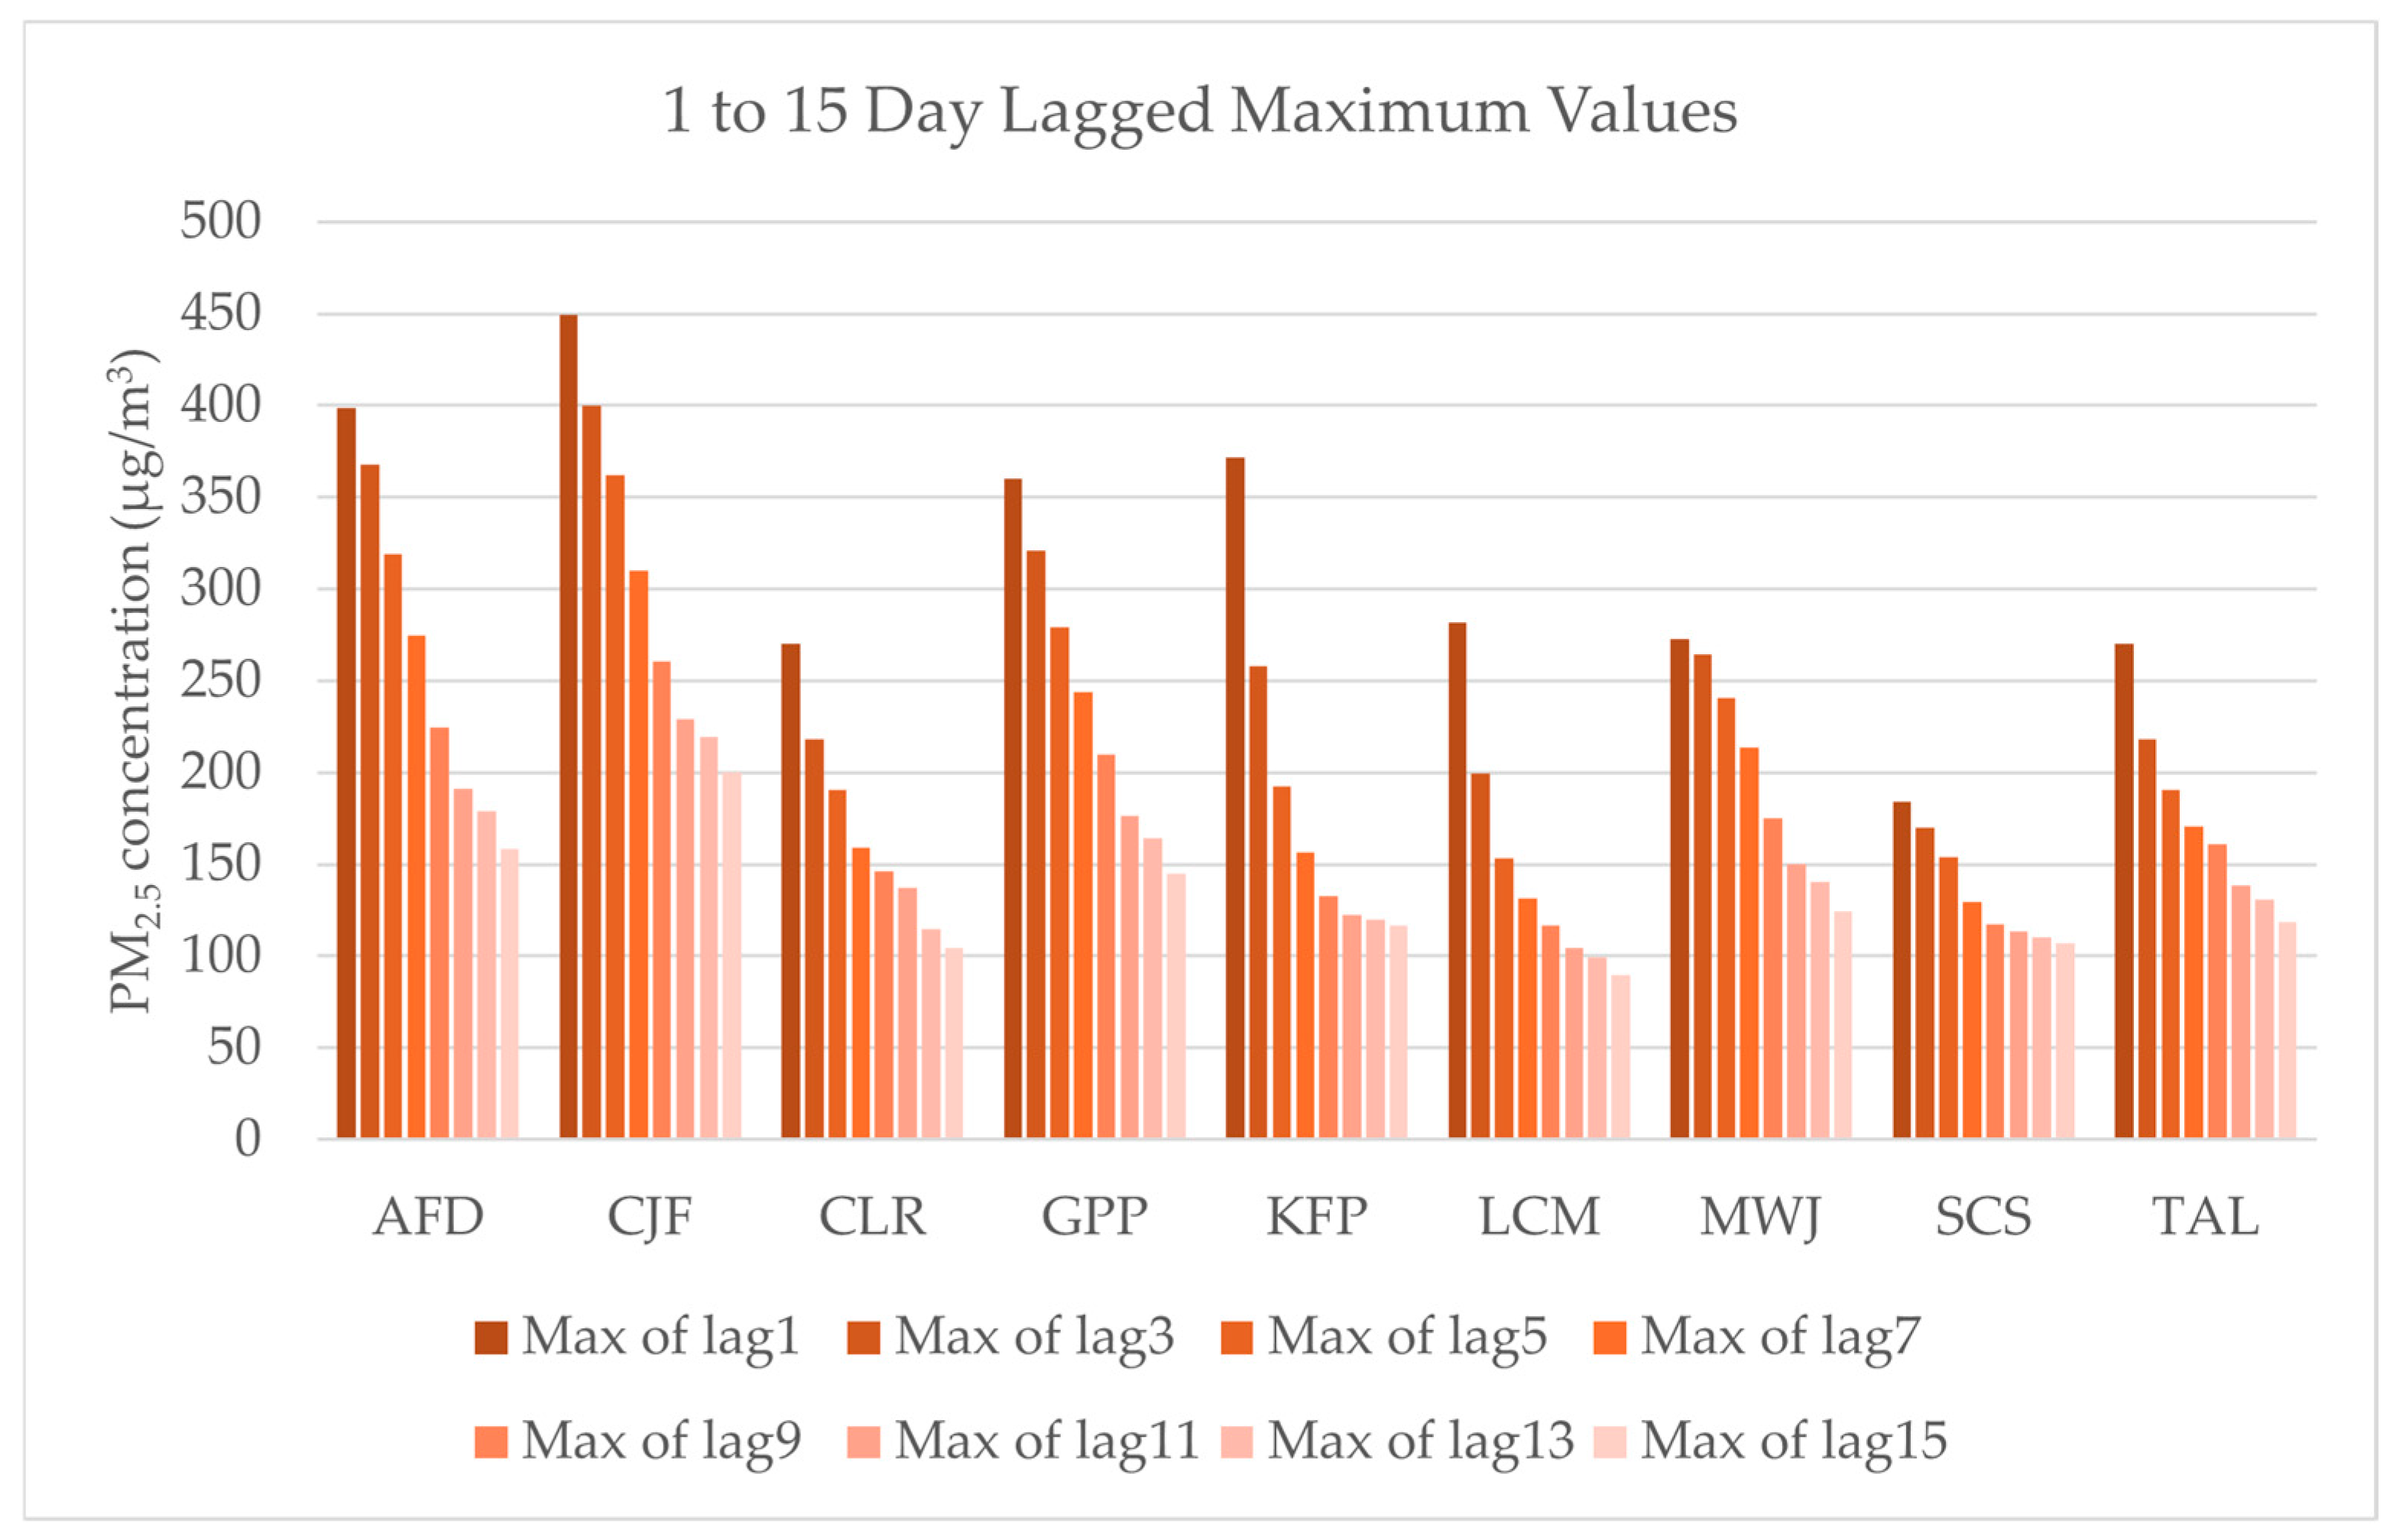
Daily mean PM2.5 concentrations at a 4 km resolution derived from airshed scaling factors were applied to values measured from the associated monitor. For each date, we calculated backward-looking moving averages of PM2.5 concentrations over various time windows, including 3-, 5-, 7-, 9-, 11-, 13-, and 15-day periods. This approach examines the potential delayed health effects of air pollution exposure, which is particularly relevant for respiratory and cardiovascular conditions, where physiological responses may develop over time. As shown in Figure 4, particularly through the Klamath Falls Peterson Elementary (KFP) and Shady Cove School (SCS) monitors, the upper range of the average of the daily maximum values begins to even out after about two weeks. In conjunction with previous results noting health impacts increasing across a similar lag time in this study area [17], these results informed our decision to extend the analysis to a maximum of 15 days.
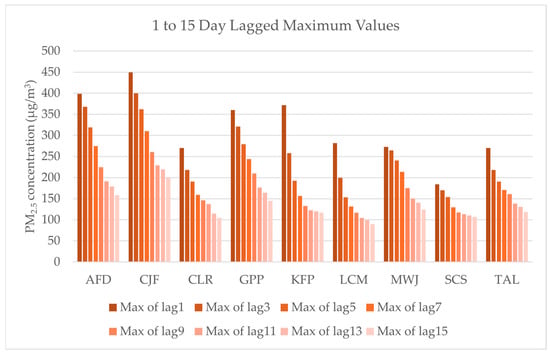
Figure 4.
Maximum PM2.5 concentration values averaged from 1 to 15 days for each monitor in the study area, including Ashland Fire Department (AFD), Cave Junction Forest Service (CJF), Crater Lake (CLR), Grants Pass Parkside (GPP), Klamath Falls Peterson School (KFP), Lakeview Center and M St (LCM), Medford Welch and Jackson (MWJ), Shady Cove School (SCS), and Talent (TAL).
3. Results
After controlling for seasonal patterns through our case-crossover design, our analysis found that short-term temperature variations had a significant effect on admissions, with every 1 °C increase associated with a 3.5% increase in all patient admissions (OR = 1.035; 95% CI: 1.033–1.037), a 3.4% increase in respiratory admissions (OR = 1.034; 95% CI: 1.031–1.038), and a 3.5% increase in cardiovascular admissions (OR = 1.035; 95% CI: 1.032–1.039). This represents the effect of day-to-day temperature changes within the same seasonal periods rather than overall seasonal admission patterns.
We validated this methodological approach by comparing our conditional Poisson regression (gnm) results with the conditional logistic regression (clogit) results, finding consistent effect estimates. The PM2.5 odds ratios were 1.043 (95% CI: 1.024–1.062) from clogit and 1.035 from conditional Poisson, showing a similar direction and magnitude of effect. We also evaluated potential overdispersion by examining the ratio of variance (0.0147) to mean (0.0112) in our outcome data, indicating minimal overdispersion (ratio = 1.31), as supported by goodness-of-fit testing of our Poisson models.
3.1. Respiratory and Cardiovascular Admissions
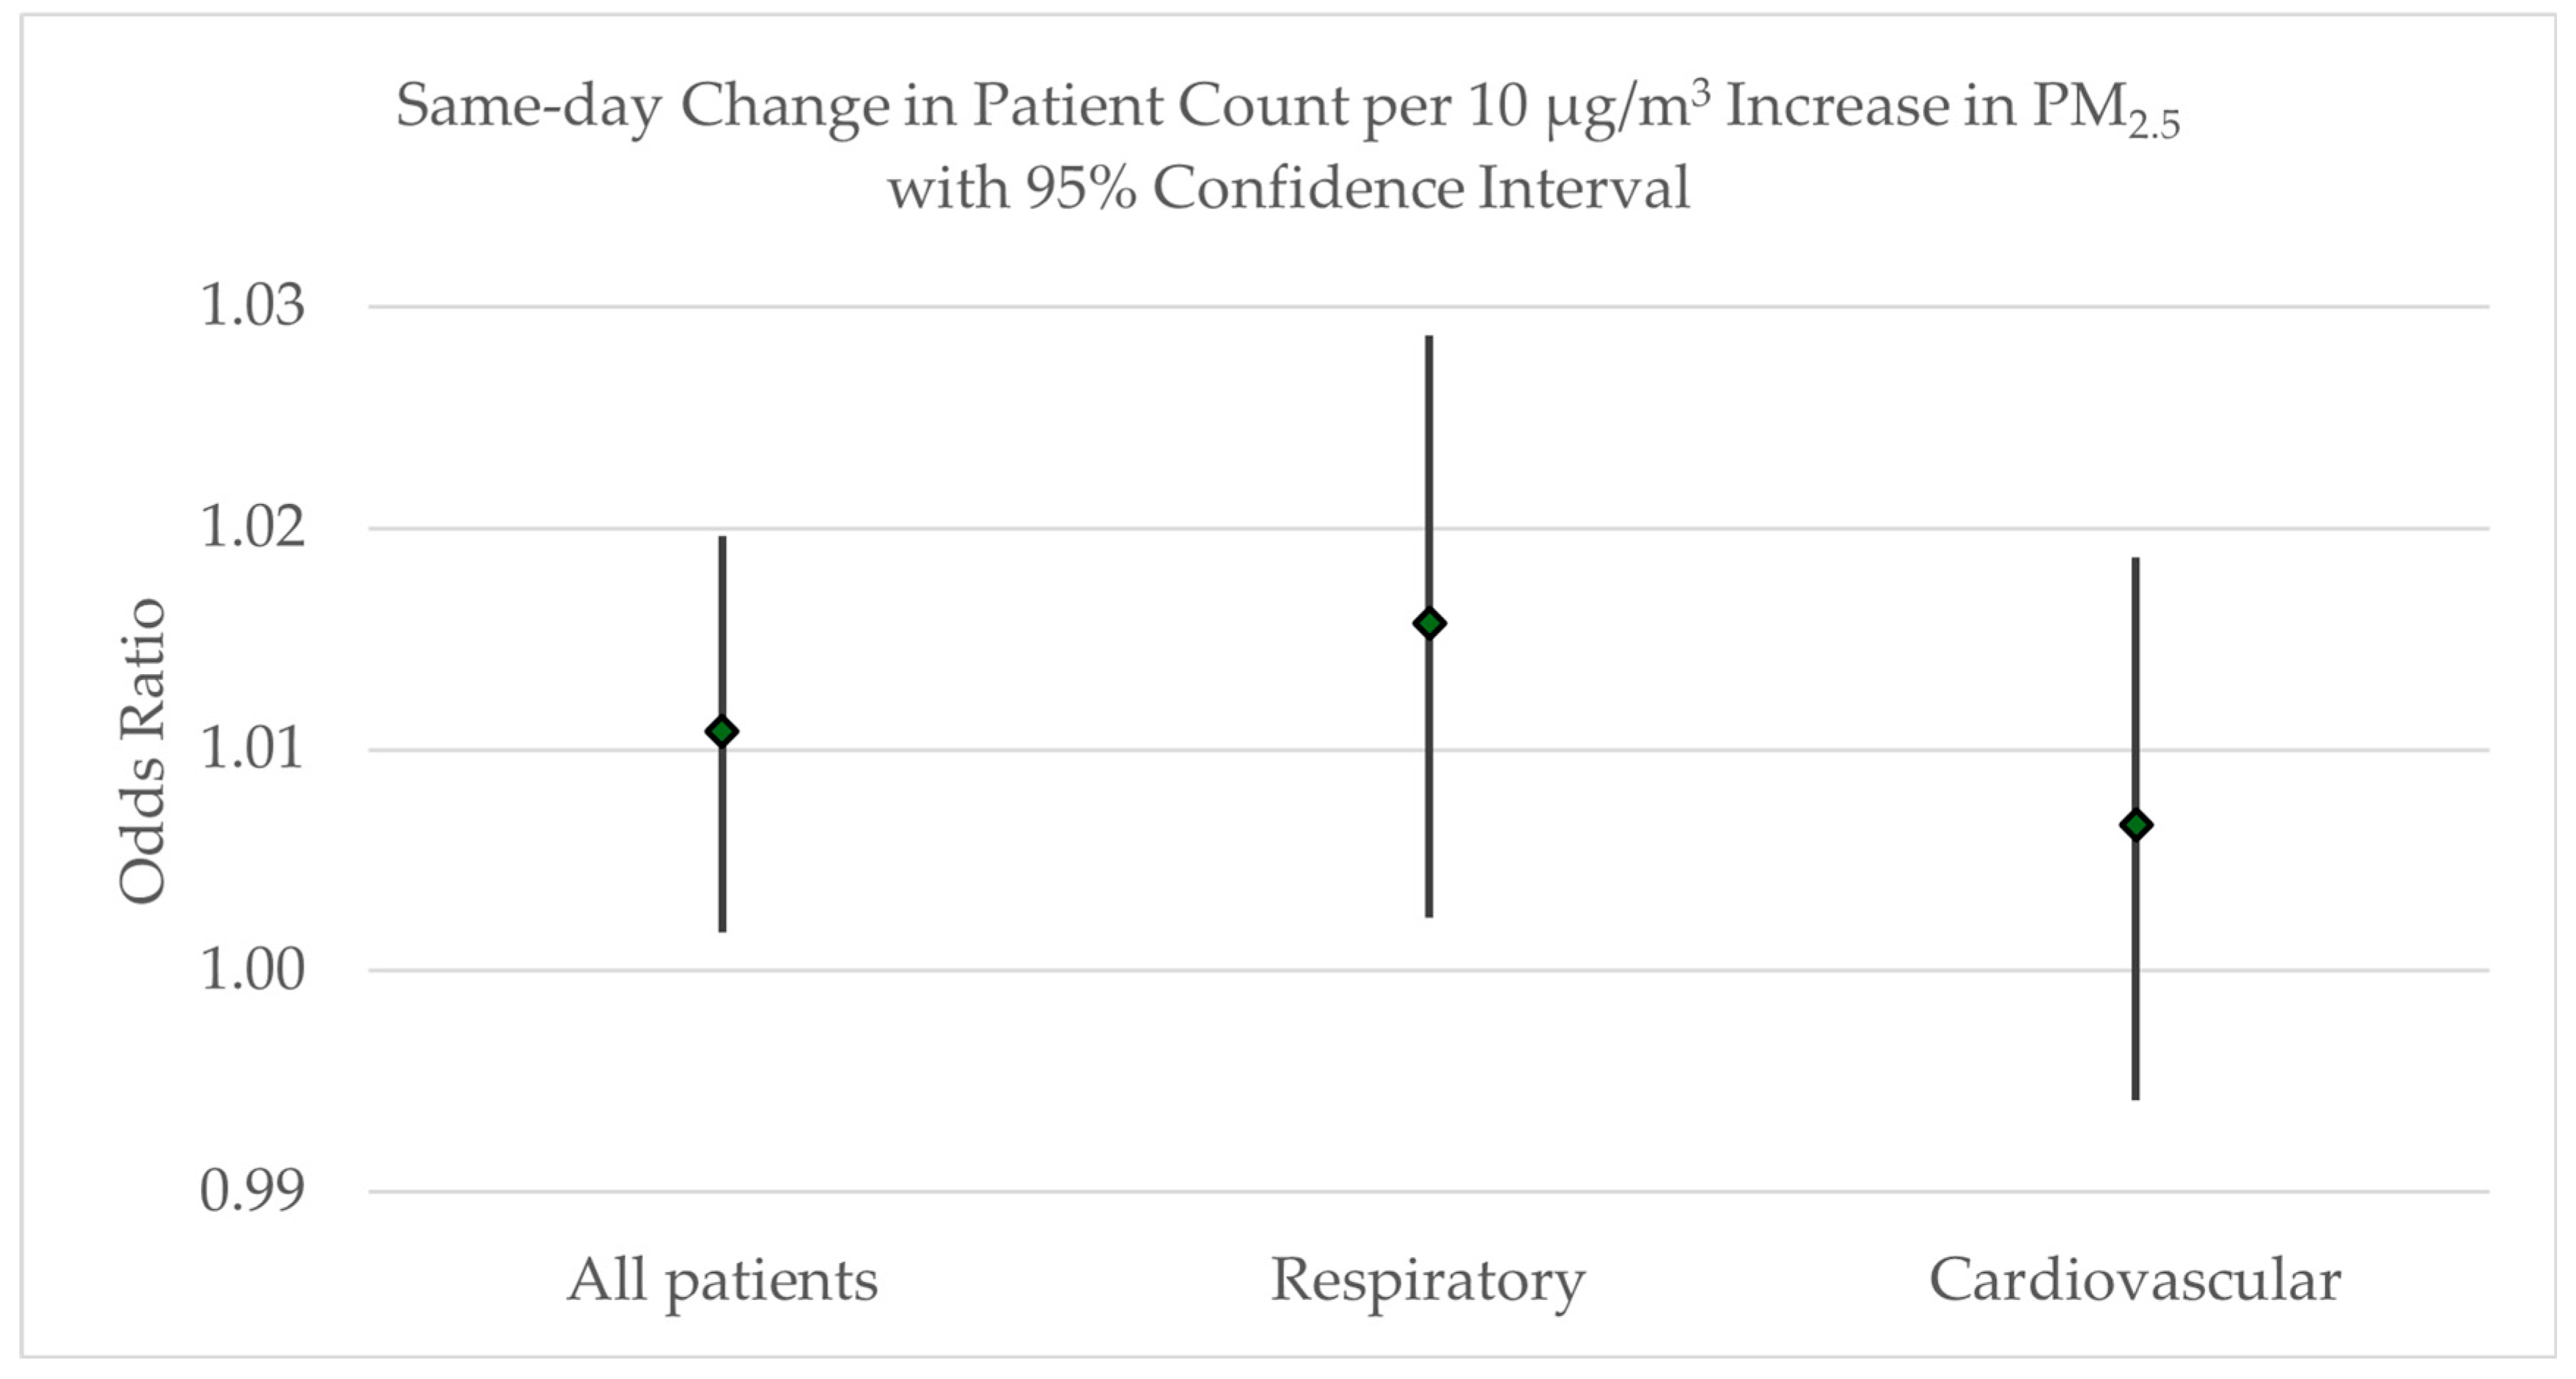
The results are presented for all patients admitted to the hospital or emergency room during the study time frame, N = 24,421; respiratory patients with a J00-J99 ICD-10 primary diagnosis code, N = 12,782; and cardiovascular patients with a I00-I99 ICD-10 primary diagnosis code, N = 11,639. Figure 5 shows that a 10 μg/m3 increase in PM2.5 is associated with a 1.1% increase in all patient admissions (OR = 1.0108; 95% CI: 1.0018, 1.0197); a 1.6% increase in same-day admission rates for respiratory conditions (OR = 1.0157; 95% CI: 1.0024, 1.0287); and an insignificant impact on cardiovascular admissions, as the 95% confidence interval encompasses the value of 1.00 (OR = 1.0066; 95% CI: 0.9942, 1.0187). A baseline patient count for the study hospitals was determined using the daily average number of cardiovascular and respiratory patients across the study time frame, both of which averaged five patients per day. Since each day that has a 10 μg/m3 increase in PM2.5 is associated with a 1.6% increase in same day respiratory hospital or emergency room admissions, this corresponds with an additional 0.1 respiratory patients. While we focused on respiratory and cardiovascular conditions in this study, we did not calculate the same-day impact on cardiovascular admissions due to the non-significant effect estimate. If the PM2.5 concentration rises from, for example, 10 μg/m3 in the “moderate” category of the air quality index to 150 μg/m3 in the “very unhealthy” category, this represents a fourteen-fold increase, for an expected 1.4 additional respiratory patients.
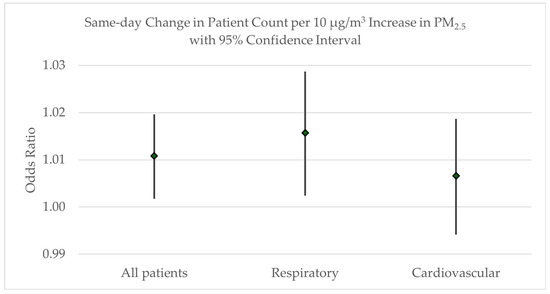
Figure 5.
Odds ratio with 95% confidence intervals for the same-day increase in patient counts related to the increase in PM2.5 concentrations.
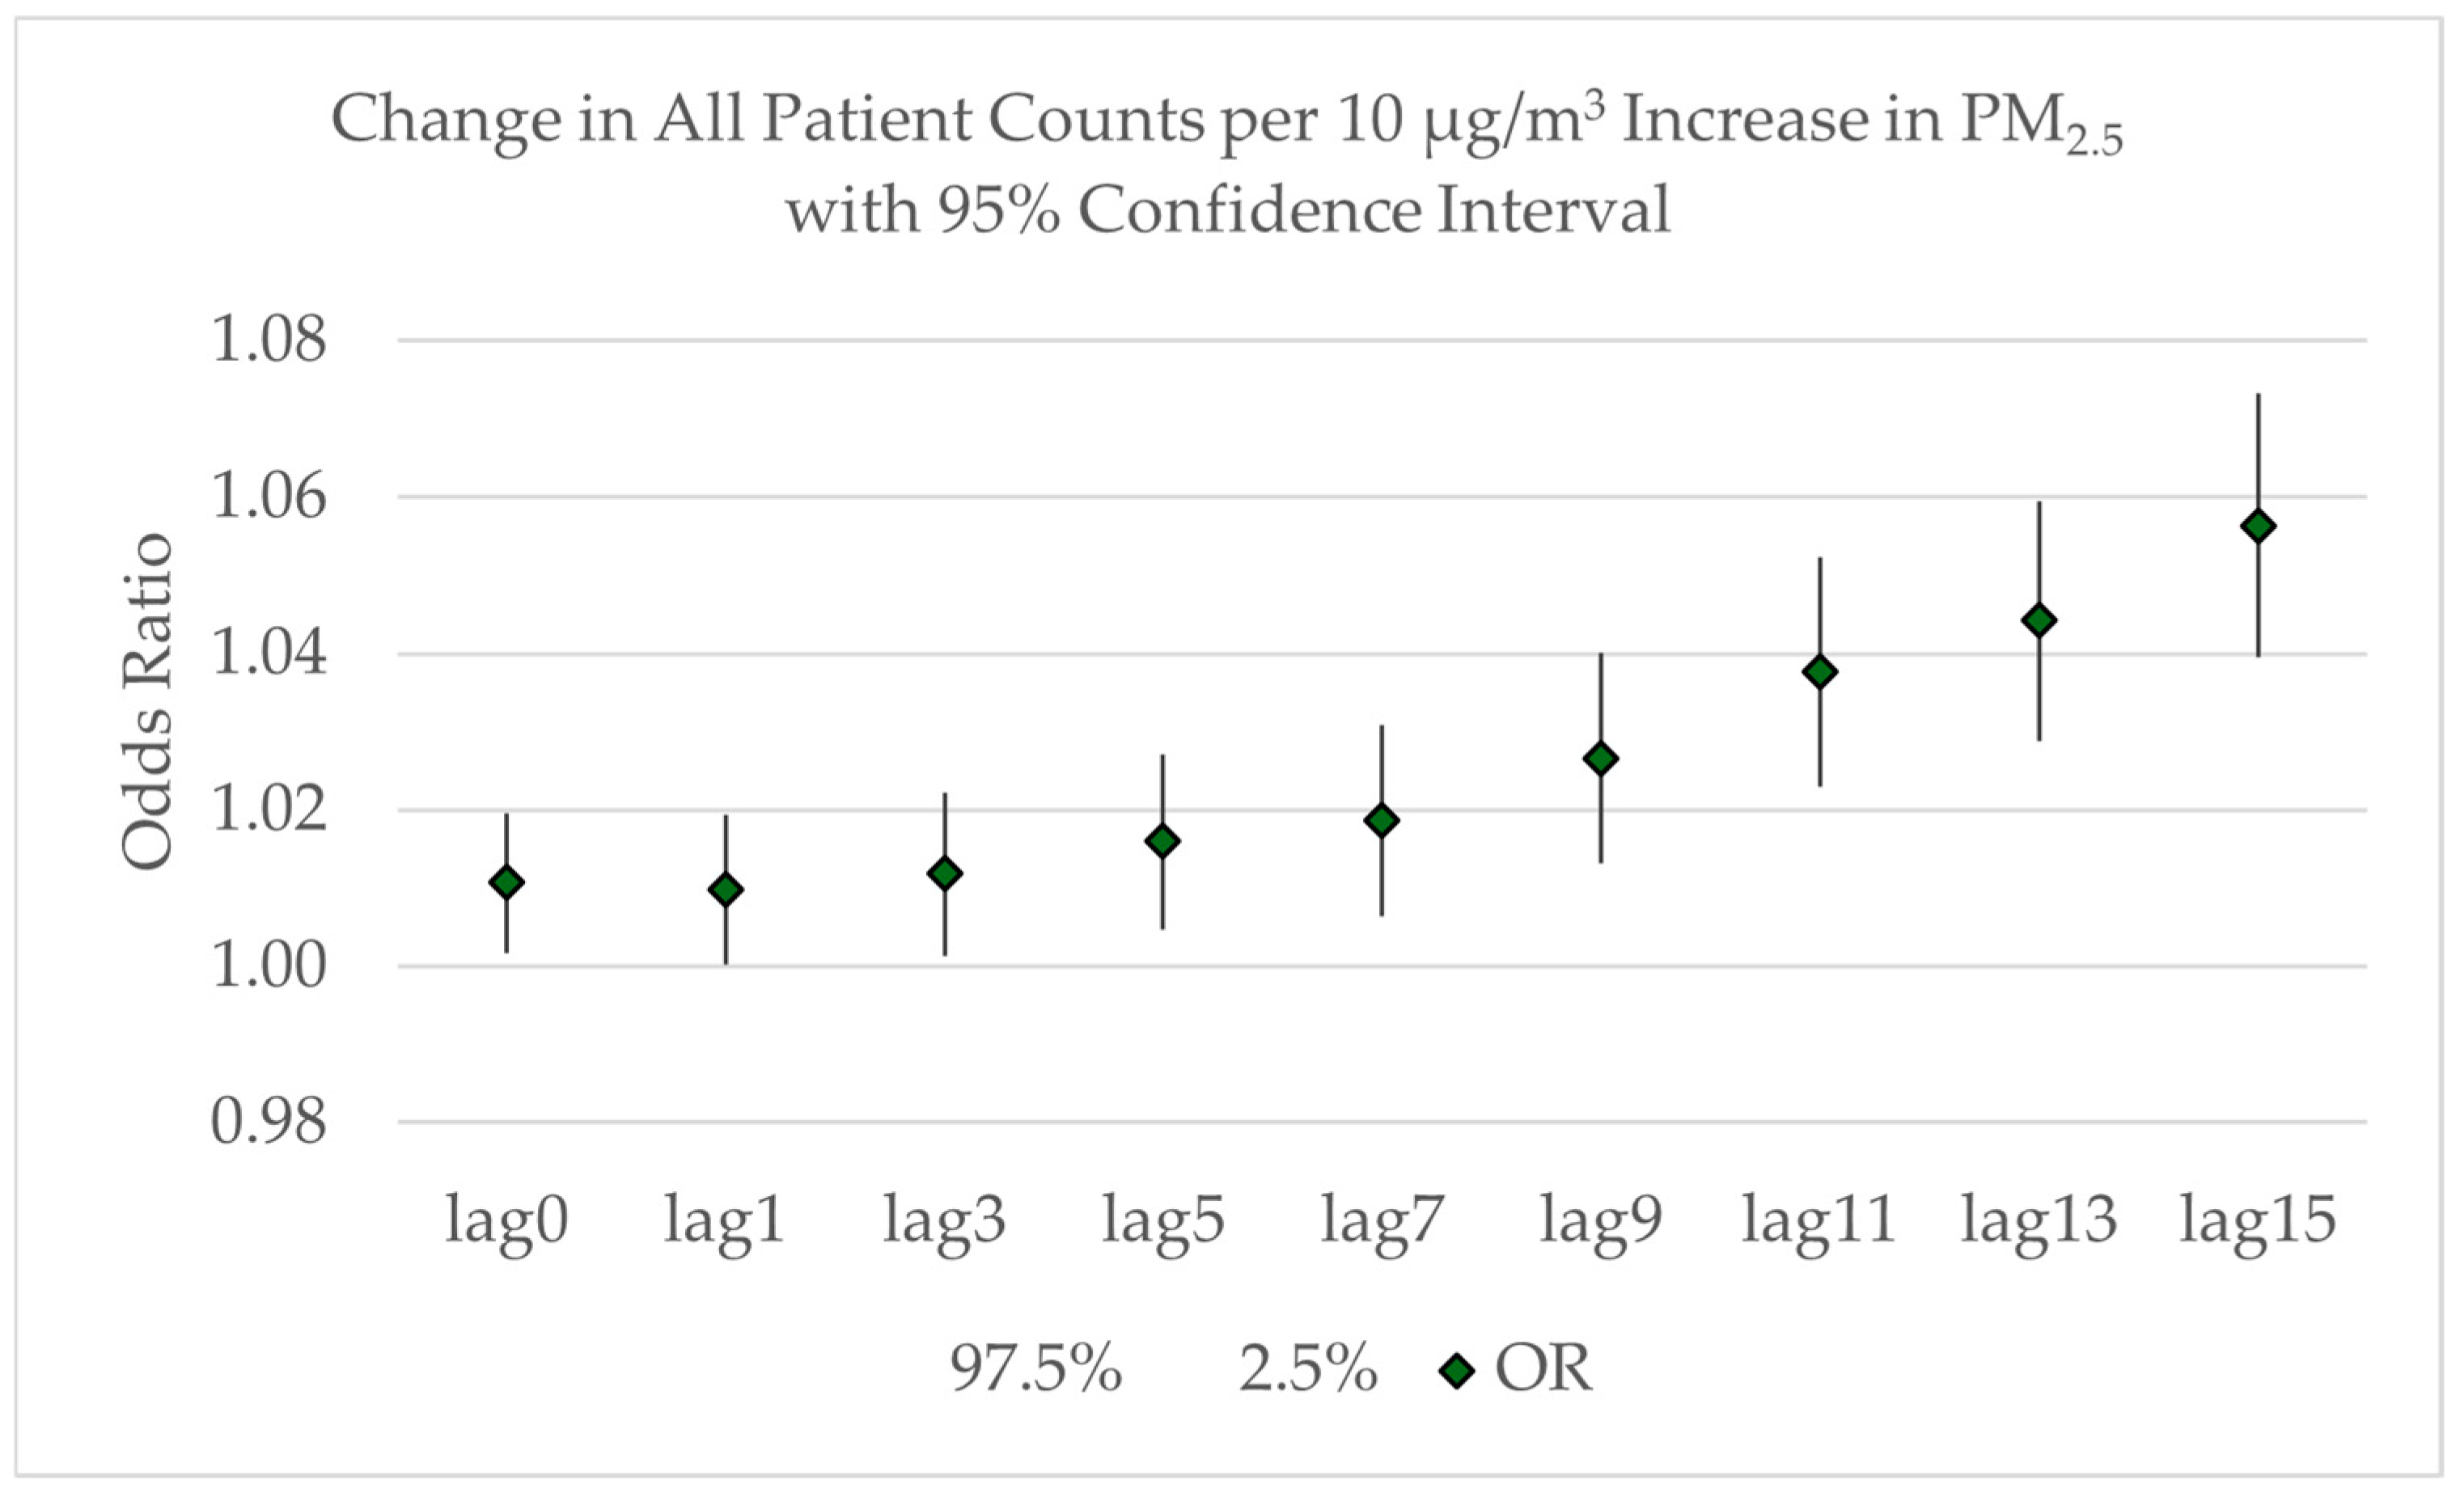
Rolling averages were calculated for odd numbers of days from 1 through 15 to extend to an average of just over two weeks. A lag of 0 indicates same-day admissions. As shown in Figure 6, the increase in all patient counts approached non-significance with a 1-day lag (OR = 1.0098; 95% CI: 1.0001–1.0193). Then, the odds ratio increased with each exposure period to an expected 5.6% increase in admissions with a 10 μg/m3 increase the average PM2.5 across a 15-day lag (OR = 1.0563; 95% CI: 1.0396–1.0732). This corresponds to an additional 0.28 patients.
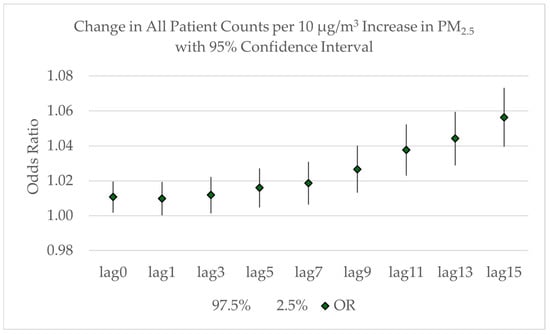
Figure 6.
Odds ratio with 95% confidence intervals for the increase in all patient counts related to the increase in the lagged average of PM2.5 concentrations from lag = 0 to lag = 15.
3.2. Respiratory Admissions
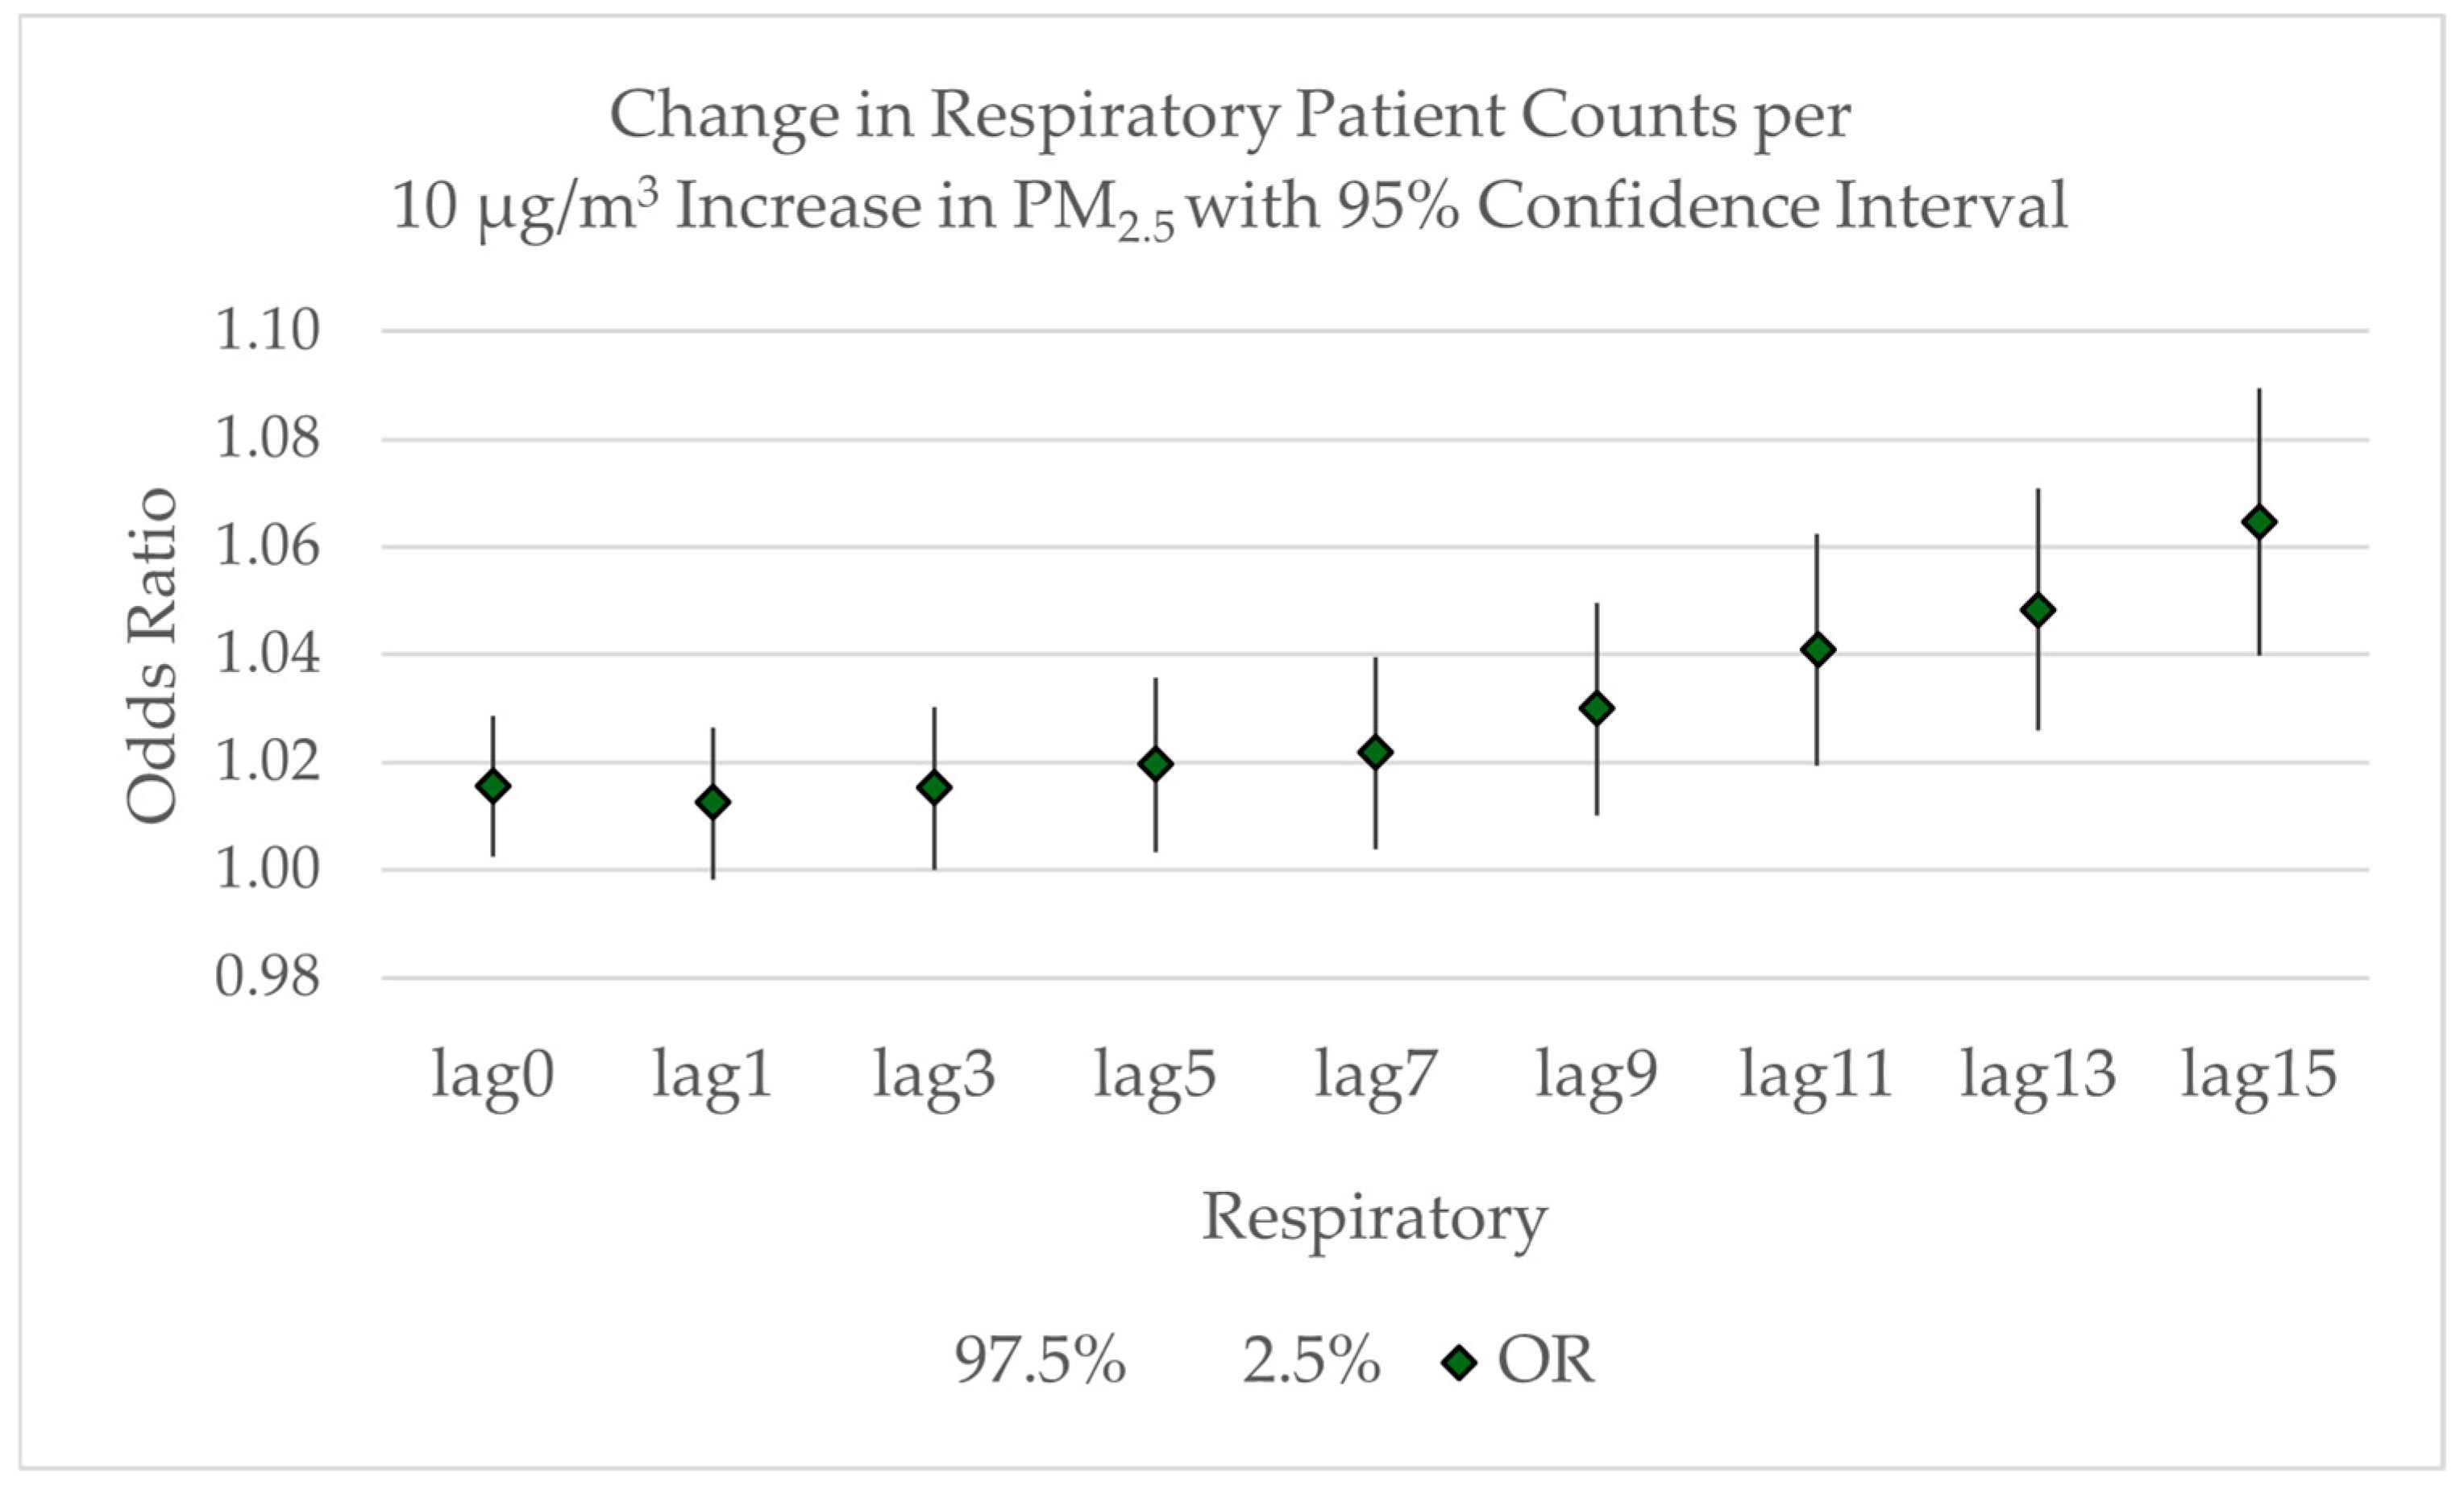
The odds ratios for the lagged averages associated with respiratory patient admissions are shown in Figure 7. While there is a significant increase in same-day respiratory patients associated with a 10 μg/m3 increase the average PM2.5, as discussed earlier, the increase is not statistically significant for either the 1-day lagged average (OR = 1.0125; 95% CI: 0.9982–1.0264) or the 3-day lagged average (OR = 1.0125; 95% CI: 1.000–1.0302). The increase in respiratory patients is significant again at a 5-day lag (OR = 1.0197; 95% CI: 1.0033–1.0358) and increases with each lag period to an expected 6.5% increase in respiratory admissions for the 15-day lag period (OR = 1.0645; 95% CI: 1.0400–1.0894). This 15-day lag period corresponds to an additional 0.3 respiratory patients. To illustrate potential impacts, we can consider a scenario where PM2.5 increases from 10 μg/m3 to 35 μg/m3 would result in an expected 0.75 additional respiratory patients. In a hypothetical worst-case scenario where the PM2.5 concentration rises from 10 μg/m3 in the “moderate” category to 150 μg/m3 in the “very unhealthy” category for a sustained period, an additional 4 respiratory patients could be expected. While this extreme scenario rarely occurs, it illustrates the potential impacts during severe, prolonged smoke events. These example calculations illustrate potential impacts during specific air quality scenarios and should not be interpreted as an estimate of the total attributable burden of PM2.5 exposure across the entire study period, which would require a more comprehensive analysis accounting for the day-by-day variation in PM2.5 levels.
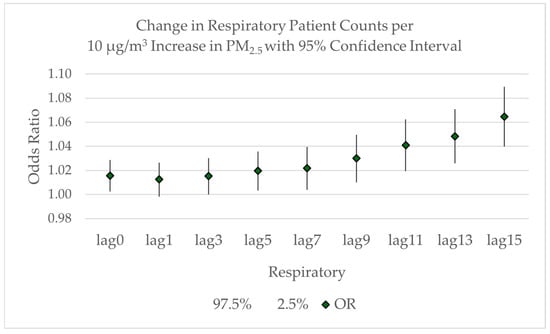
Figure 7.
Odds ratio with 95% confidence intervals for the increase in respiratory patient counts related to the lagged average increase in PM2.5 concentrations from lag = 0 to lag = 15.
3.3. Cardiovascular Admissions
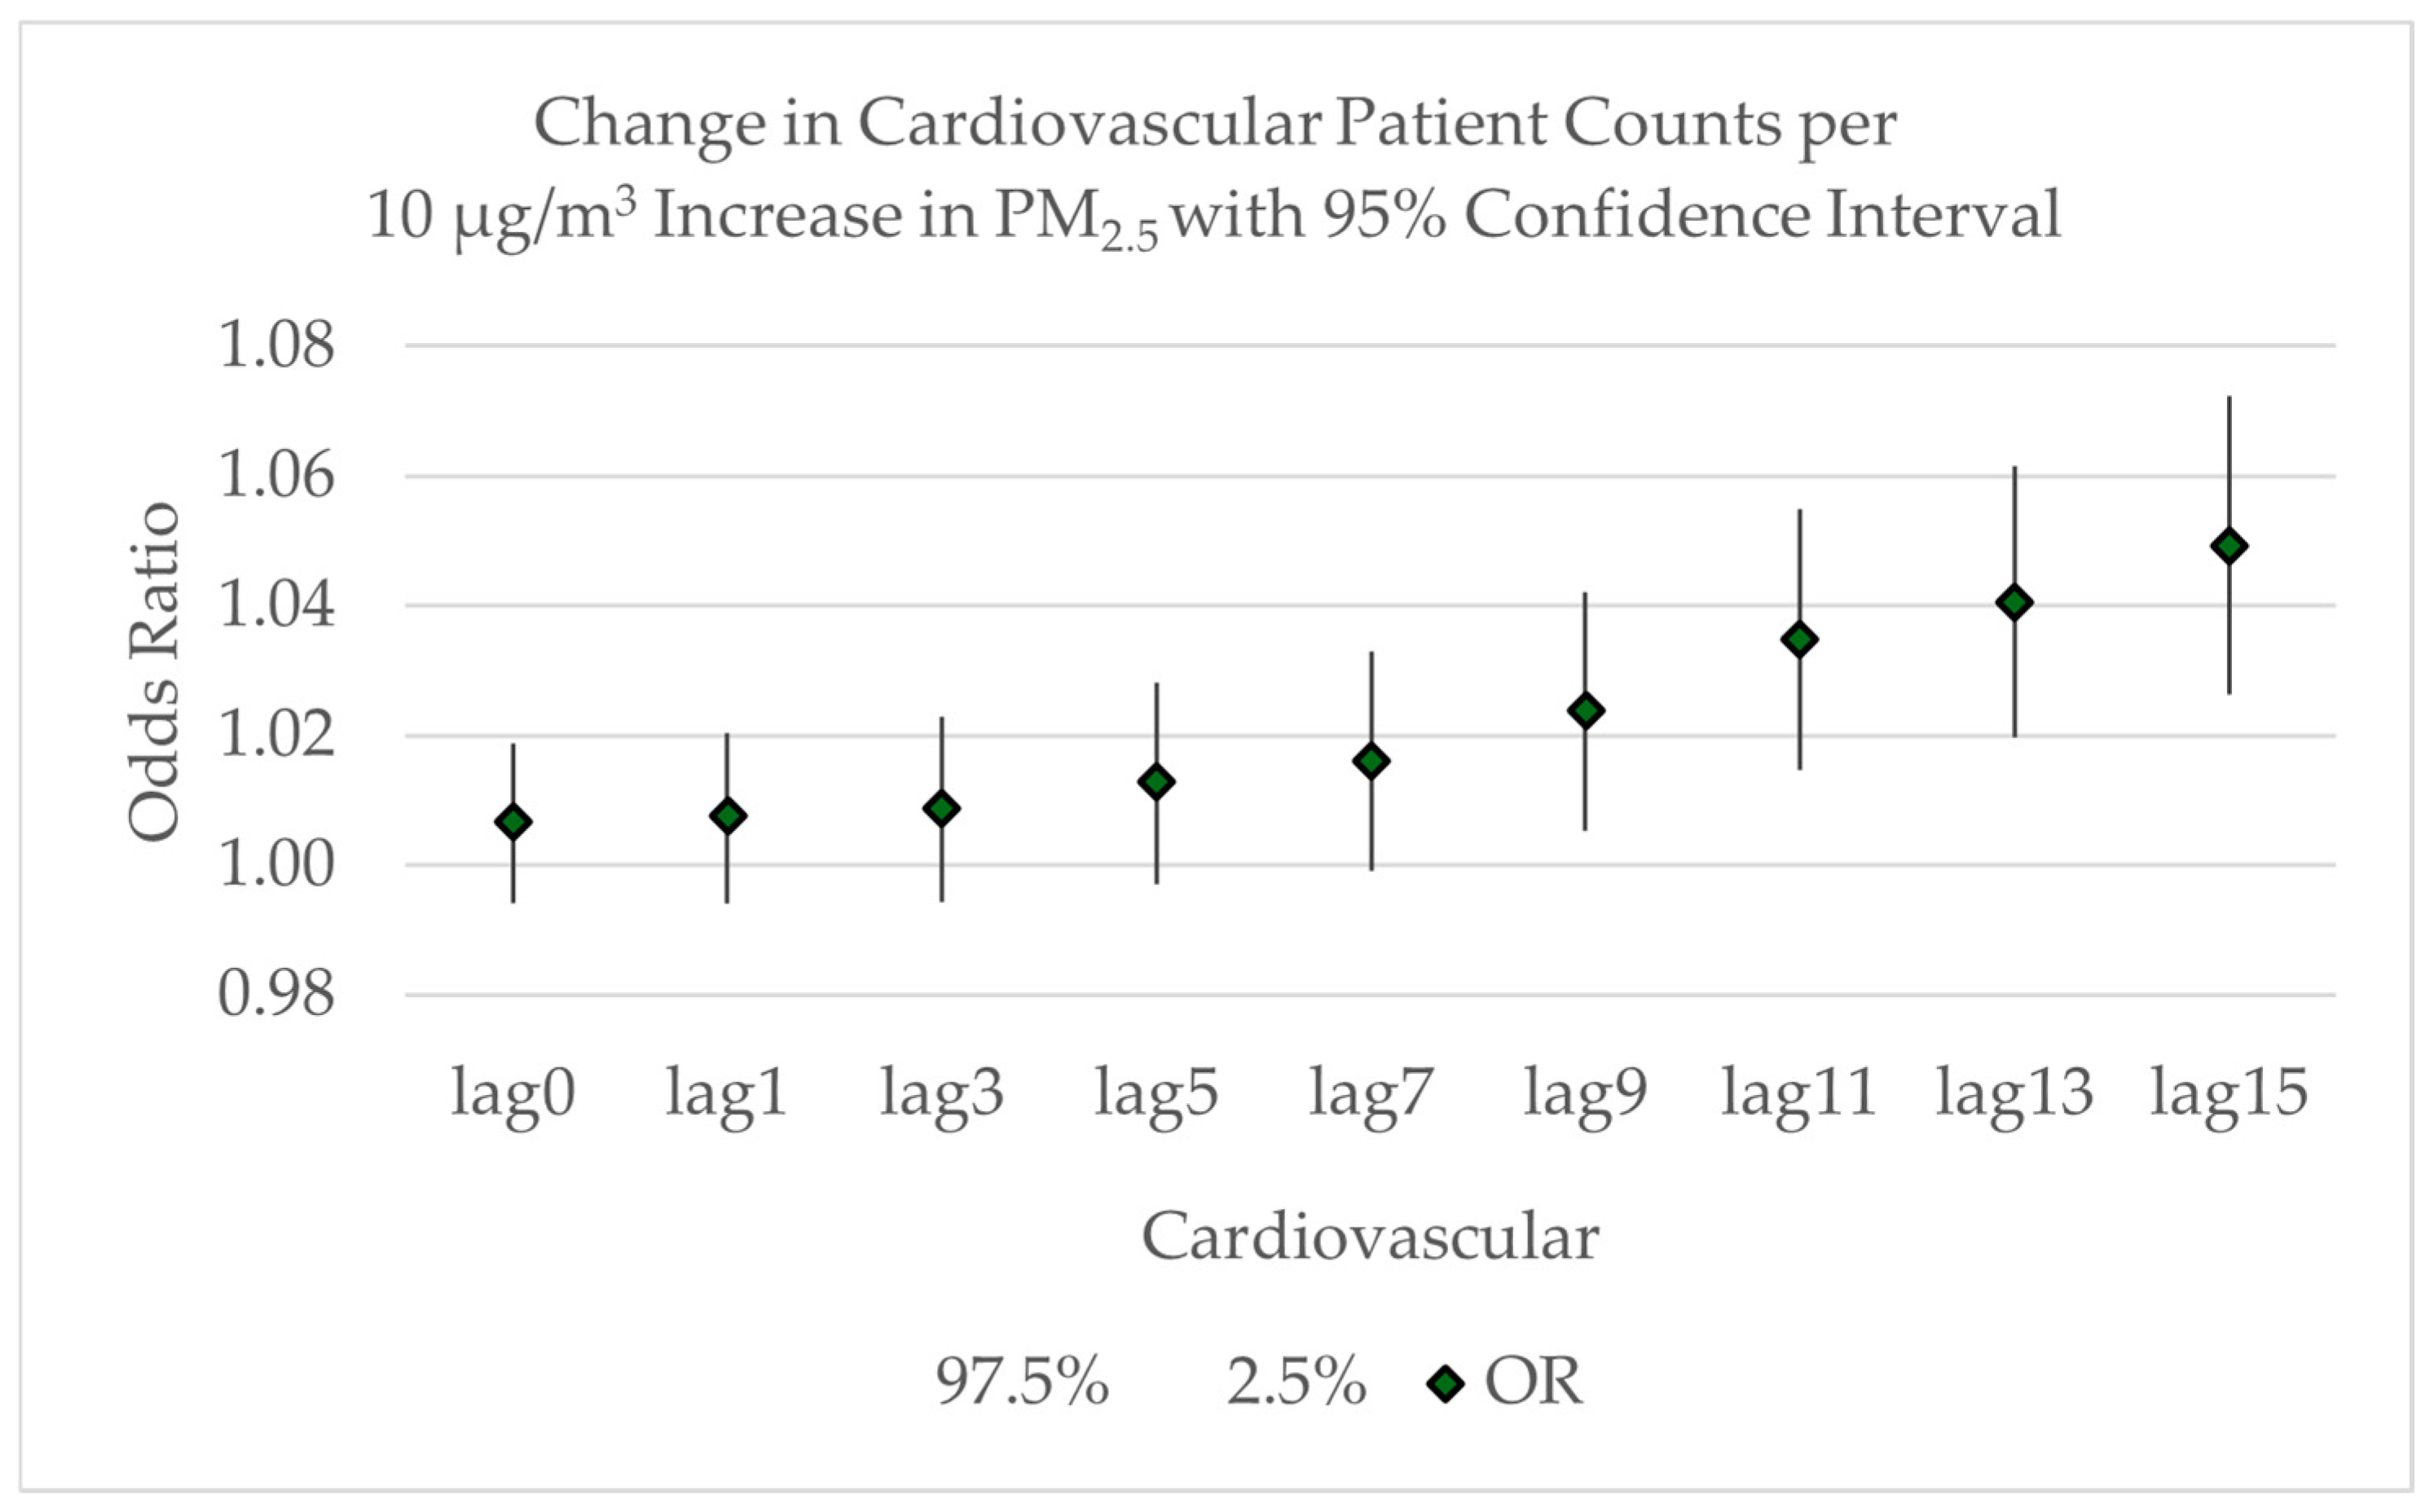
The odds ratios for the lagged averages associated with cardiovascular patient admissions are shown in Figure 8. Expected cardiovascular patient counts increase but remain insignificant through a 7-day lag period. The odds ratio becomes significant with a 10 μg/m3 increase in the average PM2.5 across a 9-day lag period, corresponding to an expected 2.4% increase in cardiovascular patient admissions (OR = 1.0239; 95% CI: 1.0054–1.0422). It continues to increase through a 15-day lag period, with an expected 4.9% increase in admissions (OR = 1.0493; 95% CI: 1.0265–1.0723). This 15-day lag period corresponds to an additional 0.25 cardiovascular patients. If the PM2.5 concentration rises from 10 μg/m3 to 35 μg/m3, an additional 0.63 cardiovascular patients could be expected. In a hypothetical worst-case scenario, if the PM2.5 concentration rises from, for example, 10 μg/m3 in the “moderate” category of the air quality index to 150 μg/m3 in the “very unhealthy” category for a long duration, an additional 3.5 cardiovascular patients could be expected. While these may seem relatively small patient numbers, the total number of licensed beds at the smallest of the study hospitals is 49. If the smoke concentrations were centered around this hospital, four additional patients would be expected, representing almost 10% of the licensed beds.
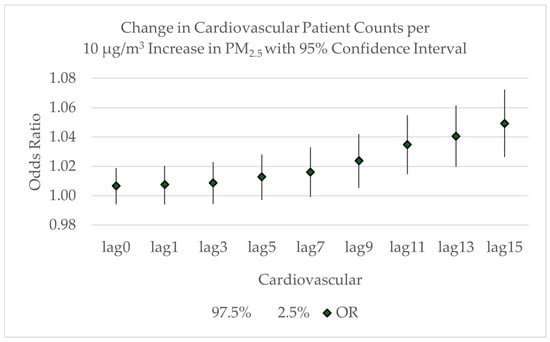
Figure 8.
Odds ratios with 95% confidence intervals for the increase in cardiovascular patient counts related to the lagged average increase in PM2.5 concentrations from lag = 0 to lag = 15.
Poor air quality for a day is associated with an expected increase in respiratory patients. When poor air quality lasts over a week, there is an increase in the expected number of both respiratory and cardiovascular patients.
4. Discussion
This study builds upon two previous analyses of wildfire smoke respiratory health impacts in the Rogue Valley region. This current study expands upon this work by incorporating airshed-based PM2.5 estimates at 4 km resolution, extending the study period through 2022, including cardiovascular conditions, and expanding the geographic scope to include Klamath County. An earlier case-crossover analysis [16] relied solely on monitor data and found that every 10 μg/m3 increase in PM2.5 was associated with a 2% increase in same-day respiratory hospital admissions (OR = 1.020; 95% CI: 1.004, 1.034), with extended exposure over nine days associated with a 4% increase (OR = 1.041; 95% CI: 1.018, 1.065). The same-day increase is similar to the 1.6% increase noted in the current study (OR = 1.0157; 95% CI: 1.0024, 1.0287), while the nine-day lag noted in the current study is slightly lower at 3% (OR = 1.0299; 95% CI: 1.0102, 1.0497). Our findings also align with those reported by Chapman, Clark, Farris, and Fitzpatrick [17], who used a generalized linear model with a binomial error structure to analyze 2018 data and found that the probability of exceeding respiratory hospital capacity increased with both PM2.5 levels and exposure duration.
Our analysis found that every 10 μg/m3 increase in PM2.5 was associated with a 1.6% increase in same-day respiratory hospital admissions (OR = 1.0157; 95% CI: 1.0024, 1.0287), with longer exposures showing stronger effects, with a 6.5% increase in admission rates over fifteen days (OR = 1.0645; 95% CI: 1.0400, 1.0894). These findings align with broader evidence from a global systematic review showing an increased risk of respiratory disease from smoke exposure (OR = 1.07; 95% CI: 1.06, 1.09) [7] and a meta-analysis demonstrating that respiratory emergency room visits increased by 0.36% (95% CI 0.19–0.53%) per 1 μg/m3 increase in wildfire smoke PM2.5 [1]. While our results are consistent with a statewide Oregon analysis that found significant associations between PM2.5 and asthma diagnoses in emergency room visits (OR: 1.089, 95% CI: 1.043–1.136) during the 2013 fire season [32], they differ from a Medford-specific analysis in the same study, which revealed no significant associations. This discrepancy may be attributed to the use of a binary smoke classifier with a relatively low 15 μg/m3 PM2.5 threshold in that analysis, which could have masked the relationship between smoke exposure and health outcomes.
Our study found no significant same-day increase in cardiovascular admissions from PM2.5 exposure but identified a 4.9% increase in hospital or emergency room admission rates for cardiovascular conditions associated with sustained exposure over fifteen days (OR = 1.0493; 95% CI: 1.0265, 1.0723). These results both complement and extend previous findings. A global systematic review reported increased risks for cardiovascular disease from smoke exposure (OR = 1.05; 95% CI: 1.03, 1.08) [7], while a meta-analysis found less consistent evidence, showing a non-statistically significant 0.06% increase (95% CI 0.00–0.12%) in same-day cardiovascular hospitalizations and no meaningful change in same-day emergency department visits (−0.03%; 95% CI −0.18–0.12%) [1]. Our findings suggest that the cardiovascular health impacts of wildfire smoke may be more evident with prolonged exposure rather than acute exposure, highlighting the importance of considering exposure duration in health impact assessments. Likewise, research consistently shows a relationship between acute and chronic respiratory illnesses and cardiovascular complications [33,34]. Repeated exposure to wildfire smoke likely creates cardiovascular problems in the long-term. In fact, Hoek et al. [35] found long-term exposure to PM2.5 was more associated with cardiovascular mortality than from non-malignant respiratory disease.
The variation in findings across studies may stem from several key factors. Differences in smoke composition between regions and fires could affect health impacts, as fuel types and burning conditions influence the chemical makeup of smoke. Behavioral differences among populations regularly exposed to wildfire smoke may also play a role, as people might develop adaptive strategies over time. These strategies often vary from community to community. Burke et al. [36] found important differences between high- and low-income neighborhoods. Additionally, the choice of exposure measurement technique can influence exposure assessment accuracy and the resulting health impact estimates. This study uses a novel measurement technique for exposure, airshed-based PM2.5, which could be used by other researchers.
Overall, this study has important implications for a range of policy and processes at community and state levels. Findings from this study can be used by area hospitals and health systems to inform staffing and resource allocation during smoke events. The design of the analysis can be used for specific hospitals, communities, and regions to build best practices and communication strategies between health care providers, regional environmental agencies, and public health entities. Additionally, this study serves as model for further use of the airshed dataset as a viable methodology to estimate smoke exposure while accounting for topographic changes.
This study has several important limitations. Our health records data did not include all hospitals in the study region, potentially affecting our analysis. While our airshed-based PM2.5 estimates offer improved spatial resolution over monitor-only approaches, this dataset represents a novel methodology that would benefit from further validation. These limitations should be considered when interpreting and applying our findings. Gaps remain in our understanding wildfire smoke health impacts. We could benefit from additional research on impacts from wildfire-specific PM compared to all-source or non-wildfire PM [4,37]. Longitudinal, population-based studies are needed to truly capture the total impact of PM exposure on cardiovascular and respiratory health. Additionally, research on behavioral adaptations, such as staying indoors or using air filtration, may clarify our understanding of health outcomes during smoke events [1]. These knowledge gaps suggest important directions for future research aimed at improving public health responses to wildfire smoke exposure.
Supplementary Materials
The following supporting information can be downloaded at: https://www.mdpi.com/article/10.3390/air3020013/s1, File S1: R code file.
Author Contributions
Conceptualization, A.L.M. and K.A.C.; methodology, A.L.M.; software, A.L.M.; validation, A.L.M.; formal analysis, A.L.M.; investigation, A.L.M. and K.A.C.; resources, K.A.C.; data curation, A.L.M.; writing—original draft preparation, A.L.M. and K.A.C.; writing—review and editing, A.L.M. and K.A.C.; visualization, A.L.M.; supervision, A.L.M.; project administration, K.A.C.; funding acquisition, K.A.C. All authors have read and agreed to the published version of the manuscript.
Funding
This study was funded in part by the U.S. Health Resources and Services Administration, GE1HS46237.
Institutional Review Board Statement
This study was conducted in accordance with the Declaration of Helsinki, and classified as exempt from IRB oversight by the Southern Oregon Institutional Review Board (January 2023).
Informed Consent Statement
Patient consent was waived due to de-identification of data and data release oversight from Asante Medical Center.
Data Availability Statement
The electronic medical records datasets presented in this article are not readily available because they contain private health information. Requests to access the datasets should be directed to Asante Medical Center. The airshed dataset presented in the study are not readily available. Requests to access the dataset should be directed to the Oregon Department of Environmental Quality.
Acknowledgments
Authors acknowledge contributions to research efforts by Pooya Naderi, Ashley Hansen, and Kerry Farris.
Conflicts of Interest
The authors declare that they have no known competing financial interests or personal relationships that could have appeared to influence the work reported in this paper.
Abbreviations
The following abbreviations are used in this manuscript:
| PM | Particulate matter |
| ICD | International Classification of Diseases |
| CI | Confidence Interval |
| OR | Odds Ratio |
| IRB | Institutional Review Board |
| AFD | Ashland Fire Department |
| CJF | Cave Junction Forest Service |
| CLR | Crater Lake |
| GPP | Grants Pass Parkside |
| KFP | Klamath Falls Peterson School |
| LCM | Lakeview Center and M St |
| MWJ | Medford Welch and Jackson |
| SCS | Shady Cove School |
| TAL | Talent |
References
- Gould, C.F.; Heft-Neal, S.; Johnson, M.; Aguilera, J.; Burke, M.; Nadeau, K. Health Effects of Wildfire Smoke Exposure. Annu. Rev. Med. 2024, 75, 277–292. [Google Scholar] [CrossRef] [PubMed]
- Larsen, A.E.; Reich, B.J.; Ruminski, M.; Rappold, A.G. Impacts of fire smoke plumes on regional air quality, 2006–2013. J. Expo. Sci. Environ. Epidemiol. 2018, 28, 319–327. [Google Scholar] [CrossRef] [PubMed]
- O’Dell, K.; Ford, B.; Fischer, E.V.; Pierce, J.R. Contribution of Wildland-Fire Smoke to US PM2.5 and Its Influence on Recent Trends. Environ. Sci. Technol. 2019, 53, 1797–1804. [Google Scholar] [CrossRef] [PubMed]
- Burke, M.; Driscoll, A.; Heft-Neal, S.; Xue, J.; Burney, J.; Wara, M. The changing risk and burden of wildfire in the United States. Proc. Natl. Acad. Sci. USA 2021, 118, e2011048118. [Google Scholar] [CrossRef]
- Mills, D.; Jones, R.; Wobus, C.; Ekstrom, J.; Jantarasami, L.; St. Juliana, A.; Crimmins, A. Projecting Age-Stratified Risk of Exposure to Inland Flooding and Wildfire Smoke in the United States under Two Climate Scenarios. Environ. Health Perspect. 2018, 126, 047007. [Google Scholar] [CrossRef]
- Childs, M.L.; Li, J.; Wen, J.; Heft-Neal, S.; Driscoll, A.; Wang, S.; Gould, C.F.; Qiu, M.; Burney, J.; Burke, M. Daily Local-Level Estimates of Ambient Wildfire Smoke PM2.5 for the Contiguous US. Environ. Sci. Technol. 2022, 56, 13607–13621. [Google Scholar] [CrossRef]
- Fu, P.; Mago, V. The association between fire smoke exposure and emergency department (ED) visits and hospital admissions (HA): A systematic review and meta-analysis. Heliyon 2024, 10, e38024. [Google Scholar] [CrossRef]
- Arriagada, N.B.; Horsley, J.A.; Palmer, A.J.; Morgan, G.G.; Tham, R.; Johnston, F.H. Association between fire smoke fine particulate matter and asthma-related outcomes: Systematic review and meta-analysis. Environ. Res. 2019, 179, 108777. [Google Scholar] [CrossRef]
- Heft-Neal, S.; Gould, C.F.; Childs, M.L.; Kiang, M.V.; Nadeau, K.C.; Duggan, M.; Bendavid, E.; Burke, M. Emergency department visits respond nonlinearly to wildfire smoke. Proc. Natl. Acad. Sci. USA 2023, 120, e2302409120. [Google Scholar] [CrossRef]
- Black, C.; Tesfaigzi, Y.; Bassein, J.A.; Miller, L.A. Wildfire smoke exposure and human health: Significant gaps in research for a growing public health issue. Environ. Toxicol. Pharmacol. 2017, 55, 186–195. [Google Scholar] [CrossRef]
- Cascio, W.E. Wildland fire smoke and human health. Sci. Total Environ. 2018, 624, 586–595. [Google Scholar] [CrossRef] [PubMed]
- Haikerwal, A.; Akram, M.; Sim, M.R.; Meyer, M.; Abramson, M.J.; Dennekamp, M. Fine particulate matter (PM2.5) exposure during a prolonged wildfire period and emergency department visits for asthma. Respirology 2016, 21, 88–94. [Google Scholar] [CrossRef] [PubMed]
- Hutchinson, J.A.; Vargo, J.; Milet, M.; French, N.H.F.; Billmire, M.; Johnson, J.; Hoshiko, S. The San Diego 2007 wildfires and Medi-Cal emergency department presentations, inpatient hospitalizations, and outpatient visits: An observational study of smoke exposure periods and a bidirectional case-crossover analysis. PLoS. Med. 2018, 15, e1002601. [Google Scholar] [CrossRef]
- Johnston, F.H.; Bailie, R.S.; Pilotto, L.S.; Hanigan, I.C. Ambient biomass smoke and cardio-respiratory hospital admissions in Darwin, Australia. BMC Public Health 2007, 7, 240. [Google Scholar] [CrossRef] [PubMed]
- Stowell, J.D.; Geng, G.; Saikawa, E.; Chang, H.H.; Fu, J.; Yang, C.E.; Zhu, Q.; Liu, Y.; Strickland, M.J. Associations of wildfire smoke PM2.5 exposure with cardiorespiratory events in Colorado 2011–2014. Environ. Int. 2019, 133, 105151. [Google Scholar] [CrossRef]
- Mitchell, A.L.; Chapman, K.; Farris, K.; Naderi, P.; Hansen, A. A case-crossover analysis to quantify the impact of wildfire smoke on hospital respiratory admissions in the Rogue Valley, Oregon. Public Health Pract. 2024, 8, 100540. [Google Scholar] [CrossRef]
- Chapman, K.A.; Clark, A.E.; Farris, K.L.; Fitzpatrick, S. Fires, Respiratory Hospitalizations, and Capacity Issues. In Sixth Oregon Climate Assessment; Fleishman, E., Ed.; Climate Change Research Institute, Oregon State University: Corvallis, OR, USA, 2023; pp. 210–221. [Google Scholar]
- Wettstein, Z.S.; Hoshiko, S.; Fahimi, J.; Harrison, R.J.; Cascio, W.E.; Rappold, A.G. Cardiovascular and Cerebrovascular Emergency Department Visits Associated with Wildfire Smoke Exposure in California in 2015. J. Am. Heart Assoc. 2018, 7, e007492. [Google Scholar] [CrossRef]
- Henderson, S.B.; Brauer, M.; Macnab, Y.C.; Kennedy, S.M. Three measures of forest fire smoke exposure and their associations with respiratory and cardiovascular health outcomes in a population-based cohort. Environ. Health Perspect. 2011, 119, 1266–1271. [Google Scholar] [CrossRef]
- Gan, R.W.; Ford, B.; Lassman, W.; Pfister, G.; Vaidyanathan, A.; Fischer, E.; Volckens, J.; Pierce, J.R.; Magzamen, S. Comparison of wildfire smoke estimation methods and associations with cardiopulmonary-related hospital admissions. Geohealth 2017, 1, 122–136. [Google Scholar] [CrossRef]
- Lassman, W.; Ford, B.; Gan, R.W.; Pfister, G.; Magzamen, S.; Fischer, E.V.; Pierce, J.R. Spatial and temporal estimates of population exposure to wildfire smoke during the Washington state 2012 wildfire season using blended model, satellite, and in situ data. GeoHealth 2017, 1, 106–121. [Google Scholar] [CrossRef]
- Armstrong, B.G.; Gasparrini, A.; Tobias, A. Conditional Poisson models: A flexible alternative to conditional logistic case cross-over analysis. BMC Med. Res. Methodol. 2014, 14, 122. [Google Scholar] [CrossRef]
- Carracedo-Martínez, E.; Taracido, M.; Tobias, A.; Saez, M.; Figueiras, A. Case-Crossover Analysis of Air Pollution Health Effects: A Systematic Review of Methodology and Application. Environ. Health Perspect. 2010, 118, 1173–1182. [Google Scholar] [CrossRef] [PubMed]
- Lu, Y.; Symons, J.M.; Geyh, A.; Zeger, S.L. An approach to checking case-crossover analyses based on equivalence with time-series methods. Epidemiology 2008, 19, 169–175. [Google Scholar] [CrossRef]
- Peters, A.; Klot, S.v.; Berglind, N.; Hörmann, A.; Löwel, H.; Nyberg, F.; Pekkanen, J.; Perucci, C.A.; Stafoggia, M.; Sunyer, J.; et al. Comparison of different methods in analyzing short-term air pollution effects in a cohort study of susceptible individuals. Epidemiol. Perspect. Innov. 2006, 3, 10. [Google Scholar] [CrossRef]
- Maclure, M. The Case-Crossover Design: A Method for Studying Transient Effects on the Risk of Acute Events. Am. J. Epidemiol. 1991, 133, 144–153. [Google Scholar] [CrossRef]
- Bateson, T.F.; Schwartz, J. Control for seasonal variation and time trend in case-crossover studies of acute effects of environmental exposures. Epidemiology 1999, 10, 539–544. [Google Scholar] [CrossRef]
- Jaakkola, J.J.K. Case-crossover design in air pollution epidemiology. Eur. Respir. J. 2003, 21, 81S–85S. [Google Scholar] [CrossRef]
- Szyszkowicz, M. Case-Crossover Method with a Short Time-Window. Int. J. Environ. Res. Public Health 2020, 17, 202. [Google Scholar] [CrossRef]
- Zhang, Z. Case-crossover design and its implementation in R. Ann. Transl. Med. 2016, 4, 341. [Google Scholar] [CrossRef]
- Mitchell, A.L.; Chapman, K. AIRE Center, Oregon Institute of Technology, Klamath Falls, OR, USA. 2025; manuscript in preparation. [Google Scholar]
- Gan, R.W.; Liu, J.; Ford, B.; O’Dell, K.; Vaidyanathan, A.; Wilson, A.; Volckens, J.; Pfister, G.; Fischer, E.V.; Pierce, J.R.; et al. The association between wildfire smoke exposure and asthma-specific medical care utilization in Oregon during the 2013 wildfire season. J. Expo. Sci. Environ. Epidemiol. 2020, 30, 618–628. [Google Scholar] [CrossRef]
- Carter, P.; Lagan, J.; Fortune, C.; Bhatt, D.; Vestbo, J.; Niven, R.; Chaudhuri, N.; Schelbert, E.; Potluri, R.; Miller, C. Association of Cardiovascular Disease with Respiratory Disease. J. Am. Coll. Cardiol. 2019, 73, 2166–2177. [Google Scholar] [CrossRef] [PubMed]
- Schikowski, T.; Sugiri, D.; Ranft, U.; Gehring, U.; Heinrich, J.; Wichmann, H.-E.; Krämer, U. Does respiratory health contribute to the effects of long-term air pollution exposure on cardiovascular mortality? Respir. Res. 2007, 8, 20. [Google Scholar] [CrossRef] [PubMed]
- Hoek, G.; Krishnan, R.M.; Beelen, R.; Peters, A.; Ostro, B.; Brunekreef, B.; Kaufman, J.D. Long-term air pollution exposure and cardio- respiratory mortality: A review. Environ. Health 2013, 12, 43. [Google Scholar] [CrossRef] [PubMed]
- Burke, M.; Weill, J.A.; Heft-Neal, S.; Burney, J.A.; Li, J.; Driscoll, A.; Wen, J.; Baylis, P.; Stigler, M.; Childs, M.L.; et al. Exposures and behavioural responses to wildfire smoke. Nat. Hum. Behav. 2022, 6, 1351–1361. [Google Scholar] [CrossRef]
- Jiao, A.; Headon, K.; Han, T.; Umer, W.; Wu, J. Associations between short-term exposure to wildfire particulate matter and respiratory outcomes: A systematic review. Sci. Total Environ. 2023, 907, 168134. [Google Scholar] [CrossRef]
Disclaimer/Publisher’s Note: The statements, opinions and data contained in all publications are solely those of the individual author(s) and contributor(s) and not of MDPI and/or the editor(s). MDPI and/or the editor(s) disclaim responsibility for any injury to people or property resulting from any ideas, methods, instructions or products referred to in the content. |
© 2025 by the authors. Licensee MDPI, Basel, Switzerland. This article is an open access article distributed under the terms and conditions of the Creative Commons Attribution (CC BY) license (https://creativecommons.org/licenses/by/4.0/).