
Decarbonizing the Transportation Sector: A Review on the Role of Electric Vehicles Towards the European Green Deal for the New Emission Standards


Abstract
1. Introduction
- simpler infrastructure and low maintenance requirements;
- low to zero energy cost, as renewable sources can be used for charging;
- a three times more efficient powertrain compared to ICEs;
- comfortable driving with minimized noise and GHG emissions [8].
- the increasing cost of such metals as lithium, cobalt, and aluminum;
- massive diesel utilization required by trucks at the mining sites;
- the increased mass of an EV requires more power to ensure high performance compared to an ICEV (internal combustion engine vehicle).
2. Internal Combustion Engines
2.1. Evolution of ICEs
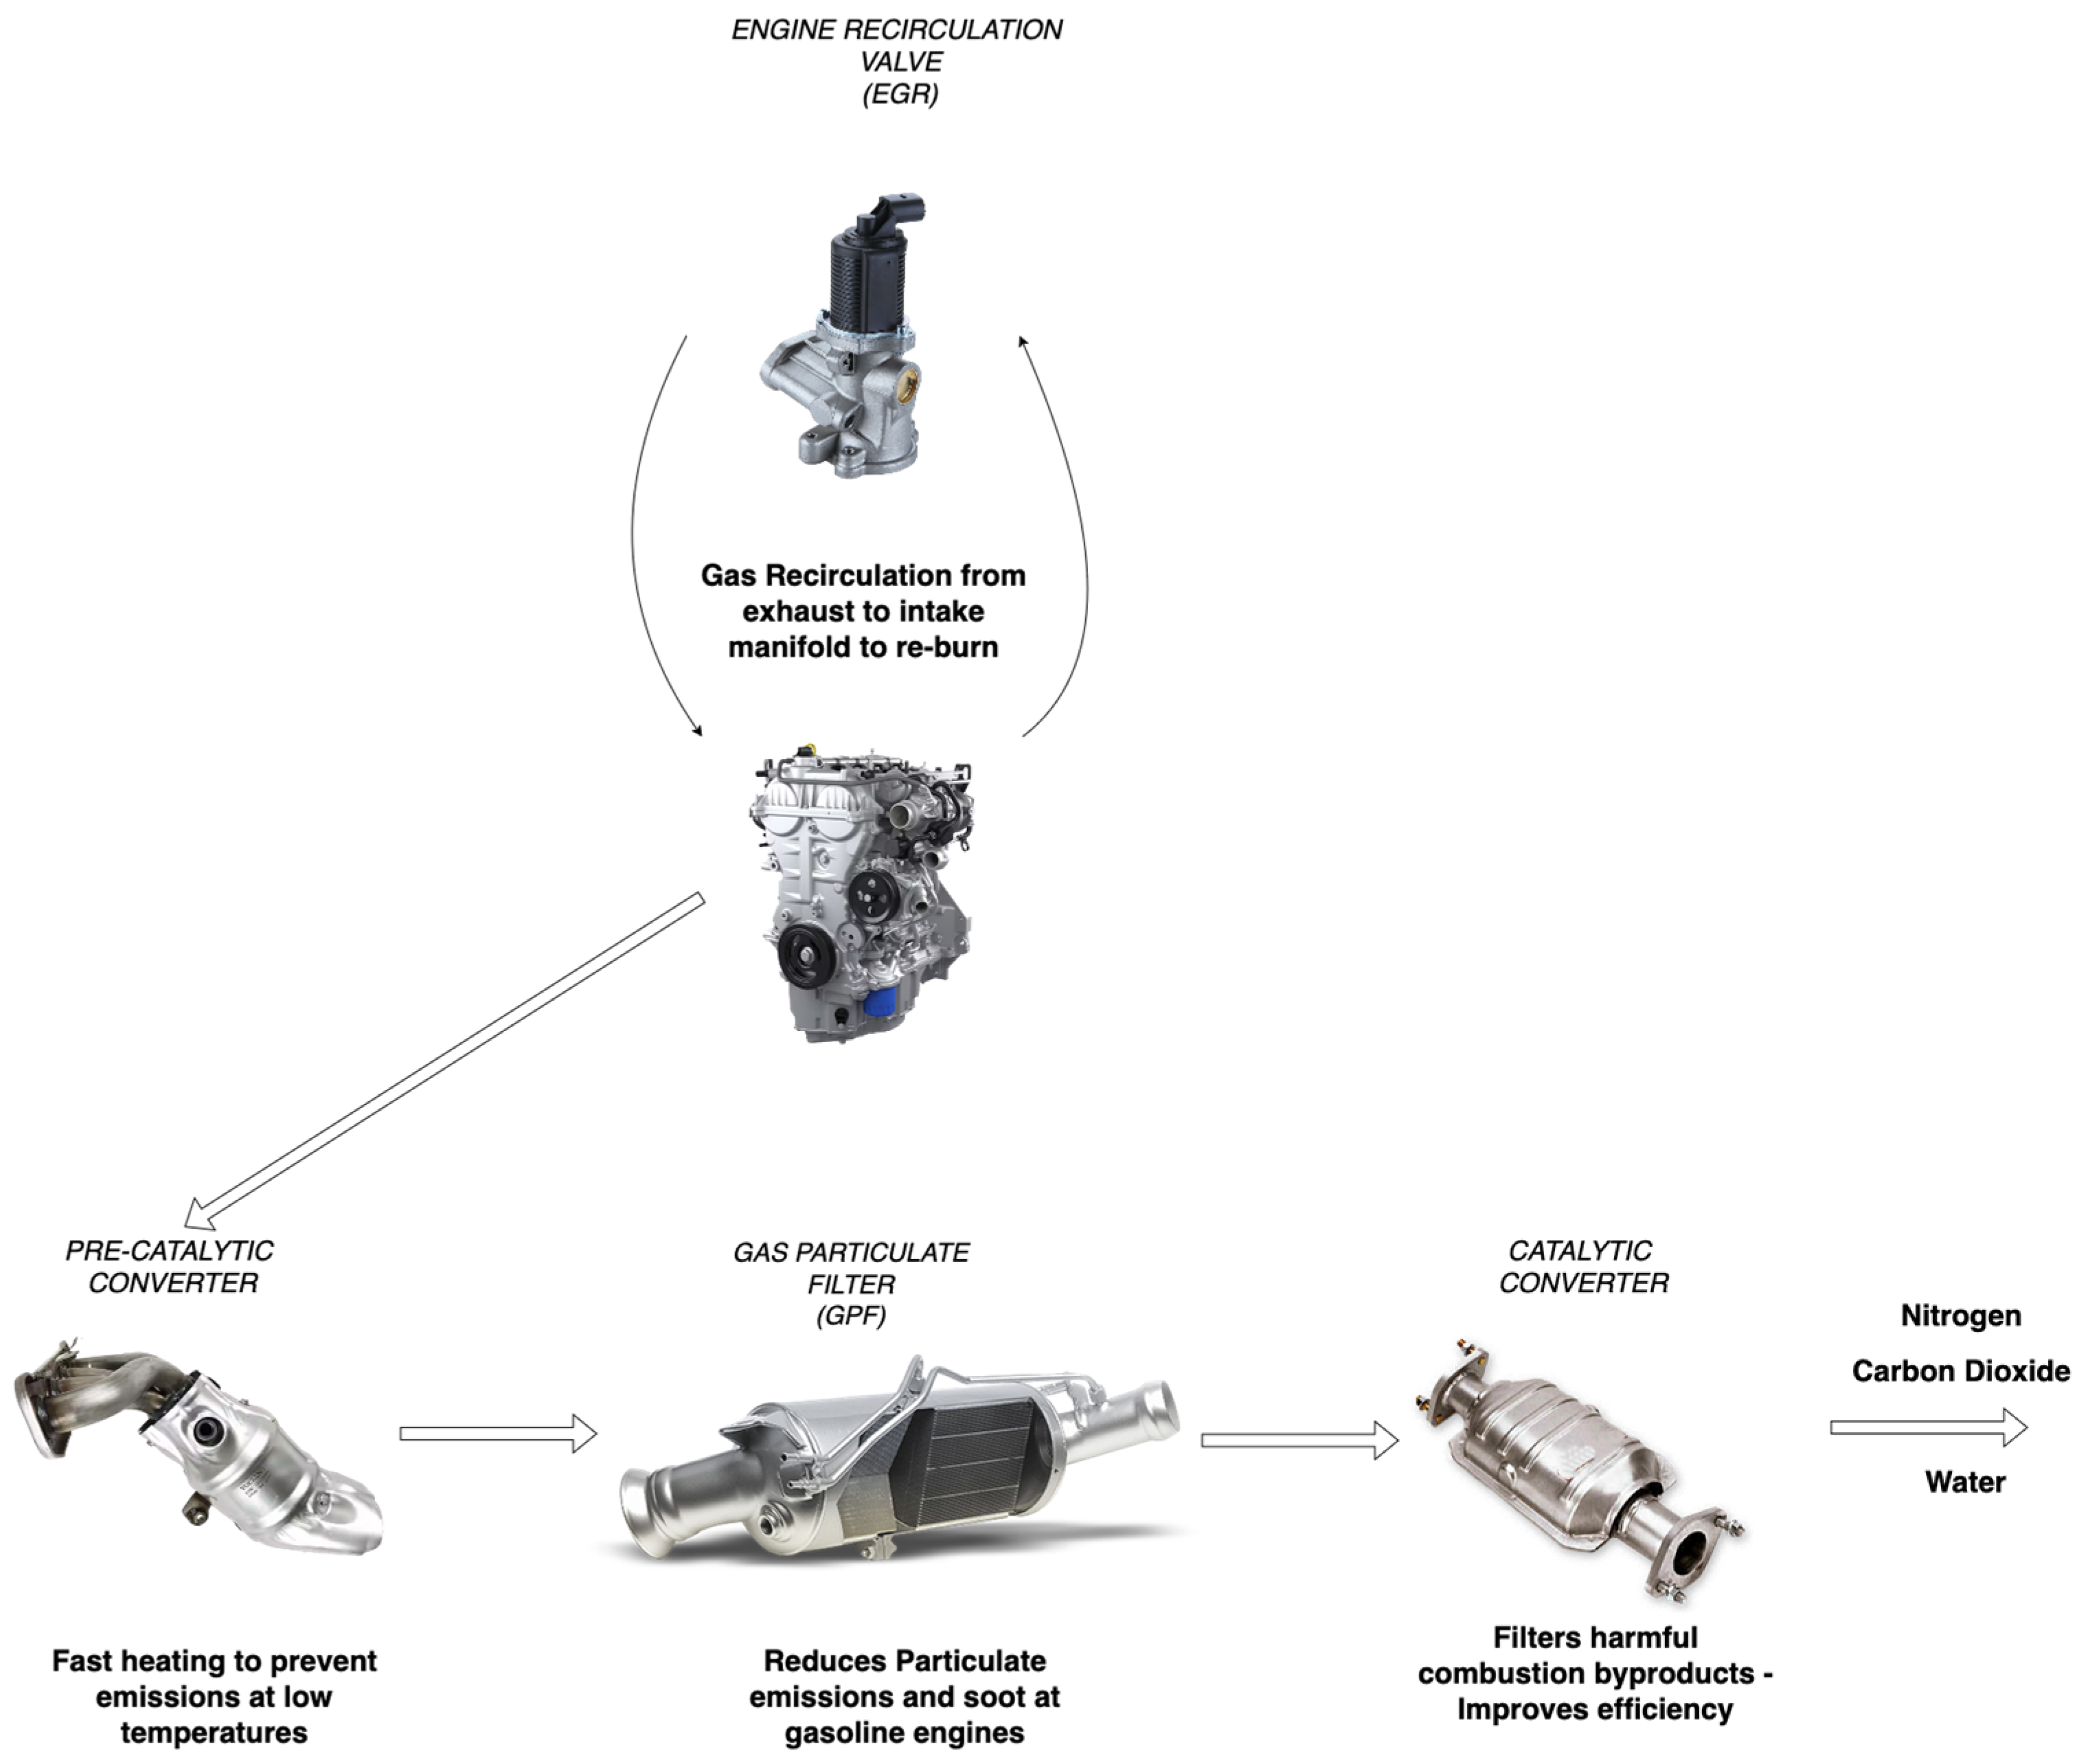
- an advanced catalyst system with a precatalytic converter to convert 90% of toxic emissions such as carbon monoxide and nitric oxide to CO2 and NOX, respectively;
- an exhaust gas recirculation (EGR) valve that returns a portion of the exhaust gases into the engine cylinder for feedback, thus reducing NOX and enhancing power as pumping losses are reduced;
- gasoline and diesel particulate filters (GPF/DPF) that capture excess soot and other toxic gases diverted by combustion;
- the use of urea, injected into the exhaust to minimize nitrogen oxides in diesel engines.
- A high average of 380 g/kWh for Germany.
- A median of 370 g/kWh for the United States.
- Increased emissions for China at 582 g per kWh.
- A very low standard of 30 g CO2eq per kWh for Norway.
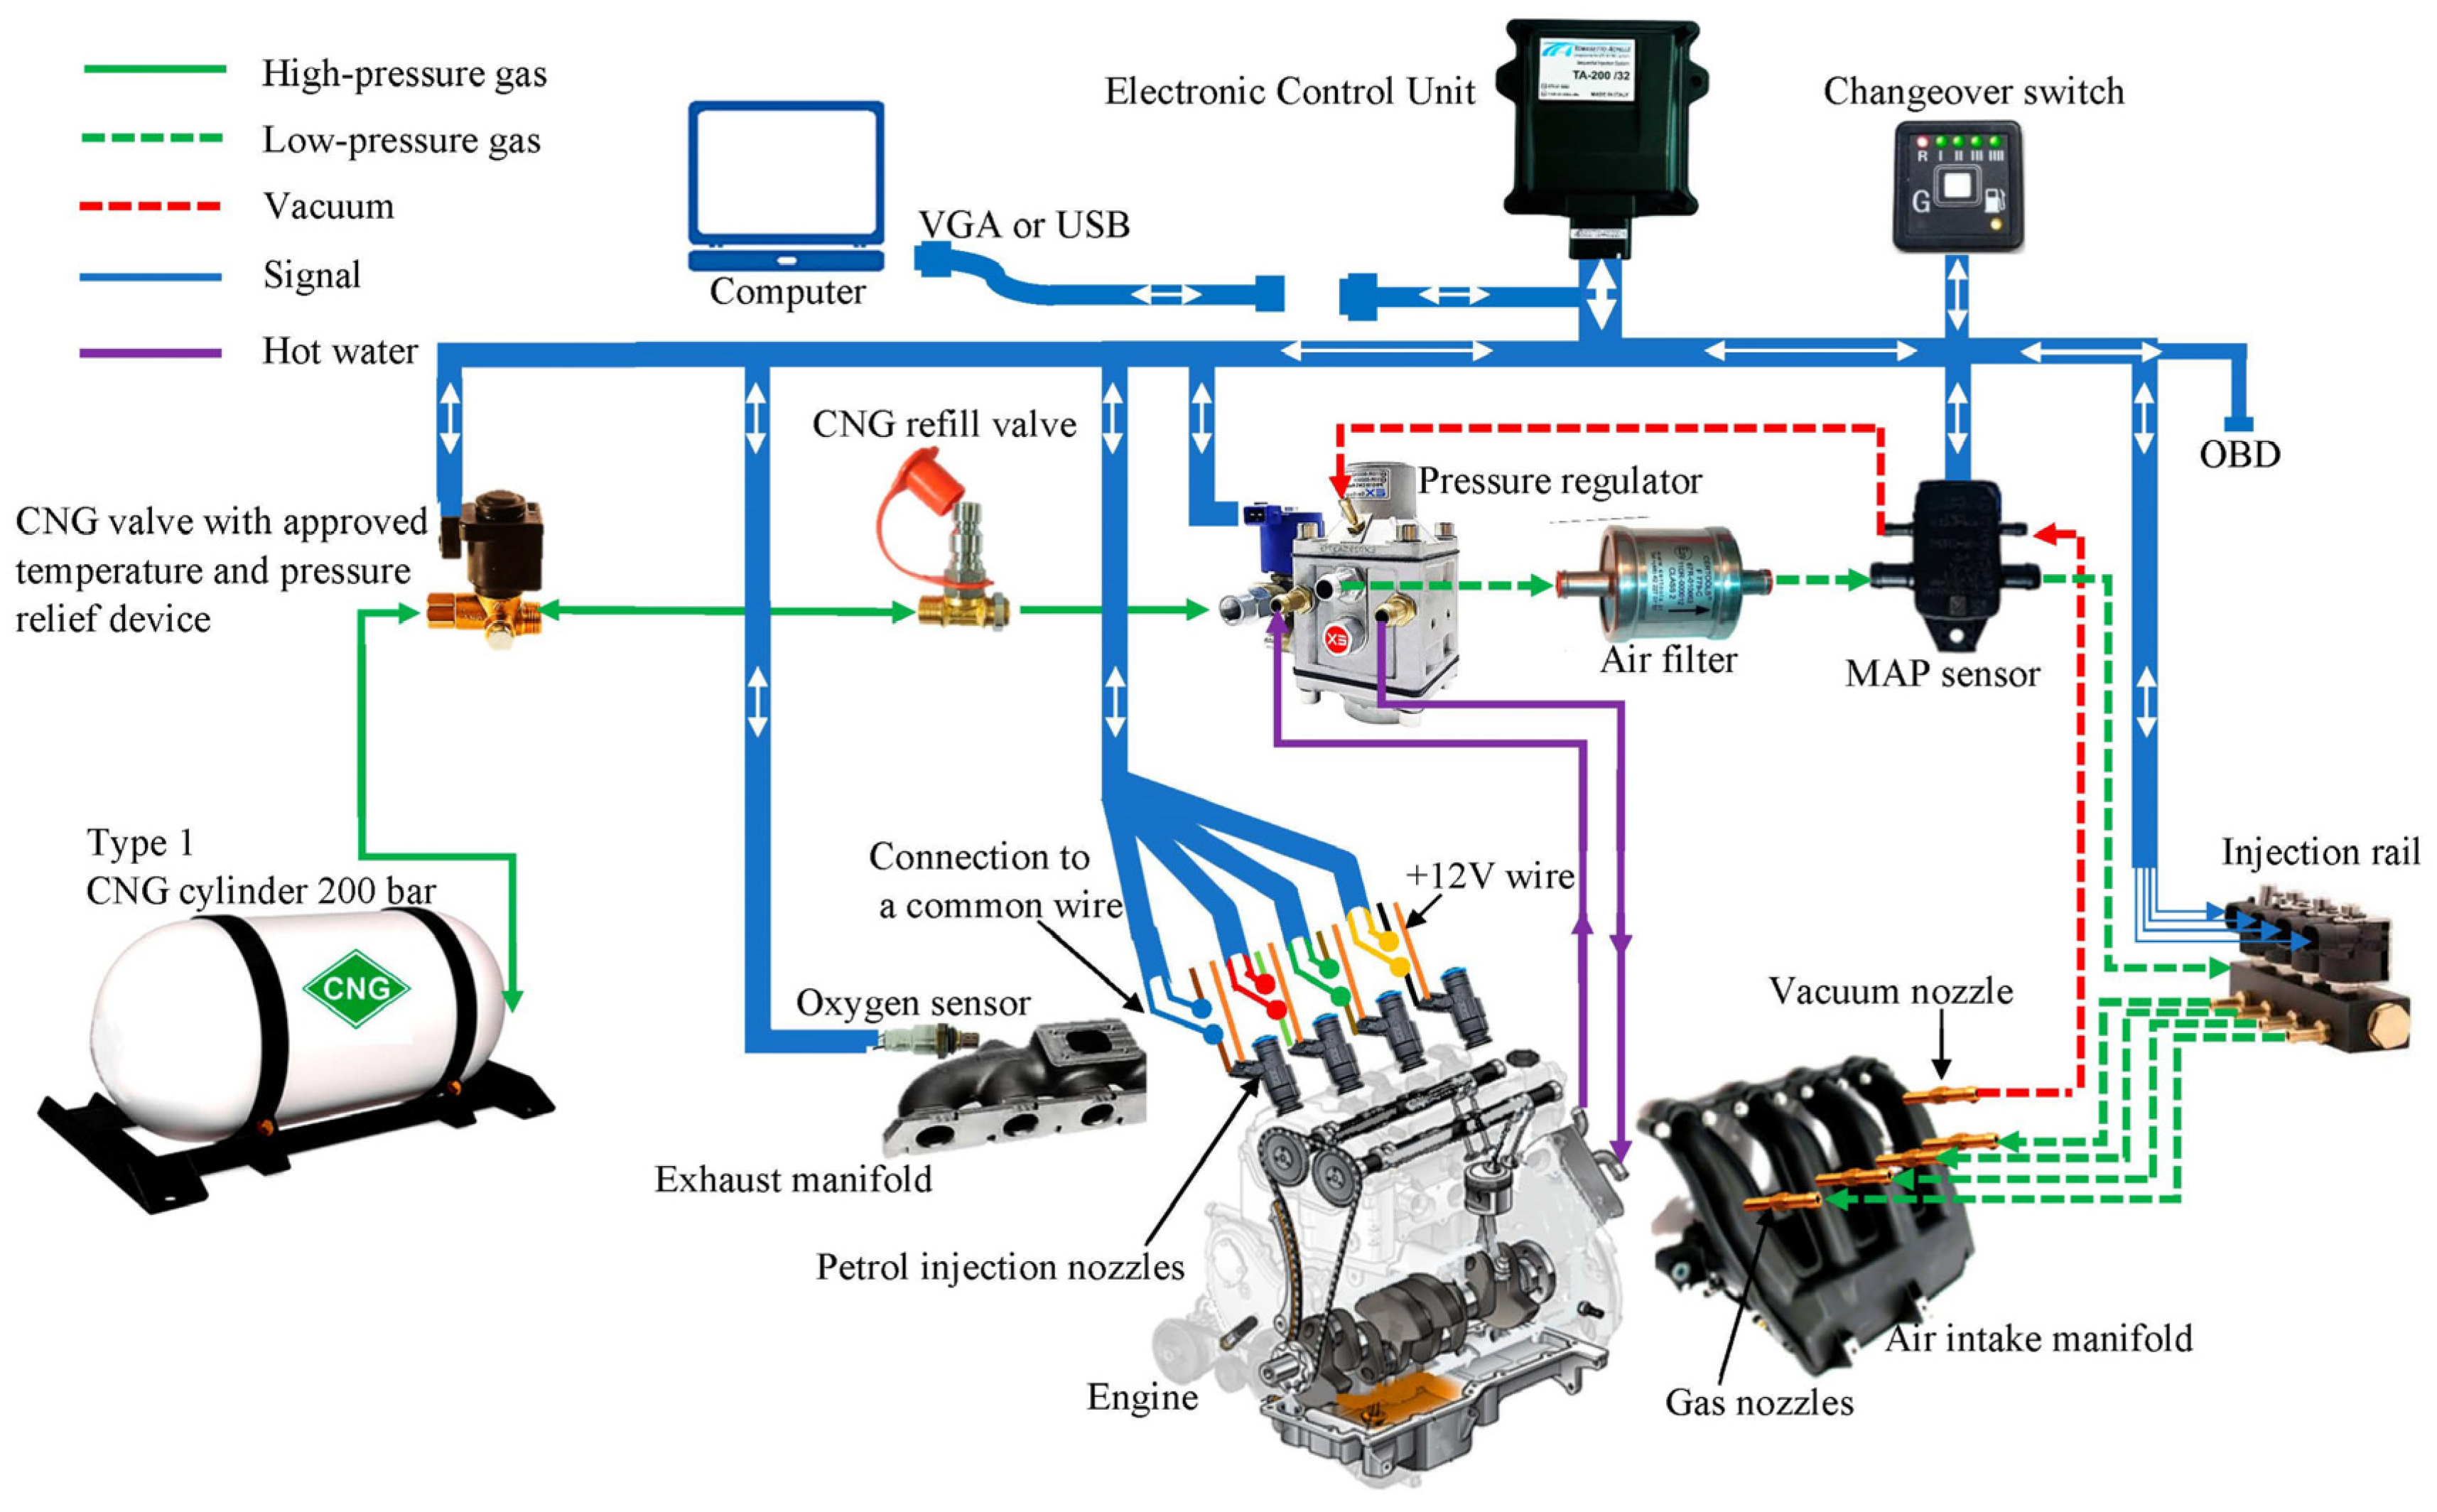
2.2. Alternative and Synthetic Fuels
- An auxiliary tank along with the fuel pump and lines.
- A pressure regulator and fuel injectors.
- A control module connected in parallel with the main one via CAN bus.
3. Electric and Hybrid Vehicles
3.1. Hybrid Electric Vehicles and Fuel Cells
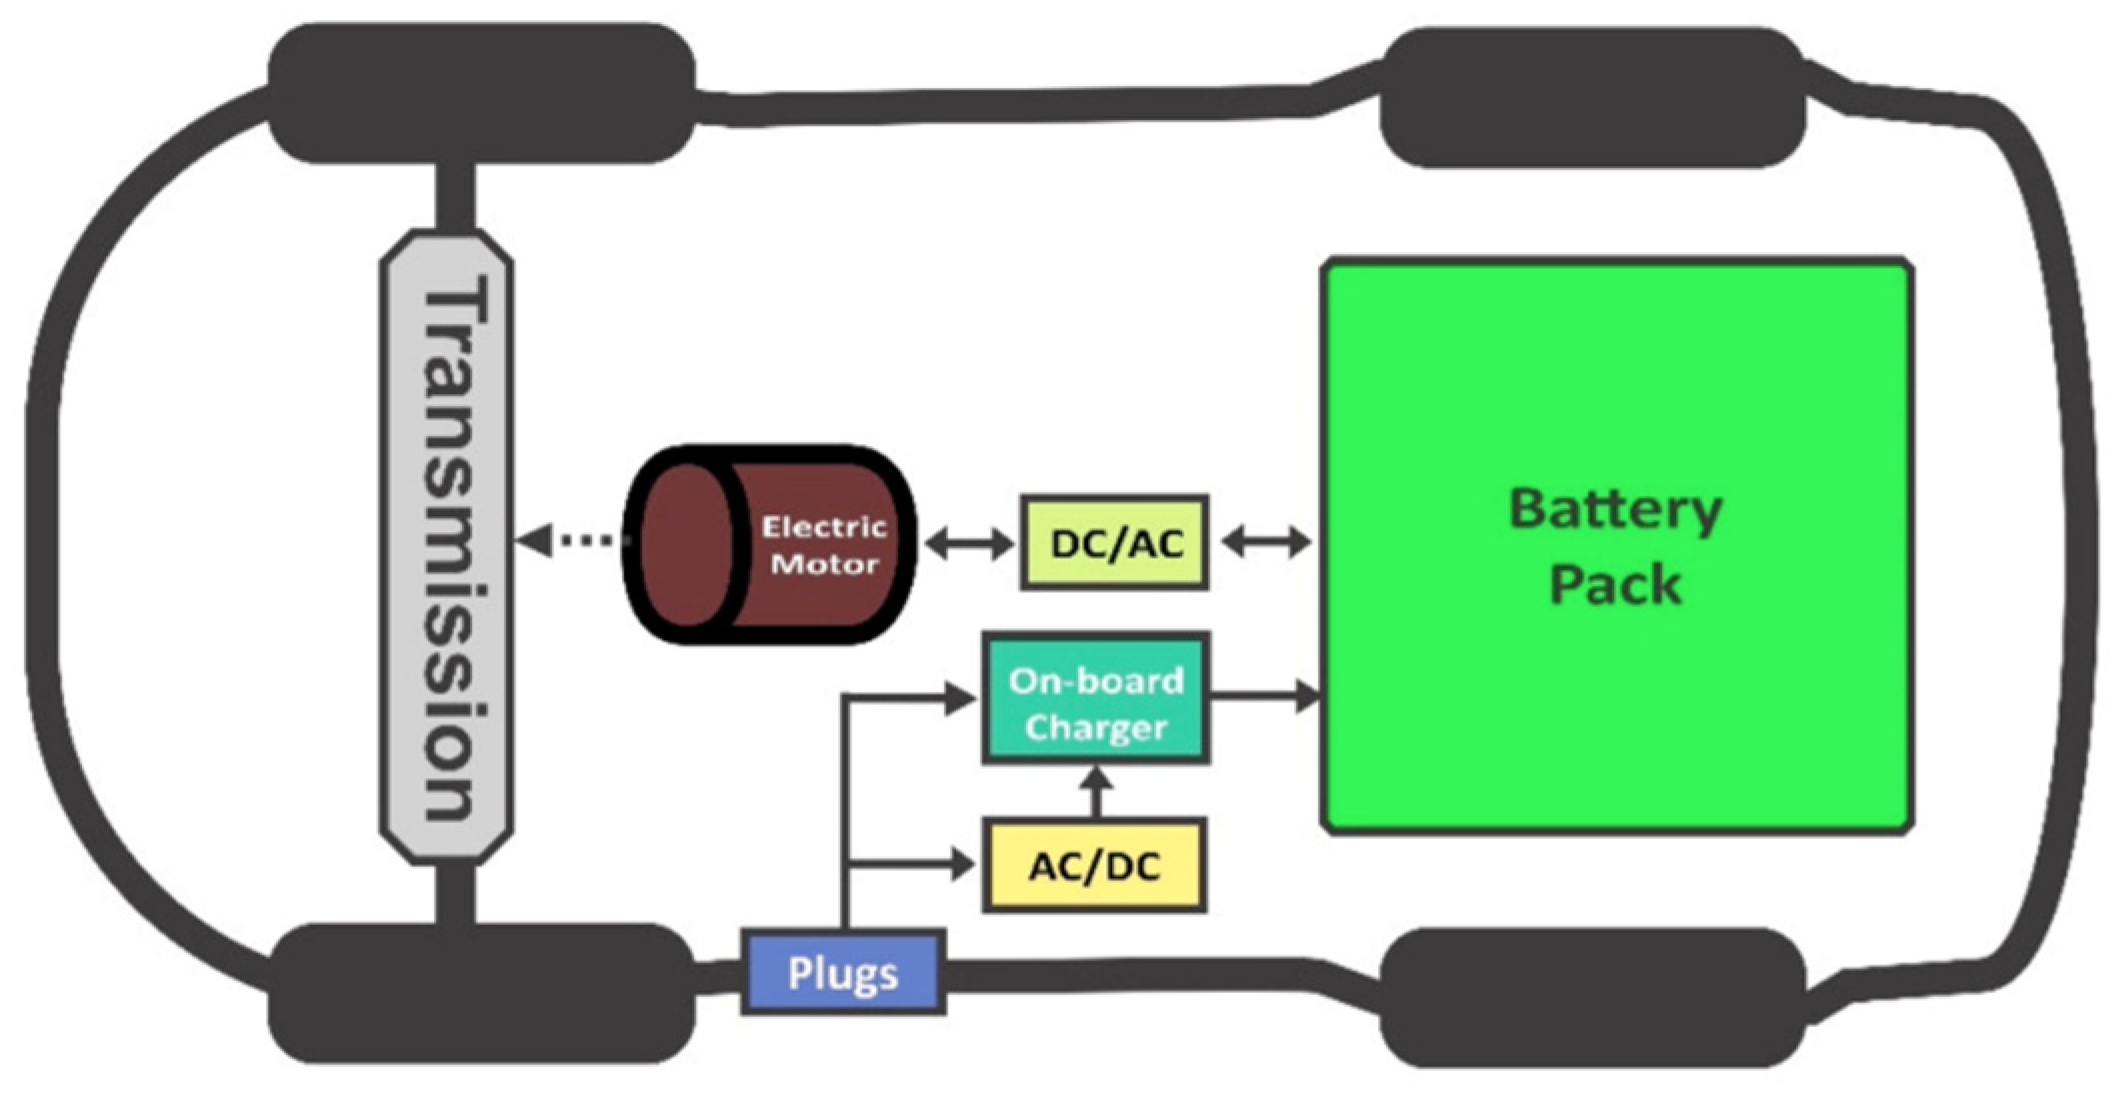
3.2. Battery Electric Vehicles
- limited range;
- low availability of public chargers and long charging time;
- impact on the grid as electricity demand will increase rapidly;
- high operational cost;
- VAT and tax deduction.
- Exemption from registration fees and road tolls.
- Purchase cost reduction or cashback.
- Upgrade of the utility grid.
- Free charging at select spots.
- Widely available charging station infrastructure.
- Subsidies for renewable source installation.
- Reduced or no cost for charger installation in-house.
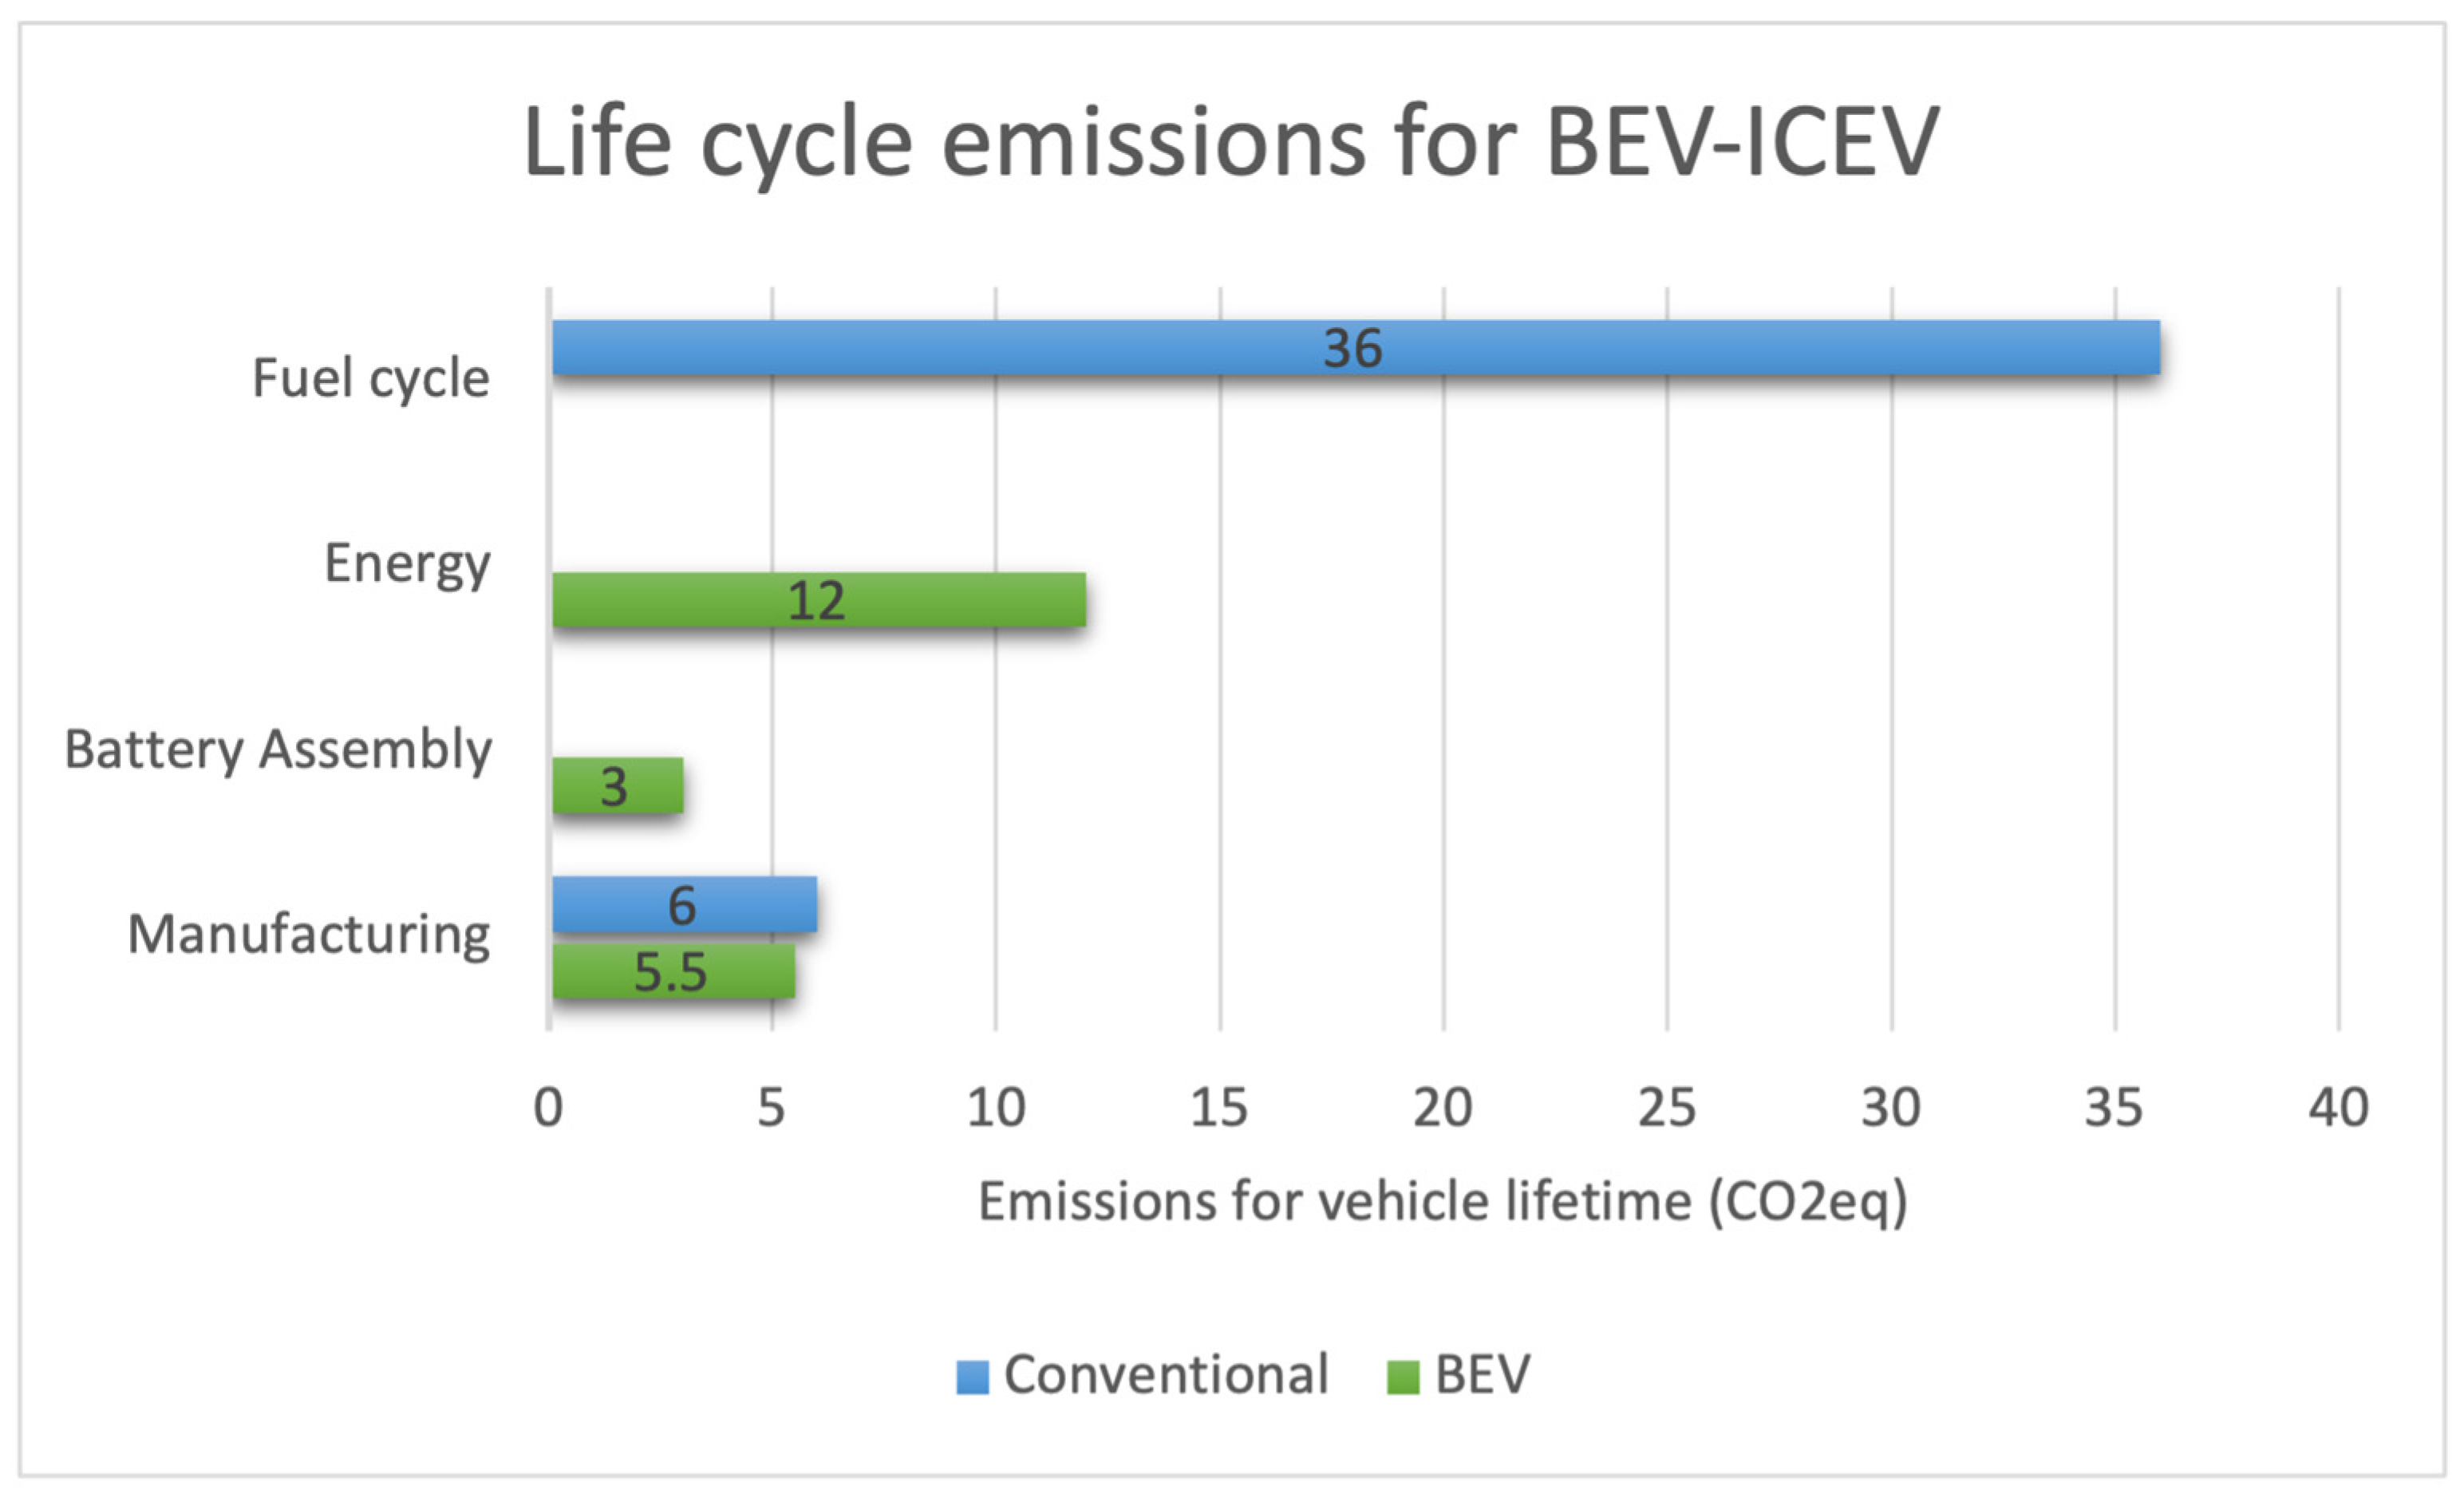
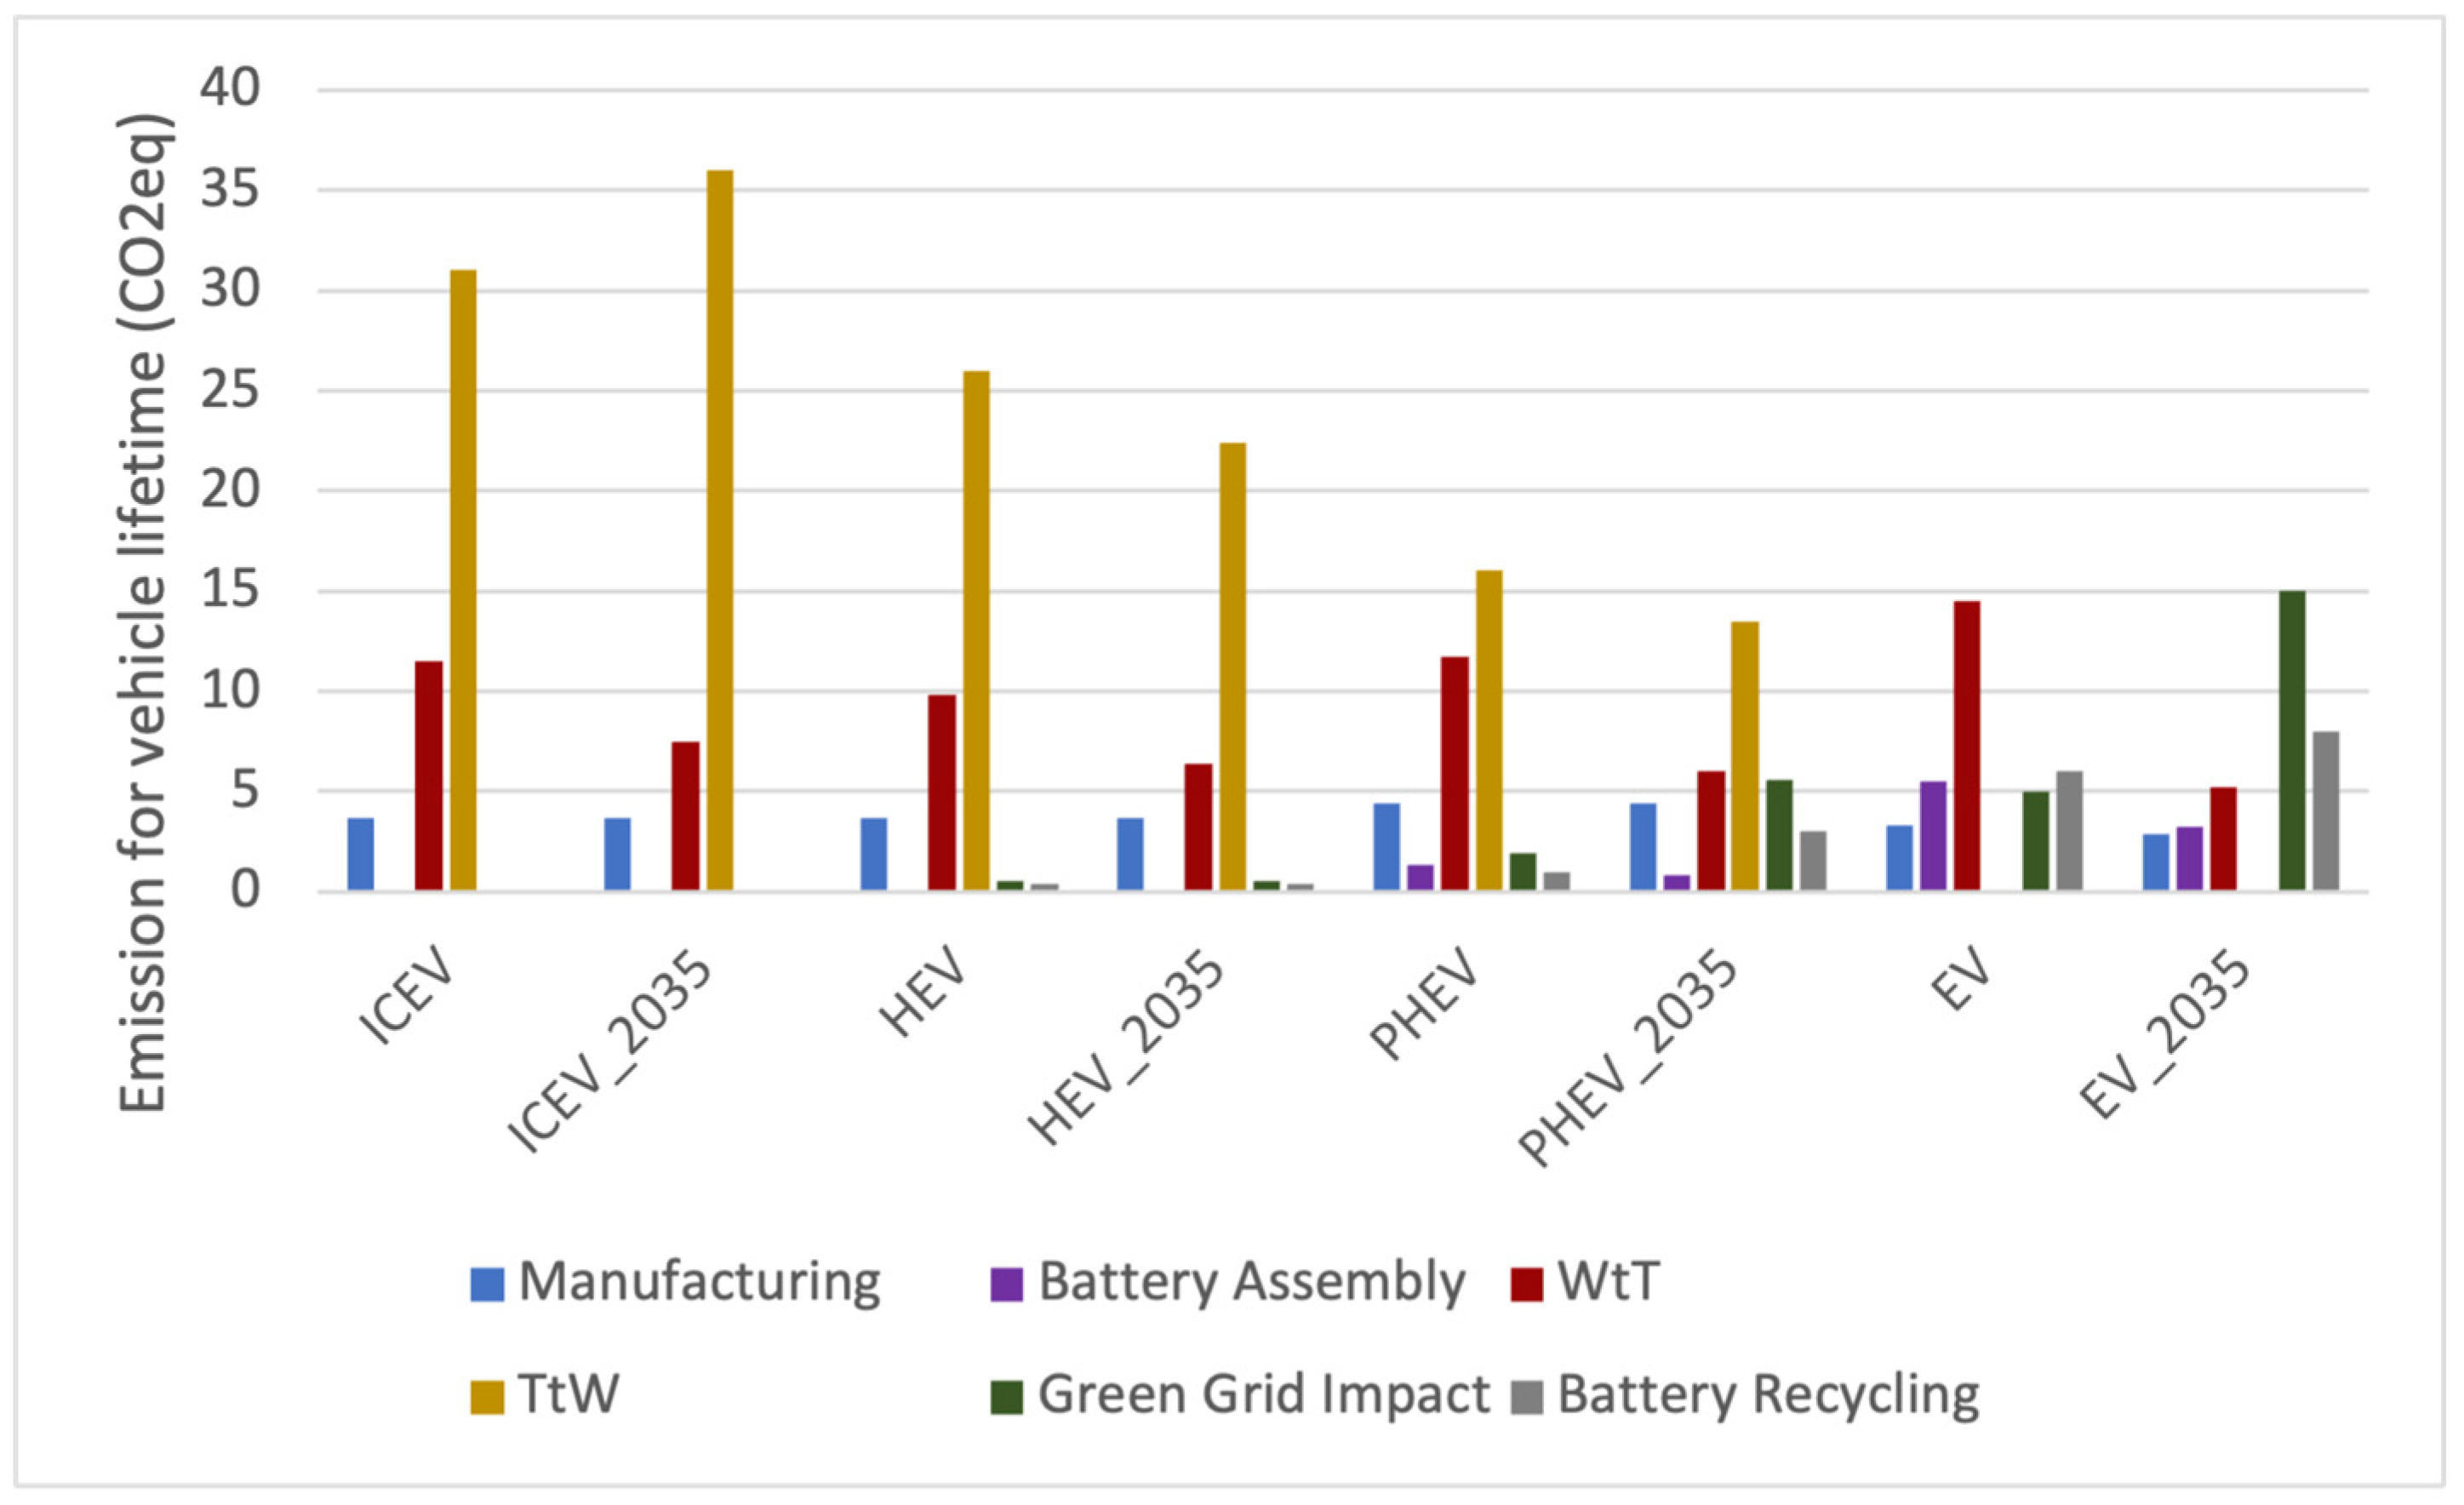
4. Results and Discussion
- Well-to-Tank (WtT), representing the energy used to produce the fuel or electricity required.
- Tank-to-Wheel (TtW), which is the actual energy that powers the vehicle.
5. Conclusions
Author Contributions
Funding
Institutional Review Board Statement
Informed Consent Statement
Data Availability Statement
Use of Artificial Intelligence
Conflicts of Interest
References
- European Commission, Joint Research Centre; IEA. GHG Emissions of All World Countries; Publications Office: Luxembourg, 2024. [Google Scholar]
- Hainsch, K.; Löffler, K.; Burandt, T.; Auer, H.; Crespo Del Granado, P.; Pisciella, P.; Zwickl-Bernhard, S. Energy Transition Scenarios: What Policies, Societal Attitudes, and Technology Developments Will Realize the EU Green Deal? Energy 2022, 239, 122067. [Google Scholar] [CrossRef]
- Haas, T.; Sander, H. Decarbonizing Transport in the European Union: Emission Performance Standards and the Perspectives for a European Green Deal. Sustainability 2020, 12, 8381. [Google Scholar] [CrossRef]
- Napolitano, P.; Alfè, M.; Guido, C.; Gargiulo, V.; Fraioli, V.; Beatrice, C. Particle Emissions from a HD SI Gas Engine Fueled with LPG and CNG. Fuel 2020, 269, 117439. [Google Scholar] [CrossRef]
- Yue, Z.; Liu, H. Advanced Research on Internal Combustion Engines and Engine Fuels. Energies 2023, 16, 5940. [Google Scholar] [CrossRef]
- Aosaf, M.R.; Wang, Y.; Du, K. Comparison of the Emission Factors of Air Pollutants from Gasoline, CNG, LPG and Diesel Fueled Vehicles at Idle Speed. Environ. Pollut. 2022, 305, 119296. [Google Scholar] [CrossRef]
- Petrauskienė, K.; Galinis, A.; Kliaugaitė, D.; Dvarionienė, J. Comparative Environmental Life Cycle and Cost Assessment of Electric, Hybrid, and Conventional Vehicles in Lithuania. Sustainability 2021, 13, 957. [Google Scholar] [CrossRef]
- Rimpas, D.; Kaminaris, S.D.; Aldarraji, I.; Piromalis, D.; Vokas, G.; Papageorgas, P.G.; Tsaramirsis, G. Energy Management and Storage Systems on Electric Vehicles: A Comprehensive Review. Mater. Today Proc. 2022, 61, 813–819. [Google Scholar] [CrossRef]
- Squalli, J. Greening the Roads: Assessing the Role of Electric and Hybrid Vehicles in Curbing CO2 Emissions. J. Clean. Prod. 2024, 434, 139908. [Google Scholar] [CrossRef]
- Ziółkowski, A.; Fuć, P.; Jagielski, A.; Bednarek, M.; Konieczka, S. Comparison of the Energy Consumption and Exhaust Emissions between Hybrid and Conventional Vehicles, as Well as Electric Vehicles Fitted with a Range Extender. Energies 2023, 16, 4669. [Google Scholar] [CrossRef]
- Verma, S.; Dwivedi, G.; Verma, P. Life Cycle Assessment of Electric Vehicles in Comparison to Combustion Engine Vehicles: A Review. Mater. Today Proc. 2022, 49, 217–222. [Google Scholar] [CrossRef]
- Luong, J.H.T.; Tran, C.; Ton-That, D. A Paradox over Electric Vehicles, Mining of Lithium for Car Batteries. Energies 2022, 15, 7997. [Google Scholar] [CrossRef]
- Guo, Z.; Li, T.; Shi, B.; Zhang, H. Economic Impacts and Carbon Emissions of Electric Vehicles Roll-out towards 2025 Goal of China: An Integrated Input-Output and Computable General Equilibrium Study. Sustain. Prod. Consum. 2022, 31, 165–174. [Google Scholar] [CrossRef]
- Yu, Y.; Xu, H.; Cheng, J.; Wan, F.; Ju, L.; Liu, Q.; Liu, J. Which Type of Electric Vehicle Is Worth Promoting Mostly in the Context of Carbon Peaking and Carbon Neutrality? A Case Study for a Metropolis in China. Sci. Total Environ. 2022, 837, 155626. [Google Scholar] [CrossRef]
- Leach, F.; Kalghatgi, G.; Stone, R.; Miles, P. The Scope for Improving the Efficiency and Environmental Impact of Internal Combustion Engines. Transp. Eng. 2020, 1, 100005. [Google Scholar] [CrossRef]
- Kumar, R.; Kanwal, A.; Asim, M.; Pervez, M.; Mujtaba, M.A.; Fouad, Y.; Kalam, M.A. Transforming the Transportation Sector: Mitigating Greenhouse Gas Emissions through Electric Vehicles (EVs) and Exploring Sustainable Pathways. AIP Adv. 2024, 14, 035320. [Google Scholar] [CrossRef]
- Minh, T.N.; Minh, H.P.; Duy, V.N. A review of internal combustion engines powered by renewable energy based on ethanol fuel and HCCI technology. AIMS Energy 2022, 10, 1004. [Google Scholar] [CrossRef]
- Reitz, R.D.; Ogawa, H.; Payri, R.; Fansler, T.; Kokjohn, S.; Moriyoshi, Y.; Agarwal, A.; Arcoumanis, D.; Assanis, D.; Bae, C.; et al. IJER Editorial: The Future of the Internal Combustion Engine. Int. J. Engine Res. 2020, 21, 3–10. [Google Scholar] [CrossRef]
- McCaffery, C.; Zhu, H.; Tang, T.; Li, C.; Karavalakis, G.; Cao, S.; Oshinuga, A.; Burnette, A.; Johnson, K.C.; Durbin, T.D. Real-World NOx Emissions from Heavy-Duty Diesel, Natural Gas, and Diesel Hybrid Electric Vehicles of Different Vocations on California Roadways. Sci. Total Environ. 2021, 784, 147224. [Google Scholar] [CrossRef]
- Pham, Q.; Park, S.; Agarwal, A.K.; Park, S. Review of Dual-Fuel Combustion in the Compression-Ignition Engine: Spray, Combustion, and Emission. Energy 2022, 250, 123778. [Google Scholar] [CrossRef]
- Cunanan, C.; Tran, M.-K.; Lee, Y.; Kwok, S.; Leung, V.; Fowler, M. A Review of Heavy-Duty Vehicle Powertrain Technologies: Diesel Engine Vehicles, Battery Electric Vehicles, and Hydrogen Fuel Cell Electric Vehicles. Clean Technol. 2021, 3, 474–489. [Google Scholar] [CrossRef]
- Biró, N.; Kiss, P. Emission Quantification for Sustainable Heavy-Duty Transportation. Sustainability 2023, 15, 7483. [Google Scholar] [CrossRef]
- Towoju, O.A.; Ishola, F.A. A Case for the Internal Combustion Engine Powered Vehicle. Energy Rep. 2020, 6, 315–321. [Google Scholar] [CrossRef]
- Carbon Intensity of Electricity Generation. Available online: https://ourworldindata.org/grapher/carbon-intensity-electricity (accessed on 5 January 2025).
- Alishaq, A.; Mehlig, D. Towards Sustainable Mobility: Assessing the Benefits and Implications of Internal Combustion Engine Vehicle Bans and Battery Electric Vehicle Uptake in Qatar. Atmosphere 2024, 15, 677. [Google Scholar] [CrossRef]
- Ravi, S.S.; Brace, C.; Larkin, C.; Aziz, M.; Leach, F.; Turner, J.W. On the Pursuit of Emissions-Free Clean Mobility—Electric Vehicles versus e-Fuels. Sci. Total Environ. 2023, 875, 162688. [Google Scholar] [CrossRef]
- Ternel, C.; Bouter, A.; Melgar, J. Life Cycle Assessment of Mid-Range Passenger Cars Powered by Liquid and Gaseous Biofuels: Comparison with Greenhouse Gas Emissions of Electric Vehicles and Forecast to 2030. Transp. Res. Part D Transp. Environ. 2021, 97, 102897. [Google Scholar] [CrossRef]
- Vinoth Kanna, I.; Arulprakasajothi, M.; Eliyas, S. A Detailed Study of IC Engines and a Novel Discussion with Comprehensive View of Alternative Fuels Used in Petrol and Diesel Engines. Int. J. Ambient Energy 2021, 42, 1794–1802. [Google Scholar] [CrossRef]
- Kubik, A.; Turoń, K.; Folęga, P.; Chen, F. CO2 Emissions—Evidence from Internal Combustion and Electric Engine Vehicles from Car-Sharing Systems. Energies 2023, 16, 2185. [Google Scholar] [CrossRef]
- Rimpas, D.; Papadakis, A. Driving Events Identification and Operational Parameters Correlation Based on the Analysis of OBD-II Timeseries. In Proceedings of the 8th International Conference on Vehicle Technology and Intelligent Transport Systems (VEHITS 2023), Prague, Czech Republic, 26–28 April 2023; pp. 257–264. [Google Scholar]
- Kosai, S.; Zakaria, S.; Che, H.S.; Hasanuzzaman, M.; Rahim, N.A.; Tan, C.; Ahmad, R.D.R.; Abbas, A.R.; Nakano, K.; Yamasue, E.; et al. Estimation of Greenhouse Gas Emissions of Petrol, Biodiesel and Battery Electric Vehicles in Malaysia Based on Life Cycle Approach. Sustainability 2022, 14, 5783. [Google Scholar] [CrossRef]
- Furch, J.; Krobot, Z.; Konecny, V.; Stodola, J. Advantages and Disadvantages of Common Used Fuels for Passenger Cars. In Proceedings of the 2022 International Conference on Electrical, Computer, Communications and Mechatronics Engineering (ICECCME), Maldives, Maldives, 16–18 November 2022; pp. 1–6. [Google Scholar]
- Estevez, R.; Aguado-Deblas, L.; López-Tenllado, F.J.; Bautista, F.M.; Romero, A.A.; Luna, D. Internal Combustion Engines and Carbon-Neutral Fuels: A Perspective on Emission Neutrality in the European Union. Energies 2024, 17, 1172. [Google Scholar] [CrossRef]
- Kuznetsov, G.; Dorokhov, V.; Vershinina, K.; Kerimbekova, S.; Romanov, D.; Kartashova, K. Composite Liquid Biofuels for Power Plants and Engines: Review. Energies 2023, 16, 5939. [Google Scholar] [CrossRef]
- Doğu, Y.; Yontar, A.A.; Kantaroğlu, E. Experimental Investigation of Effects of Single and Mixed Alternative Fuels (Gasoline, CNG, LPG, Acetone, Naphthalene, and Boron Derivatives) on a Commercial i-DSI Engine. Energy Sources Part A Recovery Util. Environ. Eff. 2024, 46, 12680–12699. [Google Scholar] [CrossRef]
- Lähde, T.; Giechaskiel, B. Particle Number Emissions of Gasoline, Compressed Natural Gas (CNG) and Liquefied Petroleum Gas (LPG) Fueled Vehicles at Different Ambient Temperatures. Atmosphere 2021, 12, 893. [Google Scholar] [CrossRef]
- Kuk Kim, J.; Lee, W.-J.; Ahn, E.; Choi, J.-H. Experimental and Numerical Studies on Performance Investigation of a Diesel Engine Converted to Run on LPG. Energy Convers. Manag. 2024, 321, 119091. [Google Scholar] [CrossRef]
- Usman, M.; Farooq, M.; Naqvi, M.; Saleem, M.W.; Hussain, J.; Naqvi, S.R.; Jahangir, S.; Jazim Usama, H.M.; Idrees, S.; Anukam, A. Use of Gasoline, LPG and LPG-HHO Blend in SI Engine: A Comparative Performance for Emission Control and Sustainable Environment. Processes 2020, 8, 74. [Google Scholar] [CrossRef]
- Setiyo, M.; Munahar, S. AFR and Fuel Cut-off Modeling of LPG-Fueled Engine Based on Engine, Transmission, and Brake System Using Fuzzy Logic Controller (FLC). J. Mechatron. Electr. Power Veh. Technol. 2017, 8, 50–59. [Google Scholar] [CrossRef]
- Khan, A.A.; Kaiser, M.S.; Nur, M.A. Comparative Analysis of Exhaust Emission of Retrofitted SI Engine Runs by Different Fuels. IOP Conf. Ser. Mater. Sci. Eng. 2024, 1305, 012035. [Google Scholar] [CrossRef]
- Kontses, A.; Triantafyllopoulos, G.; Ntziachristos, L.; Samaras, Z. Particle Number (PN) Emissions from Gasoline, Diesel, LPG, CNG and Hybrid-Electric Light-Duty Vehicles under Real-World Driving Conditions. Atmos. Environ. 2020, 222, 117126. [Google Scholar] [CrossRef]
- Liang, Y. A Review of the Effect of Compressed Natural Gas (CNG) on Combustion and Emission Performance of Internal Combustion Engines. Trends Renew. Energy 2022, 8, 119–129. [Google Scholar] [CrossRef]
- Lv, Z.; Wu, L.; Ma, C.; Sun, L.; Peng, J.; Yang, L.; Wei, N.; Zhang, Q.; Mao, H. Comparison of CO2, NOx, and VOCs Emissions between CNG and E10 Fueled Light-Duty Vehicles. Sci. Total Environ. 2023, 858, 159966. [Google Scholar] [CrossRef]
- Manojlović, A.V.; Medar, O.M.; Anđelković, A.S.; Tomić, M.A. Environmental Impact Assessment of the Electric Vehicles: A Case Study. Energy Sources Part A Recovery Util. Environ. Eff. 2023, 45, 1007–1016. [Google Scholar] [CrossRef]
- Gerutu, G.B.; Greyson, K.A.; Chombo, P.V. Compressed Natural Gas as an Alternative Vehicular Fuel in Tanzania: Implementation, Barriers, and Prospects. Methane 2023, 2, 66–85. [Google Scholar] [CrossRef]
- Algayyim, S.J.M.; Saleh, K.; Wandel, A.P.; Fattah, I.M.R.; Yusaf, T.; Alrazen, H.A. Influence of Natural Gas and Hydrogen Properties on Internal Combustion Engine Performance, Combustion, and Emissions: A Review. Fuel 2024, 362, 130844. [Google Scholar] [CrossRef]
- Jayaprabakar, J.; Arunkumar, T.; Rangasamy, G.; Parthipan, J.; Anish, M.; Varshini, G.; Kiran Kumar, B. Prospectus of Hydrogen Enrichment in Internal Combustion Engines: Methodological Insights on Its Production, Injection, Properties, Performance and Emissions. Fuel 2024, 363, 131034. [Google Scholar] [CrossRef]
- Boretti, A. Hydrogen Internal Combustion Engines to 2030. Int. J. Hydrogen Energy 2020, 45, 23692–23703. [Google Scholar] [CrossRef]
- Accardo, A.; Costantino, T.; Malagrinò, G.; Pensato, M.; Spessa, E. Greenhouse Gas Emissions of a Hydrogen Engine for Automotive Application through Life-Cycle Assessment. Energies 2024, 17, 2571. [Google Scholar] [CrossRef]
- Bai, S.; Liu, C. Overview of Energy Harvesting and Emission Reduction Technologies in Hybrid Electric Vehicles. Renew. Sustain. Energy Rev. 2021, 147, 111188. [Google Scholar] [CrossRef]
- Wahid, M.R.; Budiman, B.A.; Joelianto, E.; Aziz, M. A Review on Drive Train Technologies for Passenger Electric Vehicles. Energies 2021, 14, 6742. [Google Scholar] [CrossRef]
- Grün, T.; Doppelbauer, M. Comparative Concept Study of Passive Hybrid Energy Storage Systems in 48 V Mild Hybrid Vehicles Varying Lithium-Ion Battery and Supercapacitor Technologies. World Electr. Veh. J. 2019, 10, 71. [Google Scholar] [CrossRef]
- Chen, C.; Wang, X.; Xie, Z.; Lei, Z.; Shangguan, C. Research on Plug-in Hybrid Electric Vehicle (PHEV) Energy Management Strategy with Dynamic Planning Considering Engine Start/Stop. World Electr. Veh. J. 2024, 15, 350. [Google Scholar] [CrossRef]
- Gan, Y.; Wang, M.; Lu, Z.; Kelly, J. Taking into Account Greenhouse Gas Emissions of Electric Vehicles for Transportation De-Carbonization. Energy Policy 2021, 155, 112353. [Google Scholar] [CrossRef]
- Sazali, N.; Wan Salleh, W.N.; Jamaludin, A.S.; Mhd Razali, M.N. New Perspectives on Fuel Cell Technology: A Brief Review. Membranes 2020, 10, 99. [Google Scholar] [CrossRef] [PubMed]
- Martins, J.; Brito, F.P. Alternative Fuels for Internal Combustion Engines. Energies 2020, 13, 4086. [Google Scholar] [CrossRef]
- Xin, L.; Ahmad, M.; Khattak, S.I. Impact of Innovation in Hybrid Electric Vehicles-Related Technologies on Carbon Dioxide Emissions in the 15 Most Innovative Countries. Technol. Forecast. Soc. Chang. 2023, 196, 122859. [Google Scholar] [CrossRef]
- Zhang, W.; Li, Y.; Li, H.; Liu, S.; Zhang, J.; Kong, Y. Systematic Review of Life Cycle Assessments on Carbon Emissions in the Transportation System. Environ. Impact Assess. Rev. 2024, 109, 107618. [Google Scholar] [CrossRef]
- Skipper, T.N.; Lawal, A.S.; Hu, Y.; Russell, A.G. Air Quality Impacts of Electric Vehicle Adoption in California. Atmos. Environ. 2023, 294, 119492. [Google Scholar] [CrossRef]
- Liu, Z.; Song, J.; Kubal, J.; Susarla, N.; Knehr, K.W.; Islam, E.; Nelson, P.; Ahmed, S. Comparing Total Cost of Ownership of Battery Electric Vehicles and Internal Combustion Engine Vehicles. Energy Policy 2021, 158, 112564. [Google Scholar] [CrossRef]
- Märtz, A.; Plötz, P.; Jochem, P. Global Perspective on CO2 Emissions of Electric Vehicles. Environ. Res. Lett. 2021, 16, 054043. [Google Scholar] [CrossRef]
- Tang, C.; Tukker, A.; Sprecher, B.; Mogollón, J.M. Assessing the European Electric-Mobility Transition: Emissions from Electric Vehicle Manufacturing and Use in Relation to the EU Greenhouse Gas Emission Targets. Environ. Sci. Technol. 2023, 57, 44–52. [Google Scholar] [CrossRef]
- Sacchi, R.; Bauer, C.; Cox, B.; Mutel, C. When, Where and How Can the Electrification of Passenger Cars Reduce Greenhouse Gas Emissions? Renew. Sustain. Energy Rev. 2022, 162, 112475. [Google Scholar] [CrossRef]
- Burchart, D.; Przytuła, I. Carbon Footprint of Electric Vehicles—Review of Methodologies and Determinants. Energies 2024, 17, 5667. [Google Scholar] [CrossRef]
- Gryparis, E.; Papadopoulos, P.; Leligou, H.C.; Psomopoulos, C.S. Electricity Demand and Carbon Emission in Power Generation under High Penetration of Electric Vehicles. A European Union Perspective. Energy Rep. 2020, 6, 475–486. [Google Scholar] [CrossRef]
- Xu, L.; Yilmaz, H.Ü.; Wang, Z.; Poganietz, W.-R.; Jochem, P. Greenhouse Gas Emissions of Electric Vehicles in Europe Considering Different Charging Strategies. Transp. Res. Part D Transp. Environ. 2020, 87, 102534. [Google Scholar] [CrossRef]
- Zhao, X.; Hu, H.; Yuan, H.; Chu, X. How Does Adoption of Electric Vehicles Reduce Carbon Emissions? Evidence from China. Heliyon 2023, 9, e20296. [Google Scholar] [CrossRef]
- Sharma, A.; Shiwang, J.; Lee, A.; Peng, W. Equity Implications of Electric Vehicles: A Systematic Review on the Spatial Distribution of Emissions, Air Pollution and Health Impacts. Environ. Res. Lett. 2023, 18, 053001. [Google Scholar] [CrossRef]
- LaMonaca, S.; Ryan, L. The State of Play in Electric Vehicle Charging Services—A Review of Infrastructure Provision, Players, and Policies. Renew. Sustain. Energy Rev. 2022, 154, 111733. [Google Scholar] [CrossRef]
- Sathiyan, S.P.; Pratap, C.B.; Stonier, A.A.; Peter, G.; Sherine, A.; Praghash, K.; Ganji, V. Comprehensive Assessment of Electric Vehicle Development, Deployment, and Policy Initiatives to Reduce GHG Emissions: Opportunities and Challenges. IEEE Access 2022, 10, 53614–53639. [Google Scholar] [CrossRef]
- Sheppard, C.J.R.; Jenn, A.T.; Greenblatt, J.B.; Bauer, G.S.; Gerke, B.F. Private versus Shared, Automated Electric Vehicles for U.S. Personal Mobility: Energy Use, Greenhouse Gas Emissions, Grid Integration, and Cost Impacts. Environ. Sci. Technol. 2021, 55, 3229–3239. [Google Scholar] [CrossRef]
- Rimpas, D.; Kaminaris, S.D.; Piromalis, D.D.; Vokas, G. Real-Time Management for an EV Hybrid Storage System Based on Fuzzy Control. Mathematics 2023, 11, 4429. [Google Scholar] [CrossRef]
- Li, P.; Xia, X.; Guo, J. A Review of the Life Cycle Carbon Footprint of Electric Vehicle Batteries. Sep. Purif. Technol. 2022, 296, 121389. [Google Scholar] [CrossRef]
- Anthony Jnr, B. Integrating Electric Vehicles to Achieve Sustainable Energy as a Service Business Model in Smart Cities. Front. Sustain. Cities 2021, 3, 685716. [Google Scholar] [CrossRef]
- Ambrose, H.; Kendall, A.; Lozano, M.; Wachche, S.; Fulton, L. Trends in Life Cycle Greenhouse Gas Emissions of Future Light Duty Electric Vehicles. Transp. Res. Part D Transp. Environ. 2020, 81, 102287. [Google Scholar] [CrossRef]
- Dulău, L.-I. CO2 Emissions of Battery Electric Vehicles and Hydrogen Fuel Cell Vehicles. Clean Technol. 2023, 5, 696–712. [Google Scholar] [CrossRef]
- Zhong, Z.; Hu, W.; Zhao, X. Rethinking Electric Vehicle Smart Charging and Greenhouse Gas Emissions: Renewable Energy Growth, Fuel Switching, and Efficiency Improvement. Appl. Energy 2024, 361, 122904. [Google Scholar] [CrossRef]
- Hoang, T.T.; Pham, H.T.; Vu, H.M.T. From Intention to Actual Behavior to Adopt Battery Electric Vehicles: A Systematic Literature Review. Open Transp. J. 2022, 16, e187444782208100. [Google Scholar] [CrossRef]
- Alanazi, F. Electric Vehicles: Benefits, Challenges, and Potential Solutions for Widespread Adaptation. Appl. Sci. 2023, 13, 6016. [Google Scholar] [CrossRef]
- Purwanto, E.; Irawan, A.P. The Willingness to Purchase Electric Vehicles: A Comprehensive Review. IOP Conf. Ser. Earth Environ. Sci. 2024, 1324, 012091. [Google Scholar] [CrossRef]
- Electric Cars: Tax Benefits and Incentives (2024); ACEA—European Automobile Manufacturers’ Association: Brussels, Belgium, 2024.
- Correia Sinézio Martins, E.; Lépine, J.; Corbett, J. Assessing the Effectiveness of Financial Incentives on Electric Vehicle Adoption in Europe: Multi-Period Difference-in-Difference Approach. Transp. Res. Part A Policy Pract. 2024, 189, 104217. [Google Scholar] [CrossRef]
- Tang, B.; Xu, Y.; Wang, M. Life Cycle Assessment of Battery Electric and Internal Combustion Engine Vehicles Considering the Impact of Electricity Generation Mix: A Case Study in China. Atmosphere 2022, 13, 252. [Google Scholar] [CrossRef]
- Huo, Z.; Zha, X.; Lu, M.; Ma, T.; Lu, Z. Prediction of Carbon Emission of the Transportation Sector in Jiangsu Province-Regression Prediction Model Based on GA-SVM. Sustainability 2023, 15, 3631. [Google Scholar] [CrossRef]
- Challa, R.; Kamath, D.; Anctil, A. Well-to-Wheel Greenhouse Gas Emissions of Electric versus Combustion Vehicles from 2018 to 2030 in the US. J. Environ. Manag. 2022, 308, 114592. [Google Scholar] [CrossRef]
- Zheng, G.; Peng, Z. Life Cycle Assessment (LCA) of BEV’s Environmental Benefits for Meeting the Challenge of ICExit (Internal Combustion Engine Exit). Energy Rep. 2021, 7, 1203–1216. [Google Scholar] [CrossRef]
- Woo, S.-H.; Jang, H.; Lee, S.-B.; Lee, S. Comparison of Total PM Emissions Emitted from Electric and Internal Combustion Engine Vehicles: An Experimental Analysis. Sci. Total Environ. 2022, 842, 156961. [Google Scholar] [CrossRef] [PubMed]
- Farzaneh, F.; Jung, S. Lifecycle Carbon Footprint Comparison between Internal Combustion Engine versus Electric Transit Vehicle: A Case Study in the U.S. J. Clean. Prod. 2023, 390, 136111. [Google Scholar] [CrossRef]
- Shafique, M.; Azam, A.; Rafiq, M.; Luo, X. Life Cycle Assessment of Electric Vehicles and Internal Combustion Engine Vehicles: A Case Study of Hong Kong. Res. Transp. Econ. 2022, 91, 101112. [Google Scholar] [CrossRef]
- Yang, L.; Yu, B.; Yang, B.; Chen, H.; Malima, G.; Wei, Y.-M. Life Cycle Environmental Assessment of Electric and Internal Combustion Engine Vehicles in China. J. Clean. Prod. 2021, 285, 124899. [Google Scholar] [CrossRef]
- Ayetor, G.K.; Dzebre, D.K.E.; Mensah, L.D.; Boahen, S.; Amoabeng, K.O.; Tay, G.F.K. Comparing the Cost per Mile of Electric Vehicles and Internal Combustion Engine Vehicles in Ghana. Transp. Res. Rec. J. Transp. Res. Board 2023, 2677, 682–693. [Google Scholar] [CrossRef]
- Gao, Z.; Xie, H.; Yang, X.; Zhang, L.; Yu, H.; Wang, W.; Liu, Y.; Xu, Y.; Ma, B.; Liu, X.; et al. Electric Vehicle Lifecycle Carbon Emission Reduction: A Review. Carbon Neutralization 2023, 2, 528–550. [Google Scholar] [CrossRef]
- Patil, G.; Pode, G.; Diouf, B.; Pode, R. Sustainable Decarbonization of Road Transport: Policies, Current Status, and Challenges of Electric Vehicles. Sustainability 2024, 16, 8058. [Google Scholar] [CrossRef]
- Achariyaviriya, W.; Suttakul, P.; Phuphisith, S.; Mona, Y.; Wanison, R.; Phermkorn, P. Potential Reductions of CO2 Emissions from the Transition to Electric Vehicles: Thailand’s Scenarios towards 2030. Energy Rep. 2023, 9, 124–130. [Google Scholar] [CrossRef]
- Zaino, R.; Ahmed, V.; Alhammadi, A.M.; Alghoush, M. Electric Vehicle Adoption: A Comprehensive Systematic Review of Technological, Environmental, Organizational and Policy Impacts. World Electr. Veh. J. 2024, 15, 375. [Google Scholar] [CrossRef]
- Buberger, J.; Kersten, A.; Kuder, M.; Eckerle, R.; Weyh, T.; Thiringer, T. Total CO2-Equivalent Life-Cycle Emissions from Commercially Available Passenger Cars. Renew. Sustain. Energy Rev. 2022, 159, 112158. [Google Scholar] [CrossRef]
- Reddy, V.J.; Hariram, N.P.; Maity, R.; Ghazali, M.F.; Kumarasamy, S. Sustainable Vehicles for Decarbonizing the Transport Sector: A Comparison of Biofuel, Electric, Fuel Cell and Solar-Powered Vehicles. World Electr. Veh. J. 2024, 15, 93. [Google Scholar] [CrossRef]
- Gauto, M.A.; Carazzolle, M.F.; Rodrigues, M.E.P.; De Abreu, R.S.; Pereira, T.C.; Pereira, G.A.G. Hybrid Vigor: Why Hybrids with Sustainable Biofuels Are Better than Pure Electric Vehicles. Energy Sustain. Dev. 2023, 76, 101261. [Google Scholar] [CrossRef]
- Zimakowska-Laskowska, M.; Laskowski, P.; Wojs, M.K.; Orliński, P. Prediction of Pollutant Emissions in Various Cases in Road Transport. Appl. Sci. 2022, 12, 11975. [Google Scholar] [CrossRef]
- Esmaeilion, F.; Soltani, M.; Taklifi, A.; Aliabadi, A. Comprehensive Decision-Making Considerations in the Transition to Electrification Transportation System in a Developing Country. Sci. Rep. 2024, 14, 21015. [Google Scholar] [CrossRef]
- Andersson, Ö.; Börjesson, P. The Greenhouse Gas Emissions of an Electrified Vehicle Combined with Renewable Fuels: Life Cycle Assessment and Policy Implications. Appl. Energy 2021, 289, 116621. [Google Scholar] [CrossRef]
- Yang, Z.; Wang, B.; Jiao, K. Life Cycle Assessment of Fuel Cell, Electric and Internal Combustion Engine Vehicles under Different Fuel Scenarios and Driving Mileages in China. Energy 2020, 198, 117365. [Google Scholar] [CrossRef]
- Ghosh, A. Possibilities and Challenges for the Inclusion of the Electric Vehicle (EV) to Reduce the Carbon Footprint in the Transport Sector: A Review. Energies 2020, 13, 2602. [Google Scholar] [CrossRef]
- Irfan, M.; Deilami, S.; Huang, S.; Veettil, B.P. Rooftop Solar and Electric Vehicle Integration for Smart, Sustainable Homes: A Comprehensive Review. Energies 2023, 16, 7248. [Google Scholar] [CrossRef]
- Xia, X.; Li, P. A Review of the Life Cycle Assessment of Electric Vehicles: Considering the Influence of Batteries. Sci. Total Environ. 2022, 814, 152870. [Google Scholar] [CrossRef]
- Dhingra, S.; Madda, R.B.; Gandomi, A.H.; Patan, R.; Daneshmand, M. Internet of Things Mobile–Air Pollution Monitoring System (IoT-Mobair). IEEE Internet Things J. 2019, 6, 5577–5584. [Google Scholar] [CrossRef]
- Kang, Y.; Aye, L.; Ngo, T.D.; Zhou, J. Performance Evaluation of Low-Cost Air Quality Sensors: A Review. Sci. Total Environ. 2022, 818, 151769. [Google Scholar] [CrossRef] [PubMed]
- Varade, H.P.; Bhangale, S.C.; Thorat, S.R.; Khatkale, P.B.; Sharma, S.K.; William, P. Framework of Air Pollution Assessment in Smart Cities Using IoT with Machine Learning Approach. In Proceedings of the 2023 2nd International Conference on Applied Artificial Intelligence and Computing (ICAAIC), Salem, India, 4–6 May 2023; pp. 1436–1441. [Google Scholar]
- Lim, C.C.; Kim, H.; Vilcassim, M.J.R.; Thurston, G.D.; Gordon, T.; Chen, L.-C.; Lee, K.; Heimbinder, M.; Kim, S.-Y. Mapping Urban Air Quality Using Mobile Sampling with Low-Cost Sensors and Machine Learning in Seoul, South Korea. Environ. Int. 2019, 131, 105022. [Google Scholar] [CrossRef] [PubMed]
- Christakis, I.; Tsakiridis, O.; Kandris, D.; Stavrakas, I. A Kalman Filter Scheme for the Optimization of Low-Cost Gas Sensor Measurements. Electronics 2024, 13, 25. [Google Scholar] [CrossRef]
- de Souza, P.; Kahn, R.; Stockman, T.; Obermann, W.; Crawford, B.; Wang, A.; Crooks, J.; Li, J.; Kinney, P. Calibrating Networks of Low-Cost Air Quality Sensors. Atmos. Meas. Tech. 2022, 15, 6309–6328. [Google Scholar] [CrossRef]
- Ali, S.; Alam, F.; Potgieter, J.; Arif, K.M. Leveraging Temporal Information to Improve Machine Learning-Based Calibration Techniques for Low-Cost Air Quality Sensors. Sensors 2024, 24, 2930. [Google Scholar] [CrossRef]
- Nguyen, A.D.; Phung, T.H.; Nguyen, T.D.; Pham, H.H.; Nguyen, K.; Nguyen, P.L. GAMMA: A Universal Model for Calibrating Sensory Data of Multiple Low-Cost Air Monitoring Devices. Eng. Appl. Artif. Intell. 2024, 128, 107591. [Google Scholar] [CrossRef]
- Christakis, I.; Sarri, E.; Tsakiridis, O.; Stavrakas, I. Identification of the Safe Variation Limits for the Optimization of the Measurements in Low-Cost Electrochemical Air Quality Sensors. Electrochem 2024, 5, 1–28. [Google Scholar] [CrossRef]
- Ko, K.; Cho, S.; Rao, R.R. Evaluation of Calibration Performance of a Low-Cost Particulate Matter Sensor Using Collocated and Distant NO2. Atmos. Meas. Tech. 2024, 17, 3303–3322. [Google Scholar] [CrossRef]
- Christakis, I.; Sarri, E.; Tsakiridis, O.; Stavrakas, I. Investigation of LASSO Regression Method as a Correction Measurements’ Factor for Low-Cost Air Quality Sensors. Signals 2024, 5, 60–86. [Google Scholar] [CrossRef]
- Hossain, M.S.; Kumar, L.; Islam, M.M.; Selvaraj, J. A Comprehensive Review on the Integration of Electric Vehicles for Sustainable Development. J. Adv. Transp. 2022, 2022, 3868388. [Google Scholar] [CrossRef]
- Doose, S.; Mayer, J.K.; Michalowski, P.; Kwade, A. Challenges in Ecofriendly Battery Recycling and Closed Material Cycles: A Perspective on Future Lithium Battery Generations. Metals 2021, 11, 291. [Google Scholar] [CrossRef]


| Vehicle Model | Class | Highway Economy km/kWh | City Economy km/kWh |
|---|---|---|---|
| Honda CR-V AWD | CUV | 1.5 | 1.2 |
| Audi A4 | Compact | 1.6 | 1.3 |
| Dodge Durango | SUV | 1.2 | 0.9 |
| Nissan Titan | Pickup | 1 | 0.7 |
| Tesla Model X | CUV | 4.4 | 4.2 |
| Hyundai Ioniq | Compact | 5.8 | 7.2 |
| Audi e-Tron | SUV | 3.5 | 3.5 |
| Ford F150 | Pickup | 3.9 | 3.9 |
| Process | ICEV (gCO2eq/km) | EV (gCO2eq/km) |
|---|---|---|
| Raw material processing | 92 | 185 |
| Manufacturing | 23 | 33 |
| Distribution | 2.5 | 3 |
| Operation | 351 | 92 |
| Decommisioning 1 | 0.7 | 0.7 |
| Advantages | Drawbacks |
|---|---|
| Renewable and sustainable | Require pretreatment |
| Reliable | Expensive development * |
| Produced locally | Reduced efficiency |
| Low price | Difficult to scale for commercial use |
| Reduce oil dependence | Complex network facilities |
| Increased air quality | Specialized storage |
| Use of neglected land | Competition with food production |
| Factor | Context |
|---|---|
| European Green Deal | Net-zero emissions by 2050 |
| 2030 Goal | Fleet carbon emissions reduced by 37.5% |
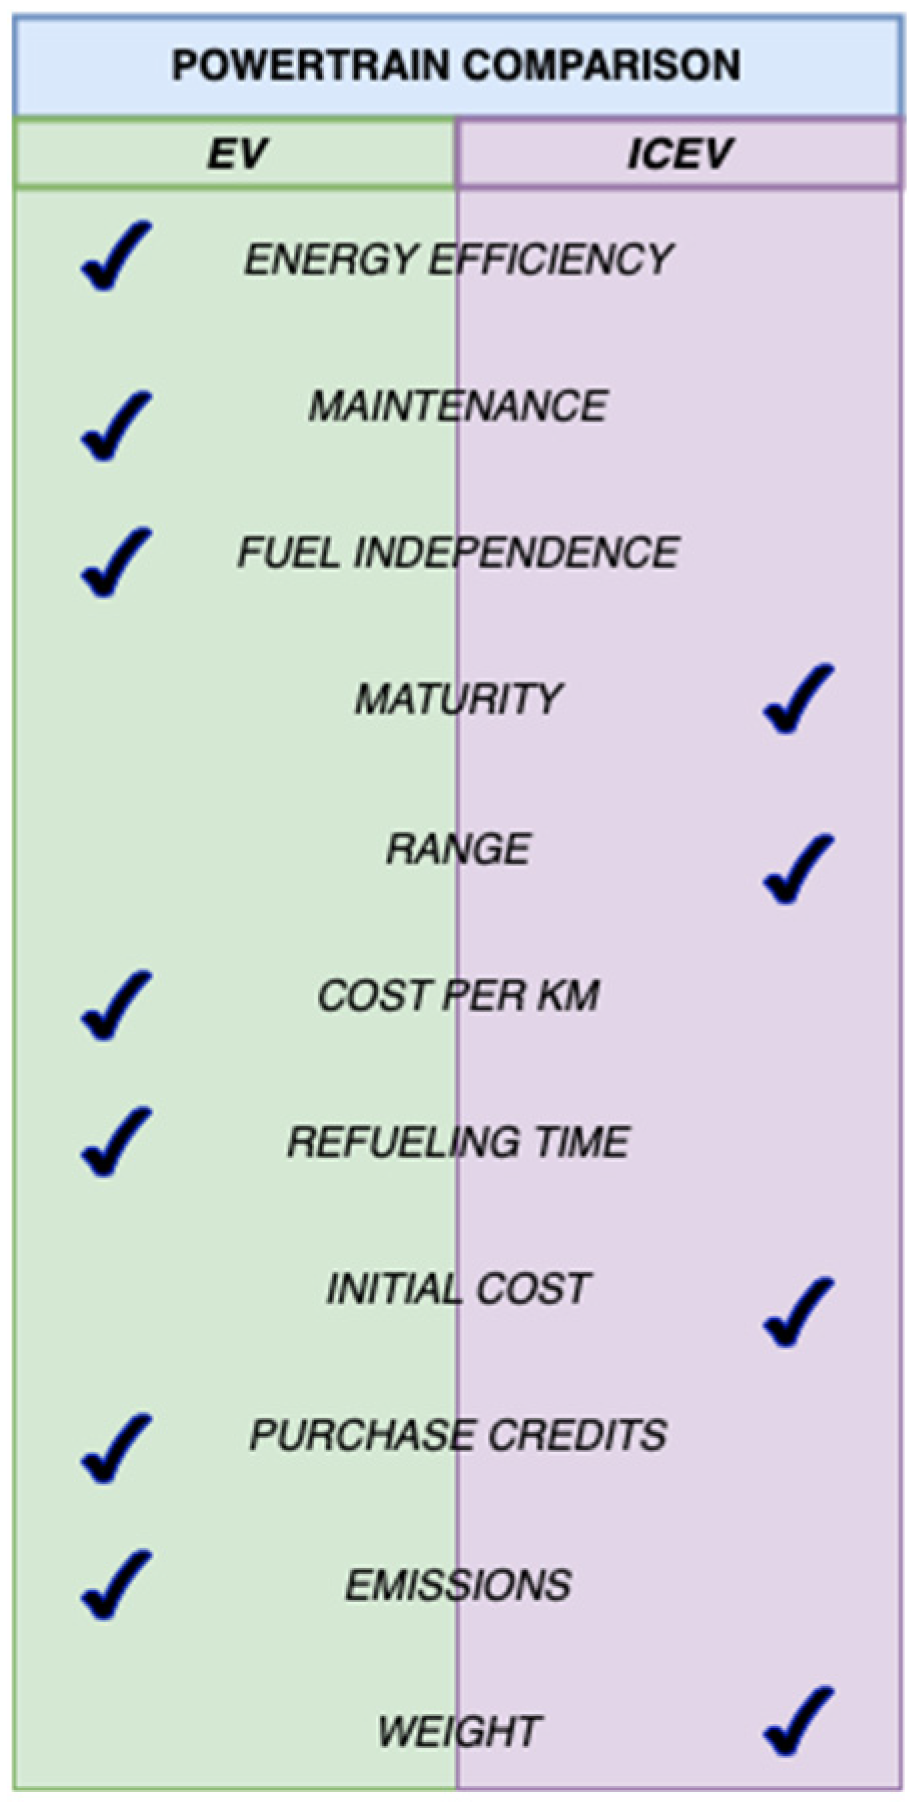
| ICE/EV efficiency | EVs are more efficient for both highway and city driving |
| ICE/EV cost comparison | EVs cost more initially -> less costly in the long run |
| EV benefits | Low maintenance, energy cost, and noise, comfortable |
| Fuel independence | EVs can be charged at the household via renewables or via the grid |
| Main EV drawbacks | High charging time, cost due to minerals such as lithium, low range |
| ICEV drawbacks | High pollution and maintenance, complex exhaust system |
| HEVs | Transition point from ICEVs to EVs |
| HEV benefits | High efficiency and comfort, 25% fewer emissions than from ICEVs |
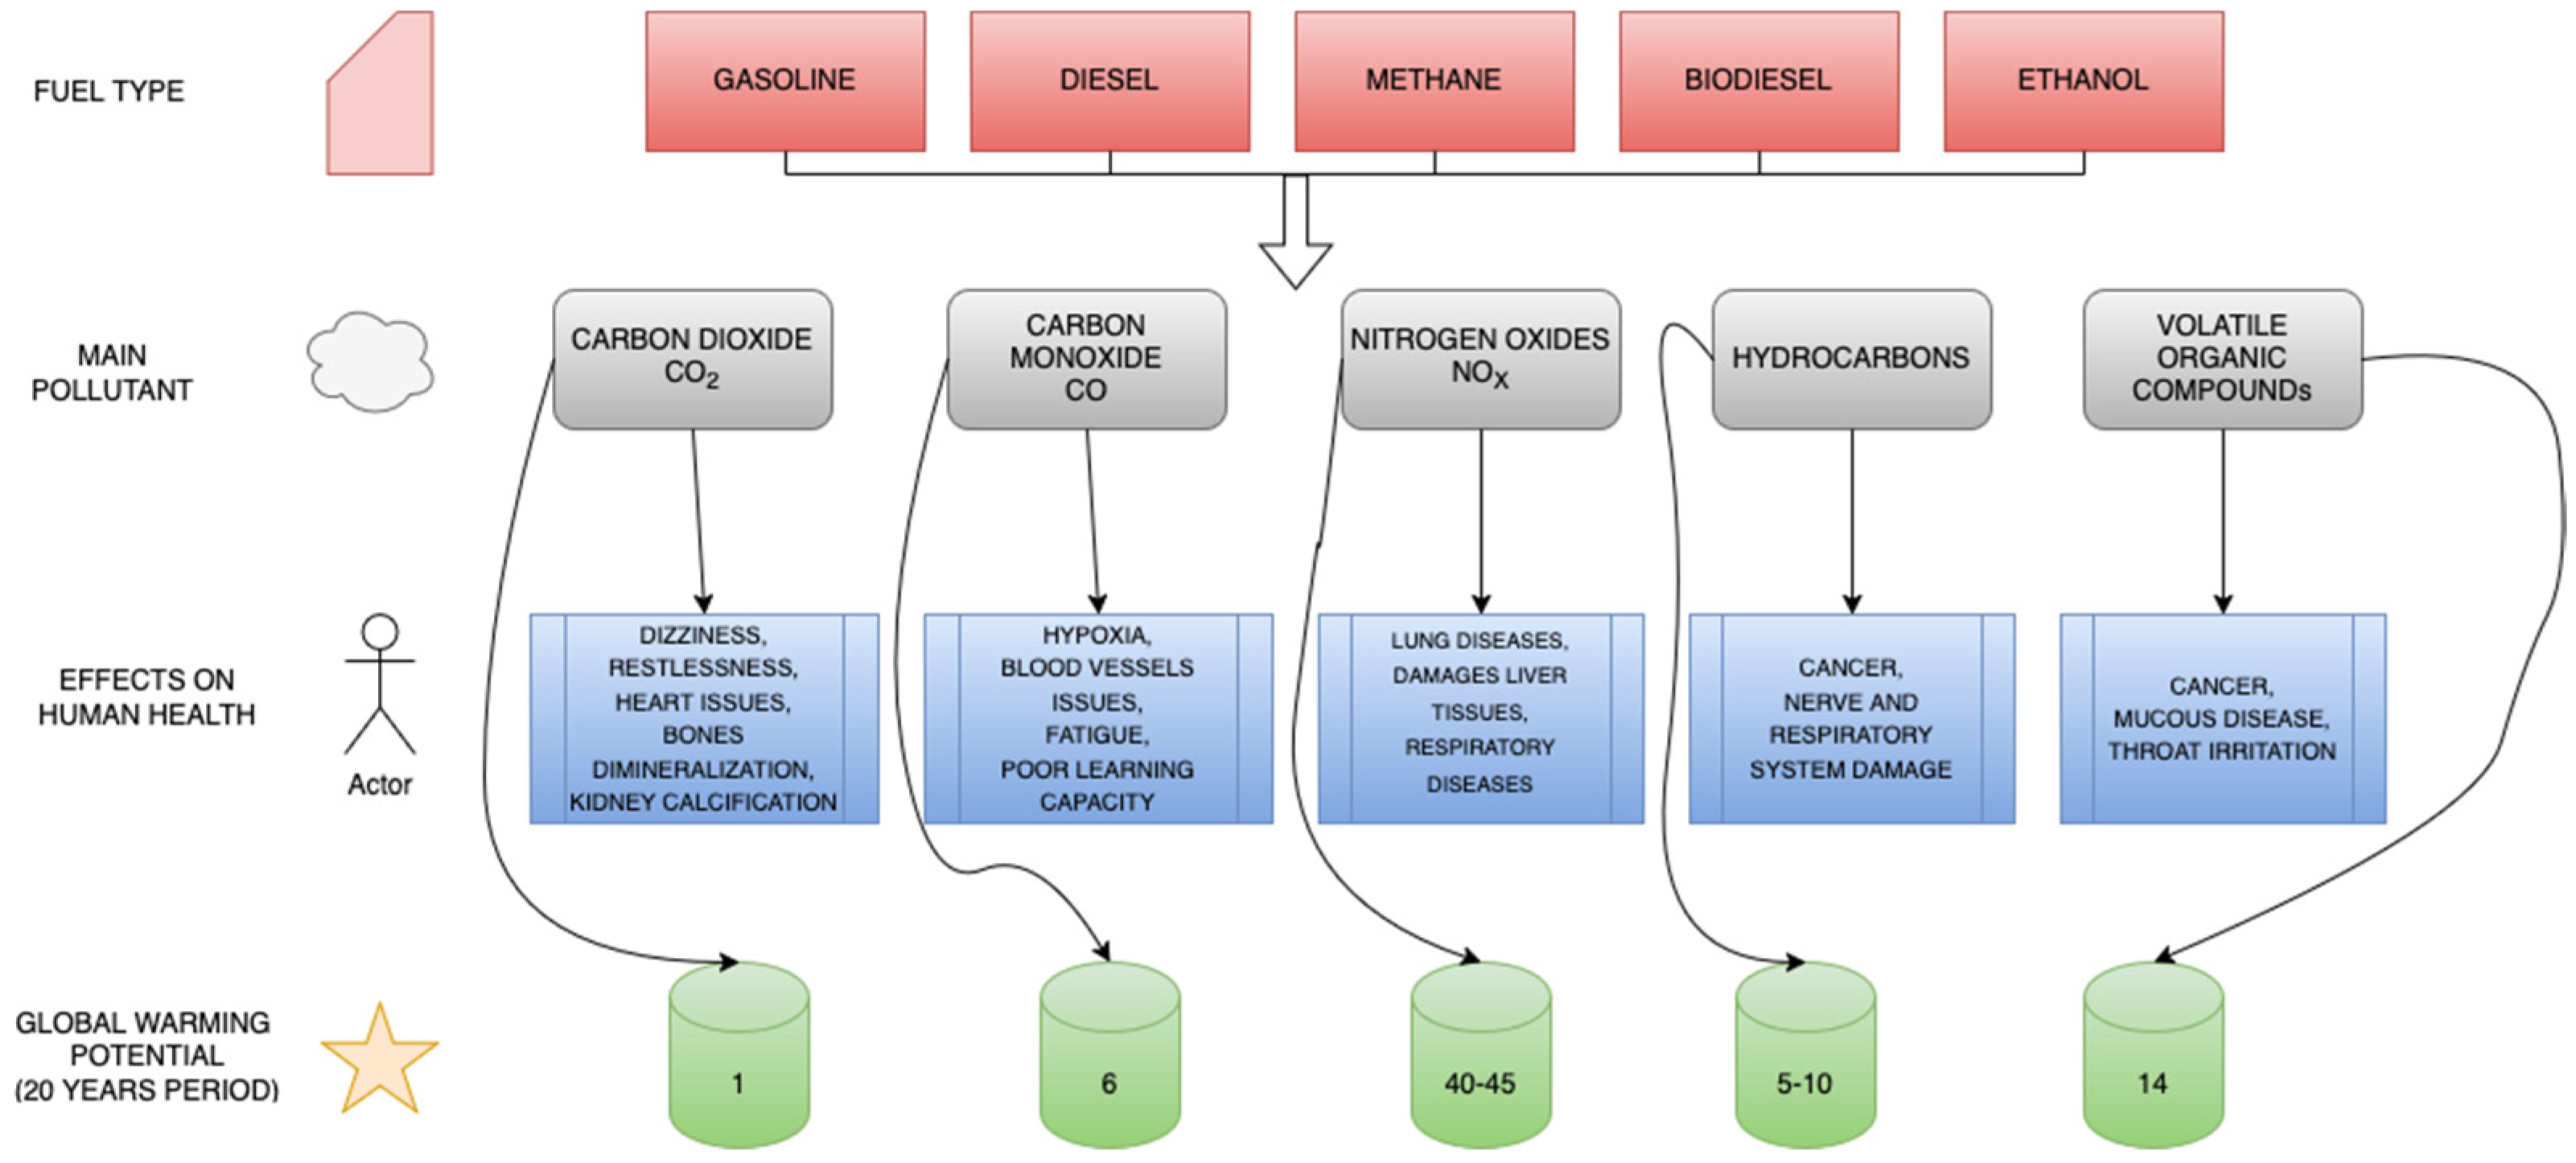
| Need for transition | Air pollution effects on human health and GWP |
| Electricity mix | High impact on EV emissions, range: 1 to 12 kgCO2eq/kwh |
| Alternative fuels | LPG/CNG, biofuels, hydrogen |
| LPG, CNG kits | Installed in current ICEs to reduce emissions, mainly NOX (75%) |
| LPG/CNG drawbacks | Cost of installation, potential failure, reduces trunk space |
| Hydrogen | Can be used as an additive to ICEs or for storage of surplus electricity |
| Hydrogen compatibility with ICEs | Increased nitrogen oxides and engine knock, not efficient |
| PHEVs | EV range ideal for urban areas, low fuel consumption as hybrids |
| Fuel cells | Highly efficient, but demand rare metals as catalysts |
| V2G | EVs provide power to the grid at peak hours when parked |
| Charge availability | Subsidies provided for massive installation |
| Urban areas | Small EVs with charging at home is the ideal plan |
| Component wear | EVs offer less brake wear but higher road and tire wear |
| Production | EVs require more materials, energy, and water |
| Cost per km | 12% lower for EVs than for ICEVs, optimal choice |
| Lifecycle emissions | EVs tend to reach sustainability at 175,000 km |
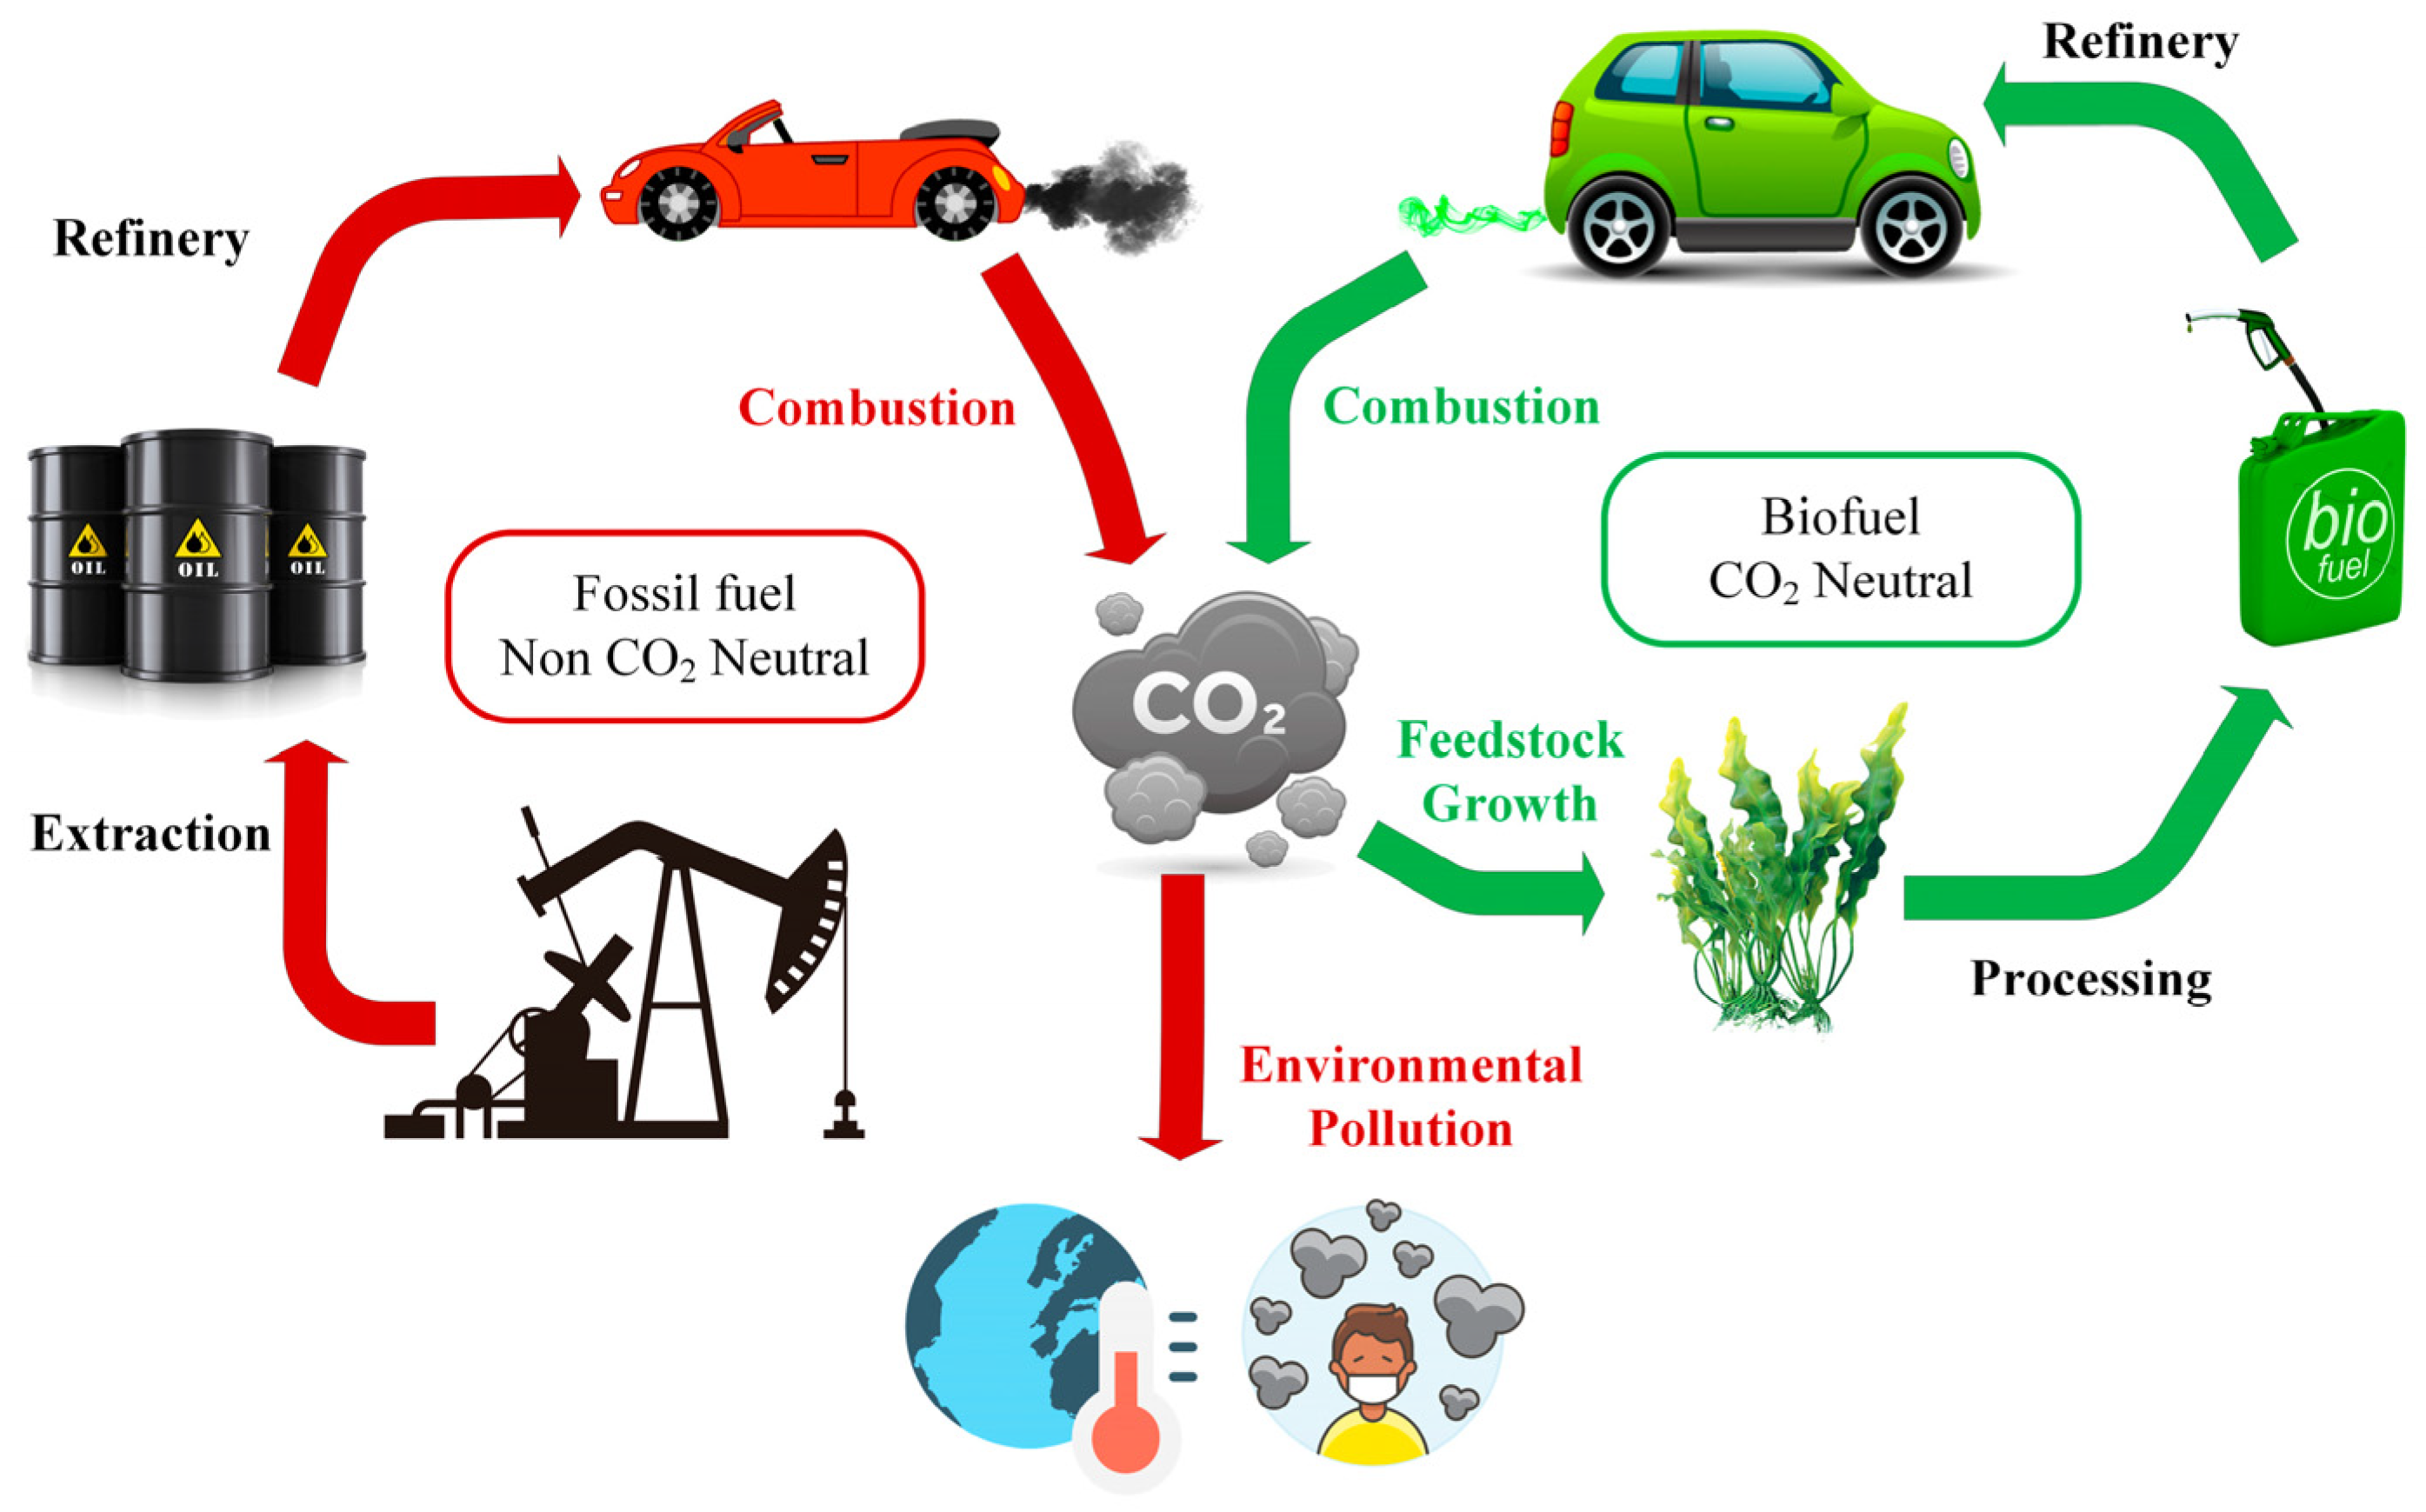
| Biofuels as alternatives | Green, reliable, low priced, and can improve air quality |
| Biofuel drawbacks | Specialized storage, reduced efficiency, low scaling for commercial use |
| Km per kg CO2eq | Biogas is the best option for all vehicle types, and HEVs are second |
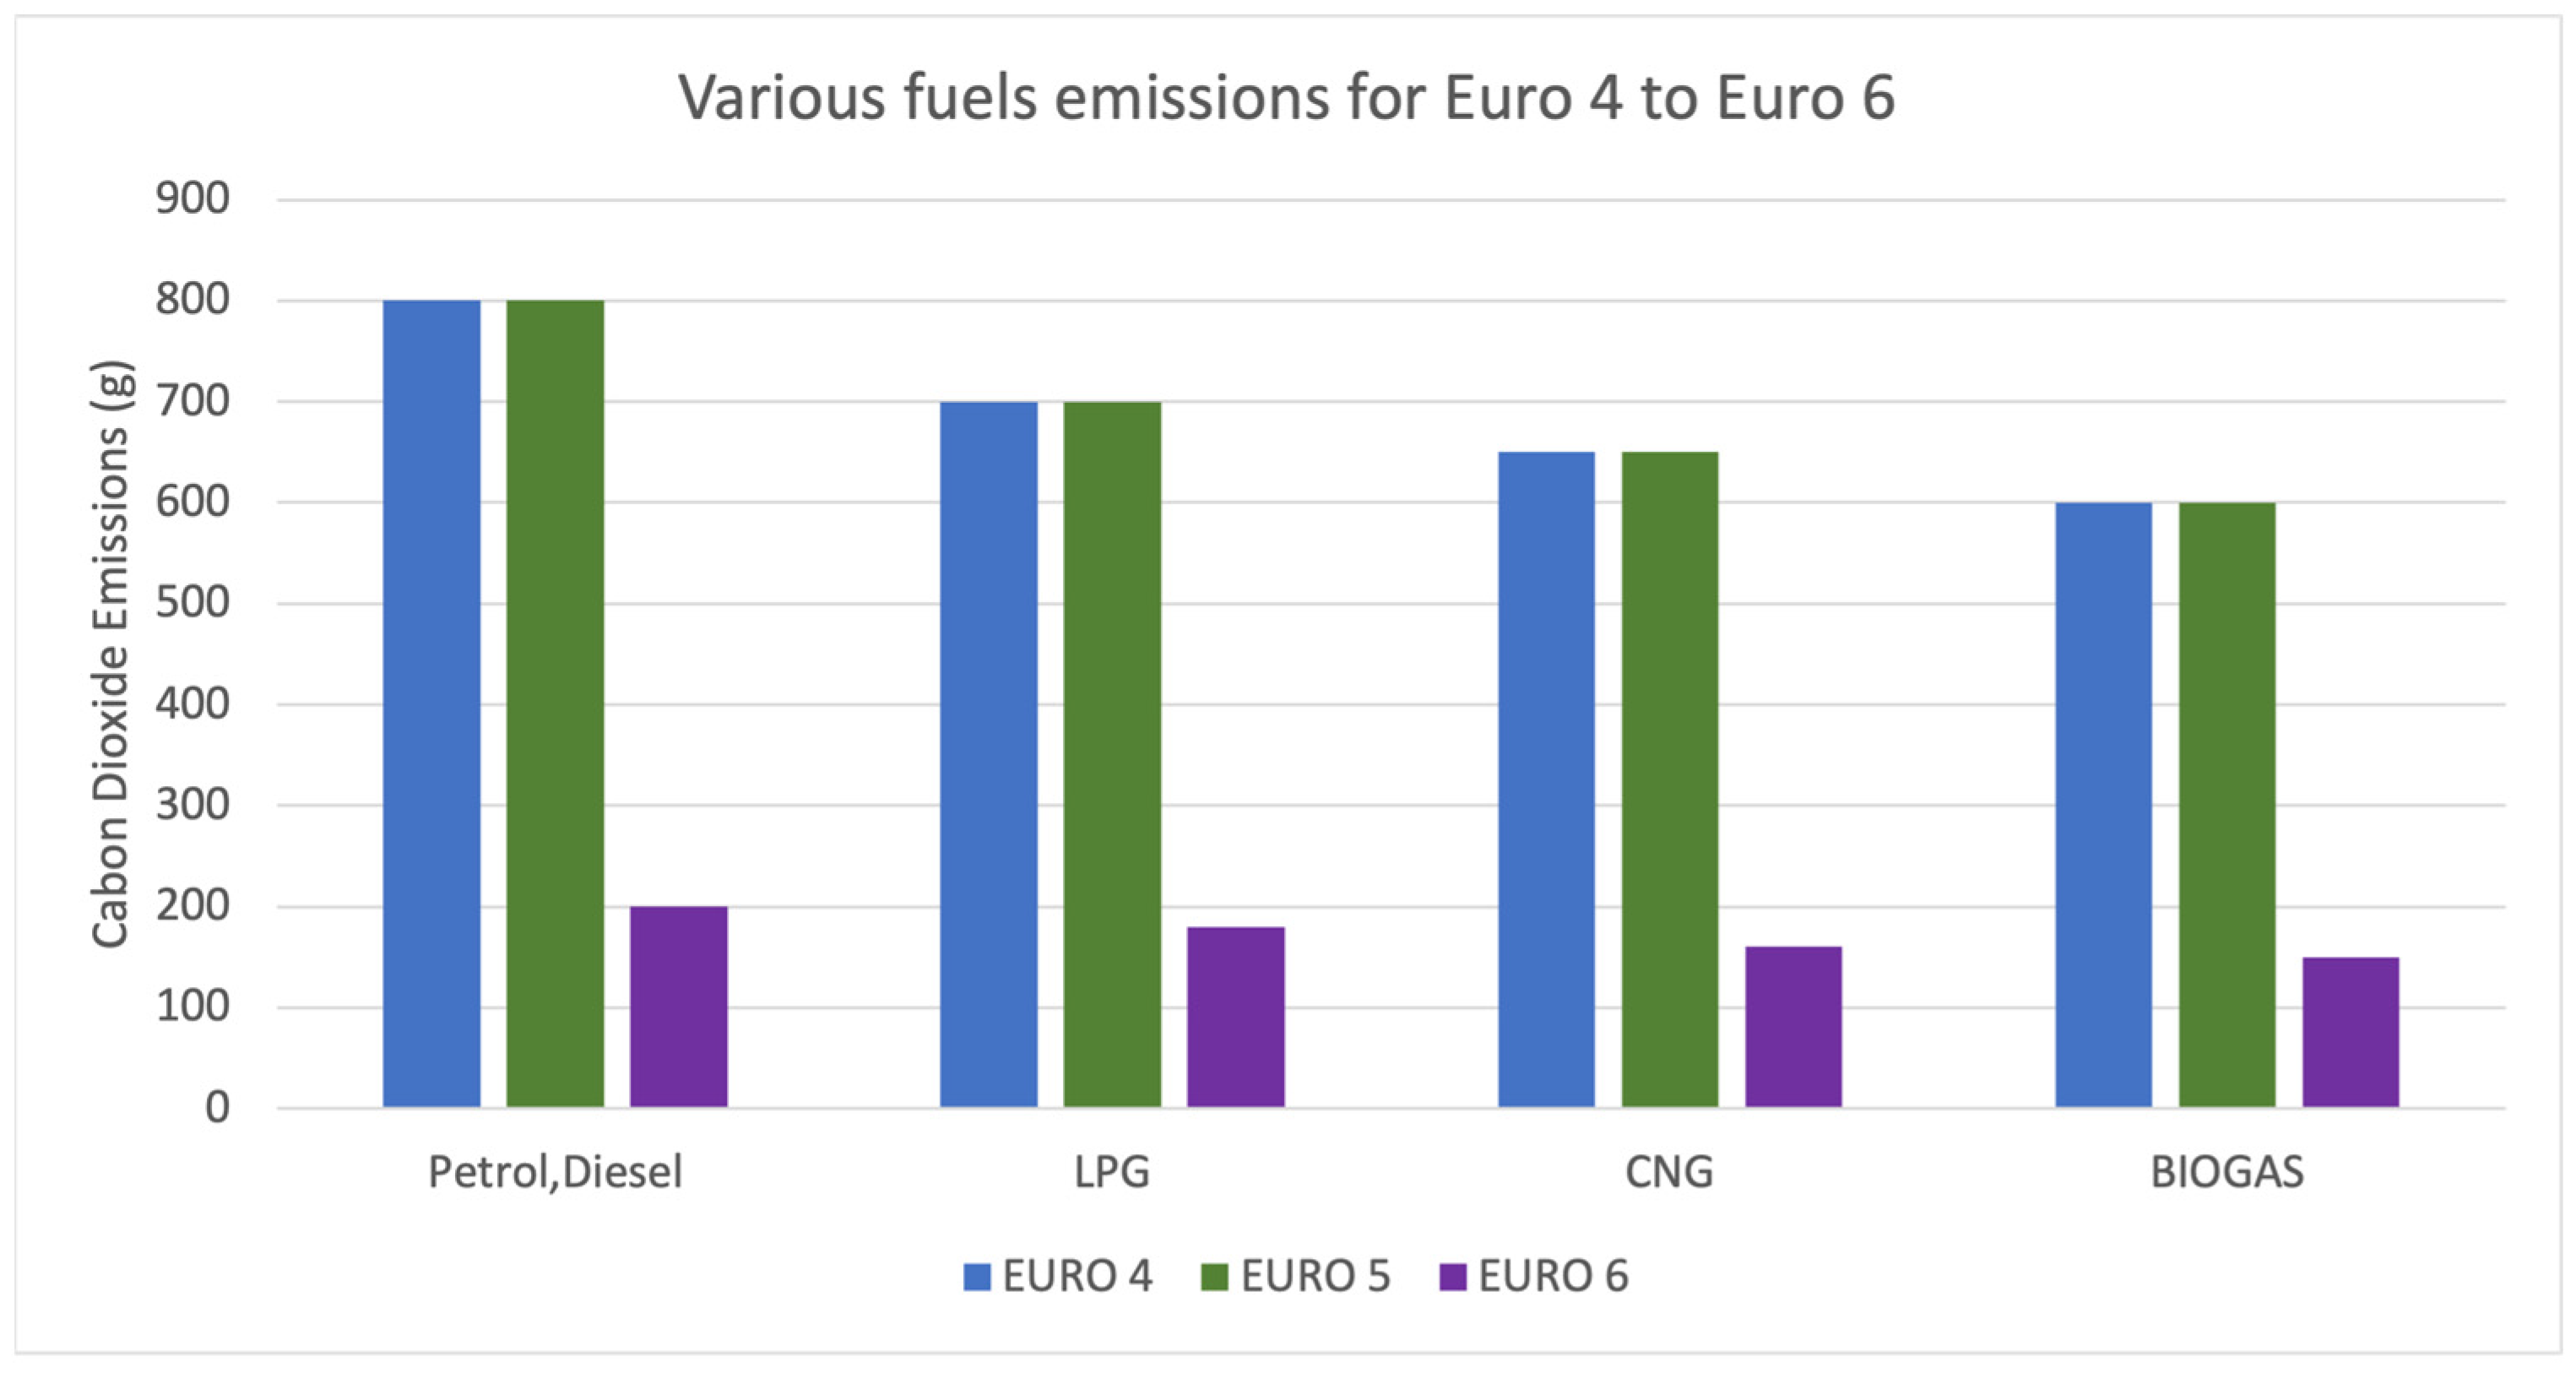
| Euro 6 standard | 85% reduction in NOX and CO emissions compared to Euro 2 |
| Final aspect | EVs provide eco-friendly transportation but require additional research |
Disclaimer/Publisher’s Note: The statements, opinions and data contained in all publications are solely those of the individual author(s) and contributor(s) and not of MDPI and/or the editor(s). MDPI and/or the editor(s) disclaim responsibility for any injury to people or property resulting from any ideas, methods, instructions or products referred to in the content. |
© 2025 by the authors. Licensee MDPI, Basel, Switzerland. This article is an open access article distributed under the terms and conditions of the Creative Commons Attribution (CC BY) license (https://creativecommons.org/licenses/by/4.0/).
Share and Cite
Rimpas, D.; Barkas, D.E.; Orfanos, V.A.; Christakis, I. Decarbonizing the Transportation Sector: A Review on the Role of Electric Vehicles Towards the European Green Deal for the New Emission Standards. Air 2025, 3, 10. https://doi.org/10.3390/air3020010
Rimpas D, Barkas DE, Orfanos VA, Christakis I. Decarbonizing the Transportation Sector: A Review on the Role of Electric Vehicles Towards the European Green Deal for the New Emission Standards. Air. 2025; 3(2):10. https://doi.org/10.3390/air3020010
Chicago/Turabian StyleRimpas, Dimitrios, Dimitrios E. Barkas, Vasilios A. Orfanos, and Ioannis Christakis. 2025. "Decarbonizing the Transportation Sector: A Review on the Role of Electric Vehicles Towards the European Green Deal for the New Emission Standards" Air 3, no. 2: 10. https://doi.org/10.3390/air3020010
APA StyleRimpas, D., Barkas, D. E., Orfanos, V. A., & Christakis, I. (2025). Decarbonizing the Transportation Sector: A Review on the Role of Electric Vehicles Towards the European Green Deal for the New Emission Standards. Air, 3(2), 10. https://doi.org/10.3390/air3020010