Article

Effect of Pre- and Postharvest Chitosan and Calcium Applications on the Yield and Major Biochemical Qualities of Tomato (Lycopersicon esculentum Mill.)

by
Md. Zakir Hossen
1,*,
S. M. Mashiur Rahman Nayeem
1,
Quazi Forhad Quadir
1,
Shaila Sharmin
2,
Phalguni Das
1,
Tasnuva Jahan Moury
1,
Laila Arafat Sathi
1,
Ronzon Chandra Das
1 and
Md. Harun Or Rashid
3
1
Laboratory of Plant Nutrition and Environmental Chemistry, Department of Agricultural Chemistry, Faculty of Agriculture, Bangladesh Agricultural University (BAU), Mymensingh 2202, Bangladesh
2
College of Agricultural Sciences, International University of Business Agriculture and Technology (IUBAT), 4 Embankment Drive Road, Sector-10, Uttara Model Town, Dhaka 1230, Bangladesh
3
Department of Agronomy, Faculty of Agriculture, Bangladesh Agricultural University, Mymensingh 2202, Bangladesh
*
Author to whom correspondence should be addressed.
Agrochemicals 2025, 4(3), 13; https://doi.org/10.3390/agrochemicals4030013
Submission received: 17 May 2025 / Revised: 3 August 2025 / Accepted: 6 August 2025 / Published: 11 August 2025
(This article belongs to the Section Plant Growth Regulators and Other Agrochemicals)

Abstract

Chitosan is an eco-friendly polysaccharide, enhancing growth and managing disease infections in fruits and vegetables. This study examines the effects of preharvest application of chitosan and calcium (Ca) on yield and postharvest chitosan coating on tomato storage. There were nine preharvest treatments, viz., T0 = control, T1 = 50 ppm chitosan, T2 = 80 ppm chitosan, T3 = 0.50% Ca, T4 = 1.0% Ca, T5 = T1 and T3 (combined), T6 = T2 and T3 (combined), T7 = T1 and T4 (combined), and T8 = T2 and T4 (combined), and three postharvest treatments, viz., C0 = control, C1 = 0.10% chitosan, and C2 = 0.20% chitosan, to examine the yield parameters and major physical and biochemical qualities of tomatoes on different days after postharvest storage (DAPS). The results revealed that chitosan and Ca treatments had a significant influence on yield while showing an insignificant impact on the biochemical qualities of fresh-harvested tomatoes. Postharvest application of chitosan coatings effectively reduced weight loss and shrinkage (34–37%) compared to the control. At 20 DAPS, only the 0.20% solution met the marketable threshold of ≥5.0, while the control failed in 100% of the samples. As storage duration increased, titratable acid and vitamin C decreased, while lycopene and sugar content rose in tomatoes. This research indicates that foliar spraying with 80 ppm chitosan during fruit initiation significantly boosts tomato yield, and a 0.20% chitosan coating on postharvest tomatoes enhances longevity and preserves biochemical quality.

1. Introduction

Being a member of the Solanaceae family, tomato (Lycopersicon esculentum) is one of the most prominent and commonly consumed vegetables in Bangladesh and around the world. Originating in South America, the crop is capable of growing in tropical, sub-tropical, and temperate climates, and it is grown extensively in Bangladesh and many other countries due to its nutritional value and flavor. It is the second most significant fruit or vegetable crop after potatoes, with an annual production of about 192.3 million tonnes of tomato fruits on 5.41 million hectares in 2023 [1]. With an average worldwide yield of 35.53 tonnes per hectare, tomato yields vary greatly, ranging from more than 410 tonnes per hectare in the Netherlands to less than 1.46 tonnes per hectare in Somalia in 2023 [1]. However, in 2021–2022, Bangladesh produced 442.3 thousand metric tonnes of tomatoes annually from 73.2 thousand hectares of land, with an average yield of 6.1 metric tonnes/ha [2]. However, the estimated postharvest loss of tomatoes in the supply chain of Bangladesh is around 30% [3].
The action of microorganisms that spoil food typically causes postharvest fruits and vegetables to decay [4,5]. This decay not only affects the appearance and texture of the produce, but also leads to a loss of nutritional value and can pose health risks to consumers. Hence, effective storage and preservation methods are essential to minimize spoilage and extend shelf life. Accordingly, studies conducted in recent decades have demonstrated that chitosan, a polysaccharide, is one of the most widely used and environmentally friendly treatments for controlling postharvest infections [6,7,8,9]. It can be applied to fruits as a safe preservative. Chitosan can create a semi-permeable coating or film, and it may provide a partial barrier to control gas exchange, reduce transpiration losses, and control fruit quality [10]. Additionally, chitosan possesses well-established broad-spectrum antibacterial properties [7,8,9], and in vivo research reveals that application of 0.1% and 0.2% chitosan solutions could prevent postharvest deterioration of 90% and 95% in citrus fruits, respectively, caused by Penicillium digitatum [11]. According to a recent study, chitosan treatment decreased ribosomal proteins in order to elicit a defense response in strawberry fruits to protect against oxidative stress [12]. Chitosan derived from crab shells has been reported to effectively reduce rot incidence by 18–66%, caused by Botrytis sp., Penicillium sp., and Pilidiella granati during postharvest storage of pomegranate fruit [13]. Research also indicates that chitosan has an impact on a number of physiological reactions, including plant immunity and defense systems that involve enzymes [5]. Furthermore, the application of 0.5% and 1.0% chitosan solutions inhibited 100% spore germination of blue mold (Penicillium expansum) and gray mold (Botrytis cinerea) in tomatoes, respectively [14].
Bangladesh is an agro-based country, and its economy depends mainly on agriculture. Due to a lack of postharvest technology, farmers are facing tremendous problems with their agricultural products. As we know, tomatoes are highly perishable, and their shelf life is usually shortened by firmness loss, discoloration of fruits, desiccation, and fungal rots. Previous findings suggest that applying chitosan at 80 ppm through the foliar method positively influences several growth parameters in tomatoes [15]. Additionally, a 0.20% chitosan-based coating on tomato fruits had been shown to enhance shelf life by reducing both decay incidence and weight loss [16], which suggests that chitosan not only promotes healthier plant growth and yield, but also enhances the postharvest quality of tomatoes, making them more resilient during storage. On the other hand, Ca is an essential nutrient for plants, playing a crucial role in cellular functions, such as delaying fruit softening and aging [17]. It is regarded as the most vital mineral after nitrogen, phosphorus, and potassium for determining the quality of fruit [18]. This means that Ca helps to maintain the firmness and longevity of fruits by supporting their structural integrity and delaying the processes that lead to deterioration. Consequently, adequate Ca levels can enhance the overall quality and shelf life of harvested agricultural commodities. According to Gayed et al. [19], applying a preharvest treatment of 2.0% CaCl2 combined with 1.0% chitosan significantly reduced weight loss and decay in peaches while also preserving firmness and extending shelf life. However, the present study introduces a novel approach that involves the preharvest application of chitosan along with Ca and its interaction with postharvest chitosan coating in Bangladesh conditions. Hence, the objectives of this research work are as follows: (i) Study the effect of preharvest application of chitosan and Ca on the yield, attributes, and quality of tomato fruit. (ii) Assess the effect of chitosan coating on weight loss/shrinkage percentage, visual quality, and major biochemical quality of tomato fruit during postharvest storage. (iii) Finally, recommend suitable application dose(s) for the better production of tomatoes and long-term postharvest storage.

2. Materials and Methods

2.1. Experimental Site

The field experiment was conducted at the Department of Agricultural Chemistry (Karim Bhabon) of Bangladesh Agricultural University (BAU), Mymensingh, during the period from November 2023 to March 2024 using the tomato variety Roma VF, which is one of the popular varieties of tomato in Bangladesh due to its high yield potential and good taste. Geographically, the experimental site is located at 24°43′44″ N latitude and 90°25′W″ E longitude. Postharvest laboratory experiments were performed at the Laboratory of Plant Nutrition and Environmental Chemistry of the same department of BAU, Mymensingh-2202, Bangladesh.

2.2. Experimental Design and Layout in Field

This study utilized a Randomized Complete Block Design (RCBD) featuring 9 treatments and 3 replications, resulting in a total of 27 plots. Each plot measured 3.9 m2, with a spacing of 61 cm between plants and 76 cm between rows. The study area belongs to Agroecological Zone 9 (Old Brahmaputra Floodplain), and its soils usually contain moderate levels of organic matter and low levels of available nitrogen, phosphorus, and potassium [20]. Fertilizers were applied according to the guidelines, aimed at achieving a high yield goal for tomatoes considering the low soil fertility level, outlined in the Fertilizer Recommendation Guide [20]. The applied amounts of N, P, K, and S in the field experiment were 100, 38, 50, and 18 kg/ha, respectively, where N and K were applied in two equal splits at 15 and 35 days after transplanting and the others were applied as basal during land preparation. Fifteen-day-old seedlings of tomato cv. Roma VF were collected from the Horticulture Farm of BAU, Mymensingh, which were transplanted in the field in the first week of November 2023.

2.3. Treatments Used During Field Trials

There were 9 treatments of chitosan and Ca. Both chitosan and Ca were applied as spray solutions, and 3 sprays were performed on leaves and twigs during the fruit initiation period at 7-day intervals starting in the middle of January 2024. In total, 500 mL spray solution was utilized for each treatment throughout the growth period. The treatments were as follows: T0 = control; T1 = 50 ppm chitosan solution; T2 = 80 ppm chitosan solution; T3 = 0.50% Ca solution; T4 = 1.0% Ca solution; T5 = T1 and T3 (combined); T6 = T2 and T3 (combined); T7 = T1 and T4 (combined); and T8 = T2 and T4 (combined).

2.4. Preparation of Chitosan and Ca Solutions

In order to produce 1.0 L of 50 and 80 ppm chitosan solutions, precisely 0.05 and 0.08 g of chitosan (Research Lab Fine Chem Industries, Mumbai, India), respectively, were mixed in two separate beakers with around 20 mL of glacial acetic acid. Calcium chloride (CaCl2; Merck Ltd., Mumbai, India) was utilized to prepare 0.50% and 1.00% (by taking 1.385 and 2.769 g CaCl2 for 1.0 L solution, respectively) Ca solution in distilled water. After that, the mixture was vigorously agitated to totally dissolve the chitosan and CaCl2, and, finally, the volume was made exactly 1.0 L in a volumetric flask with deionized water. Using 0.1 M NaOH and diluted acetic acid solution, the pH of the mixture was increased/decreased to about 5.0. Chitosan and Ca-free distilled water with a pH of 5.0, corrected with glacial acetic acid, served as the control.

2.5. Intercultural Operations and Data Collection at Harvest

Weeding was performed regularly to keep the plots free from weeds and to keep the soil loose and aerated. Tap water was used for irrigation purposes. No pesticide was used for the experiment. However, no diseases or pests were observed in the experimental crops during the growing period. Yield and yield attribute data of tomato (viz., fruit length, number of fruits per plant, fruit diameter, and single-fruit weight) were collected at harvesting. When the fruits became light red/yellow in color, they were considered ripe. However, harvesting was started from the experiment at the end of February, 2024.

2.6. Chitosan Treatments for Postharvest Storage

Three treatments were applied for the postharvest storage experiment, with 3 replications immediately after harvest. The treatments were as follows: C0 = control; C1 = 0.10% chitosan; and C2 = 0.20% chitosan. Using 0.1 M NaOH and diluted acetic acid solution, the pH of the mixture was increased/decreased to about 5.0. The control was distilled water with its pH adjusted to 5.0 using glacial acetic acid and no chitosan. A 1.0 L solution was prepared for each postharvest treatment, and harvested tomatoes were dipped once into that solution and then air-dried on a desk under a running ceiling fan. After that, tomatoes were put into polythene bags and kept in dark conditions for data recording.

2.7. Quality Assessment During Postharvest Storage of Tomato Fruits

Among the quality parameters, weight loss, shrinkage percentage, and the visual quality of tomatoes were measured at 7, 14, and 20 DAPS. At the same time, the chemical parameters titratable acidity, lycopene, vitamin C, and total sugar contents were determined both at harvesting (fresh) and after postharvest storage using the methods described below. For this purpose, 9 tomato fruits were analyzed for each treatment by taking 3 fruits from each replication. On average, the daytime temperature was 24.3 °C and the nighttime temperature was 15.4 °C, humidity was 39.2%, and dark conditions were maintained during the postharvest storage of tomato fruits.

2.7.1. Weight Loss

Weight loss of tomato fruits was measured at different DAPS using an analytical balance at the Laboratory of Plant Nutrition and Environmental Chemistry, Dept. of Agricultural Chemistry, Bangladesh Agricultural University, Mymensingh-2202, Bangladesh.

2.7.2. Shrinkage Percentage

The weight measurement on shrinkage of tomato fruit on nth day of storage was performed using the following equation, as described by Sree et al. [21]:
S h r i n k a g e   ( % ) = F r u i t   w t .   o n   1 s t   d a y F r u i t   w t .   o n   n t h   d a y × 100 F r u i t   w t .   o n   1 s t   d a y

2.7.3. Visual Quality

In this study, we made slight modifications to the visual quality assessment method as described by Kibar and Sabir [22]. Participants, who were semi-trained, evaluated various tomato traits—such as firmness, color, juiciness, and complete visual appearance—using a hedonic scale ranging from 1 to 9 (1–2 = extremely poor, rotten; 3–4 = poor, unmarketable fruits; 5 = fair quality; 6 = good quality; 7 = very good quality; 8–9 = extremely good, fresh). Tomato fruits that received a score of five (5) or higher were considered marketable.

2.7.4. Measurement of Titratable Acidity

Titratable acidity was determined following the procedure outlined by Sadasivam and Manickam [23]. About 10 g of tomato juice was diluted in 50 mL of distilled water with two drops of phenolphthalein indicator (0.25%) and was titrated using a 0.10 N sodium hydroxide (NaOH) solution. Then the amount of titratable acidity was calculated using the following equation, and the results are expressed as g citric acid/kg tomato:
T i t r a t a b l e   A c i d i t y   ( g   c i t r i c   a c i d / k g   o f   t o m a t o ) = ( V × 0.10 × 1000   × 0.064 ) M a s s   o f   t o m a t o   j u i c e   u s e d   ( g )
where V is the volume of NaOH required (mL) in the measurement and 0.064 is the acid milliequivalent factor.

2.7.5. Determination of Lycopene

Tomato fruit samples were treated with acetone to extract lycopene. The extract was then dissolved in petroleum ether. Lycopene exhibits its highest absorption at 503 nm wavelength. When one mole of lycopene is dissolved in one liter of petroleum and measured at 503 nm using a 1 cm light path, the absorbance registers as 17.2 × 10⁴. Therefore, a concentration of 3.1206 µg of lycopene per mL results in a unit absorbance [23]. To determine lycopene, 1–2 tomato fruits were pulped well in a wiring blender. Then about 10 g of this pulp was extracted repeatedly using acetone by means of a pestle and mortar until the resulting product was colorless. Finally, the content of lycopene was calculated using the following formula, as outlined by Sadasivam and Manickam [23]:
m g   l y c o p e n e   i n   100   g   s a m p l e = ( 31.206   × A b s o r b a n c e ) W e i g h t   o f   s a m p l e   i n   g

2.7.6. Determination of Vitamin C

One tomato fruit from each treatment was cut into pieces of about 3–4 mm in size. Ten (10) g of these pieces were weighed, and, as soon as possible, they were dipped in a 5% oxalic acid solution that had previously been taken in a beaker and macerated in a blender. The macerated solutions were filtered through clean cloth, and the decant solutions were collected and made to a volume of 100 mL using the same solution. Finally, the content of vitamin C was estimated titrimetrically based on the reduction of 2,6-dichlorophenol indophenol dye [23]. The amount of vitamin C in the tomato fruit was measured in milligrams of ascorbic acid per 100 g of fresh weight.

2.7.7. Determination of Total Sugar

For the determination of total sugar, one (1) tomato fruit was randomly selected, and 10 mL of ethanol was used to extract it, and then distilled water was added to complete the volume up to 50 mL. After that, 1.0 mL of the resulting extract was placed in a water bath until it was almost dry. Finally, distilled water was used to dilute the substrate up to 50 mL (working solution). Then, 1.0 mL of working solution was taken in a test tube, and 4 mL of anthrone reagent (2.0 g of anthrone was dissolved in 1.0 L of conc. H2SO4) was added to it as described by Sadasivam and Manickam [23]. Thus, the total volume of solution was 5.0 mL, which is used for color development. The content was heated for 5 min. in a boiling water bath. Then an absorbance reading was taken using a spectrophotometer (T60 Visible Spectrophotometer, PG Instrument, UK) at 620 nm wavelength. Glucose was used as the external standard, and the total sugar content was expressed as gram glucose equivalents per 100 g of fresh fruit weight (g/100 g FW).

2.8. Statistical Analysis

The data collected from the randomized complete block design (RCBD) with three replicates were subjected to analysis of variance (ANOVA) using Minitab 17.0 Statistical Software (Minitab Inc., State College, PA, USA). The summary tables and figures display the average values of the data collected for the physico-chemical quality parameters of the tomato fruits. To determine if the variations among the quality traits of tomato fruits were significant, this study applied the Duncan’s Multiple Range Test and Tukey’s Honestly Significant Difference (HSD) Test at a significance level of p ≤ 0.05.

3. Results

3.1. Effect of Preharvest Application of Chitosan and Ca on Yield Contributing Parameters

3.1.1. Fruit Length

The effects of different treatments had significant variations on the tomato’s fruit length at the 5% level of probability (Table 1). The average fruit length of tomato varied from 4.1 ± 0.92 to 4.6 ± 1.1 cm. The treatment T2, which was statistically identical to T1, T5, T6, and T8, produced the longest tomato fruit, which suggests that these treatments may be equally effective for enhancing tomato fruit size. The statistical similarity among these treatments emphasizes the importance of considering multiple options for optimizing tomato fruit growth. Conversely, the shortest tomato fruit length (4.1 ± 0.72 cm) was recorded in the T4 treatment, which showed statistical similarity to the T0, T3, and T7 treatments. This suggests that the T4 treatment did not significantly alter the fruit length compared to the control and other specified treatments mentioned above.

3.1.2. Fruit Diameter

The varying concentrations of chitosan and Ca did not significantly influence the fruit diameter of tomatoes. The average fruit diameter of tomatoes ranged from 3.3 ± 1.4 to 3.6 ± 1.3 cm (Table 1). The T1, T2, T3, T6, and T8 treatments yielded the highest fruit diameter of tomatoes. On the other hand, the control treatment produced the lowest fruit diameter of tomatoes.

3.1.3. Number of Fruits per Plant

The number of fruits per plant of tomato varied significantly due to the effect of different concentrations of chitosan and Ca solutions (Table 1). Treatment T2 produced the highest number of tomato fruits per plant, followed by T8, T6, T5, T1, and T7. These results also suggest that T2 was the most effective treatment in promoting fruit production among the tested treatments, while T8 also showed significant results, but was slightly less successful. The ranking suggests varying levels of efficacy among the treatments in enhancing the number of tomato fruits per plant or yield. However, the T4 treatment produced the lowest number of fruits per tomato plant, which was statistically the same as the T3 and control treatments. This result highlights that T4, along with the control and T3 treatments, did not significantly improve fruit production compared to the other treatments. As a result, those options may not be viable for growers seeking to maximize tomato yield.

3.1.4. Single-Fruit Weight

The foliar application of varying concentrations of chitosan and Ca significantly influenced the single-fruit mass of a tomato at the 5% probability level (Table 1). The individual weight of tomatoes ranged from 33.4 ± 2.8 to 38.9 ± 2.4 g, with a mean weight of 36.2 ± 1.9 g. Treatment T2 produced the largest individual fruit weight (38.9 ± 2.4 g) of tomatoes, statistically comparable to treatments T7 (37.3 ± 2.6 g) and T8 (38.6 ± 3.2 g). This result indicates that, while T2 produced the most substantial single-fruit weight, the other treatments of chitosan also demonstrated comparable effectiveness, suggesting a range of successful applications within those specific treatments. The data reinforces the potential benefits of utilizing chitosan for improving the single-fruit weight of tomatoes. However, treatment T3 demonstrated the lowest single-fruit weight of tomatoes, with the control, T5, and T4 treatments following closely behind. These findings suggest that the application of Ca alone does not have an effect on the weight of a single tomato fruit.

3.1.5. Yield of Tomato

The yield of tomatoes was significantly influenced (p < 0.05) by the foliar application of different levels of chitosan and Ca alone or in combination (Table 1). The mean yield of tomatoes varied between 33.1 ± 2.2 and 46.5 ± 2.0 tons per hectare (Table 1). Treatment T2, which involved the foliar application of chitosan at 80 ppm, produced the maximum tomato yield among the treatments. This finding indicates that the yield from treatment T2 was the highest among the tested treatments, and the use of chitosan at the rate of 80 ppm during the fruit initiation stage appears to be a promising method for improving tomato yield. Conversely, the control treatment yielded the lowest amount of tomatoes, which was statistically comparable to the yields from treatments T3 and T4. The findings indicate that the application of Ca at the fruit initiation stage did not result in a notable increase in tomato yields.

3.2. Effect of Preharvest Application of Chitosan and Ca on Biochemical Qualities of Tomatoes

Chitosan and Ca both have versatile roles in enhancing plant health. The effects of the preharvest application of chitosan and Ca on major biochemical qualities, viz., titratable acidity, vitamin C, lycopene, and total sugar content of tomato fruits, were investigated in the present study, and the results are summarized in Table 1. It is apparent from Table 1 that all of the biochemical quality parameters were statistically insignificant among the treatments. This result indicates that the application of chitosan and Ca did not produce any measurable differences in the biochemical qualities of the tomato fruits compared to the control. Consequently, these findings suggest that preharvest treatments may not significantly influence the examined attributes under the conditions tested. However, the contents of titratable acidity, vitamin C, lycopene, and total sugar in fresh-harvested tomato fruits varied from 0.74 ± 0.13 to 0.77 ± 0.11%, 26.9 ± 2.2 to 29.3 ± 0.52 mg/100 g fresh wt., 3.0 ± 0.24 to 3.6 ± 0.42 mg/100 g fresh wt., and 1.2 ± 0.23 to 1.5 ± 0.15%, with a mean value of 0.76 ± 0.01%, 28.1 ± 1.0 mg/100 g fresh wt., 3.3 ± 0.21 mg/100 g fresh wt., and 1.3 ± 0.11%, respectively.

3.3. Effect of Postharvest Application of Chitosan on Physical Properties of Tomatoes

3.3.1. Effect on Shrinkage of Tomato Fruits

The effect of chitosan on the shrinkage of tomato fruits during postharvest storage is presented in Figure 1. It can be seen from this figure that postharvest application of chitosan at all DAPS and preharvest application at longer durations (between 14 and 20 DAPS) had significant effects on the shrinkage of tomato fruits. The overall shrinkage of tomato fruits ranged from 0.31 ± 0.29 to 2.3 ± 0.24%, 2.3 ± 0.32 to 6.2 ± 0.21%, and 6.3 ± 0.52 to 12.5 ± 0.81% at 7, 14, and 20 DAPS, respectively. On the other hand, in regard to individual postharvest treatment at 7 DAPS, shrinkage of fruits varied from 1.2 ± 0.22 to 2.3 ± 0.24%, 0.65 ± 0.42 to 1.4 ± 0.31%, and 0.31 ± 0.29 to 0.96 ± 0.26%; at 14 DAPS, it ranged from 4.3 ± 0.52 to 6.2 ± 0.21%, 3.2 ± 0.32 to 4.7 ± 0.23%, and 2.3 ± 0.32 to 4.0 ± 0.22%; and at 20 DAPS, it ranged from 9.9 ± 0.42 to 12.5 ± 0.81%, 7.6 ± 0.42 to 10.5 ± 0.31%, and 6.3 ± 0.52 to 8.2 ± 0.51% for the control, C1 (0.10% chitosan), and C2 (0.20% chitosan) treatments, respectively. Thus, it can be inferred from the obtained results that chitosan coatings controlled the weight loss of tomatoes compared to the control at different DAPS, and chitosan coatings with a 0.20% solution can reduce shrinkage by about 34–37% compared to uncoated tomatoes. However, it is also evident from Figure 1 that the preharvest application of chitosan and Ca alone or in combination also showed significant influence on the shrinkage of tomato fruits at postharvest storage. This result indicates that the treatments applied before harvest can effectively reduce the loss of moisture and firmness in tomatoes during storage, potentially enhancing their shelf life. The results suggest that both chitosan and Ca play a crucial role in maintaining fruit quality after harvest.

3.3.2. Effect on Visual Qualities of Tomato Fruits

The effect of chitosan on the visual qualities of tomatoes during postharvest storage is presented in Figure 2. This figure illustrates that postharvest chitosan treatments (at 0.1% and 0.2%) significantly increased the visual qualities of tomatoes at various DAPS. Similarly, preharvest applications of chitosan and Ca, either alone or in combination, and their interactions with postharvest treatments also showed significant positive impacts on the visual qualities of tomatoes, except for the T2 treatment at 14 DAPS. Overall, the visual quality scores of tomato fruits among all the treatments ranged from 5.4 ± 0.25 to 9.0 ± 0.25, 4.5 ± 0.30 to 7.8 ± 0.20, and 2.5 ± 0.20 to 6.7 ± 0.35 at 7, 14, and 20 DAPS, respectively. On the other hand, in regard to individual postharvest treatment at 7 DAPS, the visual quality scores of fruits varied from 5.4 ± 0.25 to 6.7 ± 0.45, 7.7 ± 0.20 to 8.1 ± 0.35, and 8.2 ± 0.40 to 9.0 ± 0.25; at 14 DAPS, they ranged from 4.5 ± 0.30 to 6.9 ± 0.40, 6.1 ± 0.35 to 7.6 ± 0.40, and 7.1 ± 0.25 to 7.8 ± 0.20; and at 20 DAPS, they ranged from 2.5 ± 0.20 to 4.5 ± 0.40, 4.8 ± 0.25 to 6.0 ± 0.40, and 5.8 ± 0.40 to 6.7 ± 0.35 for the control, C1 (0.10% chitosan), and C2 (0.20% chitosan) treatments, respectively. It is apparent from Figure 2 that the visual quality of tomatoes displayed a gradual decrease during storage. This decline in visual quality suggests that, as time progresses, tomatoes may experience changes such as discoloration, which can affect their overall appeal and marketability. Such observations are crucial for understanding how different treatments impact the preservation of tomato fruit quality during storage. However, the application of chitosan and Ca, alone or in combination, enhances the esthetic appeal of tomatoes after they have been harvested, suggesting potential benefits for both storage longevity and marketability. Such treatments could be advantageous for producers aiming to improve the quality of their products.

3.4. Effect of Postharvest Application of Chitosan on Biochemical Qualities of Tomatoes

3.4.1. Effect on Titratable Acidity

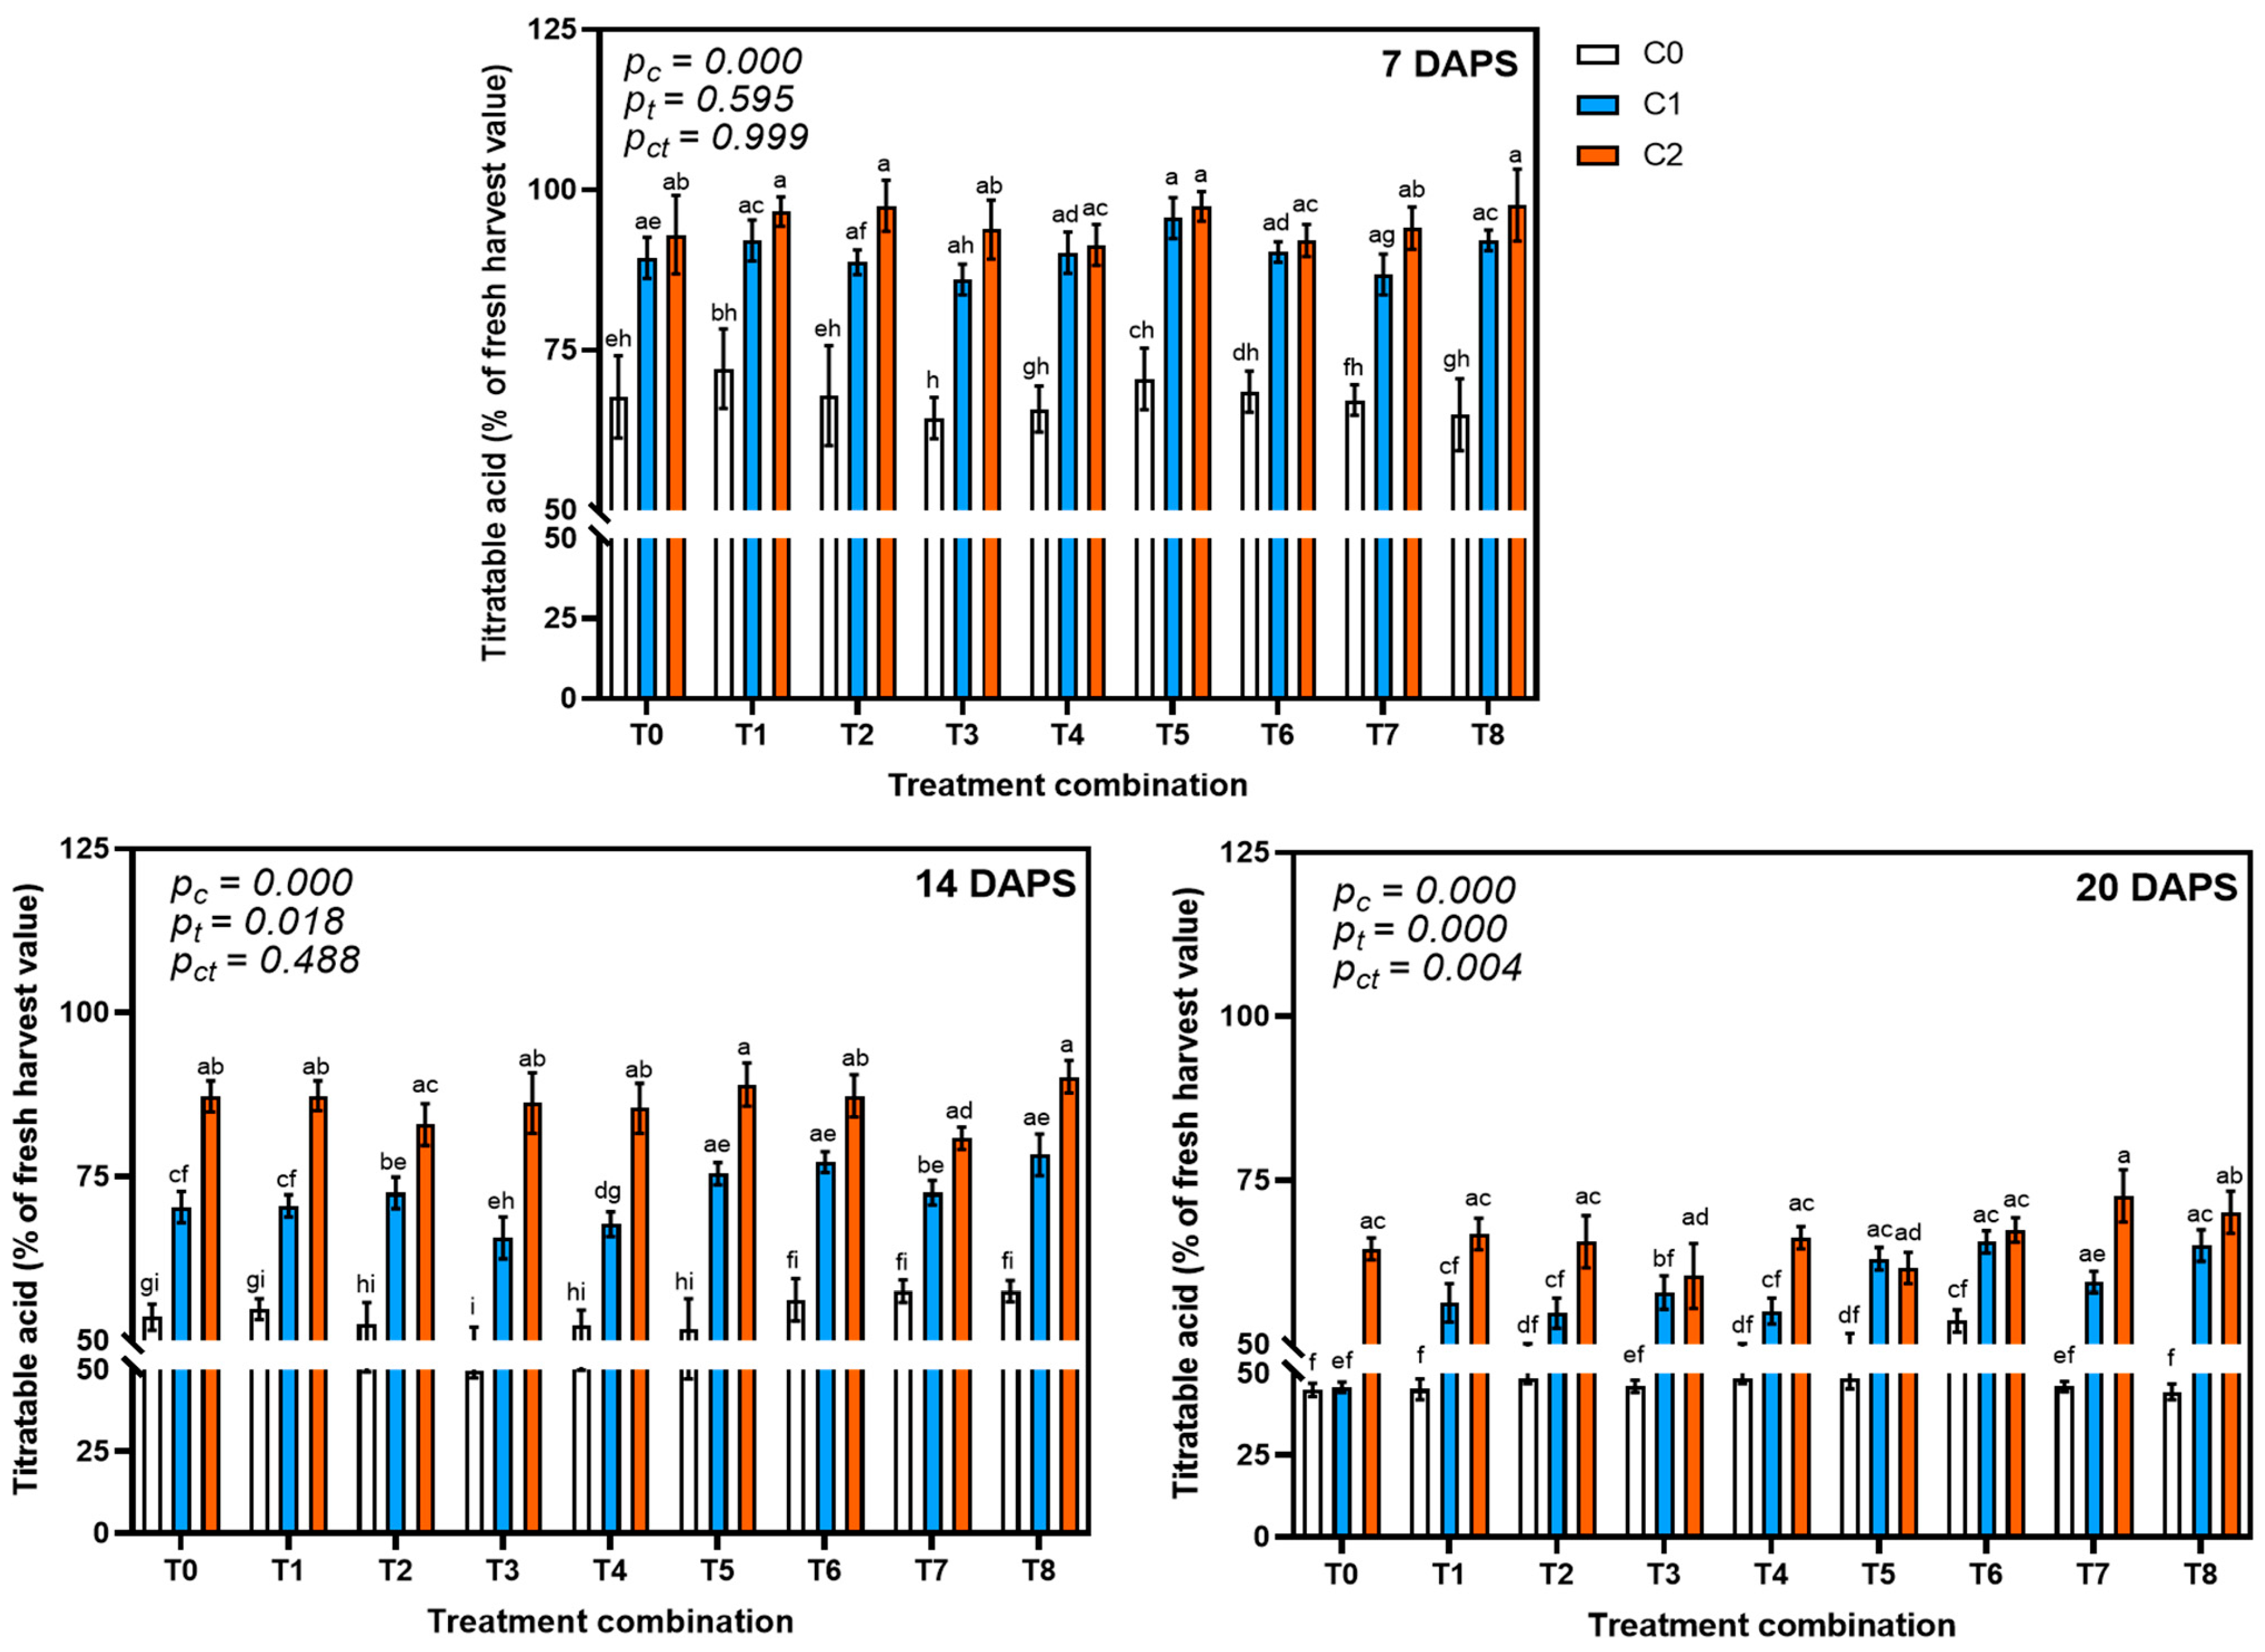
The effects of different levels of chitosan coating on the titratable acidity (TA) of tomatoes at different DAPS are shown in Figure 3. This figure illustrates that postharvest chitosan treatments (at 0.1% and 0.2%) significantly preserved TA in tomatoes compared to control, especially at 7 and 14 DAPS. But preharvest applications of chitosan and Ca, either alone or in combination, showed insignificant results on TA at 7 and 14 DAPS, while there were significant variations at 20 DAPS. However, the interaction results at all DAPS indicate that there were no significant variations in the TA content of tomatoes. In the case of treatment C0 (absence of postharvest chitosan application), the TA content decreased to 64.4–72.1% at 7 DAPS, 49.8–57.5% at 14 DAPS, and 44.4–53.6% at 20 DAPS of the fresh-harvest value (0.76 ± 0.01 g citric acid/100 g of fresh wt.). On the other hand, the application of the C1 treatment (0.1% chitosan) resulted in reductions in TA by 86.0–95.6%, 65.6–78.3%, and 45.8–65.6%, while the C2 treatment (0.2% chitosan) reduced TA levels to 91.4–97.6%, 80.8–90.2%, and 60.4–72.6% during the same storage periods. This result indicates a trend of decreasing titratable acidity in tomato fruits over time across all treatments. The variations in acidity levels suggest that the application of chitosan during postharvest storage may influence the fruit’s chemical composition.

3.4.2. Effect on Vitamin C

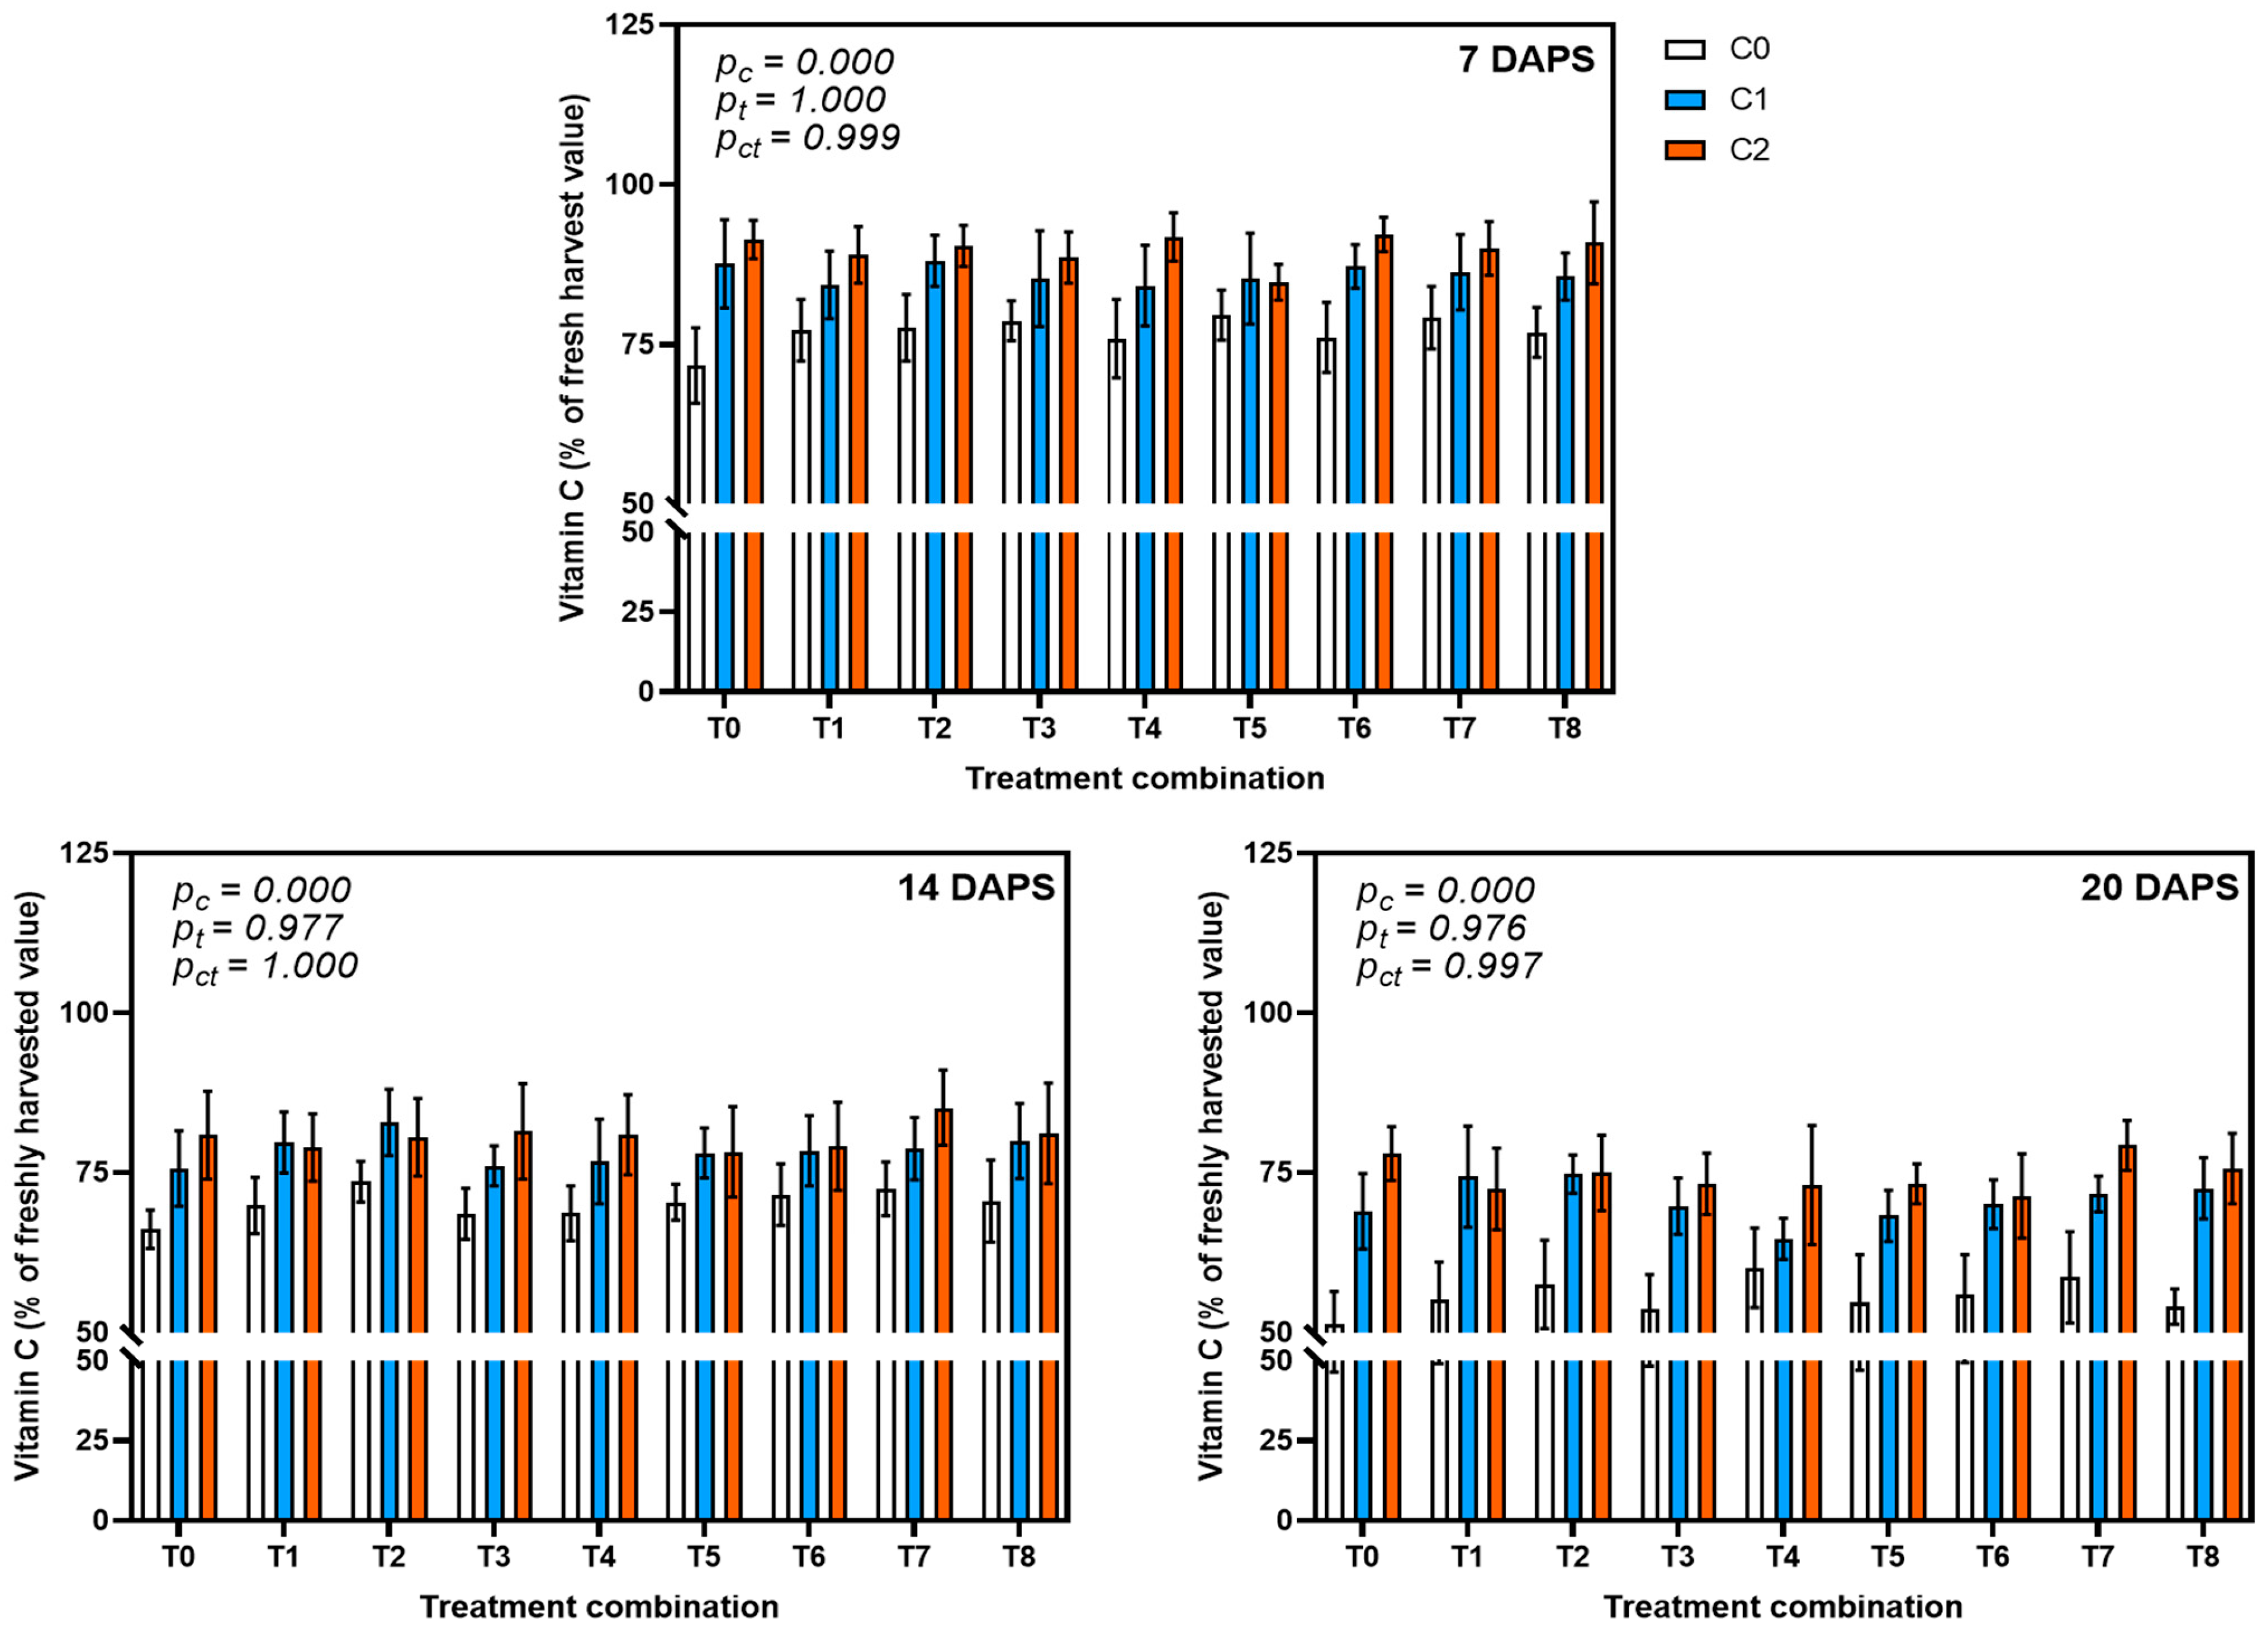
Tomatoes are an excellent source of vitamin C. Consumption of 200 g of fresh tomatoes provides around 30–36% of the human recommended dietary requirements for vitamin C [24]. Figure 4 illustrates the impact of varying levels of chitosan covering on the vitamin C content of tomato fruits at various DAPS. It can be seen from Figure 4 that only postharvest chitosan treatments had significant effect (pc = 0.000 at all DAPS) on the vitamin C content of tomatoes. However, preharvest applications of chitosan and Ca, either alone or in combination, showed minimal influence on the vitamin C content of tomatoes. In the absence of postharvest chitosan intervention (C0), the vitamin C content decreased to 71.7–79.6%, 66.1–73.5%, and 51.4–60.1% of the fresh harvest value (28.1 ± 1.0 mg/100 g fresh wt.) after 7, 14, and 20 DAPS, respectively. Conversely, the application of 0.1% chitosan (C1) resulted in reductions in vitamin C by 84.2–88.1%, 75.6–82.8%, and 64.6–74.7%, whilst 0.2% chitosan (C2) reduced vitamin C levels to 84.7–92.2%, 78.2–85.1%, and 71.3–79.2% during the same storage periods. The data suggest that, while vitamin C content fluctuates, the treatment with 0.20% chitosan (C2) consistently resulted in higher vitamin C levels compared to the control and 0.10% chitosan (C1) treatment, which indicates that chitosan coatings with 0.20% solution effectively regulate vitamin C content in tomatoes at various DAPS.

3.4.3. Effect on Lycopene

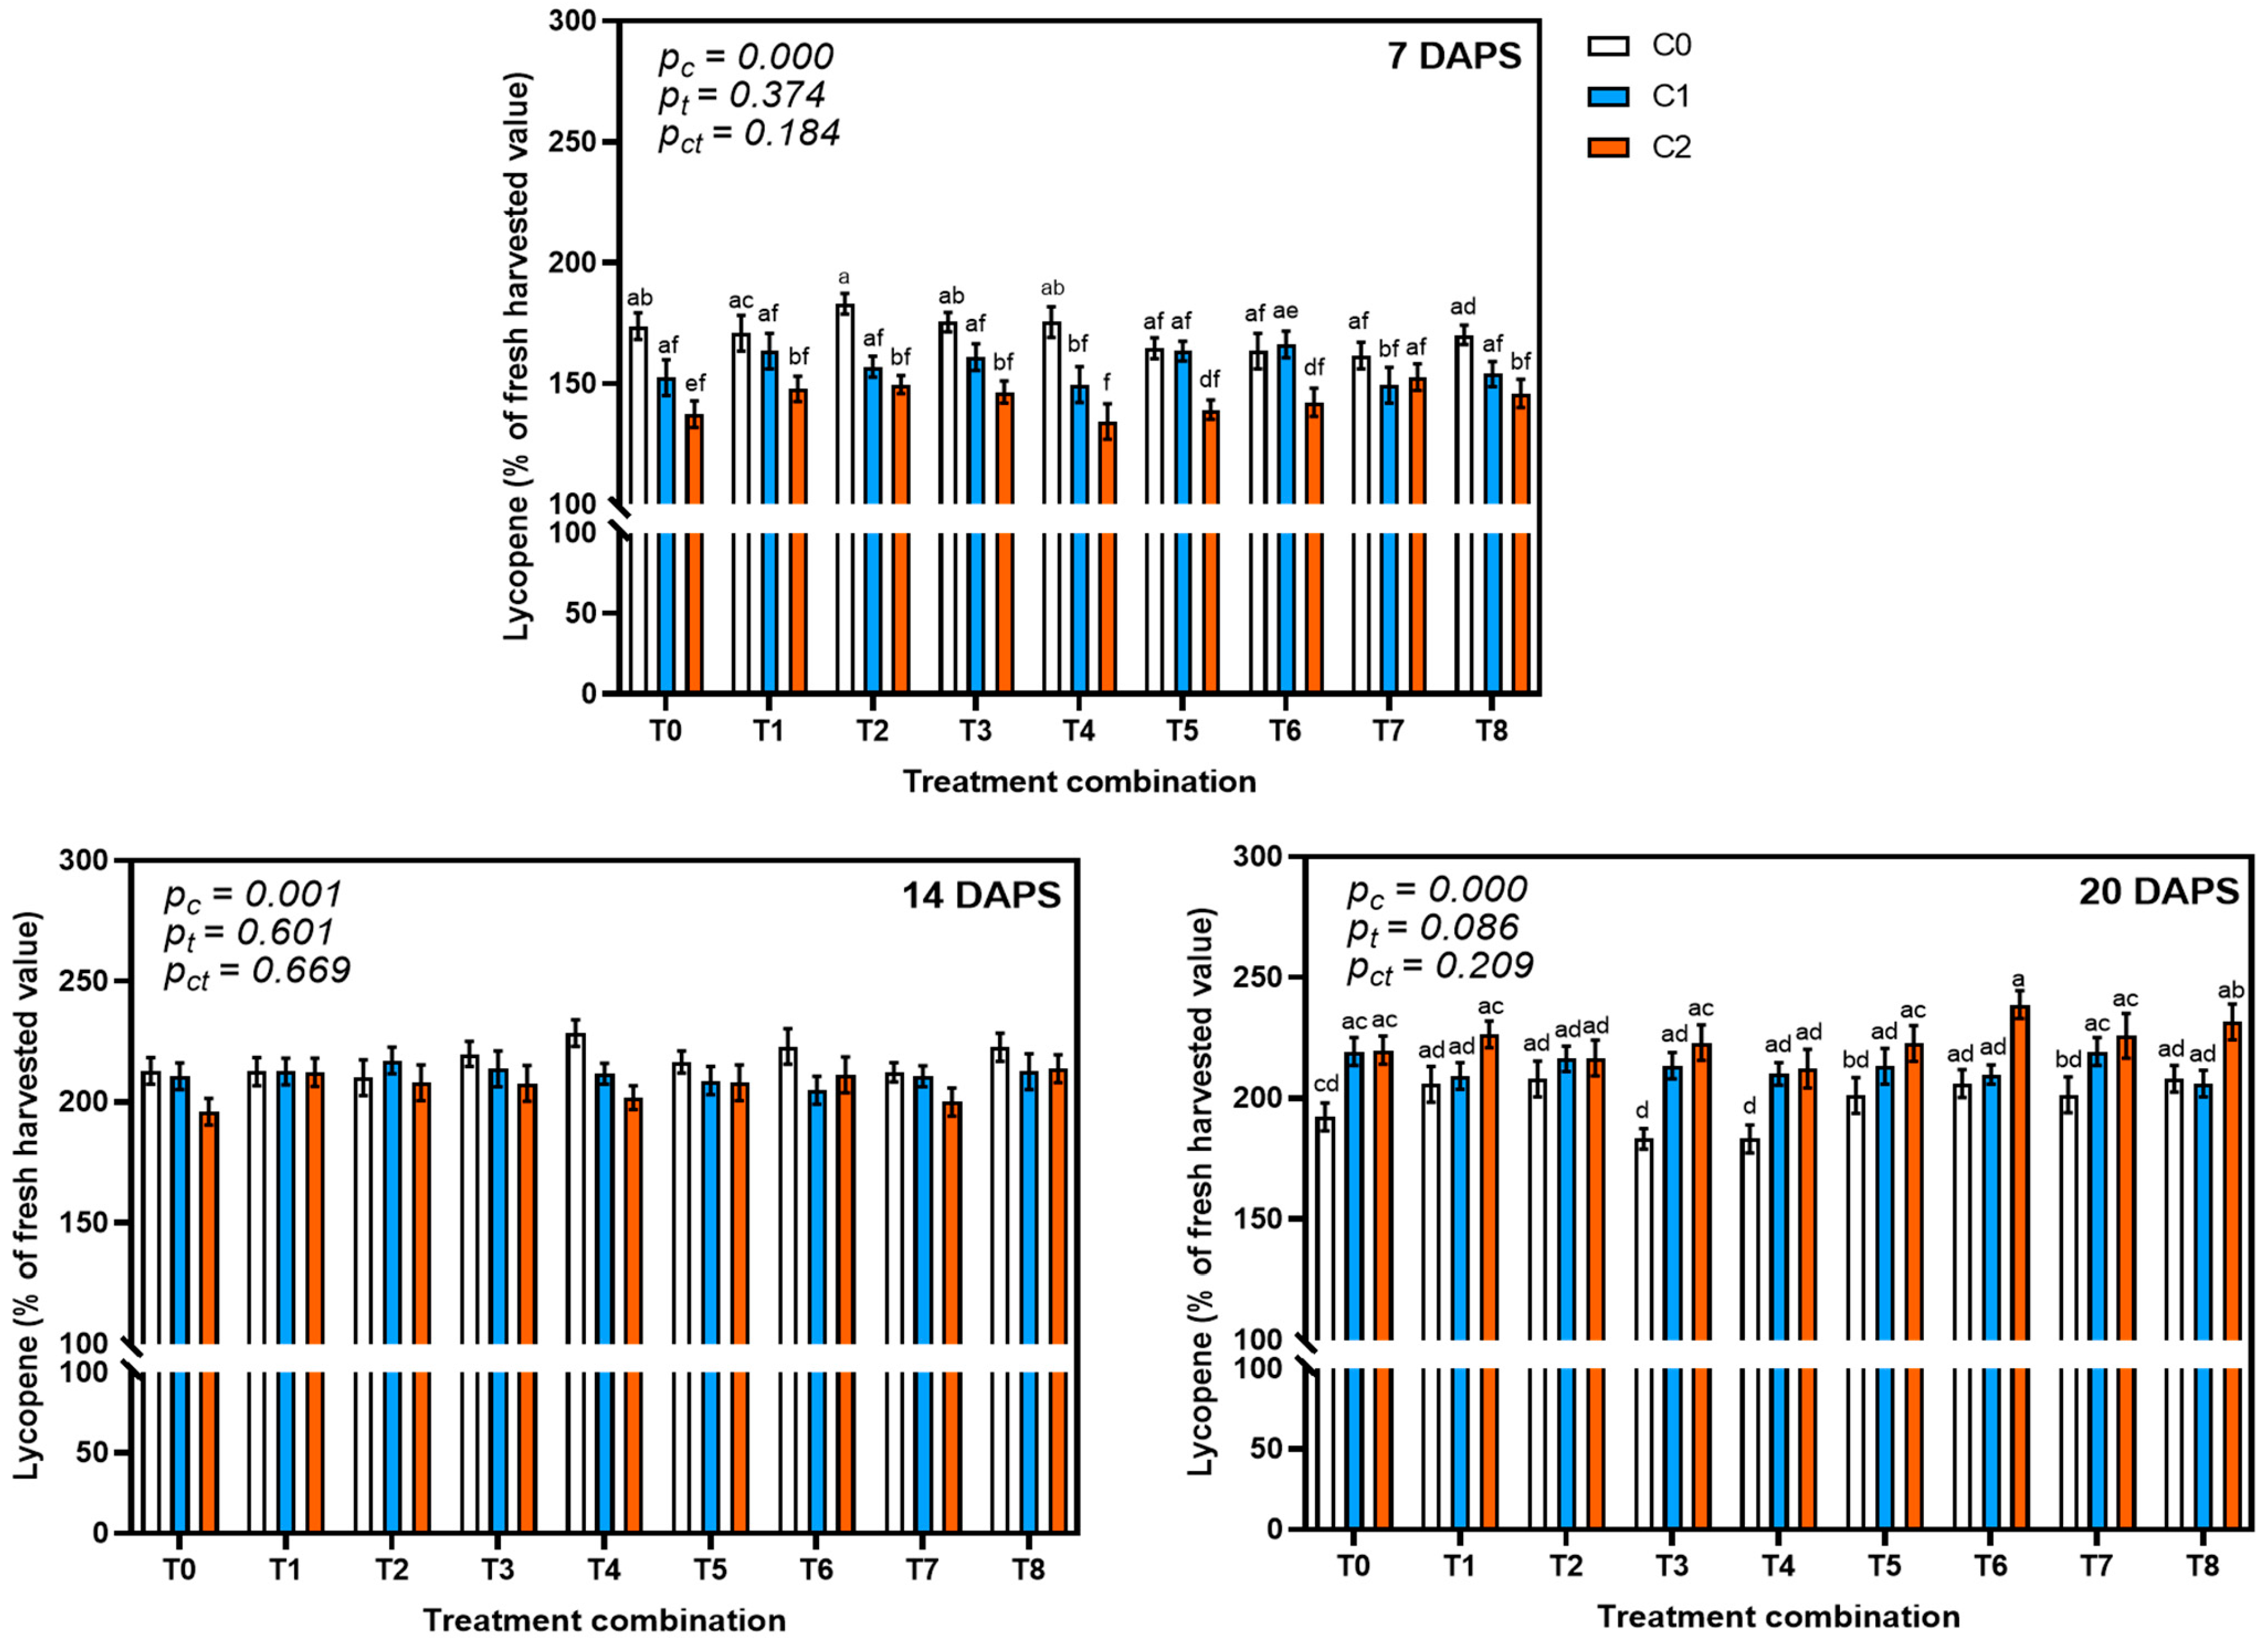
Lycopene is a carotenoid that imparts the color red to tomatoes. Epidemiological and laboratory tests indicate that lycopene and the intake of lycopene-rich foods may lower the chance of developing cancer and heart attacks [25]. Lycopene biosynthesis in tomatoes is closely associated with fruit ripening, during which chlorophyll degradation is accompanied by the accumulation of carotenoids, particularly lycopene [26]. The effects of chitosan treatments on lycopene accumulation during storage are presented in Figure 5. In this study, postharvest application of chitosan at 0.1% and 0.2% significantly enhanced lycopene content in tomato fruits, especially at 20 DAPS. In contrast, preharvest treatments alone did not produce a statistically significant effect on lycopene accumulation. Among the treatment combinations, the highest lycopene contents were recorded in C0T2 (5.97 ± 0.24 mg/100 g fresh weight) at 7 DAPS, C0T4 (7.38 ± 0.31 mg/100 g fresh weight) at 14 DAPS, and C2T6 (7.78 ± 0.32 mg/100 g fresh weight) at 20 DAPS. When no postharvest chitosan was applied (C0), lycopene content increased to 162–183%, 200–229%, and 183–208% of the fresh harvest value at 7, 14, and 20 DAPS, respectively. Application of 0.1% chitosan (C1) elevated lycopene levels to 149–166%, 205–217%, and 206–219%, while 0.2% chitosan (C2) further increased lycopene content to 134–153%, 196–214%, and 212–239% at the same respective storage intervals. Notably, two distinct trends were observed in the progression of lycopene content during storage. In fruits without postharvest chitosan (C0), lycopene levels increased initially, peaking at 14 DAPS (average 217.6% of the fresh harvest value), followed by a slight decline at 20 DAPS (198.8%). In contrast, when chitosan was applied postharvest (C1 or C2), lycopene content steadily increased with longer storage duration. Specifically, the average lycopene content in C1-treated fruits rose from 157% at 7 DAPS to 212% at 14 DAPS and 213% at 20 DAPS. Similarly, for C2, values increased from 144% to 207% and 224% across the same intervals. These findings suggest that postharvest chitosan application not only enhances lycopene accumulation, but also sustains its increase over prolonged storage, potentially contributing to the better nutritional quality and visual appeal of the fruit.

3.4.4. Effect on Total Sugar

In general, sugar accumulation in tomato fruits increases with the progression of ripening [27]. In the present study, total sugar content also increased during postharvest storage, particularly at 7, 14, and 20 DAPS (Figure 6). While preharvest applications of chitosan and Ca—either alone or in combination—exhibited minimal influence on total sugar levels, postharvest chitosan treatments (at 0.1% and 0.2%) significantly enhanced total sugar accumulation, especially at extended storage durations (between 14 and 20 DAPS). Without postharvest chitosan application (C0), total sugar content increased to 134–144%, 144–176%, and 148–182% of the fresh harvest value (1.3 ± 0.11% of fresh wt.) at 7, 14, and 20 DAPS, respectively. In contrast, application of 0.1% chitosan (C1) led to total sugar increases of 128–138%, 148–169%, and 153–185%, while 0.2% chitosan (C2) increased total sugar to 112–126%, 144–159%, and 169–186% at the same respective storage intervals. Interestingly, at the earlier stage of storage (7 DAPS), postharvest chitosan treatments showed slightly lower total sugar content compared to the control. Additionally, although not statistically significant, preharvest chitosan application alone (T1 and T2) appeared to increase total sugar content, particularly when no postharvest treatment was applied (C0).

3.5. Correlations Among the Analyzed Parameters

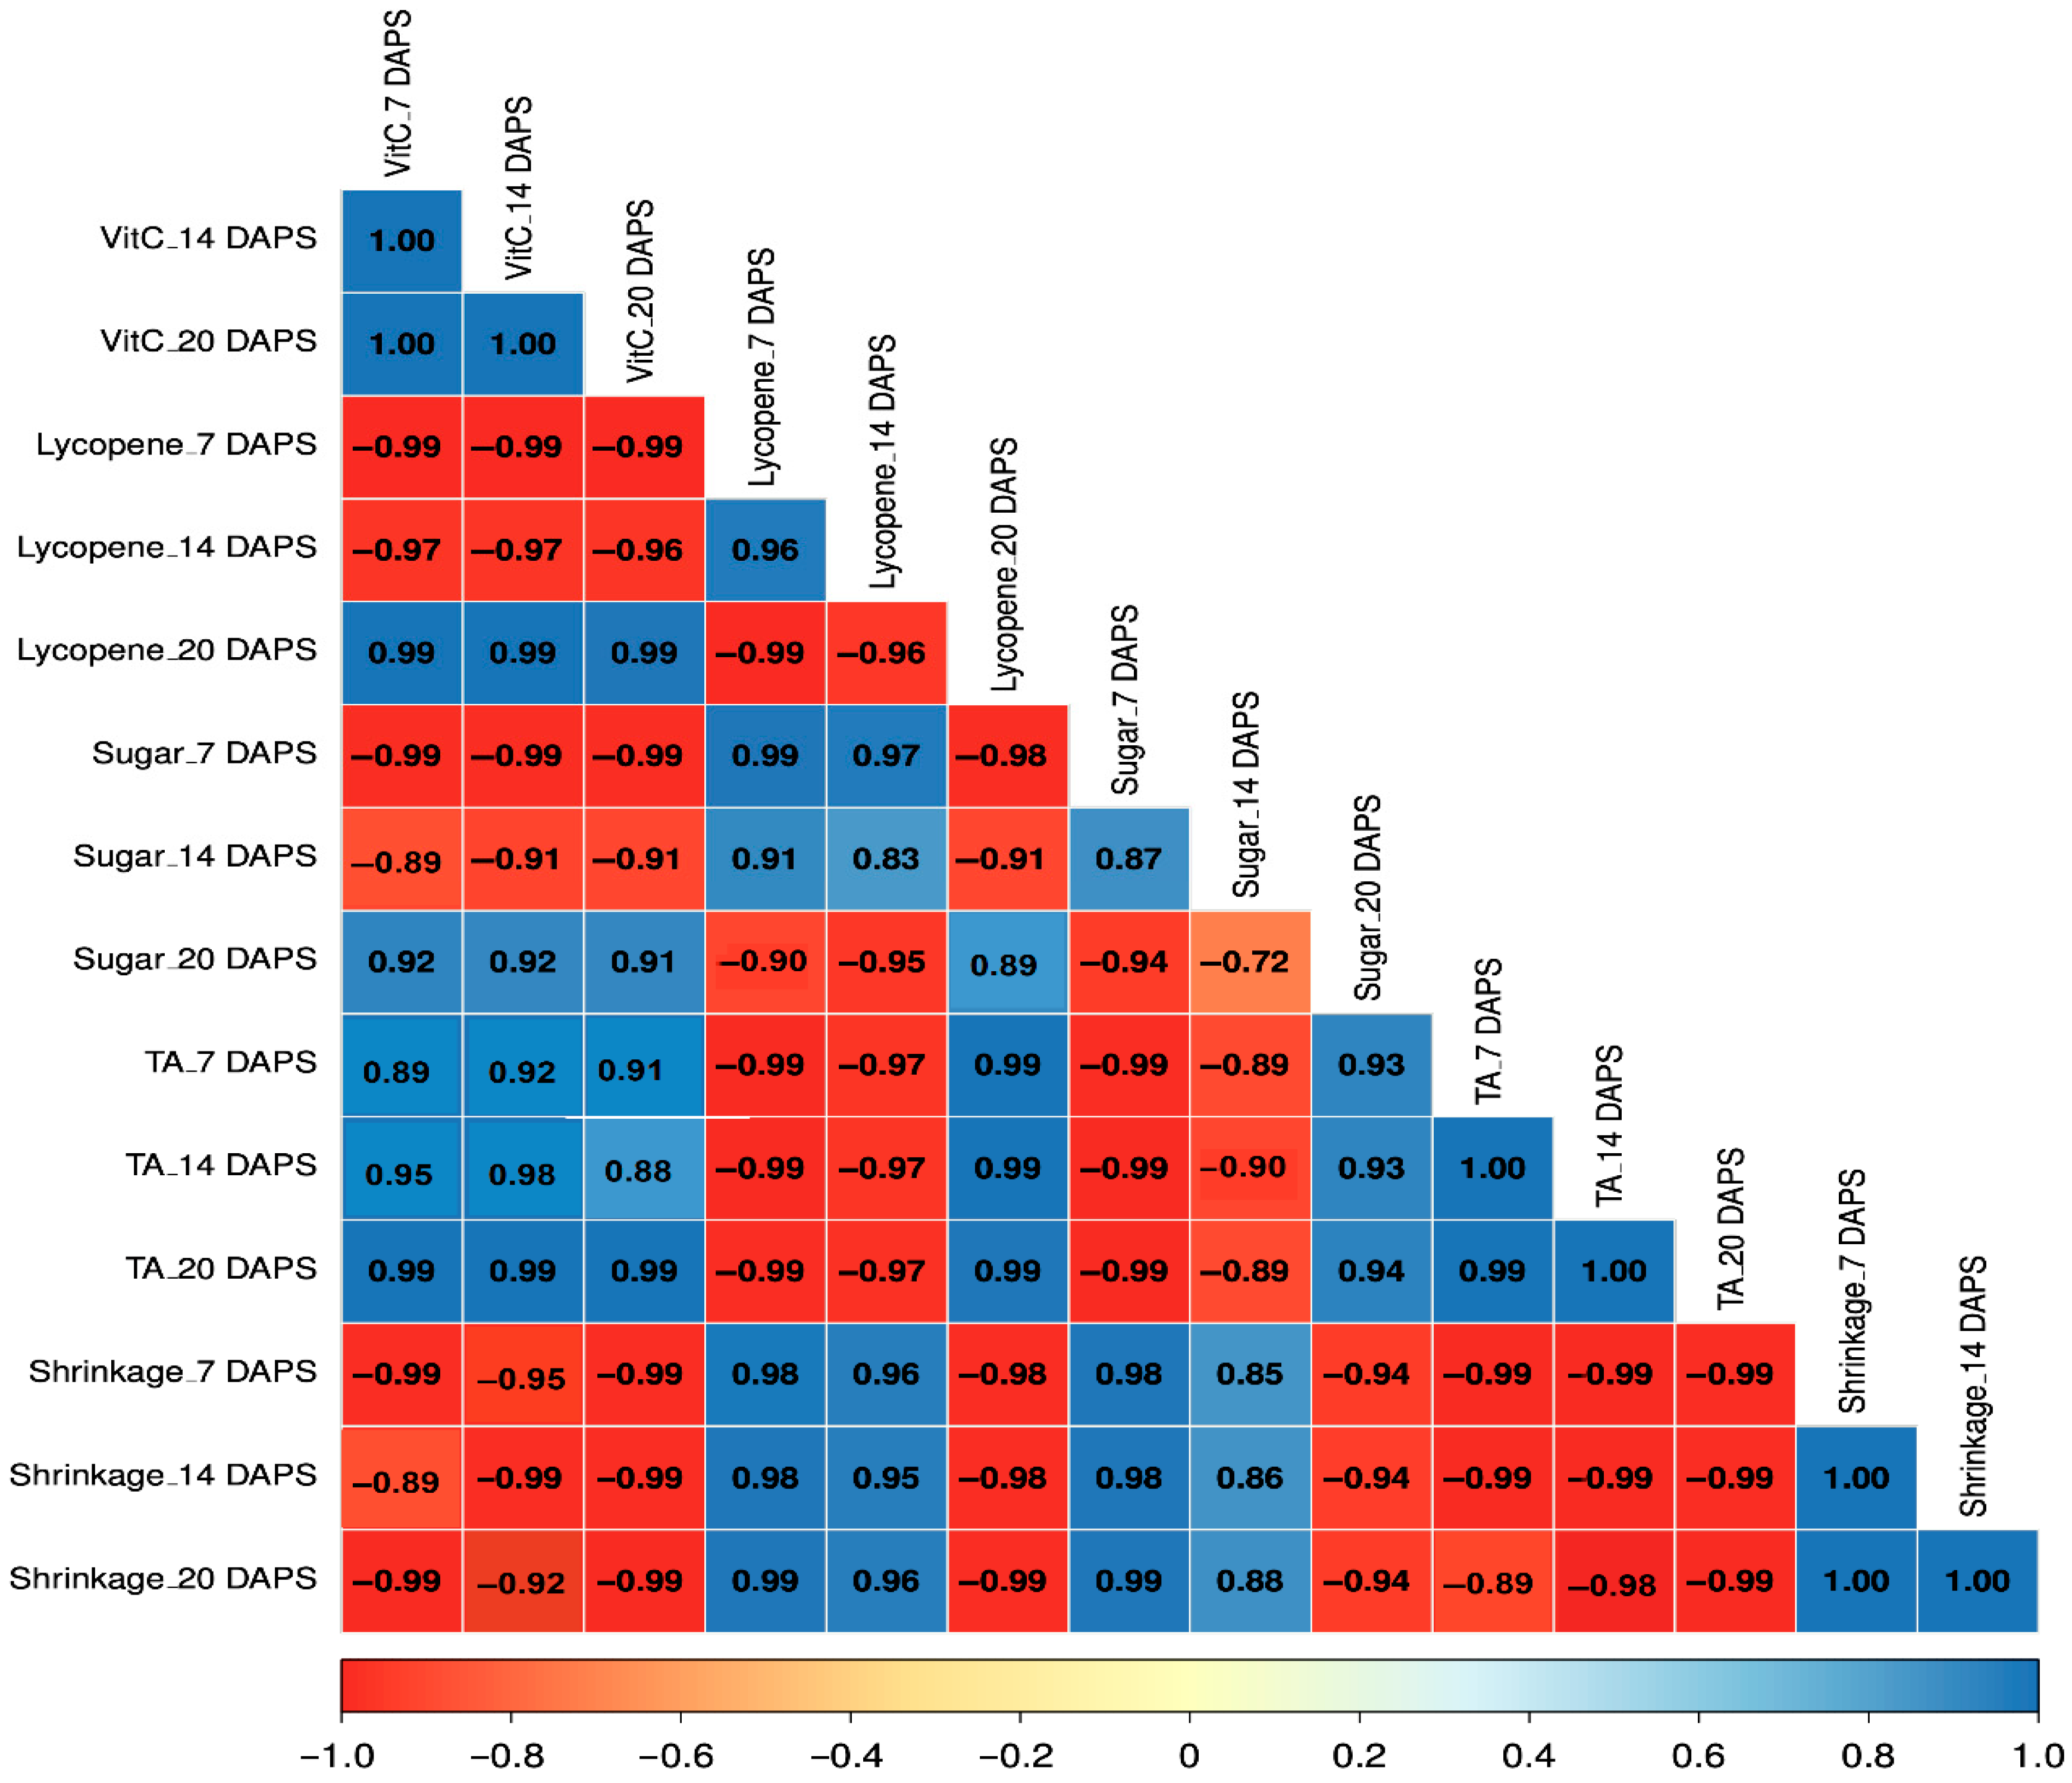
The present study used Pearson correlation coefficients, which enabled the identification of several strong, statistically significant (p < 0.05) connections between the various physicochemical properties of the tomato fruit (Figure 7). Some of these were expected, such as the predictable positive and strong association between fruit shrinkage with lycopene and sugar content (up to 14 DAPS). The results also suggested that these patterns were true for a certain period after the tomatoes were stored (up to 14 days after postharvest storage), and the longer period (i.e., at 20 DAPS) showed a clear negative relationship (Figure 7). Significant positive correlations were also identified between the following parameter pairs: vitamin C (at all DAPS)–lycopene (at 20 DAPS); vitamin C (at all DAPS)–sugar (at 20 DAPS); vitamin C (at all DAPS)–titratable acidity (at all DAPS); sugar (at 7 and 14 DAPS)–lycopene (at 7 and 14 DAPS); sugar (at 20 DAPS)–lycopene (at 20 DAPS); titratable acidity (at all DAPS)–lycopene (at 20 DAPS); titratable acidity (at 7 DAPS)–sugar (at 20 DAPS); fruit shrinkage (at all DAPS)–lycopene (at 7 and 14 DAPS); and fruit shrinkage (at all DAPS)–sugar (at 7 and 14 DAPS).
However, some relationships, such as the highly significant negative correlations between vitamin C with fruit shrinkage, lycopene, and sugar concentrations, were also predictable. These findings suggest that, as vitamin C levels increase, there is a tendency for fruit shrinkage and the concentrations of lycopene and sugar to decrease. Such correlations highlight the complex balance of nutrients and their impact on the physical appearance of tomato fruit. The following pairs of physicochemical parameters also showed strong negative relationships: vitamin C (at all DAPS)–lycopene (at 7 and 14 DAPS); vitamin C (at all DAPS)–sugar (at 7 and 14 DAPS); sugar (at 7 and 14 DAPS)–lycopene (at 20 DAPS); sugar (at 20 DAPS)–lycopene (at 7 and 14 DAPS); titratable acidity (at all DAPS)–lycopene (at 7 and 14 DAPS); titratable acidity (at all DAPS)–sugar (at 7 and 14 DAPS); fruit shrinkage (at all DAPS)–vitamin C (at all DAPS); fruit shrinkage (at all DAPS)–lycopene (at 20 DAPS); and fruit shrinkage (at all DAPS)–sugar (at 20 DAPS).

4. Discussion

4.1. Preharvest Application of Chitosan and Ca on Tomato Yield

The current study’s findings suggest that applying chitosan alone or in combination with Ca has a positive influence on the fruit length of tomatoes. Parvin et al. [15] also reported a significant positive influence of chitosan on the fruit length of tomatoes. According to Mondal et al. [28], chitosan applied topically improved summer tomatoes’ reproductive efficiency and, consequently, their principal yield component. In another study, Mondal et al. [29] stated that the majority of the morphological (plant height, leaf number per plant), growth (total dry mass per plant, absolute growth rate, relative growth rate), biochemical variables (nitrate reductase and photosynthesis), and yield parameters (number of fruits per plant and fruit size) were augmented by increasing concentration of chitosan up to 25 ppm spray solution, resulting in the highest fruit yield in okra. However, tomato fruit diameter is largely determined by the amount of fruits per truss and the timing of fruit set. Along with genetic characteristics, other environmental elements, including light, water availability, temperature, and nutrient delivery, may also influence fruit diameter [15]. Parvin et al. [15] also reported similar findings to the present study, and obtained the maximum fruit diameter of tomatoes by applying chitosan to the soil at 120 ppm. This finding indicates that, while there were variations in fruit diameter among the different treatments, none of the levels of chitosan and Ca significantly influenced the overall diameter of the tomatoes. Therefore, other factors may be responsible for the observed differences in fruit diameter. El Amerany et al. [30] reported that chitosan did not exert a significant favorable effect on the diameter of tomatoes. Accordingly, it may be concluded that treatments with chitosan and Ca, either individually or in conjunction, may not serve as effective agents for increasing the diameter of tomato fruits. Therefore, further research could explore alternative methods to improving fruit diameter in tomatoes.
This study’s results indicate that the number of fruits per tomato plant increases after the foliar application of chitosan during the fruit initiation stage. Sultana et al. [31] observed that foliar application of chitosan at concentrations of 60 and 100 ppm positively influenced the number of fruits per tomato plant. Hassnain et al. [32] observed that the highest number of fruits per plant occurred in those treated with a 100 ppm chitosan aerial application, whereas the lowest yield was found in the control group. Mondal et al. [28] discovered that the quantity of fruits per tomato plant was higher in those treated with chitosan (25, 50, and 75 ppm) compared to the control group of summer cultivars of tomatoes. On the contrary, Parvin et al. [15] reported a non-significant effect of different levels of chitosan application on the number of fruits per plant of tomato. However, Sultana et al. [31] identified statistically significant differences (p < 0.05) in the mean single-fruit weight of tomatoes across various chitosan treatments measured from 60 to 105 days after transplanting. Hassnain et al. [32] also stated that treatment with the application of 100 ppm chitosan registered a higher average fruit weight compared to the average fruit weight of untreated plants, which supports the current study findings. In contrast, Parvin et al. [15] reported a non-significant effect of different levels of chitosan application on average fruit weights of tomatoes. This discrepancy highlights the need for further investigation to understand the conditions under which chitosan affects fruit weight in tomatoes. However, the differing results may be attributed to the variations in the experimental design or environmental factors that influence tomato plant growth and various fruit characters.
This study’s findings also show that applying chitosan at a concentration of 80 ppm during the fruit initiation stage could be an effective method for enhancing tomato yields. In contrast, the application of Ca at the same growth stage did not lead to a significant increase in tomato yields. As a result, the research highlights the potential ineffectiveness of preharvest Ca applications in improving tomato fruit production. However, Abdelaleem et al. [33] reported that foliar spraying of CaCl2 resulted in a much larger fruit yield than control plants during the two seasons. The foliar administration of chitosan during the fruit initiation stage, either alone or in conjunction with Ca, significantly enhanced tomato productivity [33]. Sultana et al. [31] indicated that foliar administration of oligo–chitosan at several concentrations (60 and 100 ppm) positively influenced tomato fruit production. Mondal et al. [28] discovered that the fruit yield in summer tomato plants treated with chitosan (25, 50, and 75 ppm) surpassed that of the control plants. Regarding the chitosan application, Hassnain et al. [32] also stated that the maximum value of tomato yield was noticed in plants sprayed with 100 ppm chitosan followed by the application of 150 ppm chitosan, while minimum tomato yield was perceived in the control. From the above discussion, it can be summarized that the application of chitosan appears to significantly enhance the yield of tomatoes. Previous research also indicates that varying concentrations of chitosan can lead to increased production compared to untreated plants, highlighting its potential as an effective growth promoter in tomato cultivation [28,31,32]. However, some discrepancies in yield-contributing parameters emphasize the need for further research to better understand the specific conditions and factors influencing chitosan’s effectiveness across various cultivars.

4.2. Preharvest Application of Chitosan and Ca on Biochemical Quality of Tomato

The present study reveals that all of the biochemical quality parameters were statistically insignificant among the preharvest treatments of chitosan and Ca. However, it has been reported that among all the applied concentrations, there were no apparent distinctions between chitosan and Ca chloride [34]. The firmness of tomato fruits was not affected by Ca foliar application when sprayed after 39 and 62 days of full bloom, as compared to the control [35]. Additionally, according to Vance et al. [36], no crop or cultivar (strawberry, raspberry, blackberry, or blueberry) evaluated experienced changes in fruit quality, firmness, or shelf life as a result of the various foliar Ca products or application techniques. The most prevalent carotenoid in ripened tomato fruits and a significant pigment, lycopene, gives tomatoes their rich, red look. In agreement with this work, 2% CaCl2 treatment delayed the development of color (i.e., lycopene content) in the tomatoes at the maturity stage. Additionally, there was no apparent distinction between the control treatments and the effects of CaCl2 (1, 1.5, or 2%) on the total phenolic content of tomatoes [37]. The present study’s results align with the findings of Hernández et al. [38] and Abdelaleem et al. [33], who reported that foliar spraying of chitosan (1.0 g/L) enhanced tomato yield by increasing fruit quantity, yet resulted in a notable reduction in the concentrations of lycopene, vitamin C, lutein, β-carotene, and flavanols. Likewise, preharvest treatments of CaCl2 (1.0%) and chitosan (0.10, 0.30, and 0.50%) exhibited no significant variation in the lycopene content of tomato fruits compared to the control after 4, 8, and 12 days of storage under room temperature conditions [39]. A study by Parvin et al. [15] demonstrated that various chitosan application strategies influenced tomato quality, as foliar spraying alone reduced lycopene concentration in the fruit. Although Santos et al. [40] found that CaCl2 was the most effective source of Ca2+ for tomato plants, the results of the current investigation contradict this finding, which may be because the soil provides tomato plants with an adequate amount of Ca2+. Similarly, in contrast to the present findings, Mazumder et al. [37] found that 2% CaCl2 spraying resulted in less weight loss and a decrease in the incidence of disease. The current study’s findings also contradict those of Shao et al. [41], who noted that chitosan treatment on mature green tomatoes enhanced fruit quality, including skin color, carotenoid content (lycopene and β-carotene), and vitamin C levels. However, these variations indicate that the nutritional composition of fresh harvested tomatoes can differ remarkably depending on various factors such as temperature, light, humidity, and overall growing conditions.
However, it can be inferred that the current findings highlight a divergence from previous research regarding the effects of Ca and chitosan foliar treatments on tomato plants. While soil conditions appear to supply adequate Ca, the inconsistency with results suggests that further investigation is needed to resolve these differences and understand their implications for the growth, yield, and quality of tomato fruits.

4.3. Postharvest Application of Chitosan on Physicochemical Qualities of Tomato

This study indicates that chitosan coatings control the weight loss of tomatoes compared to the control at different DAPS, and chitosan coatings with a 0.20% solution can reduce shrinkage by about 34–37% compared to uncoated tomatoes. As was the case in this study, Tagele et al. [39] reported that preharvest treatments of chitosan and CaCl2 reduced the weight reduction in tomatoes after 4, 8, and 12 days at ambient storage settings. However, the excessive decrease in weight in the control sample was brought about by the fruits’ shrinkage due to the transpiration of water, which did not occur in the treated fruits, i.e., tomatoes did not lose water due to the chitosan covering. Sree et al. [21] also reported similar observations. According to ElSayed et al. [42], chitosan coverings may form a somewhat impermeable barrier around the fruits, preserving their internal temperature and reducing evaporation losses, which would lessen weight loss. According to El-Mogy et al. [43], both transpiration and respiration cause perishable fruits and vegetables to lose some of their weight after harvest. Thus, by creating a thin, impermeable covering on the external surfaces of the fruits and vegetables, the chitosan-coated tomatoes might be able to limit transpiration and evaporation, which could explain the decreased weight loss [44,45]. The current investigation indicates that the application of a chitosan layer after harvest could effectively prevent tomatoes from experiencing weight loss. This study also reveals that changes in visual quality become more apparent after 7 DAPS. The results at 20 DAPS showed that only treatment C2 (0.20% chitosan) had scores that were much higher than what is considered acceptable, which means that treatment C2 is good at maintaining the visual quality of tomato fruits. This finding indicates that treatment C2 not only preserves the esthetic appeal of tomatoes, but also surpasses the minimum standards necessary for quality. Consequently, it suggests that this particular treatment could be a viable option for maintaining the marketability of tomato fruits during postharvest storage. A statistically significant decline in visual appeal was observed in control-treated fruits with lowest panelist scores (<4.50) below the market acceptability threshold. Consistent with our results, earlier research shows that chitosan coating often enhances the external look or esthetic appeal of fruits and vegetables [46,47,48]. This advantage is most likely because fruits treated with chitosan often exhibit a delayed rate of anthocyanin breakdown. Studies on raspberries and strawberries have shown such positive effects [49]; however, there is conflicting information on the formation of anthocyanins in strawberries exposed to chitosan, which may be related to the cultivar, chitosan source, and dosages used [50].
Among the biochemical qualities studied, research indicates that the titratable acidity of tomatoes diminishes as maturity progresses. Meng et al. [51] observed that the overall acidity of grapefruit diminished as maturity increased and did not change significantly after preharvest application of chitosan. The reduction in acidity as time passes appears to be more significant in uncoated tomatoes than in coated tomatoes, potentially linked to elevated ethylene production and respiration rates during the ripening process [52,53]. It is commonly recognized that the usage of natural acids in the metabolic respiration processes decreases with decreasing respiration rate after postharvest treatments [54]. The current investigation’s findings align with those of Bico et al. [54], Oz and Ulukanli [53], and Das et al. [52]. But Sultana et al. [31] demonstrated that aerial administration of chitosan at concentrations of 60 and 100 ppm resulted in decreased acidity in tomatoes in comparison to control samples. The findings of this study support previous research indicating that postharvest chitosan treatments can effectively modulate the metabolic processes of tomato fruits.
Regarding vitamin C, the results indicate that chitosan coatings effectively regulate vitamin C content in tomatoes in comparison to the control treatment at various DAPS. Khan et al. [55] indicated that the significant promoting effect of chitosan on vitamin C content, in comparison to the control, may be attributed to chitosan’s capacity to boost the photosynthesis process, which is closely linked to the formation of carbohydrates and vitamins. Sultana et al. [16] found that after-harvest treatment with chitosan substantially reinstates vitamin C content in tomatoes. This finding aligns with the reports by Abd El-Gawad and Bondok [56] and Sultana et al. [31]. Chitosan functions as a plant growth promoter, potentially by enhancing the supply and the absorption of water and vital minerals through the modulation of cell osmotic pressure and the reduction in hazardous free radical formation via increased antioxidant and enzyme functions [57]. These findings highlight the potential use of chitosan in farming methods intended to enhance the sustainability and quality of food.
Lycopene content in tomato fruits increased with storage time when treated with chitosan coatings. The primary cause of the initial drop in lycopene content during storage is the oxidation and isomerization of lycopene. This process is extremely vulnerable to the degradation of lycopene when exposed to factors such as heat, light, and oxygen. However, there may be a further rise in lycopene while storage continues, perhaps as a result of other carotenoids being converted to lycopene [58]. The use of chitosan treatments resulted in a decrease in the activities of superoxide dismutase [51]. Furthermore, chitosan treatments applied after harvest altered the functions of a number of enzymes with different functions [51]. Additionally, they reported that the amount of total phenolic compounds in fruit exposed to preharvest chitosan treatment dropped, but then rose at the completion of the time of preservation, which is almost similar to the findings of the present investigation. Conversely, elevated storage temperatures may promote lycopene biosynthesis in tomato fruits. The effect of high-temperature storage on lycopene biosynthesis was also identified by Javanmardi and Kuboto [59] and Sultana et al. [16]. On the other hand, this study also indicates that the preharvest application of chitosan and Ca did not affect the contents of lycopene in tomato fruits during postharvest storage. In contrast, it has been reported that the concentration of lycopene in tomatoes was considerably raised by aerial chitosan administration in the field, either alone or in conjunction with soil [15], although they reported a few inconsistencies in results, which could be attributed to the maturity of fruits and their size, in addition to the surrounding conditions. However, the total sugar contents in tomato fruits increased significantly with storage time due to the postharvest application of the C2 treatment. The presence of chitosan as a coating not only impacts sugar levels, but also influences the overall acidity and stability of the tomato fruits, thereby slowing down the ripening process through various biochemical mechanisms [60,61]. According to Czékus et al. [62], chitosan applied to shoots (at 1000 ppm) could be linked to early ethylene production, which is known to lead to increased sugar levels and reduced acidity in tomatoes. Furthermore, this study’s results indicate that, as the levels of lycopene and sugar in tomato fruits increased, there was a corresponding reduction in their size, i.e., fruit weight loss increased, which is a finding consistent with Sultana et al. [16] and Saha et al. [44].
However, the correlation study reveals complex interactions among physicochemical factors, which provide important information on how fruit quality changes. Notably, vitamin C in tomato fruits emerges as a critical component, exhibiting strong negative relationships with both lycopene and sugar levels, suggesting that higher concentrations of vitamin C may inhibit the accumulation of these compounds in tomato fruits. Similarly, fruit shrinkage was closely tied to the levels of vitamin C, lycopene, and sugar, indicating that, as these compounds fluctuated, so too did the structural integrity of the fruit. All of these results highlight how crucial it is to balance these physicochemical elements in order to maximize fruit quality and reduce shrinkage, which will eventually direct future agricultural practices and nutritional strategies.
The application of chitosan coating on tomato fruits during postharvest storage emerges as a transformative practice in the field of agriculture, significantly impacting their quality and storage duration. Collectively, the present study’s findings highlight promising contributions of chitosan coatings to improving tomato fruit quality and longevity, which pave the way for more sustainable practices in postharvest technologies.

5. Conclusions

Chitosan, a natural biopolymer known for its biocompatibility and diverse applications, has drawn the attention of scientists globally. This study demonstrates that the foliar application of chitosan during the fruit initiation stage produces the highest fruit yield, and its use after harvest can help keep levels of titratable acidity and vitamin C from dropping significantly while the tomatoes are stored. Furthermore, postharvest treatment with chitosan increases the levels of lycopene and total sugar in tomato fruits throughout the maximum storage duration, which highlights the potential benefits of chitosan in improving the nutritional quality of tomatoes during postharvest storage.
Finally, this study indicates that foliar application of chitosan at a concentration of 80 ppm during the fruit initiation stage significantly enhances tomato yield. Moreover, by applying a 0.20% chitosan coating during postharvest storage, producers can achieve substantial reductions in weight loss and shrinkage, thereby extending the shelf life of tomatoes. However, some inconsistencies in results may arise from factors such as the maturity stage of the fruits, their size, and varying environmental conditions. Therefore, to establish definitive recommendations for the use of chitosan, further research is necessary across different agroecological zones of Bangladesh.

Author Contributions

Conceptualization, project administration, funding acquisition, writing—review and editing: M.Z.H.; methodology: S.M.M.R.N.; validation, writing—original draft preparation, visualization: S.S., P.D. and R.C.D.; formal analysis, investigation: T.J.M. and L.A.S.; data curation, visualization: M.H.O.R. and Q.F.Q. All authors have read and agreed to the published version of the manuscript.

Funding

Funding for this project was provided by the University Grants Commission of Bangladesh, UGC Bhaban, Agargaon Administrative Area, Sher-e-Bangla Nagar, Dhaka-1207, Bangladesh, through Project No. Crop Science-23/2020–2021, dated 22 June 2023. Additionally, Project No. 2024/4/UGC by Order No. BAURES/1392/2023/EPM was issued by BAURES on 9 November 2023.

Institutional Review Board Statement

Not applicable.

Informed Consent Statement

Not applicable.

Data Availability Statement

All data are available on request.

Conflicts of Interest

The authors declare no conflicts of interest. The funders had no role in the design of the study; in the collection, analyses, or interpretation of data; in the writing of the manuscript; or in the decision to publish the results.

Abbreviations

The following abbreviations are used in this manuscript:
DAPSDays after postharvest storage
BAUBangladesh Agricultural University
gGram
LLiter
mLMilliliter
mgMilligram
µgMicrogram
CACitric acid
°CDegree centigrade
ppmParts per million
TATitratable acidity
RCBDRandomized Complete Block Design
NNormality
CaCl2Calcium chloride
NaOHSodium hydroxide
H2SO4Sulphuric acid

References

  1. FAOSTAT. Food and Agriculture Data; Food and Agriculture Organization of the United Nations: Rome, Italy, 2023; Available online: https://www.fao.org/faostat/en/#data/QCL (accessed on 30 July 2025).
  2. BBS. Yearbook of Agricultural Statistics-2022; Bangladesh Bureau of Statistics, Statistics and Informatics Division (SID), Ministry of Planning, Government of the People’s Republic of Bangladesh: Dhaka, Bangladesh, 2023. Available online: https://www.bbs.gov.bd (accessed on 20 April 2025).
  3. Hassan, M.K.; Chowdhury, B.L.D.; Akhter, N. Post-Harvest Loss Assessment: A Study to Formulate Policy for Loss Reduction of Fruits and Vegetables and Socioeconomic Uplift of the Stakeholders. In Final Report of USAID and EO Funded Project (Jointly Implemented by FAO and FPMO of MoFDM); FAO: Dhaka, Bangladesh, 2010; p. 189. Available online: https://xueshu.baidu.com/usercenter/paper/show?paperid=e19f18cf7099166eb73f9b16e52b4778&site=xueshu_se (accessed on 30 July 2025).
  4. Zhang, S.; Yu, Y.; Xiao, C.; Wang, X.; Tian, Y. Effect of carbon monoxide on browning of fresh-cut lotus root slice in relation to phenolic metabolism. LWT Food Sci. Technol. 2013, 53, 555–559. [Google Scholar] [CrossRef]
  5. Deepmala, K.; Hemantaranjan, A.; Singh, B. Chitosan as a promising natural compound to enhance potential physiological responses in plant: A review. Indian J. Plant Physiol. 2015, 20, 1–9. [Google Scholar] [CrossRef]
  6. Betchem, G.; Johnson, N.A.N.; Wang, Y. The application of chitosan in the control of post-harvest diseases: A review. J. Plant Dis. Prot. 2019, 126, 495–507. [Google Scholar] [CrossRef]
  7. Ait Barka, E.; Eullaffroy, P.; Clement, C.; Vernet, G. Chitosan improves development and protects Vitis vinifera L. against Botrytis cinerea. Plant Cell Rep. 2004, 22, 608–614. [Google Scholar] [CrossRef] [PubMed]
  8. Bautista-Baños, S.; Hernandez-Lauzardo, A.N.; Hernandez-Lopez, M.; Barka, E.A.; Velazquez-del Valle, M.G.; Bosquez-Molina, E.; Wilson, C.L. Chitosan as a potential natural compound to control pre and postharvest diseases of horticultural commodities. Crop Prot. 2006, 25, 108–118. [Google Scholar] [CrossRef]
  9. Bautista-Baños, S.; Sivakumar, D.; Bello-Pérez, A.; Villanueva-Arce, R.; Hernández-López, M. A review of the management alternatives for controlling fungi on papaya fruit during the postharvest supply chain. Crop Prot. 2013, 49, 8–20. [Google Scholar] [CrossRef]
  10. Olivas, G.I.; Barbosa-Canovas, G.V. Edible coatings for fresh-cut fruits. Crit. Rev. Food Sci. Nutr. 2005, 45, 657–670. [Google Scholar] [CrossRef]
  11. Zhang, H.; Li, R.; Liu, W. Effects of chitin and its derivative chitosan on postharvest decay of fruits: A review. Int. J. Mol. Sci. 2011, 12, 917–934. [Google Scholar] [CrossRef]
  12. Ban, Z.; Yan, J.; Wang, Y.; Zhang, J.; Yuan, Q.; Li, L. Effects of postharvest application of chitosan-based layer-by-layer assemblies on regulation of ribosomal and defense proteins in strawberry fruit (Fragaria × ananassa). Sci. Hortic. 2018, 240, 293–302. [Google Scholar] [CrossRef]
  13. Munhuweyi, K.; Lennox, C.L.; Meitz-Hopkins, J.C.; Caleb, O.J.; Sigge, G.O.; Opara, U.L. Investigating the effects of crab shell chitosan on fungal mycelial growth and postharvest quality attributes of pomegranate whole fruit and arils. Sci. Hortic. 2017, 220, 78–89. [Google Scholar] [CrossRef]
  14. Liu, J.; Tian, S.; Meng, X.; Yong, X. Effects of chitosan on control of postharvest diseases and physiological responses of tomato fruit. Postharvest Biol. Technol. 2007, 44, 300–306. [Google Scholar] [CrossRef]
  15. Parvin, M.A.; Zakir, H.M.; Sultana, N.; Kafi, A.; Seal, H.P. Effects of different application methods of chitosan on growth, yield and quality of tomato (Lycopersicon esculentum Mill.). Arch. Agric. Environ. Sci. 2019, 4, 261–267. [Google Scholar] [CrossRef]
  16. Sultana, N.; Zakir, H.M.; Parvin, M.A.; Sharmin, S.; Seal, H.P. Effect of chitosan coating on physiological responses and nutritional qualities of tomato fruits during postharvest storage. Asian J. Adv. Agric. Res. 2019, 10, 1–11. [Google Scholar] [CrossRef]
  17. Barker, A.V.; Pilbeam, D.J. Handbook of Plant Nutrition, 2nd ed.; Taylor & Francis Group: Boca Raton, FL, USA, 2015; p. 773. [Google Scholar]
  18. El-Badawy, H.E.M. Effect of chitosan and calcium chloride spraying on fruits quality of Florida Prince peach under cold storage. Res. J. Agric. Biol. Sci. 2012, 8, 272–281. [Google Scholar]
  19. Gayed, A.A.N.A.; Shaarawi, S.A.M.A.; Elkhishen, M.A.; Elsherbini, N.R.M. Pre-harvest application of calcium chloride and chitosan on fruit quality and storability of ‘Early Swelling’ peach during cold storage. Ciênc. Agrotec. 2017, 41, 220–231. [Google Scholar] [CrossRef]
  20. FRG. Fertilizer Recommendation Guide-2018; Bangladesh Agricultural Research Council (BARC): Dhaka, Bangladesh, 2018; p. 223. [Google Scholar]
  21. Sree, K.P.; Sree, M.S.; Supriya, P.; Samreen. Application of chitosan edible coating for preservation of tomato. Int. J. Chem. Stud. 2020, 8, 3281–3285. [Google Scholar] [CrossRef]
  22. Kibar, H.F.; Sabir, F.K. Chitosan coating for extending postharvest quality of tomatoes (Lycopersicon esculentum Mill.) maintained at different storage temperatures. AIMS Agric. Food 2018, 3, 97–108. [Google Scholar]
  23. Sadasivam, S.; Manickam, A. Biochemical Methods, 2nd ed.; New Age International (P) Limited: New Delhi, India, 1996. [Google Scholar]
  24. Erba, D.; Casiraghi, M.C.; Ribas, A.; Cáceres, R.; Marfà, O.; Castellari, M. Nutritional value of tomatoes (Solanum lycopersicum L.) grown in greenhouse by different agronomic techniques. J. Food Comp. Anal. 2013, 31, 245–251. [Google Scholar] [CrossRef]
  25. Story, E.N.; Kopec, R.E.; Schwartz, S.J.; Harris, G.K. An Update on the health effects of tomato lycopene. Ann. Rev. Food Sci. Technol. 2010, 1, 189–210. [Google Scholar] [CrossRef]
  26. Su, L.; Diretto, G.; Purgatto, E.; Danoun, S.; Zouine, M.; Li, Z.; Roustan, J.-P.; Bouzayen, M.; Giuliano, G.; Chervin, C. Carotenoid accumulation during tomato fruit ripening is modulated by the auxin-ethylene balance. BMC Plant Biol. 2015, 15, 114. [Google Scholar] [CrossRef]
  27. Zheng, J.; Chen, H.; Wang, T.; Mustafa, G.; Liu, L.; Wang, Q.; Shao, Z. Quality improvement of tomato fruits by preharvest application of chitosan oligosaccharide. Horticulturae 2023, 9, 300. [Google Scholar] [CrossRef]
  28. Mondal, M.M.A.; Puteh, A.B.; Dafader, N.C. Foliar application of chitosan improved morpho-physiological attributes and yield in summer tomato (Solanum lycopersicum). Pak. J. Agric. Sci. 2016, 53, 339–344. [Google Scholar] [CrossRef]
  29. Mondal, M.M.; Malek, M.A.; Puteh, A.B.; Ismail, M.R.; Ashrafuzzaman, M.; Naher, L. Effect of foliar application of chitosan on growth and yield in okra. Aust. J. Crop Sci. 2012, 6, 918–921. [Google Scholar]
  30. El Amerany, F.; Rhazi, M.; Balcke, G.; Wahbi, S.; Meddich, A.; Taourirte, M.; Hause, B. The Effect of chitosan on plant physiology, wound response, and fruit quality of tomato. Polymers 2022, 14, 5006. [Google Scholar] [CrossRef] [PubMed]
  31. Sultana, S.; Islam, M.; Khatun, M.A.; Hassain, M.A.; Huque, R. Effect of foliar application of oligo-chitosan on growth, yield and quality of tomato and eggplant. Asian J. Agric. Res. 2017, 11, 36–42. [Google Scholar] [CrossRef]
  32. Hassnain; Alam, M.; Ahmad, I.; Basit, A.; Ullah, I.; Alam, N.; Ullah, I.; Khalid, M.A.; Muhammad, B.; Shair, M. Efficacy of chitosan on performance of tomato (Lycopersicon esculentum L.) plant under water stress condition. Pak. J. Agric. Res. 2020, 33, 27–41. [Google Scholar] [CrossRef]
  33. Abdelaleem, H.M.; EL-Dkeshy, M.H.Z.; Abdalla, R.M. Preharvest spraying of calcium chloride, chitosan and their combination effects on tomato growth, yield, fruit characteristics, and quality. Assiut J. Agric. Sci. 2025, 56, 296–313. [Google Scholar] [CrossRef]
  34. Badawy, I.F.M.; Abou-Zaid, E.A.A.; Hussein, E.M.E. Cracking and fruit quality of “Manfalouty” pomegranate as affected by pre-harvest of chitosan, calcium chloride and gibberellic acid spraying. Middle East J. Agric. Res. 2019, 8, 873–882. [Google Scholar]
  35. Matteo, M.; Zoffoli, J.P.; Ayala, M. Calcium sprays and crop load reduction increase fruit quality and postharvest storage in sweet cherry (Prunus avium L). Agronomy 2022, 12, 829. [Google Scholar] [CrossRef]
  36. Vance, A.J.; Jones, P.; Strik, B.C. Foliar calcium applications do not improve quality or shelf life of strawberry, raspberry, blackberry, or blueberry fruit. Hort. Sci. 2017, 52, 382–387. [Google Scholar] [CrossRef]
  37. Mazumder, M.; Misran, A.; Ding, P.; Wahab, P. Preharvest foliar spray of calcium chloride on growth, yield, quality, and shelf life extension of different lowland tomato varieties in Malaysia. Horticulturae 2021, 7, 466. [Google Scholar] [CrossRef]
  38. Hernández, V.; Botella, M.Á.; Hellín, P.; Fenoll, J.; Flores, P. Dose-dependent potential of chitosan to increase yield or bioactive compound content in tomatoes. Horticulturae 2022, 8, 1152. [Google Scholar] [CrossRef]
  39. Tagele, A.; Woldetsadik, K.; Gedamu, F.; Rafi, M.M. Effects of preharvest applications of chemicals and storage conditions on the physico-chemical characteristics and shelf life of tomato (Solanum lycopersicum L.) fruit. Heliyon 2022, 8, e09494. [Google Scholar] [CrossRef] [PubMed]
  40. Santos, E.; Montanha, G.S.; Agostinho, L.F.; Polezi, S.; Marques, J.P.R.; de Carvalho, H.W.P. Foliar calcium absorption by tomato plants: Comparing the effects of calcium sources and adjuvant usage. Plants 2023, 12, 2587. [Google Scholar] [CrossRef] [PubMed]
  41. Shao, Z.; Chen, H.; Hu, S.; Liu, H.; Meng, F.; Li, S.; Wang, Q. Chitosan oligosaccharide treatment improves quality attributes of tomato fruit stored under room temperature. Postharvest Biol. Technol. 2022, 189, 111914. [Google Scholar] [CrossRef]
  42. ElSayed, A.I.; Mohamed, A.H.; Odero, D.C.; Gomaa, A.M. Biochemical effects of chitosan coating and hot water dipping on green bean decay during cold storage. J. Appl. Sci. 2019, 19, 101–108. [Google Scholar] [CrossRef]
  43. El-Mogy, M.M.; Parmar, A.; Ali, M.R.; Abdel-Aziz, M.E.; Abdeldaym, E.A. Improving postharvest storage of fresh artichoke bottoms by an edible coating of Cordia myxa gum. Postharvest Biol. Technol. 2020, 163, 111143. [Google Scholar] [CrossRef]
  44. Saha, S.; Zakir, H.M.; Mallick, S.; Alam, M.S.; Quadir, Q.F. Impact of chitosan coatings on shelf-life, nutrient elements and biochemical qualities of country beans (Phaseolus lunatus L.) at postharvest storage. J. Hort. Postharvest Res. 2024, 7, 1–14. [Google Scholar] [CrossRef]
  45. Duan, C.; Meng, X.; Meng, J.; Khan, M.I.H.; Dai, L.; Khan, A.; An, X.; Zhang, J.; Huq, T.; Ni, Y. Chitosan as a preservative for fruits and vegetables: A review on chemistry and antimicrobial properties. J. Bioresour. Bioprod. 2019, 4, 11–21. [Google Scholar] [CrossRef]
  46. Dai, L.; Wang, X.; Zhang, J.; Li, C. Application of chitosan and its derivatives in postharvest coating preservation of fruits. Foods 2025, 14, 1318. [Google Scholar] [CrossRef]
  47. Singh, H.; Bhasin, J.K.; Dash, K.K.; Shams, R.; Shaikh, A.K.; Béla, K. Effect of chitosan based edible coating in management of postharvest losses in Papaya: A comprehensive review. Appl. Food Res. 2024, 4, 100456. [Google Scholar] [CrossRef]
  48. Nair, M.S.; Tomar, M.; Punia, S.; Kukula-Koch, W.; Kumar, M. Enhancing the functionality of chitosan- and alginate-based active edible coatings/films for the preservation of fruits and vegetables: A review. Int. J. Biol. Macromol. 2020, 164, 304–320. [Google Scholar] [CrossRef] [PubMed]
  49. Zhang, D.; Quantick, P.C. Antifungal effects of chitosan coating on fresh strawberries and raspberries during storage. J. Hort. Sci. Biotechnol. 1998, 73, 763–767. [Google Scholar] [CrossRef]
  50. El Ghaouth, A.; Ponnampalam, R.; Boulet, M. Chitosan coating effect on storability and quality of fresh strawberries. J. Food Sci. 1991, 56, 1618–1621. [Google Scholar] [CrossRef]
  51. Meng, X.; Li, B.; Liu, J.; Tian, S. Pysiological responses and quality attributes of table grape fruit to chitosan preharvest spray and postharvest coating during storage. Food Chem. 2008, 106, 501–508. [Google Scholar] [CrossRef]
  52. Das, D.K.; Dutta, H.; Mahanta, C.L. Development of a rice starch-based coating with antioxidant and microbe-barrier properties and study of its effect on tomatoes stored at room temperature. LWT Food Sci. Technol. 2013, 50, 272–278. [Google Scholar] [CrossRef]
  53. Oz, A.T.; Ulukanli, Z. Application of edible starch-based coating including glycerol plus oleum nigella on arils from long-stored whole pomegranate fruits. J. Food Process. Preserv. 2012, 36, 81–95. [Google Scholar] [CrossRef]
  54. Bico, S.L.S.; Raposo, M.F.J.; Morais, R.M.S.C.; Morais, A.M.M.B. Combined effects of chemical dip and/or carrageenan coating and/or controlled atmosphere on quality of fresh cut banana. Food Control 2009, 20, 508–514. [Google Scholar] [CrossRef]
  55. Khan, W.M.; Prithiviraj, B.; Smith, D.L. Effect of foliar application of chitin and chitosan oligosaccharides on photosynthesis of maize and soybean. Photosynthetica 2002, 40, 621–624. [Google Scholar] [CrossRef]
  56. Abd El-Gawad, H.G.; Bondok, A.M. Response of tomato plants to salicylic acid and chitosan under infection with tomato mosaic virus. Am. Eurasian J. Agric. Environ. Sci. 2015, 15, 1520–1529. [Google Scholar]
  57. Guan, Y.J.; Hu, J.; Wang, X.J.; Shao, C.X. Seed priming with chitosan improves maize germination and seedling growth in relation to physiological changes under low temperature stress. J. Zhejiang Univ. Sci. B 2009, 10, 427–433. [Google Scholar] [CrossRef] [PubMed]
  58. Hossain, M.A.; Gottschalk, K. Effect of moisture content, storage temperature and storage period on colour, ascorbic acid, lycopene and total flavonoids of dried tomato halves. Int. J. Food Sci. Technol. 2009, 44, 1245–1253. [Google Scholar] [CrossRef]
  59. Javanmardi, J.; Kubota, C. Variation of lycopene, antioxidant activity, total soluble solids and weight loss of tomato during postharvest storage. Postharvest Biol. Technol. 2006, 41, 151–155. [Google Scholar] [CrossRef]
  60. Ali, A.; Muhammad, M.T.M.; Sijam, K.; Siddiqui, Y. Effect of chitosan coatings on the physicochemical characteristics of Eksotika II papaya (Carica papaya L.) fruit during cold storage. Food Chem. 2011, 124, 620–626. [Google Scholar] [CrossRef]
  61. Silva, G.M.C.; Silva, W.B.; Medeiros, D.B.; Salvador, A.R.; Cordeiro, M.H.M.; da Silva, N.M.; Santana, D.B.; Mizobutsi, G.P. The chitosan affects severely the carbon metabolism in mango (Mangifera indica L. cv. Palmer) fruit during storage. Food Chem. 2017, 237, 372–378. [Google Scholar] [CrossRef]
  62. Czékus, Z.; Iqbal, N.; Pollák, B.; Martics, A.; Ördög, A.; Poór, P. Role of ethylene and light in chitosan-induced local and systemic defence responses of tomato plants. J. Plant Physiol. 2021, 263, 153461. [Google Scholar] [CrossRef]
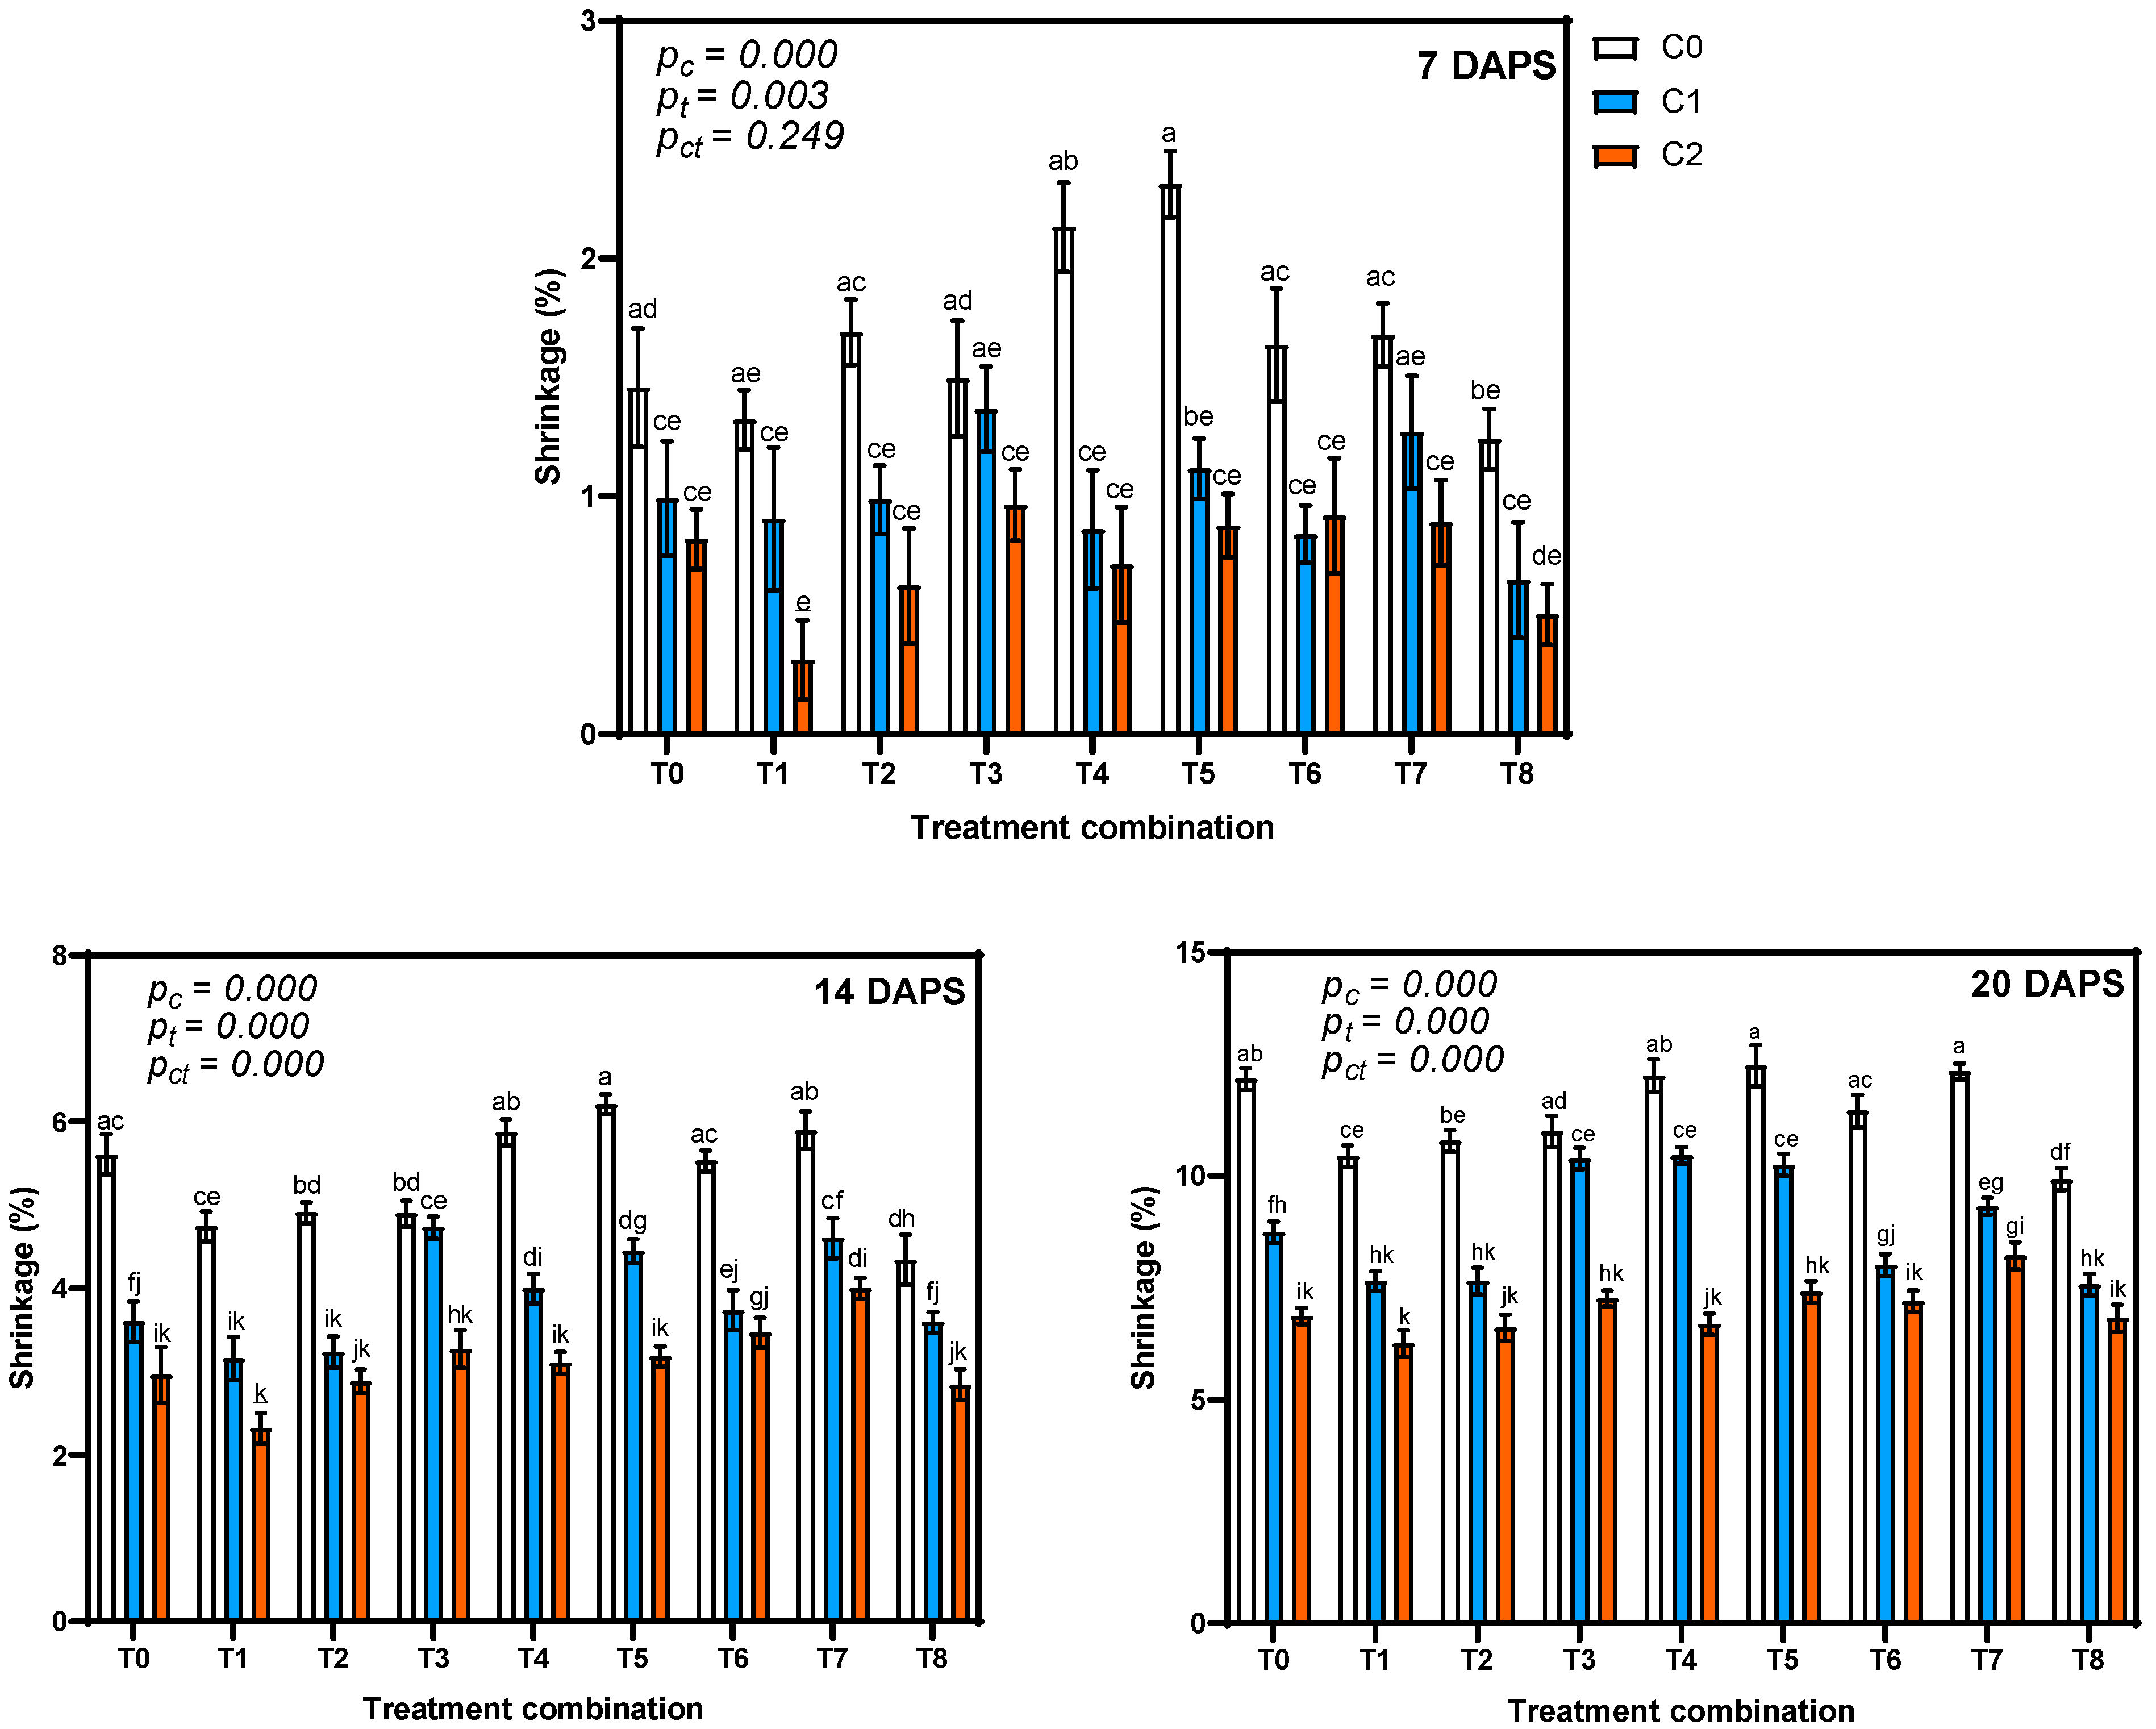
Figure 1. Effects of different preharvest and postharvest treatments on shrinkage of tomato fruits at various days after postharvest storage (DAPS). The shrinkage value of fresh-harvested fruits was considered 0%. Shrinkage values are presented as mean ± standard error (n = 3). The preharvest treatments included: control (T0), 50 ppm chitosan (T1), 80 ppm chitosan (T2), 0.50% Ca solution (T3), 1.0% Ca solution (T4), and their combinations—T1 with T3 (T5), T2 with T3 (T6), T1 with T4 (T7), and T2 with T4 (T8). The postharvest treatments consisted of: control (C0), 0.10% chitosan (C1), and 0.20% chitosan (C2). Different letters above the bars indicate statistically significant differences at p < 0.05, based on Tukey’s Honestly Significant Difference (HSD) Test. Significance values for the main effects and their interaction are denoted as pt (preharvest treatment), pc (postharvest treatment) and ptc (interaction), respectively.
Agrochemicals 04 00013 g001
Figure 2. Effects of different preharvest and postharvest treatments on visual quality of tomato fruits at various days after postharvest storage (DAPS). Red dashed line (Score value ≥ 5.0) denotes marketable fruits. Visual quality scores are presented as mean ± standard error (n = 3). The preharvest treatments included: control (T0), 50 ppm chitosan (T1), 80 ppm chitosan (T2), 0.50% Ca solution (T3), 1.0% Ca solution (T4), and their combinations—T1 with T3 (T5), T2 with T3 (T6), T1 with T4 (T7), and T2 with T4 (T8). The postharvest treatments consisted of: control (C0), 0.10% chitosan (C1), and 0.20% chitosan (C2). Different letters above the bars indicate statistically significant differences at p < 0.05, based on Tukey’s Honestly Significant Difference (HSD) Test. Significance values for the main effects and their interaction are denoted as pt (preharvest treatment), pc (postharvest treatment) and ptc (interaction), respectively.
Agrochemicals 04 00013 g002
Figure 3. Effects of different preharvest and postharvest treatments on titratable acidity (TA) of tomato fruits at various days after postharvest storage (DAPS). TA values are presented as % mean ± standard error (n = 3) values compared to the fresh harvested TA value (0.76%). The preharvest treatments included: control (T0), 50 ppm chitosan (T1), 80 ppm chitosan (T2), 0.50% Ca solution (T3), 1.0% Ca solution (T4), and their combinations—T1 with T3 (T5), T2 with T3 (T6), T1 with T4 (T7), and T2 with T4 (T8). The postharvest treatments consisted of: control (C0), 0.10% chitosan (C1), and 0.20% chitosan (C2). Different letters above the bars indicate statistically significant differences at p < 0.05, based on Tukey’s Honestly Significant Difference (HSD) Test. Significance values for the main effects and their interaction are denoted as pt (preharvest treatment), pc (postharvest treatment) and ptc (interaction), respectively.
Agrochemicals 04 00013 g003
Figure 4. Effects of different preharvest and postharvest treatments on vitamin C content of tomato fruits at various days after postharvest storage (DAPS). Vitamin C contents are presented as % mean ± standard error (n = 3) of fresh-harvested mean value of 28.1 mg / 100g fresh weight. The preharvest treatments included: control (T0), 50 ppm chitosan (T1), 80 ppm chitosan (T2), 0.50% Ca solution (T3), 1.0% Ca solution (T4), and their combinations—T1 with T3 (T5), T2 with T3 (T6), T1 with T4 (T7), and T2 with T4 (T8). The postharvest treatments consisted of: control (C0), 0.10% chitosan (C1), and 0.20% chitosan (C2). Significance values for the main effects and their interaction are denoted as pt (preharvest treatment), pc (postharvest treatment) and ptc (interaction), respectively.
Agrochemicals 04 00013 g004
Figure 5. Effects of different preharvest and postharvest treatments on lycopene content of tomato fruits at various days after postharvest storage (DAPS). Lycopene contents are presented as % mean ± standard error (n = 3) of the fresh-harvested mean value of 3.3 mg / 100g fresh weight. The preharvest treatments included: control (T0), 50 ppm chitosan (T1), 80 ppm chitosan (T2), 0.50% Ca solution (T3), 1.0% Ca solution (T4), and their combinations—T1 with T3 (T5), T2 with T3 (T6), T1 with T4 (T7), and T2 with T4 (T8). The postharvest treatments consisted of: control (C0), 0.10% chitosan (C1), and 0.20% chitosan (C2). Different letters above the bars indicate statistically significant differences at p < 0.05, based on Tukey’s Honestly Significant Difference (HSD) Test. Significance values for the main effects and their interaction are denoted as pt (preharvest treatment), pc (postharvest treatment) and ptc (interaction), respectively.
Agrochemicals 04 00013 g005
Figure 6. Effects of different preharvest and postharvest treatments on total sugar content of tomato fruits at various days after postharvest storage (DAPS). Total sugar contents of fruits are presented as % mean ± standard error (n = 3) compared to the fresh-harvested value of 1.3%. The preharvest treatments included: control (T0), 50 ppm chitosan (T1), 80 ppm chitosan (T2), 0.50% Ca solution (T3), 1.0% Ca solution (T4), and their combinations—T1 with T3 (T5), T2 with T3 (T6), T1 with T4 (T7), and T2 with T4 (T8). The postharvest treatments consisted of: control (C0), 0.10% chitosan (C1), and 0.20% chitosan (C2). Significance values for the main effects and their interaction are denoted as pt (preharvest treatment), pc (postharvest treatment) and ptc (interaction), respectively.
Agrochemicals 04 00013 g006
Figure 7. Correlations between the pairs of quality traits of tomato fruits analyzed at different days after postharvest storage (DAPS).
Agrochemicals 04 00013 g007
Table 1. Effect of foliar application of chitosan and Ca on yield attributes, yield, and major biochemical qualities (titratable acidity, vitamin C, lycopene, and total sugar) of tomatoes (estimated data are presented as mean ± SE).
TreatmentFruit Length (cm)Fruit Diameter (cm)Number of Fruits/PlantSingle Fruit wt. (g)Yield
(tons/Hectare)
Titratable Acidity (%)Vitamin C (mg/100 g Fresh wt.)Lycopene (mg/100 g Fresh wt.)Total Sugar (%)
Control (T0)4.1 ± 0.92 b3.3 ± 1.412.4 ± 2.1 c34.5 ± 3.1 c33.1 ± 2.2 d0.76 ± 0.1229.1 ± 1.33.2 ± 0.551.3 ± 0.42
50 ppm chitosan (T1)4.6 ± 1.2 a3.6 ± 1.314.8 ± 2.4 ab36.7 ± 3.3 ab42.0 ± 1.8 c0.74 ± 0.1127.5 ± 2.13.0 ± 0.241.2 ± 0.23
80 ppm chitosan (T2)4.6 ± 1.1 a3.6 ± 1.316.8 ± 2.2 a38.9 ± 2.4 a46.5 ± 2.0 a0.74 ± 0.1328.1 ± 1.93.1 ± 0.931.2 ± 0.11
0.50% Ca solution (T3)4.3 ± 0.75 b3.6 ± 1.213.0 ± 1.9 bc33.4 ± 2.8 c33.3 ± 1.1 d0.76 ± 0.1029.3 ± 0.523.6 ± 0.421.5 ± 0.15
1.0% Ca solution (T4)4.1 ± 0.72 b3.4 ± 1.112.3 ± 2.0 c34.8 ± 2.3 bc34.5 ± 1.2 d0.77 ± 0.1029.2 ± 1.43.4 ± 0.881.3 ± 0.31
Combined T1 and T3 (T5)4.4 ± 1.1 ab3.5 ± 1.315.0 ± 2.3 ab34.6 ± 3.1 bc41.7 ± 1.6 c0.77 ± 0.1128.6 ± 2.53.4 ± 1.31.3 ± 0.22
Combined T2 and T3 (T6)4.5 ± 0.78 a3.6 ± 1.215.3 ± 2.2 ab37.0 ± 2.9 ab44.6 ± 1.4 abc0.74 ± 0.1327.1 ± 0.653.4 ± 0.651.2 ± 0.10
Combined T1 and T4 (T7)4.3 ± 1.1 b3.5 ± 1.114.5 ± 2.0 ab37.3 ± 2.6 a43.3 ± 2.0 c0.76 ± 0.1127.0 ± 0.443.2 ± 0.221.4 ± 0.32
Combined T2 and T4 (T8)4.6 ± 0.94 a3.6 ± 1.316.4 ± 2.1 a38.6 ± 3.2 a45.0 ± 1.9 ab0.75 ± 0.1126.9 ± 2.23.2 ± 0.851.4 ± 0.28
CV (%)4.63.111.35.413.21.643.66.58.6
Level of Significance*NS***NSNSNSNS
Different letters in the columns indicate significant differences according to Duncan’s multiple range test (p ≤ 0.05). * = significant at 5% level of probability; SE = standard error; wt. = Weight; CV = coefficient of variation; NS = not significant.
Disclaimer/Publisher’s Note: The statements, opinions and data contained in all publications are solely those of the individual author(s) and contributor(s) and not of MDPI and/or the editor(s). MDPI and/or the editor(s) disclaim responsibility for any injury to people or property resulting from any ideas, methods, instructions or products referred to in the content.