Article

Front Load Carriage Has Sex-Specific and Perhaps Occupational Risk Implications for Cardiovascular Health


1
The HEART Laboratory, Department of Kinesiology, California State University San Marcos, San Marcos, CA 92096, USA
2
Department of Kinesiology, Rice University, Houston, TX 77005, USA
*
Author to whom correspondence should be addressed.
J. Vasc. Dis. 2026, 5(2), 14; https://doi.org/10.3390/jvd5020014
Submission received: 13 February 2026 / Revised: 1 March 2026 / Accepted: 10 March 2026 / Published: 12 March 2026
(This article belongs to the Section Cardiovascular Diseases)

Abstract

Background: Load carriage is an essential part of the occupational work of many jobs, yet there is little research on the hemodynamic responses to load carriage. It is known that front load carriage elicits larger increases in arterial stiffness than load carried on the side of the body. However, the hemodynamic forward and reflected pulse wave responses to load carriage are unknown and could relate to cardiac risk. Methods: We compared responses to 30 s front load carriage between 45 females and 23 males, with pre- and post-carry hemodynamics assessed using pulse wave analysis. Results: We found increases (p < 0.001) in arterial stiffness (24.8% females; 32.4% males), forward pulse wave (5.8 mmHg females; 5.7 mmHg males), and reflected pulse wave (6.8 mmHg females; 9.9 mmHg males). Pre- and post-carriage forward and reflected pulse waves were lower in females (p < 0.05). Compared to males, females overall had more relationships between the change in vascular measurements and other variables. We found an inverse relationship between changes in myocardial supply–demand (SEVR) and changes in forward pulse wave in females (r = −0.37, p < 0.001) but not males. Also, a direct relationship between changes in SEVR and changes in aortic DBP (r = 0.30, p = 0.04) and changes in resting DBP (r = 0.35, p = 0.02) existed in females. Conclusions: The data suggest that sex-related differences in hemodynamic responses exist. Females may experience a larger drop in estimated myocardial supply–demand balance accompanied by lower diastolic filling. Employers should be aware of these inherent cardiac risks with load carriage in their female employees.

1. Introduction

Cardiovascular disease (CVD) is a major global health issue that is the leading cause of death [1]. Occupational stress and heavy work are associated with increased CVD and an increased risk of heart attack [2]. Often, the heaviest loads are carried by first responders and military personnel, but many labor jobs do require employees to pick up and carry heavy items as routine work. The physiological effects of load carriage in terms of respiratory system restriction, biomechanical changes, and muscular impingement have been explained, but vascular responses to load are not established under different conditions [3]. Central blood pressure (BP) provides a measure of BP in the aorta and is a predictor of cardiovascular health and overall risk of CVD [4]. It is known that better cardiovascular health is related to lower central BP and lower levels of arterial stiffness [5].
Very limited research exists measuring vascular health in relation to load carriage, and to the best of our knowledge there are no studies that examine hemodynamic pulse wave responses to front load carriage. Pulse wave velocity (PWV) and pulse wave analysis (PWA) are non-invasive, established, and validated measures of blood pressure, stiffness, and overall vascular health [6]. PWA evaluates and provides measurements of central BP, the subendocardial viability ratio (SEVR), and the augmentation index normalized to heart rate of 75 bpm (AIx@75) to provide a complete picture of how much stress the heart is under and how hard it is working [7]. SEVR is an estimation of oxygenation in the heart related with cardiac workload and serves as an indicator of blood flow in the coronary arteries [8]. AIx@75 is a marker of arterial stiffness [7], and higher levels of central BP and vascular stiffness have been shown to be correlated with CVD and organ damage [9]. With PWA, pulse waves, forward blood flow, and the reflected blood flow are all assessed to capture the full hemodynamic response [6].
Occupational research has quantified the increase in brachial BP during walking and found that this increase is 15–23 mmHg greater in firefighters wearing personal protective equipment than in firefighters wearing regular gym clothes [10]. From an occupational perspective, the weight of gear worn for tactical employees is a concern. Employees in military, firefighting, law enforcement, and rescue occupations are burdened by load carriage as part of the job. External loads are carried in backpack or ruk packs. But, more often and in more occupations, heavy loads are carried in the arms out in front of the body. It has previously been shown that front load carriage (Zercher-style) leads to greater increases in arterial stiffness than load carried on the side of the body (farmers handle-style) [11]. However, the physiological mechanisms related to this increased stiffness need to be examined. The changes in forward and reflected pulse waves that occur during front load carriage are not known and could relate to cardiac risk.
Non-invasive measures of arterial stiffness (AIx@75) can be used to predict hemodynamic risk of CVD, but how load carriage affects the measure of wave reflection, augmented return flow, and changes in forward flow of blood from the heart need to be explored. To the best of our knowledge, no study has examined the vascular response to front load carriage, so the purpose of this study was to compare the responses to front load carriage between males and females. Given the sex-differences that exist in cardiovascular physiology, body size, and body compositions, we hypothesized that males would have larger increases in pulse flows but smaller increases in stiffness with load carriage.

2. Methods

Female and male adult non-smokers with no history of prior heart attack, stroke, or heart surgery were recruited to participate by advertisement and word of mouth. The study was originally designed to examine anxiety in relation to load carriage responses but the anxiety information is not reported here. Some unpublished participant data from another study are also included in this analysis. We ensured that there is no overlap in the use of data to answer research questions. The study protocol was approved by the Institutional Review Board of California State University San Marcos (2186411-1 5/03/2024 and 2012386-2 3/13/2023), and all procedures were in accordance with the ethical standards of the Helsinki Declaration. All participants provided signed consent and completed a health survey where they reported health history, provided a subjective health rating, and quantified their weekly exercise amount.

2.1. Experimental Protocol

Height (cm) and weight (kg) were measured using a stadiometer and scale (Seca 777, Mount Pleasant, SC, USA). Body mass index (BMI, kg⋅m−2) was calculated. Seated systolic BP (SBP) and diastolic BP (DBP) were measured according to BP guidelines [12]. Vascular measurements were collected after a 20 min period of supine rest as previously described using the Sphygmocor XCEL system (SphygmoCor XCEL, AtCor Medical, Sydney, Australia) [13]. We documented measures of central BP, AIx@75, SEVR, forward pulse, and reflected pulse. Data from the pulse waveforms were assessed by the software’s internal quality control index (operator index > 80%). The average of three measures is reported. In our laboratory, we calculated the intraclass correlation coefficient for pulse wave measurements at >0.962.
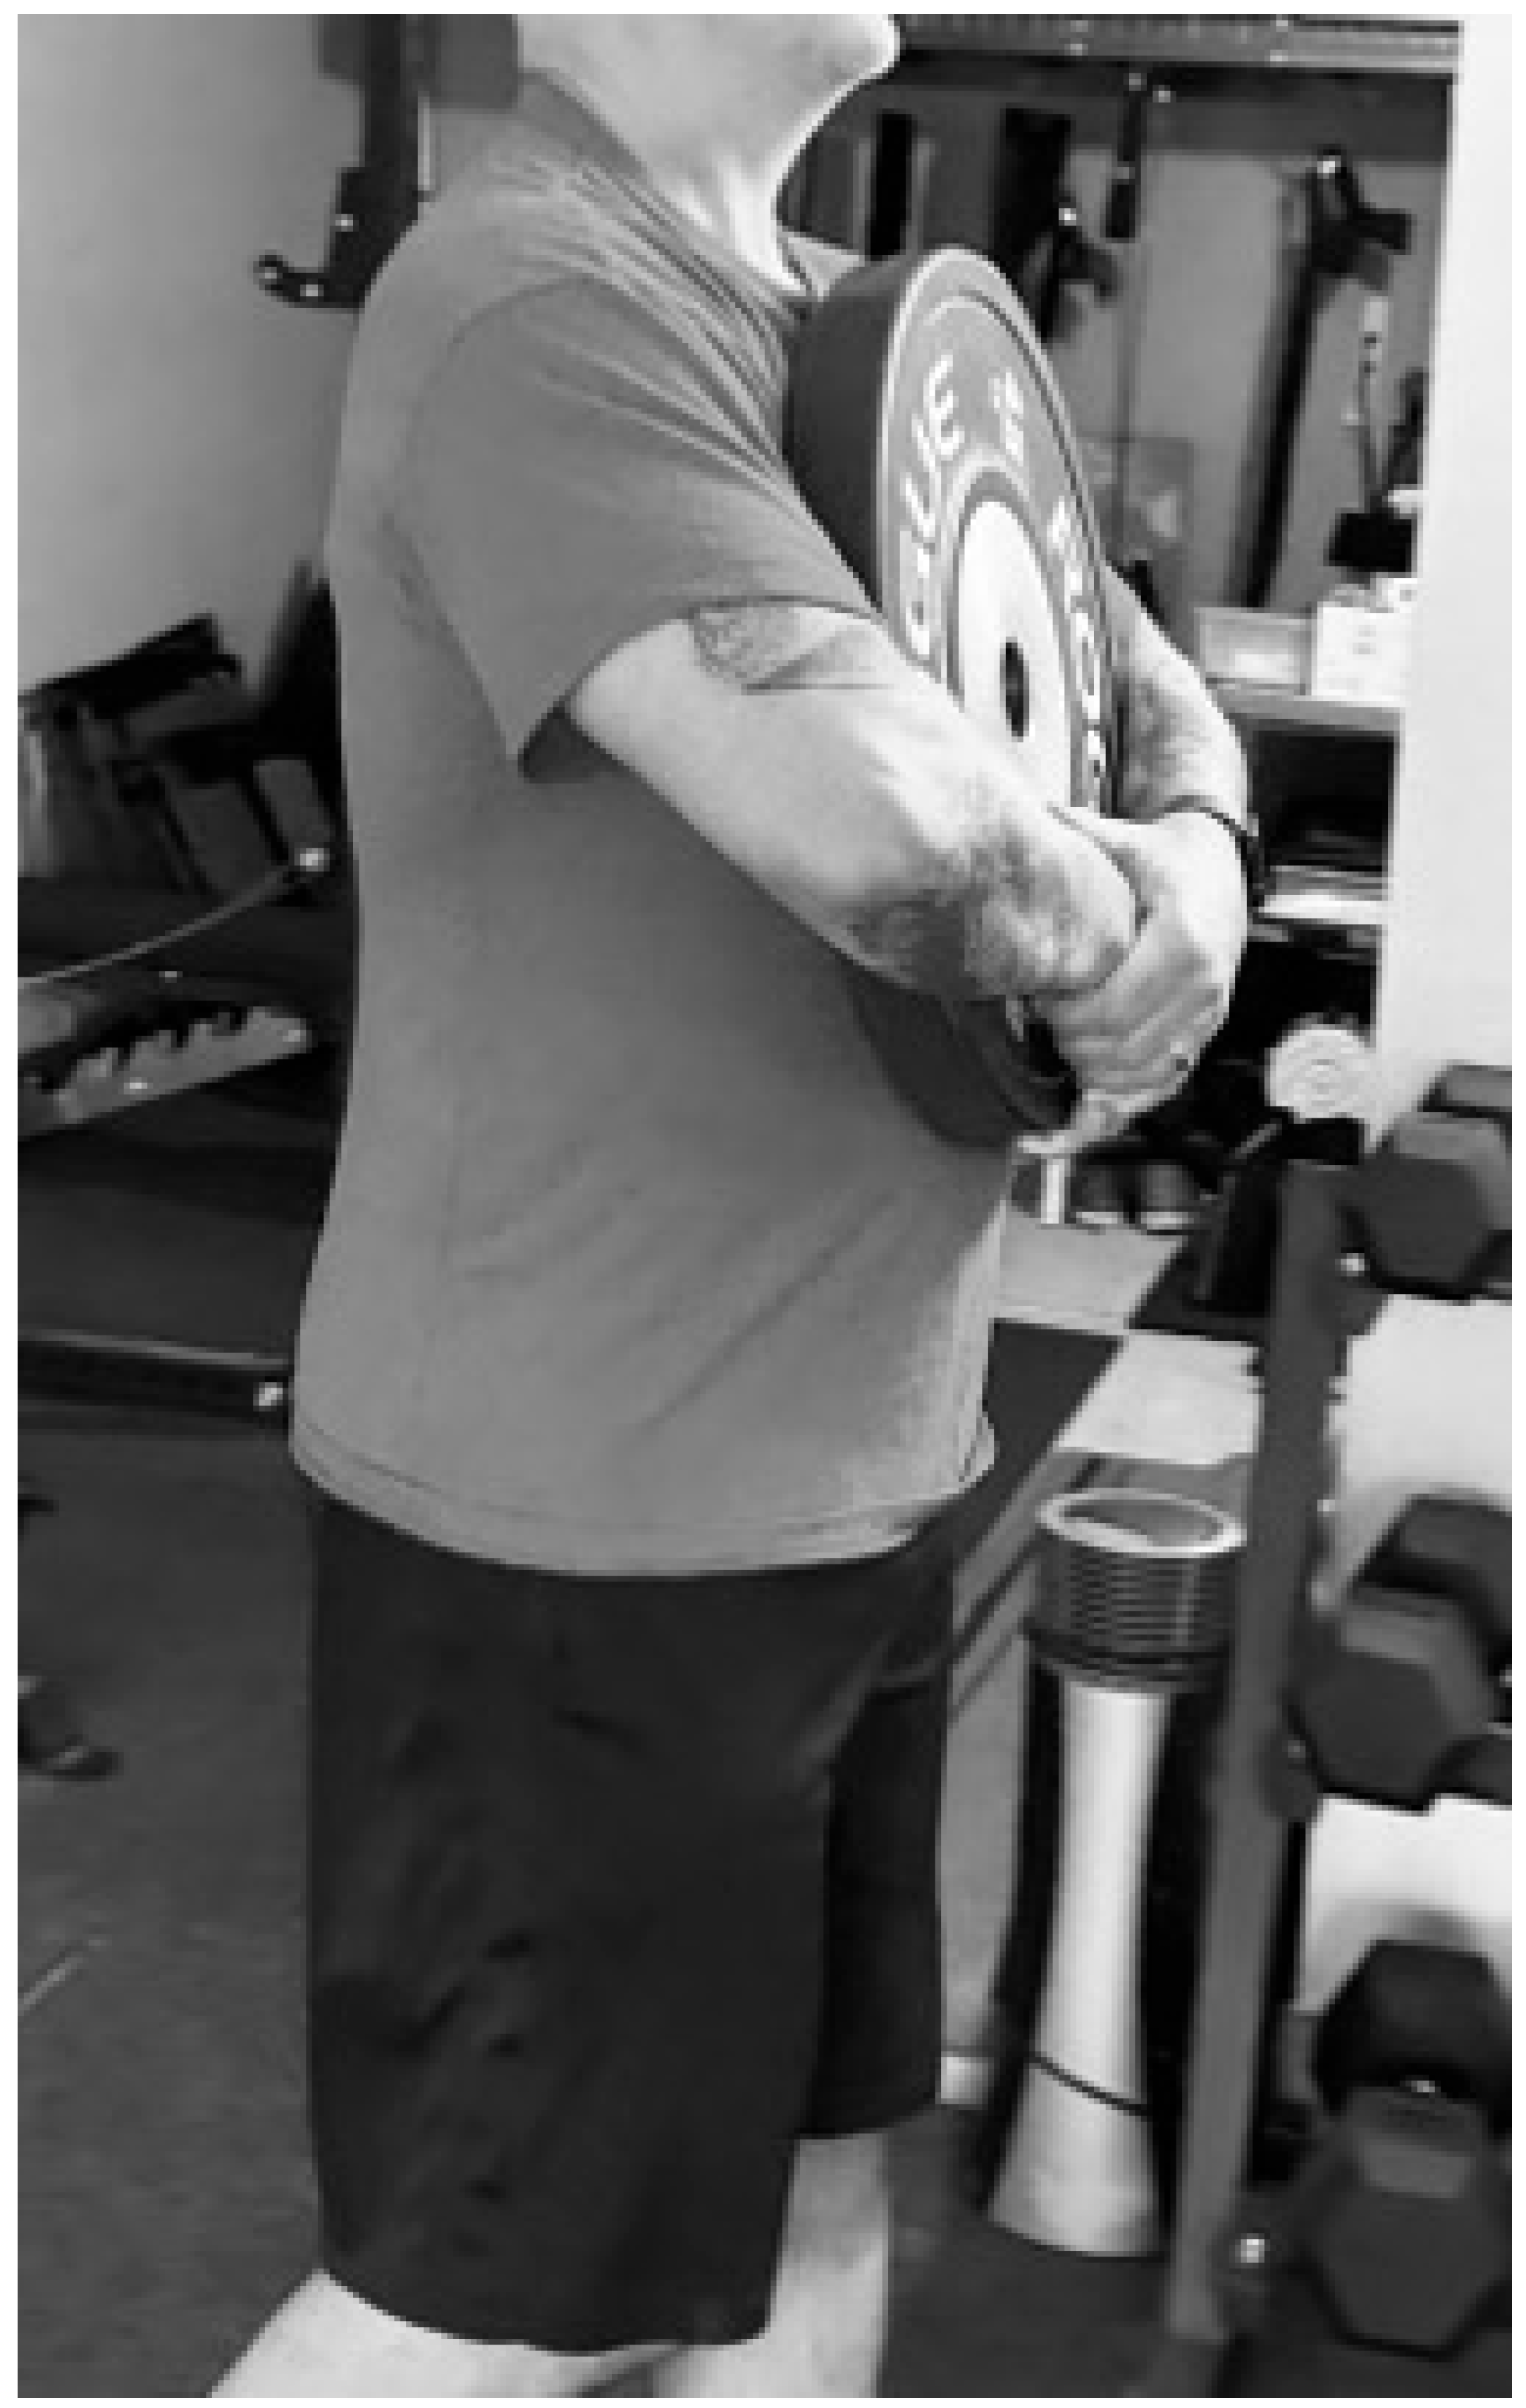
Upon completion of their PWA, participants picked up a standardized amount of weight for the load carriage. The amount of load was calculated as a percentage of their body weight based on how many times per week they reported resistance training. Participants who reported resistance training 0–3 times per week carried 30% of their body weight, and those who reported resistance training more than 3 times per week carried 40% of their body weight. These load percentages have been proven to elicit an increase in BP and vascular stiffness in previous research [11]. Also, we adapted the relative load percentage based on resistance training frequency in an attempt to control for training effects and we realize that this may lead to differences in the amount of load carried. Therefore, future studies could measure the effects of absolute load instead of relative load amounts. Participants were instructed to stand upright with shoulders back and carry the weight in their arms held out in front of them, as shown in Figure 1. We rounded the load to the nearest pound. Calibrated professional Olympic weight plates (Rogue Fitness, Columbus, OH, USA) were used. All participants walked at a self-controlled pace indoors for a total of 30 s. After the walk, the load was set down. The average time from the start of the walk until the participant was supine for post-carriage measurement was 30.34 s. Immediately, a post-exercise PWA measurement was collected.

2.2. Statistical Analysis

Differences between pre- and post-load carriage values were compared using the paired sample t-test. The change in both systolic and diastolic BP from pre- to post-carry was calculated. Effect size was examined using Cohen’s d (small effect ~0.2, medium effect ~0.5, large effect ~0.8). Relationships between the change in vascular health measures and BP responses were examined with correlations (Spearman’s, two-tailed). To correct for multiple comparisons within each sex group, Benjamini–Hochberg false discovery rate (FDR) correction was applied across the 14 analyzed correlation pairs. Repeated measures analysis of variance was used to evaluate time (levels: pre- and post-carriage) and carriage by group (levels: female and male) interactions, and within-group Tukey’s post hoc analysis was performed. Considering the difference in load amount, ANCOVA was used to compare female and male responses to load carriage while controlling for the amount of load.
A power analysis was conducted using GPower 3.1 (Germany). Tagawa et al. (2018) reported a change in arterial stiffness in relation to a change in SEVR in response to resistance training [14]. Using the correlation effect reported by Tagawa, a power analysis was conducted with a correlation effect size 0.42, α = 0.05, and a power of 0.95. The sample size was determined at 67 adults.
Data were analyzed using SPSS 29.0.2 (SPSS Inc., Chicago, IL, USA). The results are expressed as the mean ± SD. Significance was determined using an alpha level of p < 0.05.

3. Results

Eighty-two adults were recruited and enrolled during the data collection period, but fifteen did not complete the study, so we present data on sixty-eight adults (45 F, 23 M). Table 1 provides a breakdown of the physiological characteristics for the entire group and by sex. The groups were similar in age and subjective health score (scale 1–10). Females had a lower BMI (23.8 vs. 25.6 kg∙m−2 in males), exercised less per week (4.4 vs. 6 times per week in males), did less resistance training (2.1 vs. 2.9 times per week in males), and had lower SBP (116.4 vs. 126.5 mmHg in males) measured in the clinical visit (p < 0.05 for all).
Table 2 reports the blood pressure responses to front load carriage. Resting supine SBP (120.0 vs. 133.4 mmHg, p = 0.001) and central SBP (103.8 vs. 112.6 mmHg, p = 0.01) were lower in females compared to males. Front load carriage caused a significant increase in peripheral (5.8% in females, p < 0.001; 5.5% in males, p = 0.01) and central SBP (10.5% in females, p < 0.001; 13.8% in males, p < 0.001) in both females and males, with a larger increase measured in males (p = 0.03). There was no change in DBP with load carriage within or between the groups.
The vascular responses to front load carriage are reported in Table 3. There were increases in both groups in AIx@75 (24.8% in females, p < 0.001; 32.4% in males, p < 0.001), forward pulse wave (5.8 mmHg in females, p < 0.001; 5.7 mmHg in males, p < 0.001), reflected pulse wave (6.8 mmHg in females, p < 0.001; 9.9 mmHg in males, p < 0.001), and reflection magnitude (12.2% in females, p < 0.001; 17.8% in males, p < 0.001) with the carry. Both pre- and post-carriage forward and reflected pulse waves were significantly lower in females than in males (p < 0.01 for all). The change in forward pulse wave was similar among groups, but the change in reflected pulse wave amplitude was smaller in females than in males (51.5% vs. 61.4%, p = 0.02). Females overall carried a smaller load, so considering the difference in load amount (19.4 kg for females vs. 27.7 kg for males, Table 1), ANCOVA was conducted to examine sex differences while controlling for load amount. After controlling for load carried, there was no significant difference between groups in the change in reflected pulse wave amplitude (F(1, 65) = 0.71, p = 0.404, partial η2 = 0.011). The amount of load carried did not reach statistical significance as a covariate (F(1, 65) = 3.58, p = 0.063, partial η2 = 0.052), but the overall model was significant (F(2, 65) = 4.98, p = 0.010), accounting for 13.3% of the variance in the change in reflected pulse wave (R2 = 0.133, adjusted R2 = 0.106). This suggests that the difference between groups in the amount of change in reflected pulse wave amplitude (Table 3) was different due to load amount carried and not due to female–male physiology.
Table 4 presents bivariate correlation analysis, stratified by sex, of the change in vascular measurements with load carriage. Both uncorrected and Benjamini–Hochberg FDR-corrected p-values are reported. We conducted post hoc power analysis using GPower 3.1 and calculated that with n = 23 males, α = 0.05, and 80% power, the minimum detectable effect size was r = 0.52. Our observed correlations for changes in SEVR with changes in heart rate and for changes in AIx@75 with changes in reflected pulse wave were the only two that fell within the detectable range, but only one of these remained significant after correction. We do recognize that the subgroup analysis remains underpowered for smaller effects in the male group. Therefore, the sex-stratified analyses for males should be considered exploratory. This is the first report of such analysis, so the findings should be replicated in larger and more adequately powered cohorts.
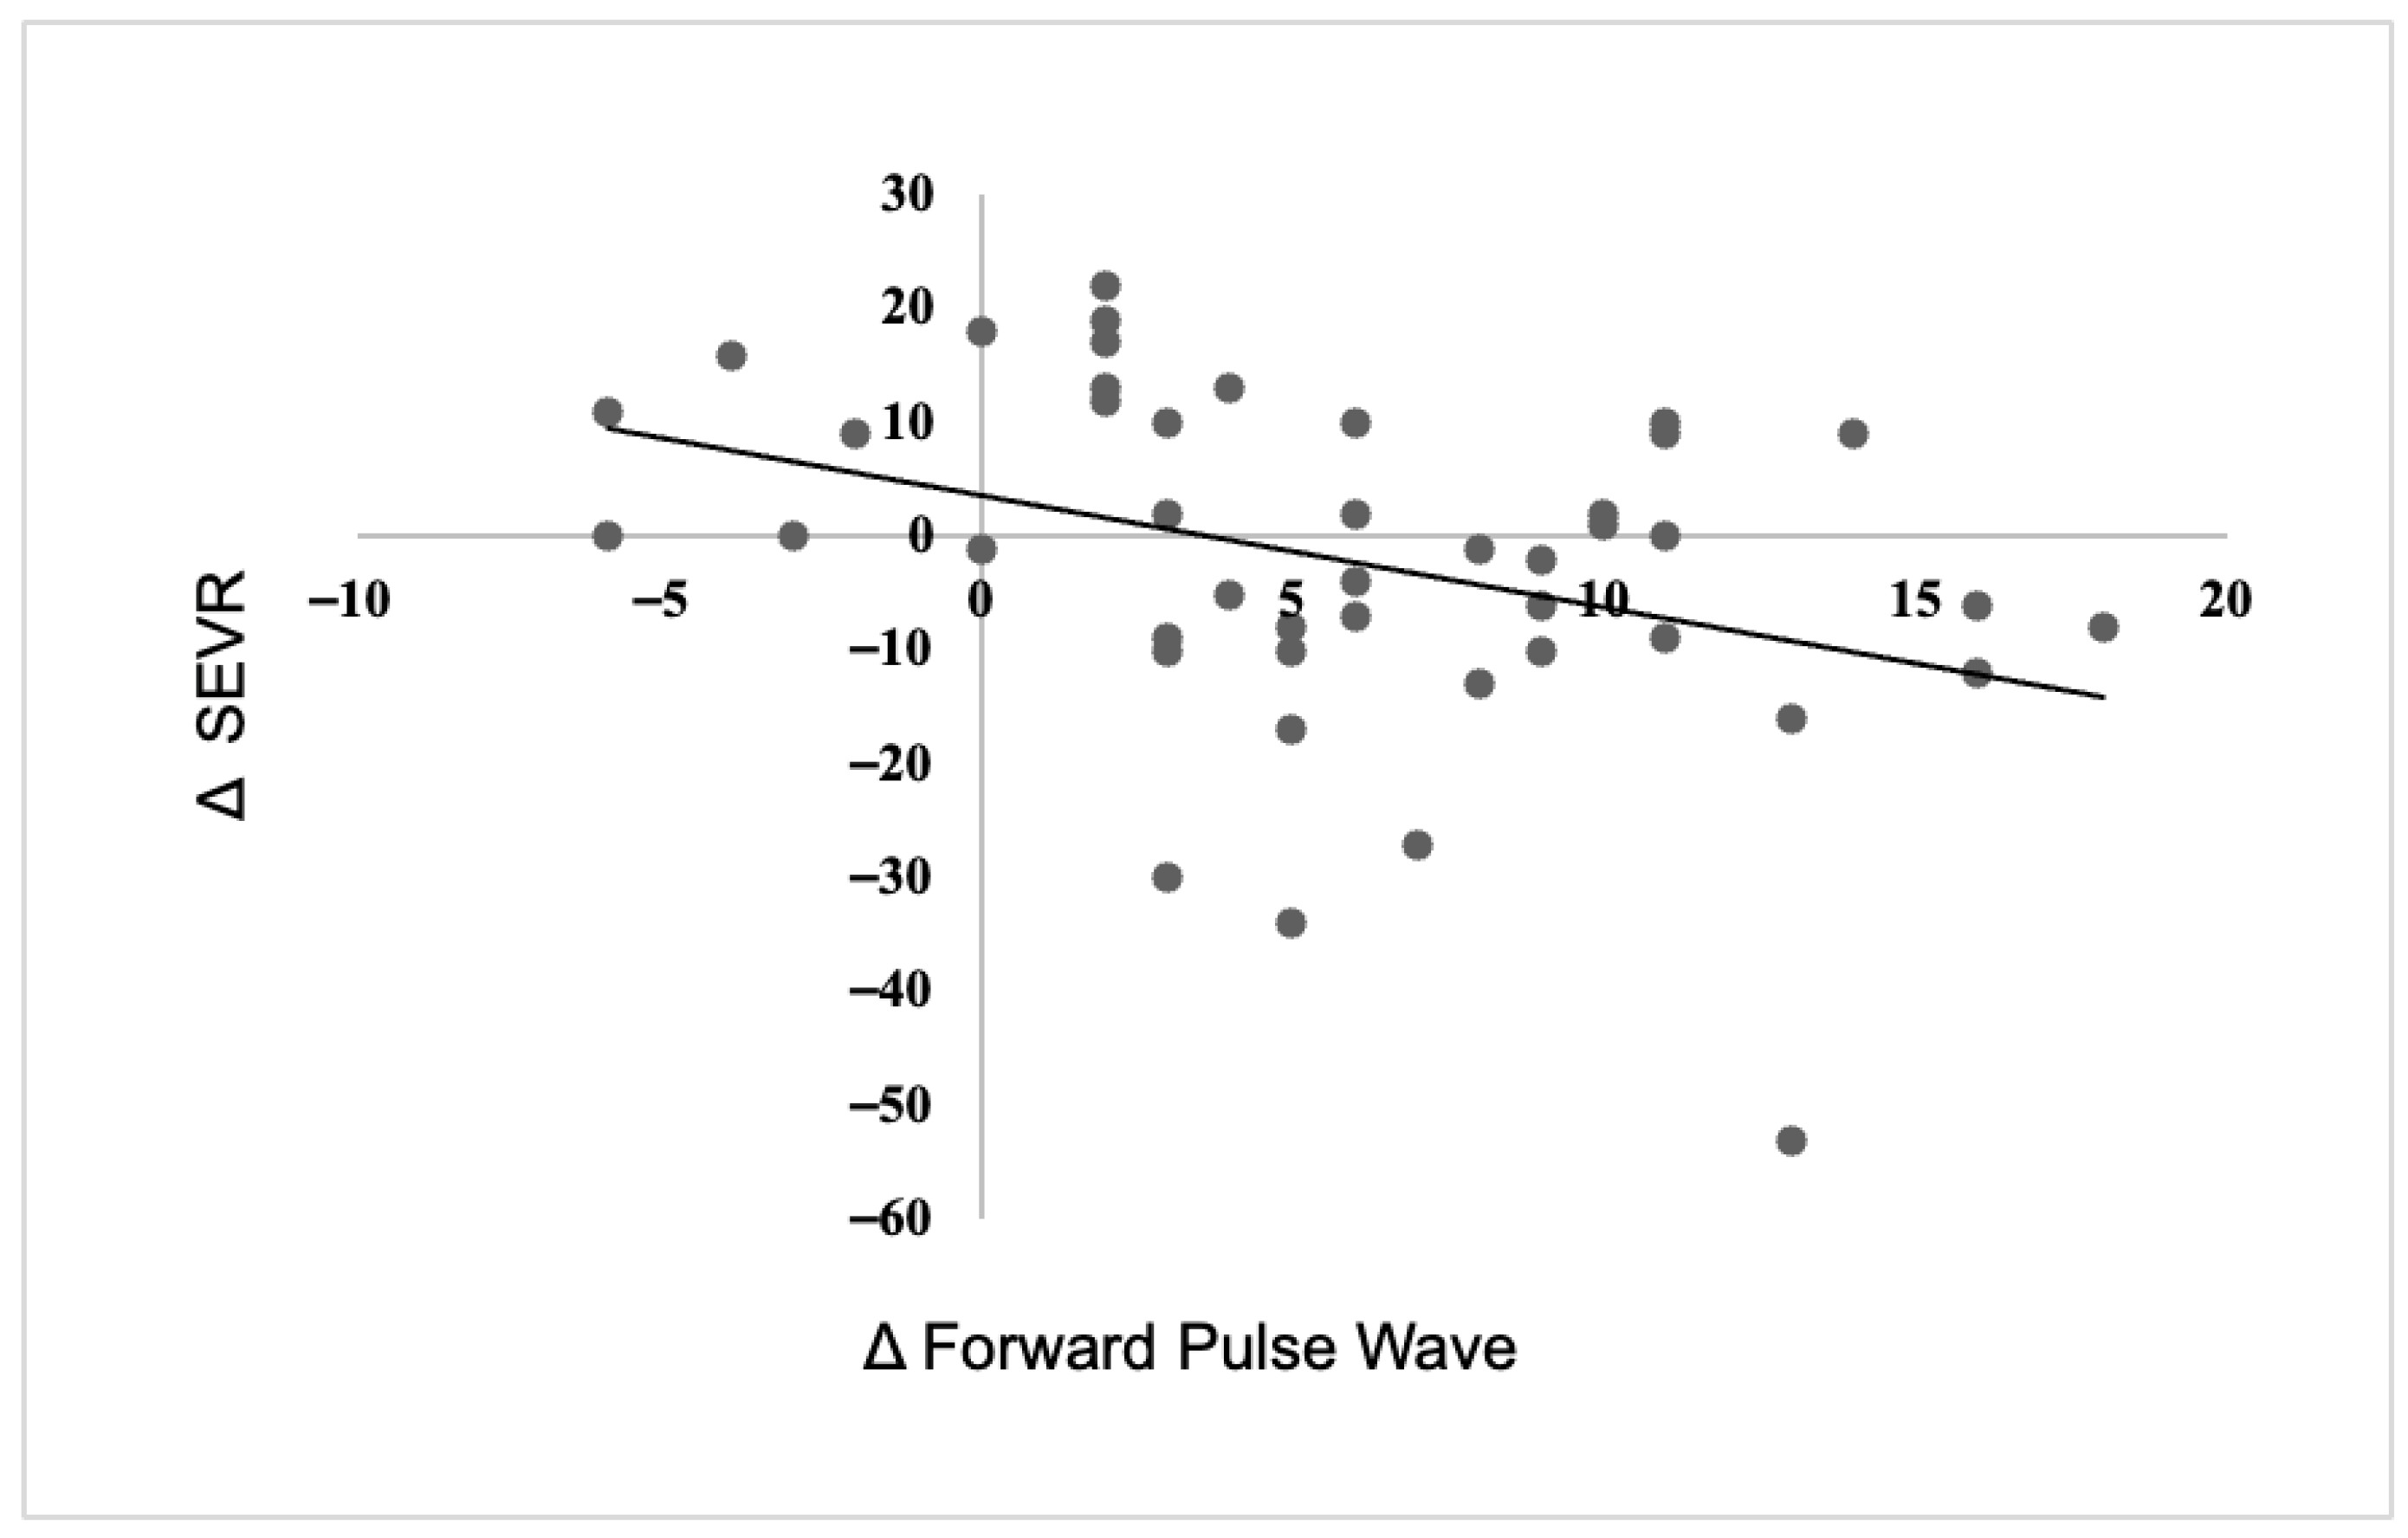
Changes in vascular measurements had more relationships in the female adults than in males before and after correction. The post hoc power analysis for n = 45 females, with α = 0.05 and 80% power, reported that the minimum detectable effect size was r = 0.39, which supports the findings in females that survived Benjamini–Hochberg FDR correction. In females, there was a direct relationship between changes in SEVR and changes in heart rate before and after correction (r = −0.773, p < 0.001, P (B-H-adjusted) = 0.007) which did not exist in males. In females, we also found a direct relationship between changes in aortic SBP and changes in AIx@75 (r = 0.368, p = 0.01, P (B-H-adjusted) = 0.047) and a direct relationship between changes in reflected pulse wave and changes in AIx@75 (r = 0.584, p < 0.001, P (B-H-adjusted) = 0.014). We found that an inverse relationship existed between changes in SEVR and changes in forward pulse wave in females before and after correction (r = −0.37, p = 0.01, P (B-H-adjusted) = 0.035) (Figure 2).

4. Discussion

Overall, the data suggest that sex-related arterial differences in hemodynamic load and responses exist which should be considered with load carriage. The main findings reported are that arterial stiffness, forward pulse wave, and reflected pulse wave increase with front load carriage. Despite the fact that the females in our study carried lighter loads, we report more hemodynamic changes in females than in males with load carriage. There was an inverse relationship between changes in SEVR and changes in forward pulse wave in the females but not in males. We hypothesized that males would have larger increases in pulse flow but smaller increases in stiffness with load carriage. Males did have larger increases in pulse flow, which supported our hypothesis, but this difference did not remain when the data were controlled for the amount of load carried. Also, the increase in arterial stiffness with load carriage was similar between sex groups, rejecting the hypothesis.
We are the first to report data on the relationship between a single load carriage and the hemodynamic responses of forward and reflected pulse waves. SEVR is a recognized measure of myocardial perfusion and indirectly related to stiffness. Increases in arterial stiffness are related to increased central SBP, a longer duration of systole, and shortened diastole, which ultimately relates to lower SEVR [15]. Females typically have higher heart rates and lower SBP relative to males, and research has shown that SEVR may be lower in females than in males [15]. We are reporting the first acute SEVR response to load. In a tactical intervention study reporting SEVR, Feairheller et al. measured the vascular changes with a 6-wk diet and exercise intervention and found no change in SEVR in a group of firefighters from pre- to post-intervention [16]. In the circuit training intervention from that study, one of the exercise stations was a 40 lb load carriage for 100 ft, but forward or reflected pulse waves were not examined [16]. In our study, the change in SEVR with one occasion of load carriage was inversely related to the change in forward pulse wave but directly related to the change in aortic diastolic pressure. We did not find this relationship in males which suggests that females may experience larger decreases in estimated myocardial supply–demand balance accompanied by greater forward pulse flow but decreased diastolic filling. Considering that the females in our study carried a smaller load than the males, these findings have importance. The findings could be due to postural demand imposed by the load on the seemingly smaller female body, so future studies could examine biomechanical changes in body position along with vascular hemodynamic responses. The relationship between changes in SEVR and changes in aortic diastolic pressure could be an early indication of compromised diastolic health, so future studies could examine echocardiographic data in tandem with vascular analysis. These hemodynamic concepts should be explored in future studies. SEVR is an estimation of myocardial oxygen supply–demand balance, and occupational physical demands can place an increased cardiovascular stress on employees; so, SEVR should be examined in future occupational research in relation to body size, load amount, posture, and diastolic health.
We report that changes in resting SBP are indirectly related but changes in aortic SBP are directly related to changes in AIx@75 in females but not in males. This suggests that central responses in females to load carriage is more directly related to stiffness than peripheral BP responses, despite carrying a lighter load. This response may mimic the hemodynamics seen in hypertensive adults. Onofrei et al. examined cardiovascular risk and the relationships between arterial stiffness and PWA measurements in hypertensive patients. They reported that resting (peripheral) SBP was indirectly related but aortic (central) SBP was directly related to AIx in hypertensive adults [17]. We report similar findings in females without hypertension, but we did not find the same relationship in males.
The present study does have limitations. While previous research has shown that 30 s of load carriage is enough to elicit a cardiovascular response, this length of time may not represent all load carriage instances on the job site. Secondly, it should be noted that our population of adults had lower levels of BP than perhaps what employees may have. Regardless, the male adults in our study did have a larger increase in central BP with load carriage, so this suggests that employers may want to implement educational programs on hypertension. Also, each vascular measurement takes about one minute to complete, so we believe that we captured as close to the post-exercise hemodynamic response as possible. We recognize that the data reported could include some recovery responses, so perhaps a future study could examine the more immediate vascular response to load, changes in blood flow, fluid dynamics, and swelling related to carriage. Finally, we acknowledge that sex-stratified analysis of the changes in vascular measures may be exploratory and was underpowered, especially in the male group (minimal detectable r = 0.52 at 80% power). The findings should be interpreted with caution but should be replicated in future larger and more adequately powered cohorts.

5. Conclusions

There remains a need for more research in vascular health responses to load carriage. In conclusion, the data suggest that sex-related arterial differences in hemodynamic load and responses exist. Females may experience larger decreases in estimated myocardial supply–demand balance accompanied by lower diastolic filling. Employers should be aware of these inherent cardiac risks with load carriage in their female employees. Increased BP monitoring should be implemented in hypertensive employees.

Author Contributions

Conceptualization, B.W. and D.L.F.; data curation, B.W., K.L., S.S. and N.T.; formal analysis, B.W. and D.L.F.; investigation, B.W., K.L., S.S. and N.T.; methodology, B.W., A.P.-B., D.J.S. and D.L.F.; project administration, B.W. and D.L.F.; supervision, A.P.-B., D.J.S. and D.L.F.; validation, B.W. and N.T.; writing—original draft, B.W. and D.L.F.; writing—review and editing, K.L., S.S., N.T., A.P.-B. and D.J.S. All authors have read and agreed to the published version of the manuscript.

Funding

This research received no external funding.

Institutional Review Board Statement

This study was conducted in accordance with the Declaration of Helsinki and approved by the Institutional Review Board of California State University San Marcos (2186411-1 5/03/2024 and 2012386-2 3/13/2023).

Informed Consent Statement

Informed consent was obtained from all participants.

Data Availability Statement

Data are held in controlled storage at CSUSM based on IRB approval. The data associated with this study are not publicly available but are available upon request to the corresponding author.

Acknowledgments

The authors thank the participants for their interest in joining our study. The authors thank the undergraduate research students who helped with data collection.

Conflicts of Interest

The authors declare no conflicts of interest.

Abbreviations

The following abbreviations are used in this manuscript:
CVDCardiovascular disease
BPBlood pressure
PWVPulse wave velocity
PWAPulse wave analysis
SEVRSubendocardial viability ratio
AIx@75Augmentation index normalized to heart rate 75
SBPSystolic blood pressure
DBPDiastolic blood pressure

References

  1. Tsao, C.W.; Aday, A.W.; Almarzooq, Z.I.; Anderson, C.A.; Arora, P.; Avery, C.L.; Baker-Smith, C.M.; Beaton, A.Z.; Boehme, A.K.; Buxton, A.E.; et al. Heart Disease and Stroke Statistics—2023 Update: A report from the American Heart Association. Circulation 2023, 147, e93–e621. [Google Scholar] [CrossRef] [PubMed]
  2. Yook, Y.S. Firefighters’ occupational stress and its correlations with cardiorespiratory fitness, arterial stiffness, heart rate variability, and sleep quality. PLoS ONE 2019, 12, e0226739. [Google Scholar] [CrossRef] [PubMed]
  3. Faghy, M.A.; Shei, R.J.; Armstrong, N.C.D.; White, M.; Lomax, M. Physiological impact of load carriage exercise: Current understanding and future research directions. Physiol. Rep. 2022, 10, e15502. [Google Scholar] [CrossRef] [PubMed]
  4. Litwin, M.; Obrycki, Ł.; Niemirska, A.; Sarnecki, J.; Kułaga, Z. Central systolic blood pressure and central pulse pressure predict left ventricular hypertrophy in hypertensive children. Pediatr. Nephrol. 2019, 34, 703–712. [Google Scholar] [CrossRef] [PubMed]
  5. Jha, M.; Dong, Z.; Ruda, M.M.; Prescott, B.; Xanthakis, V.; Nayor, M.; Gajjar, P.; Larson, M.G.; Benjamin, E.J.; Vasan, R.S.; et al. Associations of cardiovascular health with arterial health in adults free of cardiovascular disease. Am. J. Prev. Cardiol. 2025, 23, 101083. [Google Scholar] [CrossRef] [PubMed]
  6. Townsend, J.R. Arterial Stiffness: Recommendations and Standardization. Pulse 2016, 4, 3–7. [Google Scholar] [CrossRef] [PubMed]
  7. Townsend, R.R.; Black, H.R.; Chirinos, J.A.; Feig, P.U.; Ferdinand, K.C.; Germain, M.; Rosendorff, C.; Steigerwalt, S.P.; Stepanek, J.A. Clinical Use of Pulse Wave Analy-sis: Proceedings From a Symposium Sponsored by North American Artery. J. Clin. Hypertens. 2015, 17, 503–513. [Google Scholar] [CrossRef] [PubMed]
  8. Tsiachris, D.; Tsioufis, C.; Syrseloudis, D.; Roussos, D.; Tatsis, I.; Dimitriadis, K.; Toutouzas, K.; Tsiamis, E.; Stefanadis, C. Subendocardial viability ratio as an index of impaired coronary flow reserve in hypertensives without significant coronary artery stenoses. J. Hum. Hypertens. 2012, 26, 64–70. [Google Scholar] [CrossRef] [PubMed]
  9. Kotsis, V.; Stabouli, S.; Karafillis, I.; Nilsson, P. Early vascular aging and the role of central blood pressure. J. Hypertens. 2011, 29, 1847–1853. [Google Scholar] [CrossRef] [PubMed]
  10. Feairheller, D.L. Blood pressure and heart rate responses in volunteer firefighters while wearing personal protective equip-ment. Blood Press. Monit. 2015, 20, 194–198. [Google Scholar] [CrossRef] [PubMed]
  11. Wheelock, B.; Grzywaczewski, M.; Flannery, M.; Feairheller, D.L. The Location of a Weighted Carry in Relation to the Body May Have Clinical Implications for Health and Exercise Programming. J. Vasc. Dis. 2025, 4, 32. [Google Scholar] [CrossRef]
  12. Writing Committee Members; Jones, D.W.; Ferdinand, K.C.; Taler, S.J.; Johnson, H.M.; Shimbo, D.; Abdalla, M.; Altieri, M.M.; Bansal, N.; Bello, N.A.; et al. AHA/ACC/AANP/AAPA/ABC/ACCP/ACPM/AGS/AMA/ASPC/NMA/PCNA/SGIM Guideline for Prevention, Detection, Evaluation and Management of High Blood Pressure in Adults: A Report of the American College of Cardiology/American Heart Association Joint Committee on Clinical Practice Guidelines. Hypertension 2025, 82, e212–e316. [Google Scholar] [PubMed]
  13. Getty, A.K.; Wisdo, T.R.; Chavis, L.N.; Derella, C.C.; McLaughlin, K.C.; Perez, A.N.; DiCiurcio, W.T.; Corbin, M.; Feairheller, D.L. Effects of circuit exercise training on vascular health and blood pressure. Prev. Med. Rep. 2018, 10, 106–112. [Google Scholar] [CrossRef] [PubMed]
  14. Tagawa, K.; Choi, Y.; Ra, S.G.; Yoshikawa, T.; Kumagai, H.; Maeda, S. Resistance training-induced decrease in central ar-terial compliance is associated with decreased subendocardial viability ratio in healthy young men. Appl. Physiol. Nutr. Metab. 2018, 43, 510–516. [Google Scholar] [CrossRef] [PubMed]
  15. Xie, H.; Gao, L.; Fan, F.; Gong, Y.; Zhang, Y. Research Progress and Clinical Value of Subendocardial Viability Ratio. J. Am. Heart Assoc. 2024, 13, e032614. [Google Scholar] [CrossRef] [PubMed]
  16. Feairheller, D.L.; Smith, M.; Carty, M.; Reeve, E.H. Blood pressure surge with alarm is reduced after exercise and diet in-tervention in firefighters. Blood Press. Monit. 2023, 28, 134–143. [Google Scholar] [CrossRef]
  17. Onofrei, V.A.; Ceasovschih, A.; Anghel, R.C.; Roca, M.; Macu, D.T.; Adam, C.A.; Mitu, O.; Cumpat, C.; Mitu, F.; Crisan, A.; et al. Subendocardial Viability Ratio Pre-dictive Value for Cardiovascular Risk in Hypertensive Patients. Medicina 2023, 59, 24. [Google Scholar] [CrossRef]
Figure 1. Photo depicts front load carriage.
Jvd 05 00014 g001
Figure 2. Relationship between change in subendocardial viability ratio (SEVR) and change in forward pulse wave with load carriage in females.
Jvd 05 00014 g002
Table 1. Physiological characteristics.
Entire Group (n = 68)Females (n = 45)Males (n = 23)pd
Age, years21.1 ± 1.720.9 ± 1.421.5 ± 2.10.090.34
BMI, kg∙m−224.4 ± 3.023.8 ± 3.025.6 ± 2.70.010.61
Health score, rating 1–107.8 ± 1.17.9 ± 1.17.7 ± 1.10.36−0.09
Clinic SBP, mmHg119.8 ± 11.5116.4 ± 9.9126.5 ± 11.8<0.0010.96
Clinic DBP, mmHg72.5 ± 7.672.1 ± 8.273.5 ± 6.50.230.19
# times of exercise per week4.9 ± 2.34.4 ± 1.66.0 ± 3.10.020.71
# times of resistance training per week2.4 ± 1.52.1 ± 1.32.9 ± 1.60.020.52
Load carriage data
  Load carriage amount, kg22.2 ± 6.419.4 ± 3.827.7 ± 6.9<0.0011.61
  Percent body weight carried, %31.2 ± 4.130.2 ± 3.233.2 ± 4.80.010.78
Data are presented as mean ± SD. Between-group p-value and effect size reported. BMI, body mass index; clinic SBP, seated systolic blood pressure in clinic; DBP, seated diastolic blood pressure in clinic; #, number.
Table 2. Blood pressure responses to functional load carriage.
Peripheral SBP, mmHgPeripheral DBP, mmHgCentral SBP, mmHgCentral DBP, mmHg
Females (n = 45)
  Pre-Carry120.0 ± 13.8 *69.7 ± 10.1103.8 ± 13.0 *70.5 ± 10.2
  Post-Carry127.0 ± 15.0 *67.9 ± 10.0114.7 ± 15.1 *68.9 ± 10.2
Δ7.0 ± 8.5−1.7 ± 7.410.9 ± 7.7 *−1.56 ± 7.6
p<0.0010.13<0.0010.18
d−0.820.23−1.410.21
Males (n = 23)
  Pre-Carry133.4 ± 14.970.0 ± 9.5112.6 ± 11.971.1 ± 9.9
  Post-Carry140.7 ± 15.269.8 ± 8.9128.3 ± 15.571.6 ± 8.7
Δ7.4 ± 11.9−0.22 ± 8.115.6 ± 9.10.5 ± 8.6
p0.010.89<0.0010.79
d−0.620.03−1.72−0.06
Data are presented as mean ± SD. Within-group change (Δ), p-value, and effect size with carry reported for each measurement. * p < 0.05 between sex groups. SBP, systolic blood pressure; DBP, diastolic blood pressure.
Table 3. Vascular responses to load carriage.
Heart Rate, bpmAIx @75, %SEVR, %Forward Pulse, mmHgReflected Pulse, mmHgReflection Magnitude, %
Females (n = 45)
  Pre-Carry65.6 ± 10.93.5 ± 10.2144.8 ± 27.628.4 ± 4.7 *13.2 ± 2.5 *46.4 ± 4.7
  Post-Carry65.3 ± 11.728.4 ± 22.3142.8 ±27.434.2 ± 6.7 *20.0 ± 5.8 *58.7 ± 12.2
Δ−0.38 ± 5.624.8 ± 18.5−2.07 ± 14.95.8 ± 5.76.8 ± 4.4 *12.2 ± 10.5 *
p0.66<0.0010.36<0.001<0.001<0.001
d0.67−1.340.14−1.02−1.54−1.16
Males (n = 23)
  Pre-Carry62.9 ± 10.71.8 ± 9.8145.3 ± 26.234.5 ± 7.816.1 ± 3.647.2 ± 7.4
  Post-Carry62.4 ± 9.734.1 ± 7.8147.5 ± 22.140.2 ± 6.826.1 ± 6.665.0 ± 12.6
Δ−0.57 ± 6.332.4 ± 15.52.2 ± 20.15.7 ± 8.39.9 ± 5.517.8 ± 10.4
p0.67<0.0010.61<0.001<0.001<0.001
d0.09−2.09−0.11−0.68−1.78−1.7
Data are presented as mean ± SD. Within-group change (Δ), p-value, and effect size with carry reported for every groups. * p < 0.05 between sex groups. AIx@75, augmentation index at heart rate 75; SEVR, subendocardial viability ratio.
Table 4. Change in vascular measurements with load carriage: sex-stratified correlations.
Females (n = 45)Males (n = 23)
Variable PairrpP (B-H-Adjusted)rpP (B-H-Adjusted)
ΔResting SBP–ΔAIx@75−0.3170.030.07−0.1520.480.52
ΔResting DBP–ΔAIx@75−0.3190.030.06−0.1390.530.53
Δaortic SBP–ΔAIx@750.3680.010.047 *0.3650.090.32
Δaortic DBP–ΔAIx@75−0.250.090.13−0.2270.290.37
ΔHeart rate–ΔAIx@750.2350.120.150.4890.020.09
ΔReflected pulse wave–ΔAIx@750.584<0.0010.014 *0.5450.010.07
ΔForward pulse wave–ΔAIx@75−0.0540.730.73−0.2160.320.37
ΔResting SBP–ΔSEVR−0.0990.520.61−0.2690.220.36
ΔResting DBP–ΔSEVR0.350.020.0560.2950.170.36
Δaortic SBP–ΔSEVR−0.0880.570.61−0.2210.310.37
Δaortic DBP–ΔSEVR0.3010.040.070.2940.170.34
ΔHeart rate–ΔSEVR−0.773<0.0010.007 *−0.802<0.0010.014 *
ΔReflected pulse wave–ΔSEVR−0.2660.070.11−0.3090.150.34
ΔForward pulse wave–ΔSEVR−0.3710.010.035 *−0.260.230.36
* Survives Benjamini–Hochberg FDR correction. Uncorrected and BH-adjusted p-values reported for all correlation pairs per sex group. Sex-stratified findings are considered exploratory and first-of-their-kind. SBP, systolic blood pressure; DBP, diastolic blood pressure; AIx@75, augmentation index normalized to heart rate of 75 bpm; SEVR, subendocardial viability ratio. Resting BP measures reflect brachial BP in supine position. Aortic BP measures reflect central BP measurements through pulse wave analysis. Post hoc power analysis calculated minimum detectable r = 0.39 for females (n = 45) and r = 0.52 for males (n = 23) at 80% power, α = 0.05 (two-tailed).
Disclaimer/Publisher’s Note: The statements, opinions and data contained in all publications are solely those of the individual author(s) and contributor(s) and not of MDPI and/or the editor(s). MDPI and/or the editor(s) disclaim responsibility for any injury to people or property resulting from any ideas, methods, instructions or products referred to in the content.