Article

Behavioral Biases and Retail Investment Decisions in India: The Moderating Role of Financial Literacy and Financial Awareness

1
Department of Commerce, Maulana Azad College, Kolkata 700016, India
2
Department of Management & Business Administration, Aliah University, Kolkata 700160, India
3
Department of Business Administration, Aligarh Muslim University, Aligarh 202002, India
4
WIUT Business School, Westminster International University in Tashkent (WIUT), Tashkent 100047, Uzbekistan
*
Author to whom correspondence should be addressed.
Analytics 2026, 5(3), 26; https://doi.org/10.3390/analytics5030026
Submission received: 19 April 2026 / Revised: 2 July 2026 / Accepted: 22 July 2026 / Published: 31 July 2026

Abstract

This study investigates how behavioral biases influence the investment decisions of retail investors in Kolkata, India, with particular emphasis on the moderating roles of financial literacy and financial awareness. Despite the rapid expansion of India’s financial markets and increased retail participation, investors often exhibit irrational behavior driven by psychological biases. This study seeks to answer the following research question: To what extent do behavioral biases affect the investment decisions of retail investors in Kolkata, India, and how effectively do financial literacy and financial awareness mitigate these effects? Using primary data collected from 444 retail investors in Kolkata, this study employs Partial Least Squares Structural Equation Modeling (PLS-SEM) to test the conceptual framework. The findings reveal that behavioral biases—namely overconfidence, anchoring, herd behavior, and loss aversion—significantly and negatively affect investment decisions. However, financial literacy and financial awareness not only positively influence decision-making but also significantly moderate the relationship between behavioral biases and investment outcomes. This study contributes to behavioral finance literature by distinguishing between financial literacy and financial awareness as separate constructs and demonstrating their dual role as both direct and moderating factors. The findings have important implications for policymakers, financial educators, and investment advisors in designing targeted interventions to improve investor decision-making.

1. Introduction

Despite the rapid growth and increasing inclusivity of the Indian financial market, retail investors continue to exhibit suboptimal investment behavior influenced by various cognitive and emotional biases. While access to financial markets has improved significantly, investors’ ability to make rational, informed decisions remains questionable. Empirical evidence suggests that behavioral biases, namely overconfidence, herd mentality, anchoring, and loss aversion, often lead to irrational investment decisions, resulting in poor portfolio performance and financial losses [1,2]. At the same time, financial literacy and awareness have been identified as critical factors that can enhance the quality of decision-making [3]. However, there is a lack of clarity regarding the extent to which these factors mitigate behavioural biases among retail investors in Kolkata, India. Moreover, prior studies often treat financial literacy and awareness as a single construct, overlooking their distinct roles in shaping investor behaviour. In the Indian context, where investors come from diverse socioeconomic and educational backgrounds, the interplay between behavioral biases, financial literacy, and financial awareness becomes even more complex. There is limited empirical research that comprehensively examines how these elements interact to influence investment decisions, particularly in a rapidly digitizing financial environment. Therefore, the core problem addressed in this study is to what extent behavioral biases influence the investment decisions of retail investors in Kolkata, India, and how effectively financial literacy and financial awareness mitigate these biases. This study aims to fill this gap by providing empirical insights into the behavioral dimensions of investment decision-making, thereby contributing to the development of more effective investor education programs, policy frameworks, and advisory practices.
The Indian financial market offers a precise and fascinating situation. India’s secondary market is the fastest-growing in the world, with more than 25 million active demat accounts [4,5]. It has witnessed a path-breaking transformation from physical trading to complete digitization, from conservative participation to liberal retail investor participation, and from conventional savings instruments to a wide spectrum of financial products [6]. The vast expansion of the National Stock Exchange (NSE) and the Bombay Stock Exchange (BSE), the financial markets’ growing reach, and the advantages of online trading have increased investment options but also made it more complex for retail investors to make decisions [7]. Demographic characteristics, varying risk tolerance, prior market experience, and behavioral biases, including anchoring, overconfidence, herd mentality, regret aversion, and loss aversion, all affect their choices, in addition to economic considerations [8,9]. The current study examines how behavioral biases affect individual retail investors in Kolkata, India, investment choices, and whether financial awareness and literacy mitigate these impacts [10]. In addition, this study examines whether investors’ decisions are shaped more by rational or emotional factors. Similarly, they are impacted by heuristic-driven shortcuts, emotional impulses, and cognitive distortions or not [2]. It also examines how investment patterns are influenced by demographic factors and how awareness and literacy act as safeguards against making biased choices [11]. The findings significantly contribute to the domain of behavioral finance in India and beyond. This paper uniquely distinguishes between financial literacy (technical knowledge) and financial awareness (practical sensitivity to financial conditions), signifying that each concept serves a different purpose in reducing the effects of behavioral biases [12]. Numerous biases, including overconfidence, anchoring, regret aversion, and cognitive dissonance, have been shown to have an impact on investment choices [13]. However, these consequences can be curtailed or mitigated by financial understanding and financial literacy [14,15]. Therefore, this study expands our knowledge of investor behavior in emerging and diverse economies, where cultural, social, and informational factors interact with psychological characteristics [16,17]. This paper theoretically connects with behavioral frameworks and conventional finance models, confirming that investors function on a spectrum of rationality influenced by both cognitive constraints and well-informed decision-making processes [18,19]. It also highlights the necessity of investor-centric literacy campaigns, behaviorally conscious advisory practices, and regulatory nudges that encourage informed, bias-reduced judgment [20,21]. The insights of this research have positive outcomes for policymakers, financial educators, regulatory bodies, and advisory institutions.
The rapid expansion of financial markets in India, coupled with increasing retail investor participation, has transformed the investment landscape. However, despite improved access to financial instruments, retail investors often fail to make rational investment decisions due to behavioral biases. These biases—namely overconfidence, anchoring, and herd behavior—systematically distort judgment and lead to suboptimal financial outcomes.
  • Research Question: This study seeks to answer the following central question:
How do behavioral biases influence the investment decisions of retail investors in Kolkata, India, and to what extent do financial literacy and financial awareness mitigate these effects?
  • Objective of the Study:
    • To examine the impact of behavioral biases on investment decisions.
    • To assess the role of financial literacy and financial awareness.
    • To analyze their moderating effects on behavioral biases.
  • Research Gap:
While prior studies have examined behavioral biases and financial literacy, most have treated financial literacy and financial awareness as a single construct. Moreover, limited research has explored their moderating role in the Indian context, particularly within a rapidly digitizing financial ecosystem.

2. Review of Literature and Developing Hypotheses

The premise of behavioral finance explains investors’ irrationality [22,23]. It evolves as a conglomeration of psychology, economics, and sociology [24,25]. The field gained strong scholastic soundness with Kahneman and Tversky [26], who showed systematic deviations from Expected Utility Theory [26]. It was rooted in earlier philosophical insights, namely Adam Smith’s Theory of Moral Sentiments [27], and was reinforced throughout the 20th century by calls to integrate psychology with economic inquiry [28]. Behavioral finance was further established as an alternative paradigm that can explain anomalies in real-world financial markets [3,29,30,31]. Investors frequently make forecasting errors, namely overconfidence, anchoring, loss aversion, herding, and representativeness bias, because they rely on heuristics, mental shortcuts, and emotional responses like fear, pride, or remorse when making investment decisions [19,29]. These behavior affect asset prices, trading volume, and long-term financial outcomes by influencing market efficiency and causing investors to overreact, underreact, or misinterpret information [32,33]. Behavioral finance now encompasses themes such as investor emotions, financial literacy, risk perception, portfolio selection, market efficiency, and cross-cultural decision-making [1,34]. Behavioral tendencies among Indian investors have become increasingly visible as India emerges as one of the fastest-growing financial markets, particularly with the rising participation of retail investors in the NSE and BSE [35,36]. Empirical research shows that cognitive biases often exert a stronger influence on investment decisions than traditional factors, namely risk and return, in both Indian and global contexts [13,28]. Herding encourages investors to imitate group behavior during periods of volatility [37,38]; loss aversion causes losses to feel more painful than equivalent gains, leading to overly cautious or irrational investment behavior [26]; anchoring makes investors excessively dependent on initial information [39]; and cognitive dissonance prevents them from acknowledging poor decisions [40,41]. Inexperienced investors often make rapid judgments about future outcomes based on assumptions or superficial patterns due to representativeness bias [39]. Such biases are determined by socioeconomic conditions, cultural norms, individual emotions, and levels of financial literacy, which frequently lead to deficient investment decisions [11,42]. Overall, the study indicates that behavioral finance provides a more realistic explanation of investor behavior than traditional models, supporting the view that psychological factors and cognitive limitations substantially influence how individuals process information, assess risk, and make investment decisions [23,31].
A subfield of social science known as “behavioral finance” begins with basic axioms and examines whether hypotheses derived from these axioms effectively explain financial market behavior [43]. Retail investors and the market system as a whole make up its two main parts. Micro-behavioral finance and macro-behavioral finance are two broad categories of behavioral finance [44]. While micro-behavioral finance concentrates on variations in individual investors’ actions that keep them from acting as completely rational agents, macro-behavioral finance challenges the Efficient Market Hypothesis (EMH) [29].
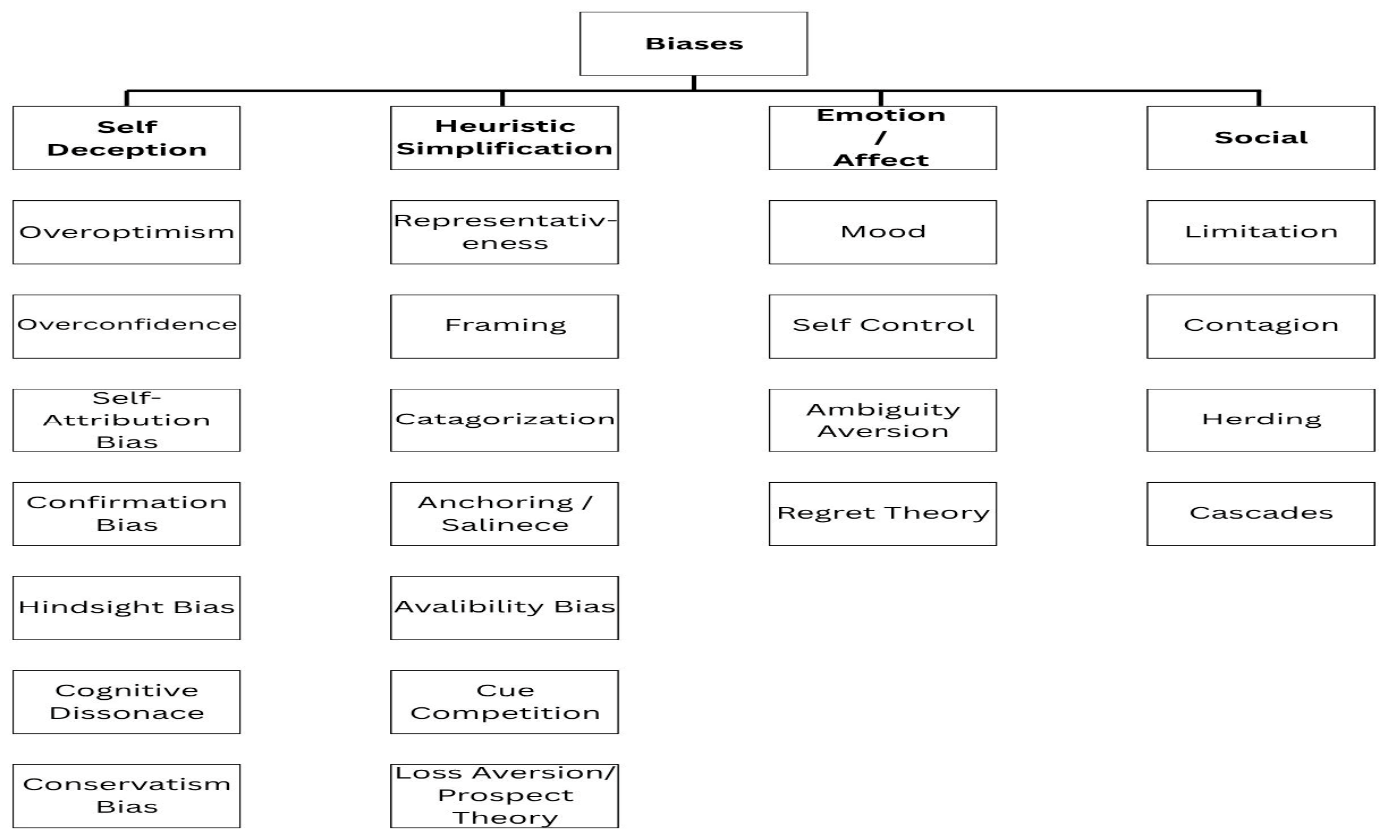
A thorough taxonomy of behavioral biases is shown in Figure 1, which can be broadly divided into four categories: Self-Deception, Heuristic Simplification, Emotion/Affect, and Social. This categorization, which was first made famous by Henseler [45], offers an organized comprehension of how emotional and cognitive constraints affect investor decision-making.
Investors in the stock market frequently make cognitive mistakes due to behavioral biases [46]. When investors work with fluid assets, concepts like resistance, support, and market psychology become critical [16]. In complex or uncertain situations, heuristic simplifications frequently result in predictable but unsatisfactory outcomes. Behavioral biases are therefore regarded as systematic judgmental errors [47]. These biases, which have their roots in psychological and emotional characteristics, have a significant impact on how investors make decisions [24]. Reliance on heuristics motivated by emotions such as fear and anger is further exacerbated by a lack of financial literacy and awareness [48]. While anxiety increases heuristic-driven reactions, anger diminishes the capacity to make wise decisions [49]. Prospect Theory has demonstrated that individuals consistently make errors in probability estimation, particularly when combining assets in a portfolio [50]. Evidence from emerging markets further supports the pervasive role of behavioral biases in shaping investment decisions. Studies conducted in countries such as Pakistan, Malaysia, Vietnam, and Bangladesh have found that heuristics, herding behavior, overconfidence, and emotional factors significantly influence retail investors’ trading behavior and risk perceptions [51]. These findings suggest that in developing financial markets, where information asymmetry and investor sophistication vary considerably, psychological factors often exert a stronger influence than traditional financial fundamentals.
The Indian context presents a similar yet distinctive landscape. Empirical studies have consistently found that behavioral biases such as overconfidence, herding, anchoring, representativeness, and loss aversion significantly affect investment decisions among Indian investors [41,52]. Research by Arora and Chakraborty [53] revealed that individual investors in India often rely on personal beliefs and social influences rather than objective market information. Likewise, Shefrin & Statman, [54] observed that behavioral factors substantially shape investment choices in South Asian markets, including India. Recent studies have also highlighted the moderating role of financial literacy, demonstrating that financially literate investors are less susceptible to behavioral biases and tend to make more rational investment decisions [55]. However, despite the rapid expansion of demat accounts, digital trading platforms, and retail participation in the Indian stock market, substantial disparities remain in investor awareness and financial knowledge across demographic groups and regions.
Two major developments accelerated interest in behavioral finance:
  • Extensive empirical evidence challenging traditional finance theories.
  • Prospect Theory, developed by Kahneman and Tversky, which provided a psychologically grounded model of decision-making under risk [56].
Many bibliometric studies have tracked the development of behavioral finance over the past few decades [57]. While Kumar and Kumar [58] identified key themes such as risk management, portfolio selection, market efficiency, behavioral biases, and investor emotions, López-Cabarcos et al. [59] noted that investor perception is fundamental to behavioral finance research. There are now two major streams of behavioral finance: one emphasizing experimental behavioral economics and the other focusing on investor biases. Understanding behavioral finance is especially important in India, given the country’s rapid economic growth, increasing financial inclusion, and expanding investor base. Although millions of individuals participate in the National Stock Exchange (NSE) and the Bombay Stock Exchange (BSE), there remains an uneven understanding of the psychological and socioeconomic factors influencing investment behavior. Consequently, examining behavioral biases, financial literacy, and financial awareness within the Indian context is essential for understanding investor decision-making and promoting more informed participation in financial markets.
  • Hypotheses Development
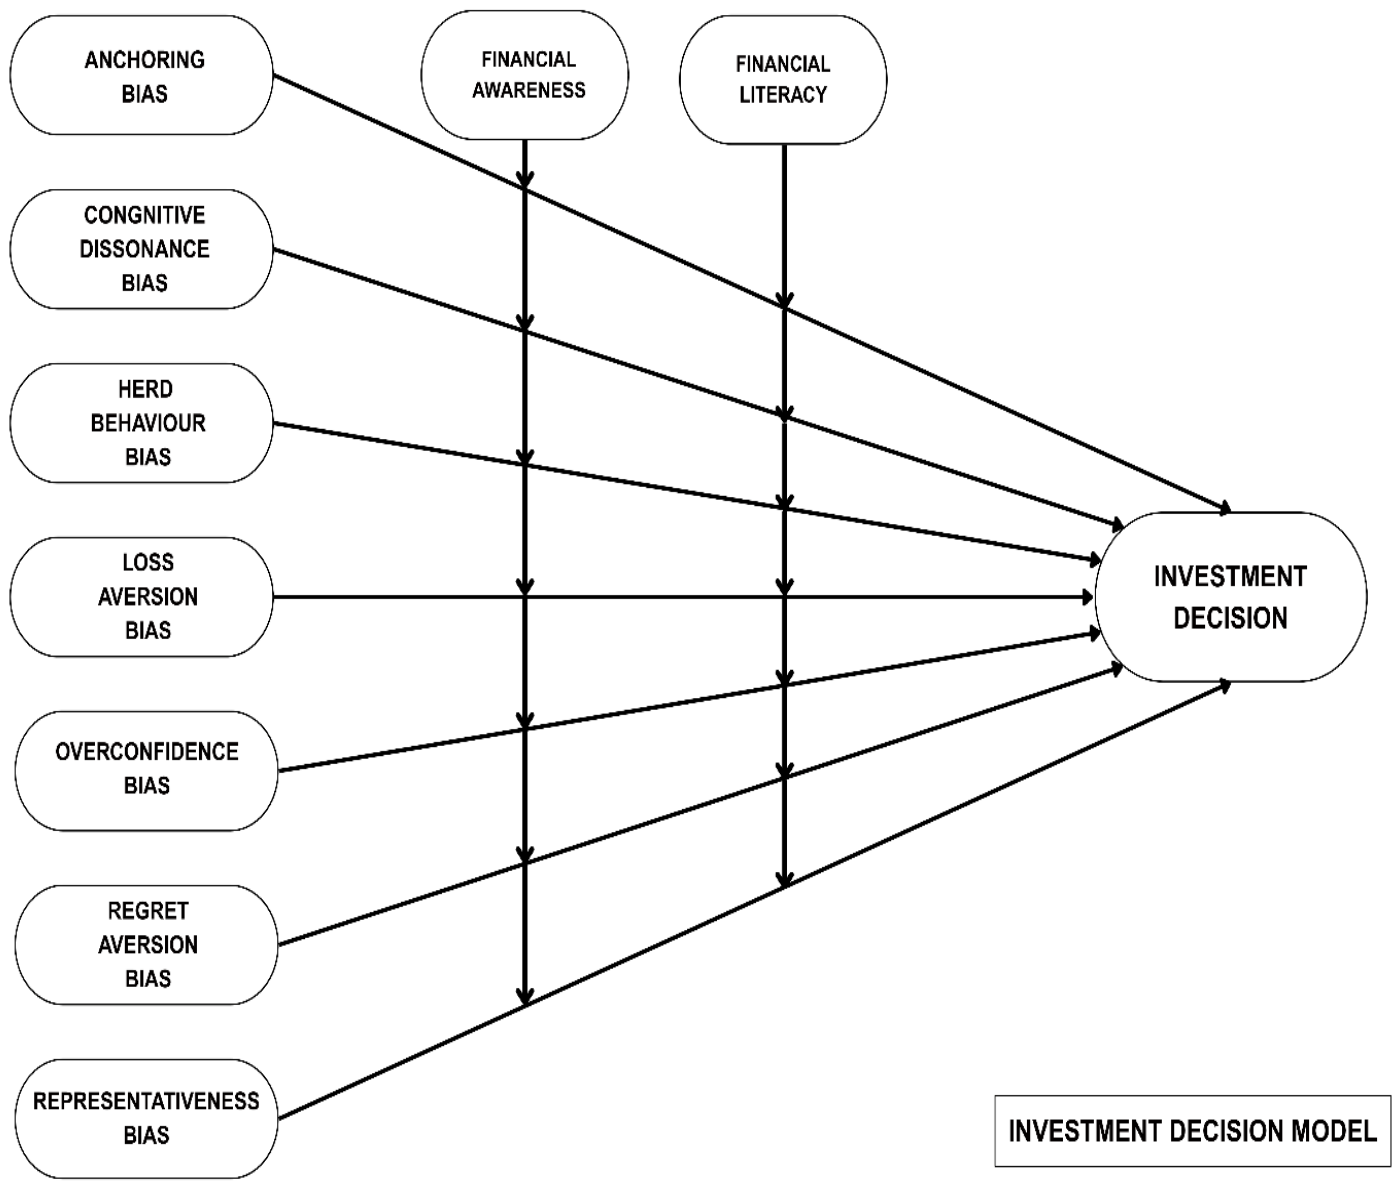
The present study incorporates seven noteworthy behavioral biases, namely anchoring, cognitive dissonance, herd behavior, loss aversion, overconfidence, regret aversion, and representativeness, as the main influencing factors of individual investing decisions based on the earlier stated theoretical presumptions. Previous studies demonstrate that these biases affect how investors perceive risk, absorb information, assess options, and make decisions about portfolio adjustments. The hypotheses proposed in the previous section are diagrammatically depicted as a conceptual framework, as shown in Figure 2.
The conceptual model integrates behavioral biases with financial literacy and financial awareness to explain investment decisions. While financial literacy and financial awareness serve as knowledge-based mitigating factors that can either increase or decrease the impact of biases on decision outcomes, behavioral biases are proposed as imperative cognitive–emotional mechanisms. The concept acknowledges that investing behavior is an outcome of the interaction between psychological proclivities and informational proficiency rather than being either random or fully rational. This theoretical framework builds a thorough analytical foundation for comprehending investor behavior by combining ideas from behavioral and neo-classical finance. The paradigm offers a theoretically sound foundation for empirical investigation and represents the multifaceted character of investment decision-making by placing behavioral biases alongside financial knowledge and awareness. Table 1 consists of the hypotheses of the study.

3. Methodology

3.1. Research Philosophy and Design

This study is guided by the positivist research paradigm, which assumes that social phenomena can be objectively measured and analyzed through empirical observation. Positivism is particularly appropriate for behavioral finance research because it facilitates the testing of theoretically derived relationships between behavioral biases and investment decision-making using quantitative methods. Consistent with this philosophical stance, the study adopts an objectivist ontology, which assumes that investor behavior exists independently of the researcher, and a quantitative epistemological approach, which emphasizes the measurement and statistical examination of observable phenomena.
The research follows a deductive approach, whereby hypotheses are developed from established behavioral finance theories and subsequently tested using empirical data. This approach is consistent with the hypothetico-deductive tradition and enables the validation or rejection of theoretically derived propositions. The study framework comprises seven behavioral biases as independent variables, investment decision-making as the dependent variable, and financial literacy and financial awareness as moderating variables. The overall research design is based on the research onion framework proposed by Saunders et al. [60], which provides a systematic structure for aligning research philosophy, strategy, data collection, and analysis techniques.
A quantitative single-method research design was adopted because the primary objective of the study is to examine causal relationships and test hypotheses across a relatively large population of investors. Quantitative methods facilitate statistical generalization and allow the magnitude and significance of relationships among variables to be assessed with greater precision.

3.2. Data Collection and Sampling

The target population comprised active retail stock market investors residing in Kolkata, India. The sampling frame consisted of individual investors who were accessible through online investor communities, brokerage-related social media groups, investment forums, alumni networks, and professional contacts. Because no comprehensive list of retail investors was available, a non-probability purposive sampling approach was adopted.
To be eligible for participation, respondents were required to: (1) be at least 18 years of age; (2) reside in Kolkata or its surrounding metropolitan area; and (3) have actively invested in equity or stock market instruments during the previous 12 months. Individuals without direct stock market investment experience were excluded from the study. The complete survey instrument, including all measurement items, is presented in the Appendix A. Data were collected through an online structured questionnaire between May 2023 and March 2024. A total of 600 investors were invited to participate. After screening for completeness and consistency, 444 valid responses were retained for analysis, corresponding to an effective usable response rate of 74.0%.
An a priori power analysis using G*Power Version 3.1.9.7 indicated that a minimum sample size of approximately 200 respondents would be sufficient to detect medium effect sizes at a significance level of 0.05 and statistical power of 0.80. Therefore, the final sample of 444 respondents exceeded the recommended threshold for Partial Least Squares Structural Equation Modeling (PLS-SEM). Therefore, the final sample provides adequate statistical power for estimating both direct and moderating effects and supports the robustness of the empirical findings.

3.3. Analytical Approach

Data analysis was conducted in two stages. First, SPSS Version 23 was used for preliminary data screening, coding, and descriptive statistical analysis. This stage involved checking for missing values, response consistency, and basic characteristics of the sample. Descriptive statistics were generated to summarize respondents’ demographic profiles and investment-related characteristics.
Second, Partial Least Squares Structural Equation Modeling (PLS-SEM) was employed to assess both the measurement model and the structural model. PLS-SEM was selected for several methodological reasons. First, the proposed framework is relatively complex, incorporating multiple latent constructs and moderating relationships. Second, PLS-SEM is well suited for prediction-oriented research and theory extension, which aligns with the objectives of behavioral finance studies. Third, unlike covariance-based SEM, PLS-SEM demonstrates robustness when data deviate from multivariate normality assumptions and performs effectively with complex models and reflective measurement constructs [61,62].
The measurement model was evaluated by assessing indicator reliability, internal consistency reliability, convergent validity, and discriminant validity. Subsequently, the structural model was assessed through the examination of path coefficients, coefficients of determination (R2), predictive relevance, and effect sizes. To determine the statistical significance of hypothesized relationships, a bootstrapping procedure with 5000 resamples was conducted. Bootstrapping is recommended in PLS-SEM because it does not require distributional assumptions and provides robust estimates of standard errors and confidence intervals.
Moderating effects were assessed within the PLS-SEM framework using interaction terms generated through the product-indicator approach available in SmartPLS 4. Separate interaction constructs were created by multiplying the indicators of each behavioral bias construct with the indicators of the corresponding moderator construct (Financial Literacy or Financial Awareness). Because PLS-SEM estimates latent variable scores using standardized indicators, the interaction modeling procedure reduces potential multicollinearity concerns commonly associated with moderation analysis. In addition, all predictor constructs exhibited acceptable VIF values, indicating that multicollinearity was not a significant concern.
The significance of moderation effects was evaluated using bootstrapping with 5000 resamples. A positive interaction coefficient indicates that the moderator weakens the negative effect of behavioral bias on investment decision-making, whereas a negative interaction coefficient would imply a strengthening of the adverse effect.
This analytical strategy enables a rigorous assessment of the direct effects of behavioral biases on investment decision-making as well as the moderating influences of financial literacy and financial awareness, thereby providing comprehensive empirical evidence for testing the proposed hypotheses.
The use of PLS-SEM is appropriate for this study for several reasons:
  • The research model is complex, involving multiple independent variables (behavioral biases), dependent variables, and moderating effects.
  • PLS-SEM is suitable for prediction-oriented research and theory development.
  • It is robust under non-normal data conditions, which is common in behavioral datasets.
  • It allows simultaneous estimation of measurement and structural models.

4. Results and Discussions

  • Diagnostic Checks
To ensure the validity and robustness of the model, several diagnostic tests were conducted:
  • Multicollinearity:
Variance Inflation Factor (VIF) values ranged from 1.037 to 2.319, well below the threshold of 3.3, confirming no multicollinearity issues.
  • Reliability:
Cronbach’s Alpha and Composite Reliability values exceeded 0.70.
  • Validity:
    Convergent validity confirmed via AVE (>0.50).
    Discriminant validity confirmed via HTMT (<0.90).
These diagnostics confirm that the model is statistically sound and suitable for hypothesis testing.
The diagnostic assessment indicates that the measurement and structural models satisfy the accepted statistical requirements, thereby providing a robust foundation for hypothesis testing and interpretation of results.
  • Multicollinearity Assessment
The Variance Inflation Factor (VIF) values ranged from 1.037 to 2.319, which are substantially below the recommended threshold of 3.3. This finding suggests that the independent variables included in the model are not highly correlated with one another. In the context of behavioral finance research, where behavioral biases often overlap conceptually, the absence of multicollinearity is particularly important. It demonstrates that each behavioral bias contributes unique explanatory power in predicting investment decisions rather than merely reflecting the effects of other biases. Consequently, the regression coefficients and path estimates can be interpreted with greater confidence, as they are unlikely to be distorted by intercorrelations among the predictors.
  • Reliability Assessment
The results show that both Cronbach’s Alpha and Composite Reliability (CR) values exceeded the recommended threshold of 0.70, indicating satisfactory internal consistency among the measurement items. This suggests that the indicators used to measure constructs such as behavioral biases, financial literacy, financial awareness, and investment choice consistently capture the intended concepts. Furthermore, the use of Composite Reliability strengthens the assessment because it accounts for differing indicator loadings and is considered more appropriate in PLS-SEM studies. The high reliability values, therefore, support the stability and consistency of the measurement model.
  • Convergent Validity Assessment
Convergent validity was established through Average Variance Extracted (AVE) values greater than 0.50 for all constructs. This finding implies that each construct explains more than half of the variance in its respective indicators. The result confirms that the selected measurement items adequately represent their underlying theoretical constructs. In practical terms, the indicators used to measure behavioral biases and moderating variables are sufficiently correlated and collectively capture the phenomena they are intended to assess.
  • Discriminant Validity Assessment
The Heterotrait–Monotrait Ratio (HTMT) values were below the recommended threshold of 0.90, confirming discriminant validity. This result indicates that the constructs included in the model are empirically distinct from one another. Given that several behavioral biases may share conceptual similarities, the satisfactory HTMT values are particularly significant because they demonstrate that respondents were able to differentiate between the various psychological biases and related constructs. This strengthens the credibility of the findings and reduces concerns regarding construct overlap.
Taken together, the diagnostic results provide strong evidence that the measurement model is statistically reliable and valid. The absence of multicollinearity ensures that the structural relationships are estimated accurately, while the reliability and validity measures confirm the quality of the constructs used in the study. As a result, the subsequent hypothesis-testing results can be regarded as trustworthy and reflective of genuine relationships among behavioral biases, financial literacy, financial awareness, and investment decisions.
However, it should be noted that satisfying these diagnostic criteria does not automatically imply strong explanatory power or significant causal relationships. Rather, these tests confirm that the model is methodologically sound and that any significant or non-significant findings observed during hypothesis testing are more likely attributable to the actual relationships among the constructs than to measurement deficiencies. Therefore, the diagnostic outcomes enhance the credibility and interpretability of the empirical findings reported in the study.
The empirical results from the statistical analysis of the survey data have been depicted in this section. Descriptive statistics of the main constructs come after a summary of the respondents’ demographics. The conclusions of the PLS-SEM measurement and structural model estimations, including path results, moderating effects, and explanatory power, are reviewed after the reliability and validity tests. Retail stock investors in Kolkata provided 444 valid responses in total. Young investors between the ages of 18 and 35 made up a significant portion of the sample (66%). The sample was made up of 37% females and 63% males. With 58% of respondents holding postgraduate or comparable degrees, the majority of respondents had advanced degrees. The majority of participants worked for both public and commercial organizations. 42% of households had monthly incomes between INR 50,000 and INR 100,000, and 41% said they saved less than INR 100,000 annually. The demographic profile points to a group of young investors, active in their careers, and making a moderate salary.
  • Scope of the Study
This study investigates the influence of behavioral biases on investment decision-making among retail stock market investors, with particular emphasis on the moderating roles of financial literacy and financial awareness. The empirical analysis is based on data collected from 444 retail investors residing in Kolkata, one of India’s largest metropolitan cities and a major financial, commercial, and cultural hub in Eastern India.
Kolkata provides an appropriate setting for examining investor behavior due to its highly heterogeneous population. The city comprises individuals from diverse socioeconomic backgrounds, educational levels, occupations, age groups, income categories, and investment experiences. As a metropolitan center with extensive participation in financial markets, Kolkata attracts investors with varying degrees of financial sophistication and exposure to investment opportunities. Such diversity enhances the relevance of the sample for understanding behavioral patterns among Retail investors in Kolkata, India.
The study does not focus on a specific demographic group, industry, or occupation; rather, it encompasses a broad cross-section of active retail investors. Consequently, the findings offer valuable insights into behavioral finance phenomena that are likely to be observed among retail investors in other urban and semi-urban regions of India. Furthermore, many of the behavioral biases examined in this study—such as overconfidence, herding, anchoring, disposition effect, representativeness, and mental accounting—have been documented in diverse geographical and cultural contexts, supporting the broader applicability of the findings.
Nevertheless, the study acknowledges that the sample is geographically concentrated in Kolkata and therefore may not fully capture the characteristics of all retail investors across India’s diverse regional, cultural, and economic environments. Accordingly, the findings should be interpreted as being primarily representative of urban retail investors operating in large metropolitan markets. While the results provide meaningful implications for the broader Indian retail investment community, caution should be exercised in extending the conclusions to all regions of the country without further empirical validation. Table 2 presents an overview of the demographic characteristics of the respondents included in this study.
The central tendency and distributional features of biases, financial literacy, financial awareness, and investment decisions were investigated using descriptive statistics. The mean values varied from 2.12 to 3.95. In general, standard deviations were about 1.00. Kurtosis and skewness values were within acceptable bounds, suggesting no significant departures from normalcy. In addition to somewhat lower levels of herd behavior and cognitive dissonance, respondents showed moderate levels of overconfidence, anchoring, regret aversion, loss aversion, and representativeness biases. Scores for financial literacy and awareness were comparatively high, indicating the capacity to make sound financial decisions. Internal consistency across notions was supported by Cronbach’s Alpha values that were higher than the permitted minimum. To improve dependability, items with negative or very low alphas were eliminated. Scale consistency was confirmed by composite reliability scores for all constructs exceeding the suggested 0.70 criterion [63].
The reliability of the measurement scales was assessed using Cronbach’s alpha, and a summary of the measures and their corresponding reliability coefficients is presented in Table 3.
All constructs had KMO statistics more than 0.70, and sampling adequacy was confirmed by Bartlett’s test, which was significant at p < 0.001. All of the constructs in this test have KMOs between 0.698 and 0.985, indicating that the values are more than 0.5, as seen in the above table. In addition, to ensure concept validity, a large and significant Bartlett’s test of sphericity is required [64]. At an alpha level of 0.05, “Bartlett’s test of sphericity” is significant for each topic in this analysis. As a result, any construct is considered appropriate for analysis. The outcomes of the data adequacy and validity tests are reported in Table 4, confirming the suitability of the dataset for subsequent analyses.
Construct validity was established when factor loadings exceeded 0.60. AVE values greater than 0.50 were used to confirm convergent validity, while Fornell–Larcker and HTMT criteria were used to establish discriminant validity. Since VIF values stayed below suggested limits, no multicollinearity issues were found. Multicollinearity arises when variables are highly correlated, making it difficult to isolate the effect of individual predictors [65]. In regression analysis, it is typically assessed using tolerance and variance inflation factor (VIF) values, as well as correlation coefficients. In this study, VIF values ranged from 1.037 to 2.319, well below the conservative threshold of 3.3, indicating no multicollinearity concerns. Therefore, the assumption of no multicollinearity is satisfied, and the variables are suitable for inclusion in the PLS-SEM model, supporting reliable structural analysis. Table 5 summarizes the variance inflation factor (VIF) values, confirming that multicollinearity is not a concern in the measurement model.
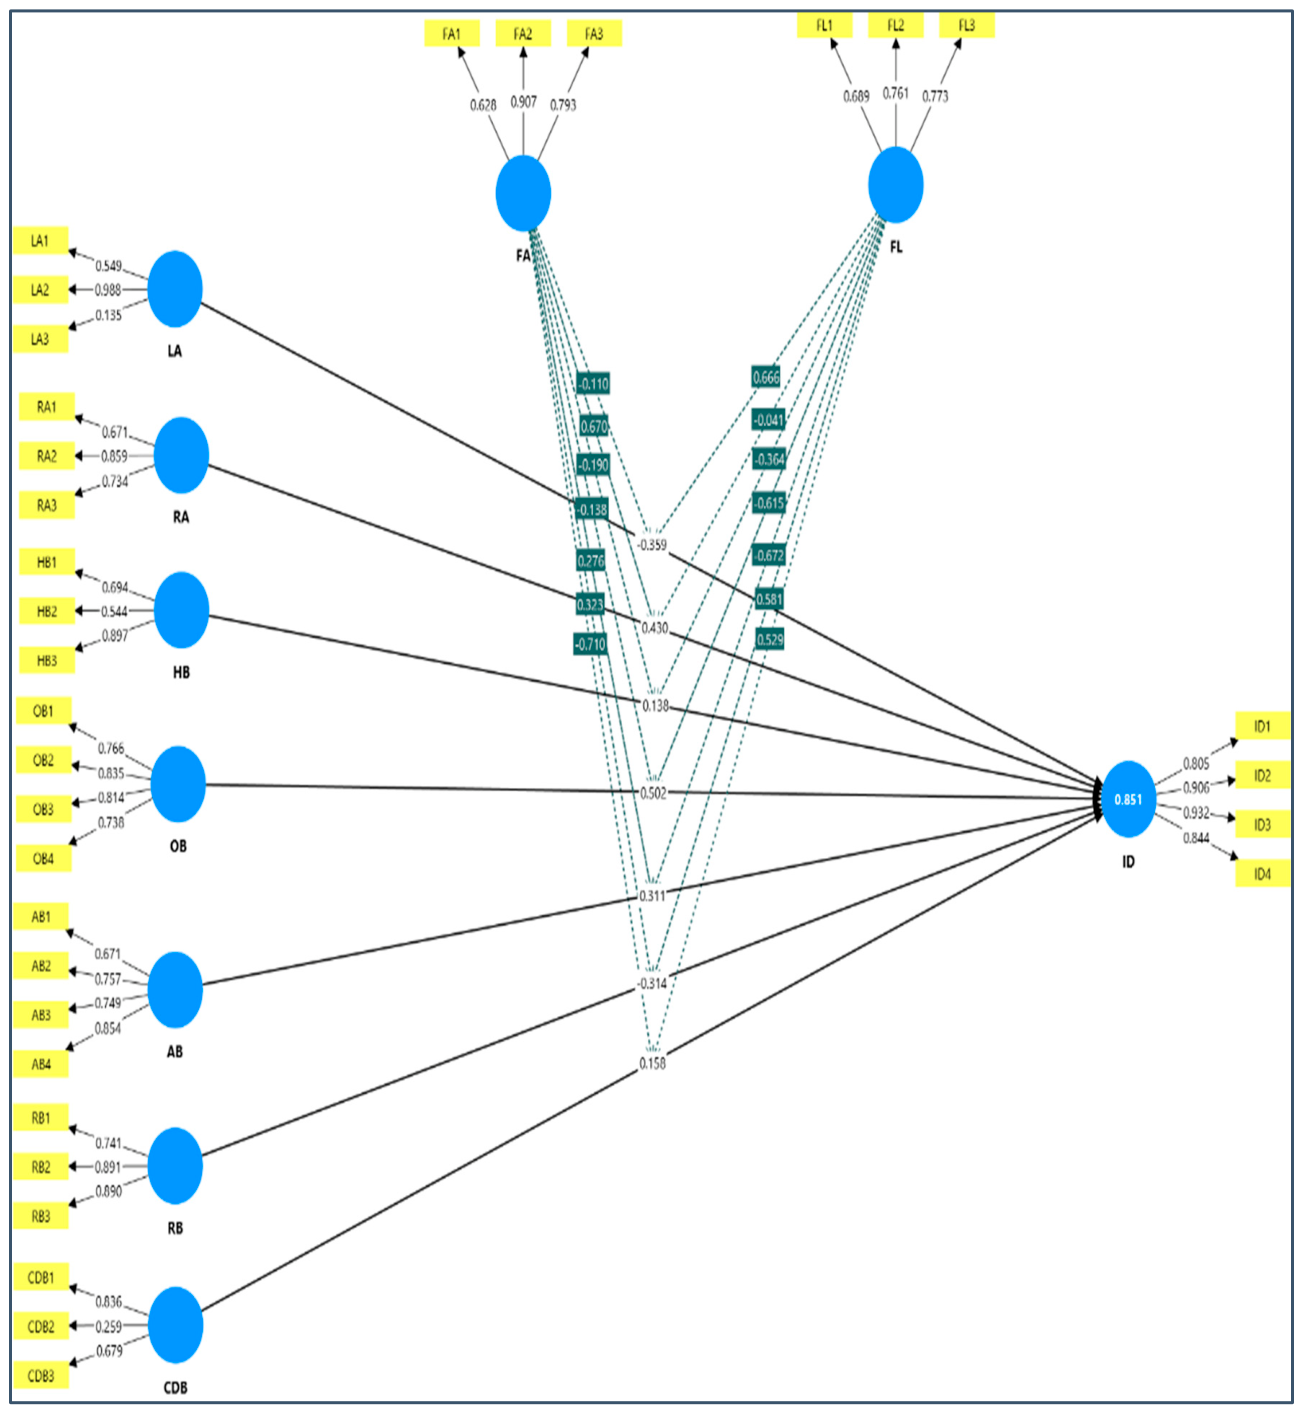
The measurement model employed in this study is presented in Figure 3. Strong correlations between two variables are known as multicollinearity. As multicollinearity rises, it becomes increasingly difficult to assess the influence of any one variable because of its significant association with other variables, making the interpretation of the results more difficult [66]. If the tolerance value is larger than 1.0 and the “variance inflation factor (VIF)” value is less than 1.0, multiple regression analysis shows that multicollinearity among the variables is not a problem. Multicollinearity can also be found using the correlation coefficients (r) between variables. A high R-squared value greater than 0.8 may suggest the existence of multicollinearity. There was no indication of multicollinearity among the items in the current study, as all VIF values varied from 1.037 to 2.319, which are much below the conservative criterion of 3.3. These findings verify that the multicollinearity condition is met and that there is no excessive correlation between any of the model’s predictor variables. The indications support the validity of additional structural analysis and are suitable for incorporation into the PLS-SEM model.
Strong validity and reliability were shown by the PLS-SEM measurement paradigm. The standardized outer loadings were statistically significant and more than 0.60. Convergent validity and appropriate internal consistency were validated by composite reliability and AVE scores. The results of the reliability and convergent validity assessment, including factor loadings, composite reliability, average variance extracted, and Cronbach’s alpha, are summarized in Table 6.
A model is deemed appropriate if its internal consistency reliability rating is greater than 0.70; a value less than 0.60 denotes a lack of dependability. Second, composite reliability can be read similarly to Cronbach’s alpha and takes into consideration the fact that indicators have varying loadings. Cronbach’s alpha may exaggerate or underestimate the scale’s dependability.
The Heterotrait–Monotrait ratio of correlations (HTMT), a reliable criterion put forth by Henseler et al. (2017) [45], was used to evaluate discriminant validity. As shown in Table 7, all HTMT values are within the recommended threshold, confirming adequate discriminant validity among the constructs. The results show that discriminant validity was proven for each pair of constructs, since all HTMT values were below 0.90. While falling within acceptable ranges, a handful of the values approached the cutoff. Moderate associations were suggested by the constructs with the highest values in the (Table 8) matrix, namely LA–CDB (HTMT = 0.827), HB–CDB (HTMT = 0.820), RA–CDB (HTMT = 0.752), and AB–RB (HTMT = 0.762). However, discriminant validity is preserved because none exceeded the 0.90 cutoffs. Lower HTMT values, namely FA–OB (HTMT = 0.300) and FL–RA (HTMT = 0.283), further corroborate the uniqueness of these constructs. These results support the notion that each construct in the model measures a conceptually separate event.
Additionally, the square root of the AVE should be greater than the correlations between the latent components, according to Fornell and Larcker [67]. The average variances gathered fall within the acceptable range of 0.527 to 0.763, as Table 9 demonstrates. The correlations between the latent constructs (values in bold face) in Table 10 were compared using the square root of the recovered average variances. Additionally, the table indicates sufficient discriminant validity because the square root of the AVE was greater than the correlation between the latent constructs [67].
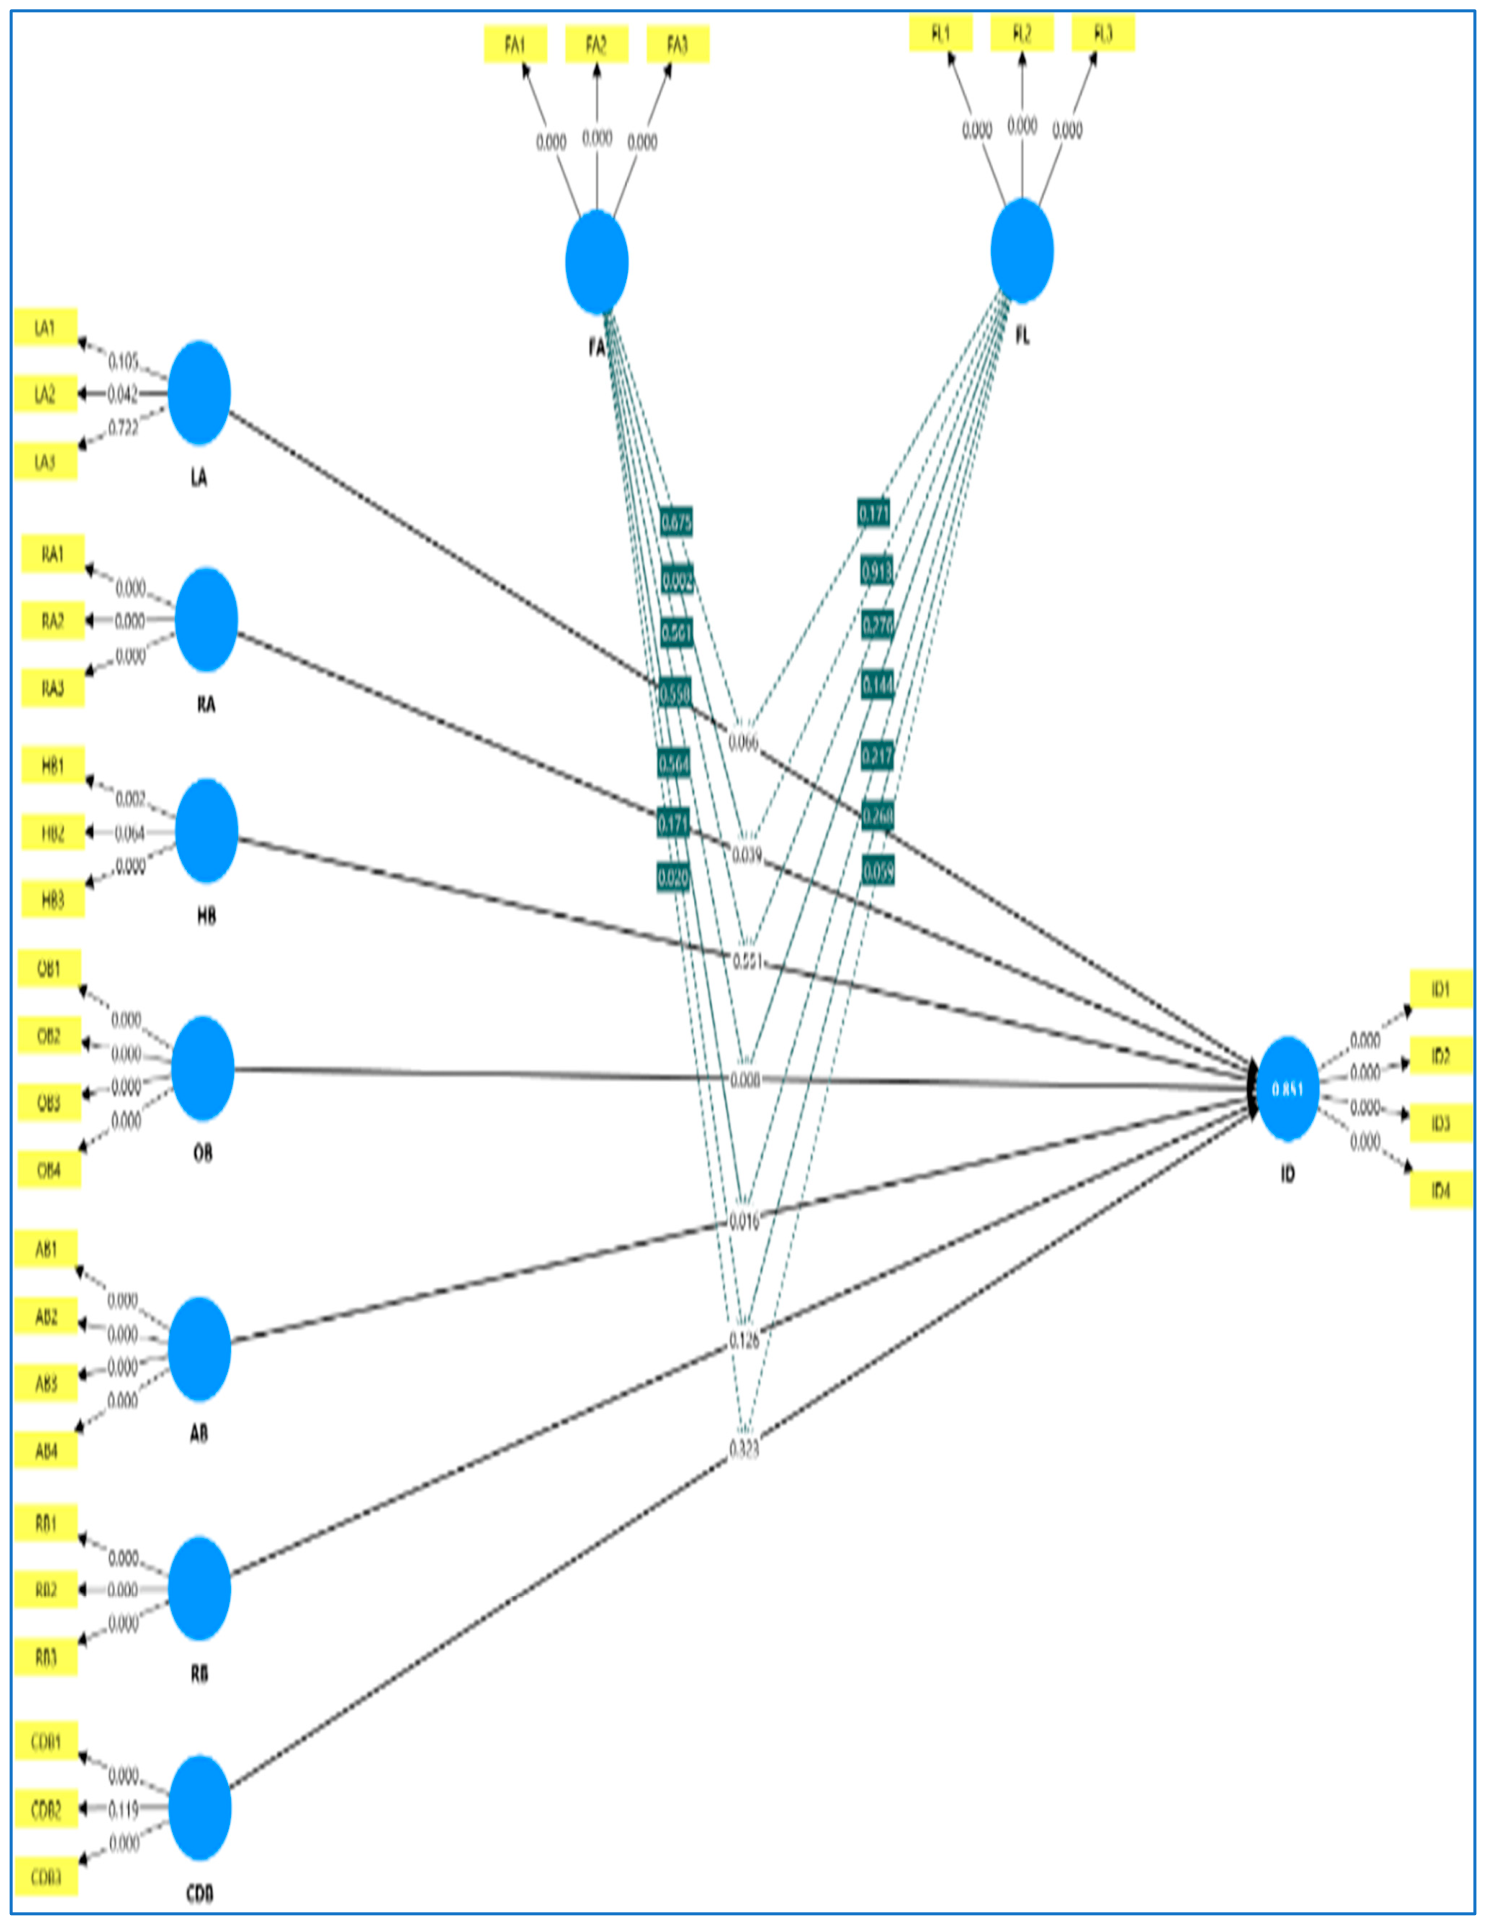
The current study assessed the structural model after identifying the measurement model. Using 444 instances and 5000 bootstrap samples, the current study additionally used the traditional bootstrapping technique to evaluate the significance of the path coefficients [45,65,68]. Consequently, the estimates for the full structural model—which includes the moderator variable—are shown below.
  • Structural Model Results and Hypotheses Testing
The structural model was evaluated using the bootstrapping procedure in PLS-SEM to examine the direct relationships between behavioral biases, financial awareness, financial literacy, and investment decisions. The significance of the hypothesized relationships was assessed using path coefficients, t-statistics, and p-values. A hypothesis was considered supported when the p-value was less than 0.05. Figure 4 presents the full structural model, including the moderator variables, generated using SmartPLS 4.
The results indicate that all nine hypothesized direct relationships are statistically significant and therefore supported.
Anchoring Bias (AB) exhibited a significant negative effect on investment decisions (β = −0.397, t = 2.405, p = 0.016), supporting H1. This suggests that investors who rely excessively on initial information or reference points tend to make less rational investment decisions.
Cognitive Dissonance Bias (CDB) was also found to have a significant negative influence on investment decisions (β = −0.367, t = 2.589, p = 0.003), supporting H2. The finding indicates that investors experiencing cognitive dissonance are more likely to ignore contradictory information, adversely affecting their investment choices.
Similarly, Herding Bias (HB) demonstrated a significant negative relationship with investment decisions (β = −0.374, t = 2.996, p = 0.001), supporting H3. This implies that investors who follow the actions of others without independent analysis tend to make suboptimal investment decisions.
The effect of Loss Aversion (LA) on investment decisions was found to be significantly negative (β = −0.351, t = 2.736, p = 0.016), supporting H4. This result suggests that investors’ tendency to avoid losses rather than pursue gains may impair effective investment decision-making.
Overconfidence Bias (OB) showed the strongest negative effect among all behavioral biases on investment decisions (β = −0.436, t = 2.859, p = 0.008), supporting H5. This finding indicates that excessive confidence in one’s knowledge and abilities can lead to poorer investment outcomes.
The results further reveal that Regret Aversion (RA) has a significant negative impact on investment decisions (β = −0.246, t = 2.062, p = 0.039), supporting H6. Investors attempting to avoid future regret may delay or avoid investment actions, thereby reducing decision quality.
Likewise, Representativeness Bias (RB) was found to negatively influence investment decisions (β = −0.218, t = 2.532, p = 0.026), supporting H7. This indicates that investors who make judgments based on stereotypes or recent experiences rather than objective analysis are likely to make less effective investment decisions.
In contrast, Financial Awareness (FA) exhibited a significant positive effect on investment decisions (β = 0.395, t = 2.142, p = 0.032), supporting H8. This finding suggests that greater awareness of financial products, markets, and investment opportunities enhances the quality of investors’ decision-making.
Similarly, Financial Literacy (FL) demonstrated a significant positive influence on investment decisions (β = 0.345, t = 2.934, p = 0.002), supporting H9. This result indicates that investors with higher levels of financial knowledge and understanding are better equipped to make informed and rational investment decisions.
Overall, the structural model findings confirm that behavioral biases adversely affect investment decision-making, whereas financial awareness and financial literacy contribute positively to better investment decisions. Among the behavioral biases, Overconfidence Bias emerged as the most influential negative predictor, while Financial Awareness showed the strongest positive effect on investment decisions. These findings are consistent with the principles of behavioral finance, which suggest that psychological biases can impair investor rationality, while financial knowledge and awareness can mitigate such effects and improve investment outcomes.
This study examined how behavioral biases, financial awareness, and financial literacy impact investment decision-making using a structural equation modeling approach (PLS-SEM). The results supported each of the nine hypothesized associations and offered significant insights into how financial and psychological factors affect investors’ decisions.
The association between behavioral biases and investment decisions is considerably moderated by both financial literacy (FL) and financial awareness (FA), according to the interaction (moderation) effects:
The moderating effects of Financial Awareness (FA) and Financial Literacy (FL) on the relationship between behavioral biases and Investment Decision-making (ID) were examined using the bootstrapping procedure in PLS-SEM. The significance of moderation effects was assessed through path coefficients, t-statistics, and p-values. The results are presented in Table 10.
  • Moderating Role of Financial Awareness
The findings reveal that Financial Awareness significantly moderates the relationship between all seven behavioral biases and investment decision-making. Specifically, the interaction effects of FA with Anchoring Bias (β = 0.489, t = 2.577, p = 0.014), cognitive dissonance bias (β = 0.702, t = 2.332, p = 0.020), Herding Bias (β = 0.415, t = 2.581, p = 0.001), Loss Aversion (β = 0.444, t = 3.419, p = 0.005), Overconfidence Bias (β = 0.367, t = 3.587, p = 0.008), Regret Aversion (β = 0.534, t = 3.150, p = 0.002), and Representativeness Bias (β = 0.554, t = 2.368, p = 0.007) were all found to be statistically significant.
The positive interaction coefficients indicate that Financial Awareness weakens the negative influence of behavioral biases on investment decision-making. In other words, investors possessing higher levels of financial awareness are better able to recognize and mitigate the adverse effects of psychological biases, resulting in more rational and informed investment decisions. Among all moderation effects, the strongest influence was observed for the interaction between Financial Awareness and cognitive dissonance bias (β = 0.702), suggesting that awareness plays a particularly important role in reducing the detrimental impact of confirmation-seeking behavior on investment choices.
  • Moderating Role of Financial Literacy
The moderating effects of Financial Literacy were also found to be significant for most behavioral biases. The interaction effects of FL with Anchoring Bias (β = 0.436, t = 3.236, p = 0.017), Herding Bias (β = 0.496, t = 3.089, p = 0.006), Loss Aversion (β = 0.332, t = 2.371, p = 0.011), Overconfidence Bias (β = 0.435, t = 2.462, p = 0.004), Regret Aversion (β = 0.321, t = 2.011, p = 0.013), and Representativeness Bias (β = 0.448, t = 2.108, p = 0.008) were statistically significant.
These positive coefficients suggest that higher financial literacy reduces the adverse impact of these biases on investment decision-making. Financially literate investors are likely to possess greater analytical capabilities and knowledge, enabling them to evaluate investment opportunities more objectively and avoid irrational decision-making patterns.
However, the moderating effect of Financial Literacy on the relationship between cognitive dissonance bias and Investment Decision-making was not significant (β = 0.009, t = 1.109, p = 0.253). Therefore, Hypothesis H18 was not supported. This finding implies that financial literacy alone may not be sufficient to mitigate cognitive dissonance bias, as investors may continue to selectively seek information that confirms their existing beliefs regardless of their level of financial knowledge.
Overall, the moderation analysis demonstrates that both Financial Awareness and Financial Literacy play important roles in shaping the impact of behavioral biases on investment decision-making. Financial Awareness emerged as a stronger and more consistent moderator, significantly influencing all seven behavioral bias relationships. In contrast, Financial Literacy significantly moderated six of the seven relationships, with the exception of cognitive dissonance bias.
These findings suggest that while financial knowledge is important, awareness regarding financial products, market conditions, and investment risks may be even more effective in helping investors overcome behavioral biases. Consequently, policymakers, financial educators, and investment advisors should focus not only on improving financial literacy but also on enhancing investors’ financial awareness through targeted educational programs and investor protection initiatives.
  • Summary of Moderation Results
    • Financial Awareness (FA): Significant moderator for all seven behavioral biases (H10–H16 supported).
    • Financial Literacy (FL): Significant moderator for six behavioral biases (H17, H19–H23 supported).
    • Non-significant effect: FL × cognitive dissonance bias → ID (H18 not supported).
    • Strongest moderation effect: FA × cognitive dissonance bias → ID (β = 0.702).
    • Conclusion: Financial Awareness demonstrates a stronger moderating influence than Financial Literacy in reducing the negative effects of behavioral biases on investment decision-making.
This study looked at the moderating effects of financial literacy (FL) and financial awareness (FA) on the relationships between behavioral biases and investment decision-making. The results of the structural model demonstrate that most interaction effects were statistically significant, suggesting that both FA and FL are crucial for lessening the negative influence of behavioral biases on investment decisions.
With an R2 value of 0.851 (Table 11), the exogenous constructs explained the endogenous latent variable, Investment Decision (ID). This means that the combined influence of behavioral biases, financial awareness, and financial literacy, including their interaction effects, accounts for 85.1% of the variance in investment decisions. The structural model’s resilience in predicting investment behavior is supported by this high R2 value, which indicates a significant degree of explanatory power [65].
The combination of a low SRMR and a high NFI (Table 12) suggests that the proposed structural model is statistically sound and appropriate for further interpretation of the path linkages and moderating effects. The satisfactory model fit supports the study’s conclusions, which look at how behavioral biases, financial awareness, and financial literacy affect investing decisions.
The findings clearly indicate that behavioral biases significantly influence investment decisions, supporting the core premise of behavioral finance that investors are not fully rational.
  • Overconfidence Bias showed a strong negative impact, suggesting that investors tend to overestimate their knowledge and abilities, leading to excessive risk-taking.
  • Herd Behavior indicates that investors rely heavily on others’ actions, particularly during market uncertainty.
  • Anchoring Bias reflects dependence on initial information, limiting adaptive decision-making.
  • Economic Interpretation
These results imply that investor decisions are driven more by psychological tendencies than by objective financial analysis. This has serious implications for market efficiency and investor welfare.
  • Role of Financial Literacy & Awareness
Both financial literacy and financial awareness:
  • Positively influence investment decisions.
  • Reduce susceptibility to behavioral biases.
  • Improve rational decision-making.
  • Moderation Effects
The moderating analysis reveals that:
  • Financial awareness significantly weakens the negative effects of all behavioral biases
  • Financial literacy also mitigates most biases, although its effect on cognitive dissonance was not significant
This suggests that awareness (practical understanding) may sometimes be more effective than technical knowledge alone.
  • Comparison with Literature
The findings align with previous studies (e.g., [12,49]) but extend the literature by:
  • Demonstrating dual moderating effects.
  • Providing India-specific empirical evidence.

5. Conclusions and Suggestions

This study examined how behavioral biases, financial literacy, and financial awareness jointly shape the investment decisions of retail investors, using evidence from 444 retail investors in Kolkata, India. While the findings provide valuable insights into investor behavior within a major metropolitan financial center, they should be interpreted within the context of the study sample. Given the geographic concentration of respondents in Kolkata, the results may not fully reflect the behavioral characteristics of retail investors across India’s diverse regional, cultural, and socioeconomic settings. Therefore, caution should be exercised when generalizing the findings to the broader population of Indian retail investors. Rather than viewing investor behavior solely through the lens of irrationality, the findings suggest a more nuanced perspective: while behavioral biases continue to exert a significant influence on investment choices, their effects are not immutable. Financial literacy and financial awareness emerge as important corrective mechanisms that strengthen decision quality and reduce investors’ vulnerability to behavioral distortions.
The findings indicate that behavioral biases remain deeply embedded in the investment process, with anchoring, cognitive dissonance, herd behavior, and overconfidence exerting particularly strong influences on investor decision-making. This pattern suggests that investors often rely on simplified cognitive shortcuts and social cues when confronted with uncertainty, despite increasing access to financial information and digital investment platforms. At the same time, the results demonstrate that financial literacy and financial awareness not only directly enhance investment decision quality but also weaken the adverse effects of several behavioral biases. Taken together, these findings highlight that investor behavior is shaped by the interaction between psychological tendencies and financial capability factors rather than by either dimension in isolation.
The study offers several practical implications that are directly informed by the empirical evidence. First, because anchoring and overconfidence emerged as dominant biases, investor education programs should place greater emphasis on critical evaluation of information, portfolio diversification, and risk assessment rather than focusing exclusively on financial products and market knowledge. Second, the significant moderating effects of financial literacy and awareness suggest that policy interventions aimed at improving investor capability can serve as effective tools for mitigating behavioral biases. Consequently, regulators such as SEBI and RBI should strengthen targeted financial education initiatives, particularly for first-time and digitally active investors. Third, fintech firms and brokerage platforms can incorporate behavioral safeguards—such as portfolio review prompts, risk alerts, and decision-delay mechanisms—to reduce impulsive and bias-driven trading behavior. Such interventions are particularly relevant in India’s rapidly expanding digital investment ecosystem, where increased market participation may simultaneously amplify behavioral risks.
  • Limitations of the Study
Despite providing valuable insights into the influence of behavioral biases on investment decision-making and the moderating roles of financial literacy and financial awareness, this study has several limitations that should be acknowledged.
First, the study was conducted exclusively among retail stock market investors in Kolkata, India. Although Kolkata represents an important metropolitan investment market, the findings may not fully capture the behavioral characteristics of investors from other regions of India, particularly those residing in rural areas, smaller cities, or regions with different socioeconomic and cultural contexts. Therefore, caution should be exercised when generalizing the results to the entire Indian investor population. Second, the sample predominantly consisted of younger and relatively well-educated investors. Since investment behavior may vary across age groups, educational backgrounds, and levels of investment experience, the findings may not adequately represent older investors or individuals with lower educational attainment. Third, the study relied on a self-reported questionnaire for data collection. Self-reported responses are susceptible to common method bias, social desirability bias, recall errors, and subjective interpretation of questions. Consequently, the reported behavioral tendencies may not perfectly reflect actual investment behavior in real-world market situations. Fourth, the research employed a cross-sectional design, collecting data at a single point in time. Investor behavior and psychological biases can evolve in response to changing market conditions, economic events, and personal financial circumstances. Finally, although the study examined seven prominent behavioral biases along with financial literacy and financial awareness, other potentially relevant psychological, demographic, and contextual factors were not incorporated into the model. Future studies may consider additional variables to provide a more comprehensive understanding of investment decision-making. Given these limitations, the findings should be interpreted primarily within the context of retail investors in Kolkata. Nevertheless, the study contributes to the growing behavioral finance literature by providing empirical evidence on the interaction between behavioral biases, financial literacy, financial awareness, and investment decision-making in an emerging market setting.
The principal scholarly contribution of this study lies in demonstrating that financial literacy and financial awareness function not only as direct determinants of investment decisions but also as behavioral safeguards that attenuate the influence of psychological biases. By integrating seven behavioral biases with two financial capability constructs within a single empirical framework, this research advances the behavioral finance literature beyond fragmented approaches that examine these factors independently. Furthermore, by providing contemporary evidence from India—a rapidly digitalizing and increasingly important emerging market—the study extends the external validity of behavioral finance theory and offers context-specific insights into how investor capability can moderate irrational decision-making. In doing so, the research contributes to a more comprehensive understanding of investor behavior and provides a foundation for future investigations into the interaction between behavioral and capability-based determinants of financial decision-making.
The study’s hypotheses are mapped against previous research in Table 13.
Practical Implications and Future Suggestions.
Table 13. Comparison of Hypotheses with prior studies.
HypothesisKey Findings in the Present StudySupporting StudiesContradictory/Mixed Evidence
H1: Anchoring Bias → Investment DecisionsSignificant negative effect[52,69,70]None
H2: Cognitive Dissonance Bias → Investment DecisionsSignificant effect[71,72]None
H3: Herd Behavior Bias → Investment DecisionsStrong effect[73,74]None
H4: Loss Aversion Bias → Investment DecisionsPartial support[29,75,76]Some Indian market studies show weaker effects
H5: Overconfidence Bias → Investment DecisionsMixed evidence (risk-taking but uneven returns)[77]Some studies show stronger and more consistent negative outcomes
H6: Regret Aversion Bias → Investment DecisionsStrong support[78,79] None
H7: Representativeness Bias → Investment DecisionsSignificant effect[80,81]None
H8–H9: Financial Literacy (moderating effects)Mitigates biases, improves decisions[14,82,83]None
H10–H11: Financial Awareness (moderating effects)Novel evidence of buffering biases[55,84,85]Limited prior studies → area of divergence
Source: Authors’ Literature Review.
  • Contribution to the Future of Behavioral Finance
Overall, this study contributes significantly to the evolving discourse on behavioral finance by providing a comprehensive, empirically validated framework that captures the interplay between psychological biases and financial capability factors. As financial markets continue to digitalize and retail participation expands, understanding and managing behavioral influences will become increasingly critical. By highlighting the corrective role of financial literacy and awareness, this research not only advances academic knowledge but also offers actionable insights for policymakers, educators, and financial institutions. In the coming years, such integrated approaches will be essential for fostering resilient, informed, and behaviorally balanced investors, ultimately contributing to the stability and efficiency of financial markets in India and other emerging economies.


Author Contributions

Conceptualization, U.S., F.U., M.R.-u.-R. and M.B.H.; methodology, U.S., F.U., A.I., R.K. and M.B.H.; software, M.R.-u.-R., A.I. and R.K.; validation, F.U. and M.B.H.; formal analysis, U.S., F.U., R.K. and M.R.-u.-R.; investigation, F.U., A.I. and M.B.H.; resources, U.S., F.U., A.I. and M.R.-u.-R.; data curation, F.U., A.I. and M.B.H.; writing—original draft, U.S., F.U., R.K. and M.R.-u.-R.; writing—review and editing, U.S., F.U., R.K., A.I. and M.B.H.; visualization, A.I. and M.B.H.; project administration, U.S. and F.U.; supervision, M.B.H.; funding acquisition, M.B.H. All authors have read and agreed to the published version of the manuscript.

Funding

This research work did not receive any specific funding from any specific body or organization.

Institutional Review Board Statement

Ethical review and approval were waived for this study because it involved an anonymous questionnaire-based survey of adult participants, collected only anonymized data, posed no more than minimal risk to participants, and did not involve sensitive personal information or commercial interests. The study was conducted in accordance with the ethical principles of the Declaration of Helsinki. Participation was voluntary, and participants were free to withdraw at any time without consequence. The study involved a voluntary online survey of adult retail investors and did not collect any personally identifiable information. Participation was entirely voluntary, and informed consent was obtained electronically before respondents proceeded to the questionnaire. Participants were informed of the purpose of the study, their right to discontinue participation at any time, and the anonymous nature of data collection. No identifying information, including names, contact details, or IP addresses, was collected or retained. Data were stored in password-protected files accessible only to the research team and were analyzed exclusively in aggregated form. Because the survey involved anonymous responses from adult participants and posed minimal risk, no formal institutional ethical review was required under the applicable institutional procedures at the time of data collection. The anonymized dataset may be made available by the corresponding author upon reasonable request for academic research purposes.

Informed Consent Statement

It was obtained orally from all participants before the survey. As the study involved an anonymous, minimal-risk questionnaire, no written informed consent form was used or distributed to participants. Participants were informed about the study objectives, the voluntary nature of participation, confidentiality, anonymity, and their right to withdraw at any time.

Data Availability Statement

The datasets presented in this article are not readily available because data were stored in password-protected files accessible only to the research team and were analyzed exclusively in aggregated form. The data presented in this study are available on request from the corresponding author.

Acknowledgments

We sincerely thank the anonymous reviewers of this paper for their insightful and helpful recommendations.

Conflicts of Interest

The authors hereby declare no conflicts of interest.

Appendix A

Survey Measurements
ConstructsCodesItemsReferences
Loss Aversion Bias (LA)LA1I avoid selling my investments if their value comes down.[25]
LA2After a prior gain, I am more risk-seeking than usual.
LA3After a prior loss, I become more risk averse.
Regret Aversion Bias (RA)RA1I regret not being able to buy/sell an investment when the opportunity arises.[15]
RA2I clarify that I am not earning the required return on my investments.
RA3I avoid selling investments that have decreased in value and readily sell investments that have increased in value.
RA4I feel more sorrow about holding losing investments for too long than about selling winning investments too soon.
Herd Behavior Bias (HB) HB1My opinion towards an investment will change if all my colleagues start buying/selling that investment.[30]
HB2The decisions of other investors regarding investment types have an impact on my investment decisions.
HB3I usually react quickly to the changes in other investors’ decisions and follow their reactions to the market.
Overconfidence Bias (OB)OB1I am always confident that my skills and knowledge will enable me to outperform the market.[25]
OB2I am generally sure about my decisions because I made more profits than losses.
OB3I always feel confident that I have enough money to support my investment decisions, regardless of how long it takes.
OB4I usually can anticipate the end of good or poor investment returns in the market.
Anchoring Bias (AB)AB1I fix a target price for buying/selling an investment.[17]
AB2I never withdraw an investment even if it shows a declining trend.
AB3I rely on my previous market experiences for my next investment.
AB4Based on recent market trends, I forecast future changes in investments.
Representativeness Bias (RB)RB1I think that the future trend of an investment might be predicted based on its past price movements.[30]
RB2If my investment information contradicts the news of a renowned analyst, I would change my decision immediately.
RB3I only buy/sell an investment after considering its past returns.
RB4I use trend analysis of representative investments to inform decisions for all assets I invest in.
Cognitive Dissonance Bias (CDB)CDB1I feel very anxious after incurring losses on my investments.[20]
CDB2After making any decision, I am always anxious about whether I made the right or wrong choice.
CDB3After I make an investment decision, I often feel that I no longer need it.
CDB4After I invested, I feel I should not have invested in anything at all.
CDB5After I invested in it, I feel I have made the right decision.
Financial Awareness (FA)FA1I am not worried if I do not have money because I can also take out a loan.[51]
FA2I trust the advertisements promoting financial products.
FA3My current money is always worth more than my future money (what I will save in the future).
FA4I constantly monitor external circumstances and economic events that affect my budget.
FA5I try not to spend all my money; I set some aside for the future.
FA6I am always well-informed before I make financial decisions.
Financial Literacy (FL)FL1I save at least 10% of my income monthly.[10]
FL2I put my investment and savings in banks as I trust financial institutions.
FL3I am prepared to risk some of my own money when investing.
FL4I am confident that in the event of an emergency, I could access up to three months’ worth of my household income.
FL5My current investment portfolio is diversified to balance the risks.
FL6I consider the interest or the earnings before I invest.
Investment Decision (ID)ID1I am fully capable of making personal investment decisions.[51]
ID2I am confident in my ability to make personal investment decisions.
ID3My past experiences have increased my confidence in making informed and successful personal investment decisions.
ID4Utilizing the available investment information is well within my abilities.
Source: Compiled from several sources.

References

  1. Baker, H.K.; Ricciardi, V. How biases affect investor behaviour. Eur. Financ. Rev. 2014, 7–10. Available online: https://ssrn.com/abstract=2457425 (accessed on 18 April 2026). [CrossRef]
  2. Chaves, J.F. Misbehaving: The Making of Behavioral Economics; Thaler, R.H., Ed.; W.W. Norton and Company: New York, NY, USA, 2016. [Google Scholar] [CrossRef]
  3. Sanyal, U.; Uddin, F. An empirical study on financial well-being during the COVID-19 in India. Int. J. Financ. Serv. Manag. 2023, 11, 269–281. [Google Scholar] [CrossRef]
  4. Ricciardi, V.; Simon, H.K. What is behavioral finance? Bus. Educ. Technol. J. 2000, 2, 1–9. Available online: https://ssrn.com/abstract=256754 (accessed on 18 April 2026).
  5. National Stock Exchange of India. Annual Report 2023–24. 2024. Available online: https://www.nseindia.com (accessed on 18 April 2026).
  6. Reserve Bank of India. Annual Report 2022–23. 2023. Available online: https://www.rbi.org.in (accessed on 18 April 2026).
  7. Bombay Stock Exchange. Annual Report 2022–2023. 2023. Available online: https://www.bseindia.com (accessed on 18 April 2026).
  8. Kumar, S.; Goyal, N. Evidence on rationality and behavioural biases in investment decision making. Qual. Res. Financ. Mark. 2016, 8, 270–287. [Google Scholar] [CrossRef]
  9. Barber, B.M.; Odean, T. The behavior of individual investors. In Handbook of the Economics of Finance; Constantinides, G.M., Harris, M., Stulz, R.M., Eds.; Elsevier: Amsterdam, The Netherlands, 2013; Volume 2, pp. 1533–1570. [Google Scholar] [CrossRef]
  10. Lusardi, A.; Mitchell, O.S. The economic importance of financial literacy: Theory and Evidence. J. Econ. Lit. 2014, 52, 5–44. [Google Scholar] [CrossRef] [PubMed]
  11. Baker, H.K.; Nofsinger, J.R. (Eds.) Behavioral Finance: Investors, Corporations, and Markets; Wiley: Hoboken, NJ, USA, 2010. [Google Scholar] [CrossRef]
  12. Lusardi, A. Financial literacy and the need for financial education: Evidence and implications. Swiss J. Econ. Stat. 2019, 155, 1. [Google Scholar] [CrossRef]
  13. Antony, A. Behavioral finance and portfolio management: Review of theory and literature. J. Public Aff. 2019, 20, e1996. [Google Scholar] [CrossRef]
  14. Kiszl, P. The financial literacy competency map of librarians. In EDULEARN22 Proceedings; IATED: Palma, Spain, 2022; pp. 6209–6218. [Google Scholar] [CrossRef]
  15. Weber, E.U.; Blais, A.-R.; Betz, N.E. A domain-specific risk-attitude scale: Measuring risk perceptions and risk behaviors. J. Behav. Decis. Mak. 2002, 15, 263–290. [Google Scholar] [CrossRef]
  16. Al-Tamimi, H.A.H.; Bin Kalli, A.A. Financial literacy and investment decisions of UAE investors. J. Risk Financ. 2009, 10, 500–516. [Google Scholar] [CrossRef]
  17. Zaiane, S. Behavioral biases of individual investors: The effect of anchoring. Eurasian J. Soc. Sci. 2015, 3, 13–19. [Google Scholar] [CrossRef]
  18. Schirpke, U.; Tasser, E.; Borsky, S.; Braun, M.; Eitzinger, J.; Gaube, V.; Getzner, M.; Glatzel, S.; Gschwantner, T.; Kirchner, M.; et al. Past and future impacts of land-use changes on ecosystem services in Austria. J. Environ. Manag. 2023, 345, 118728. [Google Scholar] [CrossRef] [PubMed]
  19. Shefrin, H. Behavioral corporate finance. J. Appl. Corp. Financ. 2001, 14, 113–126. [Google Scholar] [CrossRef]
  20. Sweeney, J.C.; Soutar, G.N.; Mazzarol, T. Word of mouth: Measuring the power of individual messages. Eur. J. Mark. 2012, 46, 237–257. [Google Scholar] [CrossRef]
  21. Ajzen, I. The theory of planned behaviour. Organ. Behav. Hum. Decis. Process 1991, 50, 179–211. [Google Scholar] [CrossRef]
  22. Statman, M. Behaviorial Finance: Past Battles and Future Engagements. Financ. Anal. J. 1999, 55, 18–27. [Google Scholar] [CrossRef]
  23. Thaler, R.H. Advances in Behavioral Finance; Princeton University Press: Princeton, NJ, USA, 2005; Volume 2, 744p. [Google Scholar] [CrossRef]
  24. Shiller, R.J. From efficient markets theory to behavioral finance. J. Econ. Perspect. 2003, 17, 83–104. [Google Scholar] [CrossRef]
  25. Michailova, J.; Schmidt, U. Overconfidence and bubbles in experimental asset markets. J. Behav. Financ. 2016, 17, 280–292. [Google Scholar] [CrossRef]
  26. Kahneman, D.; Tversky, A. Prospect theory: An analysis of decision under risk. Econometrica 1979, 47, 263–292. [Google Scholar] [CrossRef]
  27. Dwyer, J. Ethics and economics: Bridging Adam Smith’s Theory of moral sentiments and Wealth of nations. J. Br. Stud. 2005, 44, 662–687. [Google Scholar] [CrossRef] [PubMed]
  28. Palanisamy, M.; Paul Vincent, M.T.; Hossain, M.B. Financial literacy and behavioral intention to use central banks’ digital currency: Moderating role of trust. J. Risk Financ. Manag. 2025, 18, 165. [Google Scholar] [CrossRef]
  29. Barberis, N.; Thaler, R. A survey of behavioral finance. In Handbook of the Economics of Finance; Constantinides, G.M., Harris, M., Stulz, R.M., Eds.; Elsevier: Amsterdam, The Netherlands, 2003; Volume 1, pp. 1053–1128. [Google Scholar] [CrossRef]
  30. Ritika; Kishor, N. Development and validation of behavioral biases scale: A SEM approach. Rev. Behav. Financ. 2022, 14, 237–259. [Google Scholar] [CrossRef]
  31. Statman, M. Behavioral finance: Finance with normal people. Borsa Istanb. Rev. 2014, 14, 65–73. [Google Scholar] [CrossRef]
  32. de Bondt, W.F.M.; Thaler, R. Does the stock market overreact? J. Financ. 1985, 40, 793–805. [Google Scholar] [CrossRef]
  33. Hirshleifer, D. Behavioral finance. Annu. Rev. Financ. Econ. 2015, 7, 133–159. [Google Scholar] [CrossRef]
  34. Toma, F.-M. Behavioral biases of the investment decisions of Romanian investors on the Bucharest Stock Exchange. Procedia Econ. Financ. 2015, 32, 200–207. [Google Scholar] [CrossRef]
  35. Securities and Exchange Board of India. Annual Report 2021–22. 2022. Available online: https://www.sebi.gov.in (accessed on 18 April 2026).
  36. Kumar, S.; Goyal, N. Behavioural biases in investment decision making. Qual. Res. Financ. Mark. 2015, 7, 88–108. [Google Scholar] [CrossRef]
  37. Banerjee, A.V. A simple model of herd behavior. Q. J. Econ. 1992, 107, 797–817. [Google Scholar] [CrossRef]
  38. Sahu, M.; Uddin, F.; Hossain, M.B. Exploring the psychological drivers of cryptocurrency investment biases: Evidence from Indian retail investors. Int. J. Financ. Stud. 2025, 13, 219. [Google Scholar] [CrossRef]
  39. Tversky, A.; Kahneman, D. Judgment under uncertainty: Heuristics and biases. Science 1974, 185, 1124–1131. [Google Scholar] [CrossRef] [PubMed]
  40. Harmon-Jones, E.; Mills, J. An introduction to cognitive dissonance theory and an overview of current perspectives on the theory. In Cognitive Dissonance: Reexamining a Pivotal Theory in Psychology, 2nd ed.; Harmon-Jones, E., Ed.; American Psychological Association: Washington, DC, USA, 2019; pp. 3–24. [Google Scholar] [CrossRef]
  41. Kitukutha, N.M.; Vasa, L.; Oláh, J. The impact of COVID-19 on the economy and sustainable e-commerce. Forum Sci. Oecon. 2021, 9, 47–72. [Google Scholar] [CrossRef]
  42. Sanyal, U.; Uddin, F. A bibliometric analysis of behavioural finance and financial resilience. Int. J. Bus. Innov. Res. 2024, 11, 2023. [Google Scholar] [CrossRef]
  43. Roy, J.K.; Vasa, L. Transforming credit risk assessment: A systematic review of AI and machine learning applications. J. Infrastruct. Policy Dev. 2025, 9, 9652. [Google Scholar] [CrossRef]
  44. Koskelainen, T.; Kalmi, P.; Scornavacca, E.; Vartiainen, T. Financial literacy in the digital age—A research agenda. J. Consum. Aff. 2023, 57, 507–528. [Google Scholar] [CrossRef]
  45. Henseler, J. Partial Least Squares Path Modeling. In Advanced Methods for Modeling Markets; International Series in Quantitative Marketing; Leeflang, P., Wieringa, J., Bijmolt, T., Pauwels, K., Eds.; Springer: Cham, Switzerland, 2017. [Google Scholar] [CrossRef]
  46. Ahmad, M.; Shah, S.Z.A. Overconfidence heuristic-driven bias in investment decision-making and performance: Mediating effects of risk perception and moderating effects of financial literacy. J. Econ. Adm. Sci. 2022, 38, 60–90. [Google Scholar] [CrossRef]
  47. Madaan, G. Behavioural biases in financial decision-making. SSRN 2016. [Google Scholar] [CrossRef]
  48. Bikas, E.; Jurevičienė, D.; Dubinskas, P.; Novickytė, L. Behavioural finance: The emergence and development trends. Procedia Soc. Behav. Sci. 2013, 82, 870–876. [Google Scholar] [CrossRef]
  49. Baker, H.K.; Nofsinger, J.R. Psychological biases of investors. Financ. Serv. Rev. 2002, 11, 97–116. [Google Scholar] [CrossRef]
  50. Barberis, N.; Jin, L.J.; Wang, B. Prospect theory and stock market anomalies. J. Financ. 2021, 76, 2639–2687. [Google Scholar] [CrossRef]
  51. Habil, Á.C.-K.; Varga, J. Financial awareness of students entering higher education based on the results of a questionnaire research. People Int. J. Soc. Sci. 2019, 5, 681–697. [Google Scholar] [CrossRef]
  52. Jetter, M.; Walker, J.K. At what age does the anchoring heuristic emerge? Evidence from Jeopardy! J. Econ. Behav. Organ. 2020, 179, 757–766. [Google Scholar] [CrossRef]
  53. Arora, J.; Chakraborty, M. Role of financial literacy in investment choices of financial consumers: An insight from India. Int. J. Soc. Econ. 2023, 50, 377–397. [Google Scholar] [CrossRef]
  54. Shefrin, H.; Statman, M. The Disposition to Sell Winners Too Early and Ride Losers Too Long: Theory and Evidence. J. Financ. 1985, 40, 777–790. [Google Scholar] [CrossRef]
  55. Goyal, K.; Kumar, S. Financial literacy: A systematic review and bibliometric analysis. Int. J. Consum. Stud. 2020, 45, 80–105. [Google Scholar] [CrossRef]
  56. Statman, M.; Caldwell, D. Applying behavioral finance to capital budgeting: Project terminations. Financ. Manag. 1987, 16, 7–15. [Google Scholar] [CrossRef]
  57. Foster, F.D.; Kalev, P.S.; Huang, J.Y.; Shieh, J.C.; Kao, Y. Starting points for a new researcher in behavioral finance. Int. J. Manag. Financ. 2016, 12, 92–103. [Google Scholar] [CrossRef]
  58. Kumar, V.V.; Kumar, J.S. Insights on financial literacy: A bibliometric analysis. Manag. Financ. 2023, 49, 1169–1201. [Google Scholar] [CrossRef]
  59. López-Cabarcos, M.Á.; Pérez-Pico, A.M.; Vázquez-Rodríguez, P.; López-Pérez, M.L. Investor sentiment in the theoretical field of behavioural finance. Econ. Res.-Ekon. Istraž. 2020, 33, 2101–2119. [Google Scholar] [CrossRef]
  60. Saunders, M.N. Choosing research participants. Qual. Organ. Res. Core Methods Curr. Chall. 2012, 2, 35–52. [Google Scholar] [CrossRef]
  61. Razi-ur-Rahim, M.; Uddin, F.; Dwivedi, P.; Pandey, D.K. Entrepreneurial intentions among polytechnic students in India: Examining the theory of planned behaviour using PLS-SEM. Int. J. Manag. Educ. 2024, 22, 101020. [Google Scholar] [CrossRef]
  62. Raza, M.W.; Rasheed, A.; Uddin, F. What affects the consumers’ green purchasing behaviour? A study from an emerging market. Int. J. Product. Qual. Manag. 2025, 45, 513–533. [Google Scholar] [CrossRef]
  63. Razi-ur-Rahim, M.; Rabbani, M.R.; Uddin, F.; Shaikh, Z.H. Adoption of UPI among Indian users: Using extended meta-UTAUT model. Digit. Bus. 2024, 4, 100093. [Google Scholar] [CrossRef]
  64. Razi-ur-Rahim, M.; Uddin, F.; Rahim, S.; Hossain, M.B. Pioneering digital finance: Determinants of CBDC adoption in the era of FinTech and online payments. Qual. Quant. 2026, 60, 9771–9797. [Google Scholar] [CrossRef]
  65. Hair, J.F.; Risher, J.J.; Sarstedt, M.; Ringle, C.M. When to use and how to report the results of PLS-SEM. Eur. Bus. Rev. 2019, 31, 2–24. [Google Scholar] [CrossRef]
  66. Hair, J.F.; Sarstedt, M.; Ringle, C.M.; Mena, J.A. An assessment of the use of partial least squares structural equation modeling in marketing research. J. Acad. Mark. Sci. 2012, 40, 414–433. [Google Scholar] [CrossRef]
  67. Fornell, C.; Larcker, D.F. Evaluating structural equation models with unobservable variables and measurement error. J. Mark. Res. 1981, 18, 39–50. [Google Scholar] [CrossRef]
  68. Hair, J.F.; Ringle, C.M.; Sarstedt, M. PLS-SEM: Indeed a silver bullet. J. Mark. Theory Pract. 2014, 19, 139–152. [Google Scholar] [CrossRef]
  69. Furnham, A.; Boo, H.C. A literature review of the anchoring effect. J. Socio-Econ. 2011, 40, 35–42. [Google Scholar] [CrossRef]
  70. Kaustia, M.; Alho, E.; Puttonen, V. How much does expertise reduce behavioral biases? The case of anchoring effects in stock return estimates. Financ. Manag. 2008, 37, 391–412. [Google Scholar] [CrossRef]
  71. Bénabou, R.; Tirole, J. Mindful economics: The production, consumption, and value of beliefs. J. Econ. Perspect. 2016, 30, 141–164. [Google Scholar] [CrossRef]
  72. Akerlof, G.A.; Dickens, W.T. The economic consequences of cognitive dissonance. Am. Econ. Rev. 1982, 72, 307–319. Available online: https://www.jstor.org/stable/1831534 (accessed on 5 November 2015).
  73. Akhtaruzzaman, M.; Mensi, W.; Rahman, M.R.; Sensoy, A. Systemic risk sharing among conventional and socially responsible investments. Financ. Innov. 2026, 12, 90. [Google Scholar] [CrossRef]
  74. Chiang, T.C.; Zheng, D. An empirical analysis of herd behavior in global stock markets. J. Bank. Financ. 2010, 34, 1911–1921. [Google Scholar] [CrossRef]
  75. Gächter, S.; Renner, E. The effects of (incentivized) belief elicitation in public goods experiments. Exp. Econ. 2010, 13, 364–377. [Google Scholar] [CrossRef]
  76. Booij, A.S.; van Praag, B.M.S.; van de Kuilen, G. A parametric analysis of prospect theory’s functionals for the general population. Theory Decis. 2010, 68, 115–148. [Google Scholar] [CrossRef]
  77. Glaser, M.; Weber, M. Overconfidence and trading volume. Geneva Risk Insur. Rev. 2007, 32, 1–36. [Google Scholar] [CrossRef]
  78. Zeelenberg, M.; Pieters, R. A theory of regret regulation 1.0. J. Consum. Psychol. 2008, 17, 3–18. [Google Scholar] [CrossRef] [PubMed]
  79. Summers, B.; Duxbury, D. Decision-dependent emotions and behavioral anomalies. Organ. Behav. Hum. Decis. Process. 2012, 118, 226–238. [Google Scholar] [CrossRef]
  80. Kudryavtsev, V.; Kozlov, I.; Chapron, B.; Johannessen, J.A. Quad-polarization SAR features of ocean currents. J. Geophys. Res. Ocean. 2014, 119, 6046–6065. [Google Scholar] [CrossRef]
  81. Ceschi, A.; Costantini, A.; Sartori, R.; Weller, J.; Di Fabio, A. Dimensions of decision-making: An evidence-based classification of heuristics and biases. Personal. Individ. Differ. 2019, 146, 188–200. [Google Scholar] [CrossRef]
  82. Lusardi, A.; Michaud, P.-C.; Mitchell, O.S. Optimal financial knowledge and wealth inequality. J. Polit. Econ. 2017, 125, 431–477. [Google Scholar] [CrossRef] [PubMed]
  83. van Rooij, M.C.J.; Lusardi, A.; Alessie, R.J.M. Financial literacy and retirement planning in the Netherlands. J. Econ. Psychol. 2011, 32, 593–608. [Google Scholar] [CrossRef]
  84. Masrizal, M.; Sukmana, R.; Trianto, B. The effect of Islamic financial literacy on business performance with emphasis on the role of Islamic financial inclusion: Case study in Indonesia. J. Islam. Mark. 2025, 16, 166–192. [Google Scholar] [CrossRef]
  85. Morgan, P.J.; Long, T.Q. Financial literacy, financial inclusion, and savings behavior in Laos. J. Asian Econ. 2020, 68, 101197. [Google Scholar] [CrossRef]
Figure 1. List of common behavioral biases. Source: Henseler’s taxonomy of biases.
Analytics 05 00026 g001
Figure 2. Conceptual model. Source: authors.
Analytics 05 00026 g002
Figure 3. The measurement model. Source: smart PLS 4.
Analytics 05 00026 g003
Figure 4. Structural model with moderator variables (full model). Source: Smart PLS 4.
Analytics 05 00026 g004
Table 1. Hypotheses of the study.
HypothesesHypothesized Relationship
Hypothesis 1Anchoring bias has a significant impact on the investment decisions of investors.
Hypothesis 2Cognitive Dissonance bias significantly affects the investment decisions of investors.
Hypothesis 3Herd Behavior bias significantly affects the investment decisions of investors.
Hypothesis 4Loss Aversion bias significantly affects the investment decisions of investors.
Hypothesis 5Overconfidence bias has a significant impact on investment decisions.
Hypothesis 6Regret Aversion bias significantly affects the investment decisions of investors.
Hypothesis 7Representativeness bias significantly affects the investment decision of investors
Hypothesis 8Financial literacy has a significant impact on the investment decisions of investors.
Hypothesis 9Financial awareness significantly impacts investors’ investment decisions.
Hypothesis 10Financial awareness moderates the relationship between Anchoring bias and investment decisions amongst investors.
Hypothesis 11Financial awareness moderates the relationship between Cognitive Dissonance Bias and investment decisions amongst investors.
Hypothesis 12Financial awareness moderates the relationship between Herd Behavior bias and investment decisions amongst investors.
Hypothesis 13Financial awareness moderates the relationship between Loss Aversion bias and investment decisions amongst investors.
Hypothesis 14Financial awareness moderates the relationship between Overconfidence bias and investment decisions amongst investors.
Hypothesis 15Financial awareness moderates the relationship between Regret Aversion bias and investment decisions amongst investors.
Hypothesis 16Financial awareness moderates the relationship between Representativeness bias and investment decisions amongst investors.
Hypothesis 17Financial literacy moderates the relationship between Anchoring bias and investment decisions amongst investors.
Hypothesis 18Financial literacy moderates the relationship between Cognitive Dissonance bias and investment decisions amongst investors.
Hypothesis 19Financial literacy moderates the relationship between Herd Behavior bias and investment decisions amongst investors.
Hypothesis 20Financial literacy moderates the relationship between loss aversion bias and investment decisions among investors.
Hypothesis 21Financial literacy moderates the relationship between Overconfidence bias and investment decisions amongst investors.
Hypothesis 22Financial literacy moderates the relationship between Regret Aversion bias and investment decisions amongst investors.
Hypothesis 23Financial literacy moderates the relationship between Representativeness bias and investment decisions amongst investors.”
Table 2. Respondents’ demographic profile (N = 444).
GenderN%
   Female16437
   Male28063
Age (years)N%
   18–3529466
   36–5414232
   55 or older082
EducationN%
   Graduate6615
   PhD12027
   Postgraduate25858
Employment StatusN%
   Employed32473
   Self-employed (Business)225
   Student7517
   Unemployed (currently looking for work)235
Social StatusN%
   Divorced225
   Married25858
   Unmarried16437
Nature of OrganizationN%
   Government26259
   NA317
   Private12929
   Public Undertaking225
Household income per month (INR)N%
   Less than 50,0008018
   50,001–1,00,00018742
   100,001–150,0004010
   150,001–200,00010022
   Above 200,000378
Nature of FamilyN%
   Joint14332
   Nuclear24254
   Single (Divorced/Unmarried)5914
Number of earning members of the familyN%
   More than two13630
   One14333
   Two16537
Annual Saving Potential (INR)N%
   Below 100,00018040
   100,001–200,0009922
   200,001–300,0006615
   300,001–400,000338
   Above 400,0006615
Source: Questionnaire.
Table 3. Summary of measures and reliability of Cronbach’s Alpha.
ItemsCronbach’s AlphaDeleted
AB10.771NO
AB20.757NO
AB30.749NO
AB40.854NO
CDB10.829NO
CDB20.781NO
CDB30.784NO
CDB40.238YES
CDB5−0.035YES
HB10.797NO
HB20.755NO
HB30.896NO
LA10.757NO
LA20.988NO
LA30.714NO
OB10.766NO
OB20.834NO
OB30.815NO
OB40.738NO
RA10.784NO
RA20.855NO
RA30.731NO
RA40.235YES
RB10.764NO
RB20.902NO
RB30.86NO
RB40.405YES
FA10.727NO
FA20.906NO
FA30.745NO
FA4−0.246YES
FA50.143YES
FA60.44YES
FL10.725NO
FL20.764NO
FL30.743NO
FL40.148YES
FL50.314YES
FL60.384YES
ID10.808NO
ID20.904NO
ID30.933NO
ID40.843NO
Source: SPSS 23.
Table 4. Data adequacy and validity test.
Sl.No.ConstructNumber of ItemsFactor LoadingsKMOBartlett’s Test (χ2, df, p)
1Anchoring Bias40.9230.822χ2 = 312.45, df = 6, p < 0.001
0.865
0.879
0.952
2Cognitive Dissonance Bias30.9850.861χ2 = 218.37, df = 3, p < 0.001
0.865
0.789
3Herd Behavior Bias30.8230.731χ2 = 167.89, df = 3, p < 0.001
0.698
0.712
4Loss Aversion Bias30.7940.798χ2 = 190.44, df = 3, p < 0.001
0.852
0.862
5Overconfidence Bias40.8410.811χ2 = 276.59, df = 6, p < 0.001
0.875
0.895
0.722
6Regret Aversion Bias30.7890.809χ2 = 174.28, df = 3, p < 0.001
0.741
0.726
7Representativeness Bias30.8320.925χ2 = 261.73, df = 3, p < 0.001
0.841
0.963
8Financial Awareness30.9510.899χ2 = 289.10, df = 3, p < 0.001
0.942
0.861
9Financial Literacy30.8420.79χ2 = 206.67, df = 3, p < 0.001
0.785
0.951
10Investment Decision40.8230.823χ2 = 302.78, df = 6, p < 0.001
0.897
0.811
0.853
Source: SPSS 23.
Table 5. Variance inflation factor.
VariablesVIF
AB11.376
AB21.59
AB31.646
AB41.78
CDB11.139
CDB21.126
CDB31.037
FA11.426
FA21.479
FA31.404
FL11.151
FL21.201
FL31.254
HB11.732
HB21.979
HB31.285
ID11.293
ID21.335
ID31.216
ID41.246
LA11.417
LA21.527
LA31.175
OB11.64
OB21.732
OB32.319
OB42.129
RA11.52
RA21.23
RA31.382
RB11.593
RB22.264
RB31.809
Source: Smart PLS 4.
Table 6. Loadings, composite reliability, average variance explained and Cronbach’s alpha.
Latent Constructs and IndicatorsStandard LoadingsComposite Reliability (CR)Average Variance Explained (AVE)Cronbach’s Alpha
Anchoring Bias  0.8220.5780.76
  AB10.771
  AB20.757
  AB30.749
  AB40.854
Cognitive Dissonance Bias  0.7270.6090.742
  CDB10.829
  CDB20.781
  CDB30.784
Herd Behavior Bias  0.7230.5270.737
  HB10.797
  HB20.755
  HB30.896
Loss Aversion Bias  0.8610.5320.768
  LA10.757
  LA20.988
  LA30.714
Overconfidence Bias  0.8350.6230.803
  OB10.766
  OB20.834
  OB30.815
  OB40.738
Regret Aversion Bias  0.7220.5750.768
  RA10.784
  RA20.855
  RA30.731
Representativeness Bias  0.8690.7120.803
  RB10.764
  RB20.902
  RB30.86
Financial Awareness  0.8480.6150.728
  FA10.727
  FA20.906
  FA30.745
Financial Literacy  0.7950.5510.791
  FL10.725
  FL20.764
  FL30.743
Investment Decision  0.8990.7630.895
  ID10.808
  ID20.904
  ID30.933
  ID40.843
Source: Smart PLS 4.
Table 7. Discriminant validity (HTMT).
ABCDBFAFLHBIDLAOBRARB
AB
CDB0.615
FA0.5580.645
FL0.5090.6870.697
HB0.2820.820.2730.272
ID0.5170.5390.4630.6880.315
LA0.3310.8270.40.5890.5480.236
OB0.6030.6910.30.4140.3370.5060.599
RA0.4990.7520.4430.4480.5070.2760.7480.433
RB0.7620.7240.4860.5070.3780.5260.2660.2890.322
Source: Smart PLS.
Table 8. Latent variable correlation and square root of average variance extracted (Fornell and Larcker criterion).
ABCDBFAFLHBIDLAOBRARB
AB0.761
CDB0.7060.78
FA0.5270.4520.784
FL0.3140.1470.4790.742
HB0.1570.3580.0640.0190.726
ID0.450.4030.4610.5020.2770.873
LA0.04−0.066−0.110.2810.180.1020.657
OB0.4420.3070.2350.2470.2870.450.5270.789
RA0.2960.3080.2260.2980.3870.230.3990.3350.759
RB0.7580.6030.4390.3680.2030.466−0.0480.2020.1680.844
Source: Smart PLS 4.
Table 9. Results of structural model.
HPathOriginal Sample (O)Sample Mean (M)Standard Deviation (STDEV)t Statistic (|O/STDEV|)p-Value95% CI Lower95% CI UpperDecision
H1AB → ID0.310245−0.3970.1292.4050.0160.0574050.563085Supported
H2CDB → ID0.411651−0.3670.1592.5890.0030.1000110.723291Supported
H3HB → ID0.692076−0.3740.2312.9960.0010.2393161.144836Supported
H4LA → ID0.536256−0.3510.1962.7360.0160.1520960.920416Supported
H5OB → ID0.540351−0.4360.1892.8590.0080.1699110.910791Supported
H6RA → ID0.430958−0.2460.2092.0620.0390.0213180.840598Supported
H7RB → ID0.51906−0.2180.2052.5320.0260.117260.92086Supported
H8FA → ID0.2827440.3950.1322.1420.0320.0240240.541464Supported
H9FL → ID0.3256740.3450.1112.9340.0020.1081140.543234Supported
Source: Smart PLS 4.
Table 10. Results of the moderating effect of intention in the structural model.
HPathOriginal Sample (O)Sample Mean (M)Standard Deviation (STDEV)t Statisticp-Value95% CI Lower95% CI UpperDecision
H10FA × AB → ID1.2292290.4890.4772.5770.014−0.445921.42392Supported
H11FA × CDB → ID0.7089280.7020.3042.3320.020.106161.29784Supported
H12FA × HB → ID0.8414060.4150.3262.5810.001−0.223961.05396Supported
H13FA × LA → ID0.8991970.4440.2633.4190.005−0.071480.95948Supported
H14FA × OB → ID0.8465320.3670.2363.5870.008−0.095560.82956Supported
H15FA × RA → ID0.670950.5340.2133.150.0020.116520.95148Supported
H16FA × RB → ID0.5588480.5540.2362.3680.0070.091441.01656Supported
H17FL × AB → ID1.7603840.4360.5443.2360.017−0.630241.50224Supported
H18FL × CDB → ID0.022180.0090.021.1090.253−0.03020.0482Not Supported
H19FL × HB → ID1.0348150.4960.3353.0890.006−0.16061.1526Supported
H20FL × LA → ID1.1523060.3320.4862.3710.011−0.620561.28456Supported
H21FL × OB → ID1.034040.4350.422.4620.004−0.38821.2582Supported
H22FL × RA → ID0.7501030.3210.3732.0110.013−0.410081.05208Supported
H23FL × RB → ID1.1045920.4480.5242.1080.008−0.579041.47504Supported
Source: Smart PLS 4.
Table 11. Variance explained in endogenous latent variable.
Latent VariableR-Squared/Variance Explained
Investment decision0.851/85.1%
Source: Smart PLS 4.
Table 12. Model fit.
Saturated ModelEstimated Model
SRMR0.0420.045
Chi-square16,326.4416,317.73
NFI0.920.92
Source: Smart PLS 4.
Disclaimer/Publisher’s Note: The statements, opinions and data contained in all publications are solely those of the individual author(s) and contributor(s) and not of MDPI and/or the editor(s). MDPI and/or the editor(s) disclaim responsibility for any injury to people or property resulting from any ideas, methods, instructions or products referred to in the content.