1. Introduction
In this paper, we investigate the effects of demographic and economic disparities in Alabama public schools. This study explores the mathematical proficiencies of students attending Alabama public schools that serve predominantly white students in contrast to those that serve predominantly non-White students. The analysis was further extended by examining whether these relationships persisted when socioeconomic disadvantage was incorporated into the comparison framework. The study also examines whether school-level mathematics achievement is associated with teacher certification status and teacher experience across schools serving different student populations. For statistical analysis, schools were categorized according to the predominant demographic composition reported in publicly available state data. Consistent with prior educational equity research, schools serving predominantly “non-White” student populations were grouped together to examine systemic disparities in educational access and outcomes. These classifications are used solely for demographic and institutional analysis and should not be interpreted as reflecting inherent differences among students. Gender was not considered in this research, and the study included data from elementary, middle, and high schools. This study does not assume or suggest inherent differences in mathematical ability across racial or ethnic groups. Rather, it investigates how structural and institutional disparities associated with school demographic composition may relate to differences in educational outcomes.
The distinction between equity and equality is widely discussed within educational research. Equity can be described in comparison to equality by stating that equity is not giving all students the same instruction, resources, and support (which is equality), but rather giving all students “reasonable and appropriate accommodations” to support their learning [
1]. The distinction between equality and equity is often illustrated through examples demonstrating how individuals with different needs may require different forms of support to achieve comparable outcomes. For instance, consider three siblings trying to reach an object on a counter top. The youngest is half the height of the oldest. The middle child’s height is halfway between the previous two. It would be equal to provide all three children with a step stool of the same height; however, this would put the tallest child at a greater advantage than what previously existed, help the middle child just enough to see over the counter, and leave the shortest child still shy of reaching the counter. An equitable solution would be to give each child a stool that would allow them to comfortably work at the counter without obstruction.
In America, where 55% of the eighth-grade student body is of various non-White groups [
2]. These concepts are also relevant to classroom practice. To revisit the previous example, each child’s ability to reach the counter would represent a student’s level of achievement, the counter would be the obstacles in their way of learning, and the stools would be the support available to the students to overcome those obstacles. Here, equality would look like students being taught in the same way or the teacher delivering instruction with little to no regard for each student’s unique strengths, weaknesses, prior knowledge, etc. [
3]. An equitable approach would be scaffolding each student to meet their specific needs or using parts of students’ cultures and interests to engage them in their learning [
4].
Equity is often the goal in education, yet there continues to be a gap in our students’ achievement [
5]. Particularly between students of color and white students, as well as between low-income and non-low-income students. In 2006, the NAEP reported that 91% of African American and 87% of Latino eighth graders were not proficient in mathematics. This is in stark contrast to the 63% of White students who were not proficient. It also reported that 13% of the students from economically disadvantaged families were proficient or advanced in math, while 38% of the students from non-economically disadvantaged families were proficient or advanced [
6]. In Alabama public schools, 94% of Black, 89% of Hispanic, and 67% of White eighth graders were not proficient in 2024 [
7].
Differences in mathematics proficiency are sometimes inaccurately attributed to deficiencies in students’ knowledge or intellectual ability. However, substantial evidence suggests that structural inequities within the American educational system have contributed to unequal educational opportunities and outcomes across racial groups [
8]. The notion of Separate but Equal was introduced to the United States in the 1896 Supreme Court decision of Plessy v. Ferguson, which allowed racial segregation of public spaces [
9]. When applied to schools, people believed that it implied that regardless of whether the school served White or African American students, they would have equal facilities, instruction, access to resources, etc. However, this was seldom the case. Schools that taught White students had better books, facilities, teachers, and access to other outside resources compared to the schools that taught Black and other non-White students [
10]. This judgment was overturned in 1954 with the Brown v. Board of Education case, ruling that segregation in schools was inherently unequal and ordered desegregation. Though this transpired nearly 70 years ago, these systematic inequalities and inequities have continued to perpetuate the education system in various forms [
8].
1.1. Ethical Statement
Race and ethnicity were treated in this study as socially constructed demographic categories reported through state educational data systems, not as biological or innate determinants of academic ability. The purpose of the analysis was to examine structural and institutional disparities associated with the demographic profile of schools, including differences in teacher qualifications and access to educational resources. The authors acknowledge the substantial diversity within racial and ethnic groups and recognize that aggregated demographic categories may obscure important within-group variation. These classifications were used exclusively to evaluate patterns of educational inequity at the school level. The authors further acknowledge that framing schools through broad demographic categories may inadvertently reproduce simplified racial distinctions; therefore, the findings should be interpreted as reflecting institutional patterns within administrative datasets rather than essential characteristics of the populations represented.
1.2. Background Literature
One focus in the field of educational research is understanding why non-White students tend to be less proficient in most subjects across the board compared to their white peers [
11,
12]. This often leads to research that focuses on the analysis of a mix of qualitative and quantitative data. Student learning outcomes are influenced by a complex combination of immediate educational conditions and broader structural factors [
13]. Factors examined in prior research include teacher characteristics, student demographics, student-teacher relationships, administrative support, instructional practices, and curricular content. Given the multifaceted nature of educational systems, isolating a single factor that explains variation in mathematics achievement is challenging. Thus, most studies seek to discover what combination of factors results in the best model for predicting how well students will perform on proficiency tests.
A good example of this type of data can be seen in the research of [
6], where he detailed that the achievement gap present between White versus African American, Latino, and low-income students can be attributed to limited access to experienced and qualified teachers, lower academic expectations, and inequitable per-student funding. To obtain this data, Flores used public data about students’ scores and school funding/expenditures, along with existing qualitative research concerning teachers’ attitudes and biases towards their students. Collectively, this body of evidence does not support interpretations attributing achievement differences to inherent differences in students’ learning capacities.
Although achievement-gap analyses can identify persistent disparities in mathematics outcomes, such analyses have been critiqued for encouraging what [
14] described as “gap-gazing,” or the repeated documentation of differences between student groups without sufficient attention to the structural conditions that produce those differences. This concern is important for the present study because simply reporting differences in proficiency could unintentionally reproduce deficit narratives about students who have been historically marginalized in mathematics. At the same time, refs. [
15,
16] argued that carefully designed gap analyses can still be useful when they illuminate inequitable access to educational opportunities and inform policy and practice. Consistent with this more cautious position, the present study does not treat proficiency differences as evidence of student deficiency. Instead, it uses school-level differences in mathematics proficiency, teacher certification, and teacher experience to examine whether disparities in outcomes correspond with disparities in institutional conditions. In this sense, the study frames observed proficiency gaps as potential indicators of opportunity gaps rather than as endpoints of analysis.
Also in 2007, Orfield and Lee noted the historical implications of segregation and researched the effects of a surge of re-segregation that began taking place after the 1980s [
17]. Recent investigations similarly suggest that patterns of racial and socioeconomic segregation continue to shape educational opportunities through unequal access to qualified teachers, advanced coursework, and other school resources, despite policy efforts aimed at reducing disparities [
18,
19]. As previously mentioned, legal segregation in 20th-century America was detrimental to the education of African American students. Their research detailed that when there was less segregation in schools, students’ academic proficiencies began to rise, but after the 1980s, schools began to resegregate at an aggressive rate, causing a drop in student proficiencies.
Despite important contributions to understanding inequities in mathematics education, several limitations continue to characterize both past and contemporary research in this area.
An over-reliance on standardized tests as a measure of proficiency. Students’ achievement is usually linked to proficiency, which is most commonly determined using standardized test scores. Though these assessments allow for faster and more objective grading, they do not take into account the drawbacks of standardized tests. For instance, these tests are often seen as culturally biased and based on the knowledge and values of the majority group [
20]. This then creates biases against genders, races, and people with different language backgrounds, socioeconomic statuses, and cultures from that of the majority. In Alabama’s public schools, white students make up 51% of the student population, giving them a clear majority in the school system compared to the 32%, 11%, 1%, 1%, 4% of Black or African American, Hispanic/Latino, Asian, American Indian/Alaska Native, Two or more races students (respectively) [
21]. It is also difficult to gain a clear understanding of a student’s full scope of knowledge when assessing with fully multiple-choice tests [
22] like the ACAP and ACT. Multiple-choice assessments provide limited information regarding the nature of students’ misconceptions or reasoning processes, making it difficult to distinguish among different sources of error. This is important because whether a student answers a question incorrectly is based on computational errors, calculator mistakes, or actual lack of proficiency, which is essential information because they all suggest different issues, yet multiple-choice tests group them all into the latter category.
Minimal focus on implicit and explicit biases in teachers, teaching practices, and curricula. Simply attributing differences in achievement and proficiency to the competencies or characteristics of the students (i.e., race or income) is not beneficial for the overall understanding of its causes [
6,
23]. Flores argued that these achievement gaps are due to opportunity gaps. Three factors that create the opportunity gap are that African American and Latino students are less likely to be taught by qualified and experienced teachers, more likely to face low expectations, and less likely to receive equitable per-student funding [
6]. Ref. [
1] stated that to support access and equity in math programs, there must be access to high-quality curriculum and instruction, high expectations for all students, and high-quality human and material resources. Such disparities suggest a disconnect between stated commitments to educational equity and the distribution of educational opportunities across student populations. This disconnect impedes students’ ability to reach their highest mathematical potential and feeds into the opportunity gap. More recent empirical studies continue to document the persistence of opportunity gaps in mathematics education. Contemporary evidence suggests that disparities in access to rigorous learning opportunities, qualified instructional support, and school-level teaching factors remain associated with differences in student achievement, particularly among historically marginalized and economically disadvantaged populations [
24,
25]. These findings indicate that the structural concerns identified in earlier scholarship remain highly relevant in present-day educational contexts.
Issues in data quality and accessibility, making it difficult to accurately research factors and produce reliable results. Many databases containing the data used in research lack granularity. For instance, the data recorded in the Alabama State Department of Education Federal Report Cards and State Report Cards denoted that both the asterisk (*) and the tilde (~) symbols indicated both a majority and a non-White of a subpopulation [
26]. More specifically, the asterisk is used to illustrate that the number of students in a subpopulation was ≤10 or that 5 total number of students in a school minus the number of students in the subpopulation was ≤10, while the tilde denotes that the students within a subpopulation make up either≥95% or ≤5%. Meaning any schools with a tilde for one subpopulation signifying ≥95% would also have a row populated with tildes signifying ≤ 5% for the remaining subpopulations, making it impossible to distinguish the groups. This limitation complicated the classification of the demographic profile of schools and resulted in the exclusion of 70 schools from the analysis.
Policy and legislative change based on research. Because mathematics achievement is influenced by numerous interconnected factors contributing to observed proficiency disparities, it can be difficult to pinpoint the best course of action; however, even with all the research available supporting structural and legislative change, there has been very little overall progress made in the Alabama school system toward closing this gap. For instance, as this study will show, there is a large racial gap in math proficiency in Alabama schools, which has been documented extensively in previous research. Based on this understanding, the 2022 Alabama Numeracy Act (Act 2022–249) was passed to improve mathematics education for kindergarten through fifth-grade students in Alabama public schools, focusing on:
- ○
Implementing clear, evidence-based statewide math standards and instruction,
- ○
Explicitly banning Common Core Math Standards,
- ○
Requiring specialized training for kindergarten through fifth-grade teachers in math instruction.
- ○
Identifying struggling students and providing targeted interventions to the students early on.
- ○
Placing math coaches in elementary schools to support kindergarten through fifth-grade teachers, and
- ○
Implementing new standardized assessments to track student progress.
However, the Act does not explicitly address the racial disparities in math proficiency or target any of the specific factors that disproportionately impact non-White students.
Overall, demographic disparities in mathematics achievement reflect a complex interaction of historical, socioeconomic, psychological, and educational factors. Addressing these disparities requires multi-layered interventions and legislation that first acknowledge that the racial disparities are present and growing.
Guided by an educational opportunity framework, this study conceptualizes mathematics achievement as being shaped not solely by individual student characteristics but also by structural conditions that influence access to educational resources. School demographic composition may reflect broader patterns of residential segregation and historical inequities, socioeconomic disadvantage may constrain access to academic supports, and teacher qualifications may serve as indicators of institutional capacity. Rather than treating these factors as independent causal determinants, this study examines whether they are associated with systematic differences in mathematics proficiency across Alabama public schools. Recent research increasingly conceptualizes educational disparities through structural and institutional frameworks that emphasize the interconnected roles of demographic composition, socioeconomic context, school capacity, and access to qualified educators in shaping academic outcomes [
27,
28]. Rather than attributing achievement differences solely to individual characteristics, these perspectives highlight how organizational conditions and educational opportunities interact to influence student success.
1.3. Our Contribution
The contribution of this study is not simply to document that mathematics achievement differences exist across Alabama public schools. Rather, the study connects proficiency patterns to school-level indicators of educational opportunity, including teacher certification, teacher experience, socioeconomic disadvantage, and the demographic profile of schools. By doing so, the analysis is intended to provide information that may help policymakers and practitioners identify where institutional support, staffing resources, and targeted interventions may be most needed. Much of the existing literature examines racial and ethnic groups separately to identify differences in educational experiences and outcomes among specific student populations. In the present study, however, schools were classified according to their predominant demographic composition to investigate broad patterns of structural inequality at the institutional level. This analytical decision was guided by both the nature of the available administrative data and the study’s focus on school contexts rather than individual student characteristics. The intent was not to imply that racially and ethnically diverse populations share uniform experiences, but rather to examine whether schools serving historically marginalized student populations encounter similar school-level conditions related to teacher qualifications and mathematics proficiency. We recognize that this approach necessarily obscures within-group variation and should not be interpreted as representative of the experiences of any specific racial or ethnic community. It is important to emphasize that these proficiencies do not reflect the proficiencies of only the predominant race of the school. Therefore, this study does not investigate how proficient students of color are versus white students, but rather how the whole school population performed based on the predominant race served at that school. Consequently, schools were classified according to majority enrollment, even when the demographic composition was relatively balanced. This analytical approach offers a distinct school-level perspective on educational inequality, allowing the analysis to focus on school-level structural conditions and demographic composition rather than attributing outcomes to individual student characteristics and recognizing that schools are impacted systemically based on the types of students they serve overall.
As previously mentioned, schools with predominantly white students tend to have more educated, trained, and experienced teachers than those serving predominantly non-White students. Whether these factors significantly influence students’ mathematical proficiency remains an open research question that this study seeks to investigate.
This research seeks to investigate the following research questions:
Do public schools in Alabama serving predominantly non-White student populations differ from predominantly White schools in terms of mathematics achievement, teacher certification, and teacher experience? If so, what is the magnitude of these differences?
Among economically disadvantaged schools, do predominantly non-White schools differ from predominantly White schools in terms of mathematics proficiency, teacher certification, and teacher experience? If so, what is the magnitude of these differences?
Are the percentages of inexperienced teachers and teachers holding emergency or provisional certifications associated with variation in students’ mathematics achievement scores?
1.4. Hypotheses
H1. Predominantly non-White schools will exhibit lower mathematics proficiency rates and higher rates of inexperienced and emergency/provisionally certified teachers than predominantly White schools.
H2. Among economically disadvantaged schools, predominantly non-White schools will exhibit lower mathematics achievement rates and higher rates of inexperienced and emergency/provisionally certified teachers than predominantly White schools.
H3. Higher percentages of inexperienced teachers and teachers holding emergency or provisional certifications will be associated with lower mathematics proficiency scores.
In
Section 2, we will discuss the methods and statistical properties we used to analyze the data.
Section 3 covers the analysis of the data and how it was manipulated to answer the research questions below, along with pictorial and numerical representations of the analysis.
Section 4 presents the study findings, followed by a discussion of their implications in relation to existing literature. Then, this paper will conclude with a discussion of my findings and how they relate to what is already known about the topic.
2. Methods
To compare the proficiency, emergency or provisional certification, and inexperienced rates of each of the four groups, we calculated their means and standard deviations. Furthermore, to test whether the differences in proficiency means between racial groups were statistically significant, we conducted a t-test. Then, in order to examine whether teacher experience and certification play a role in student math proficiencies, we performed a regression analysis.
Preliminary examination of the proficiency data suggested the possibility of non-normal distributions.
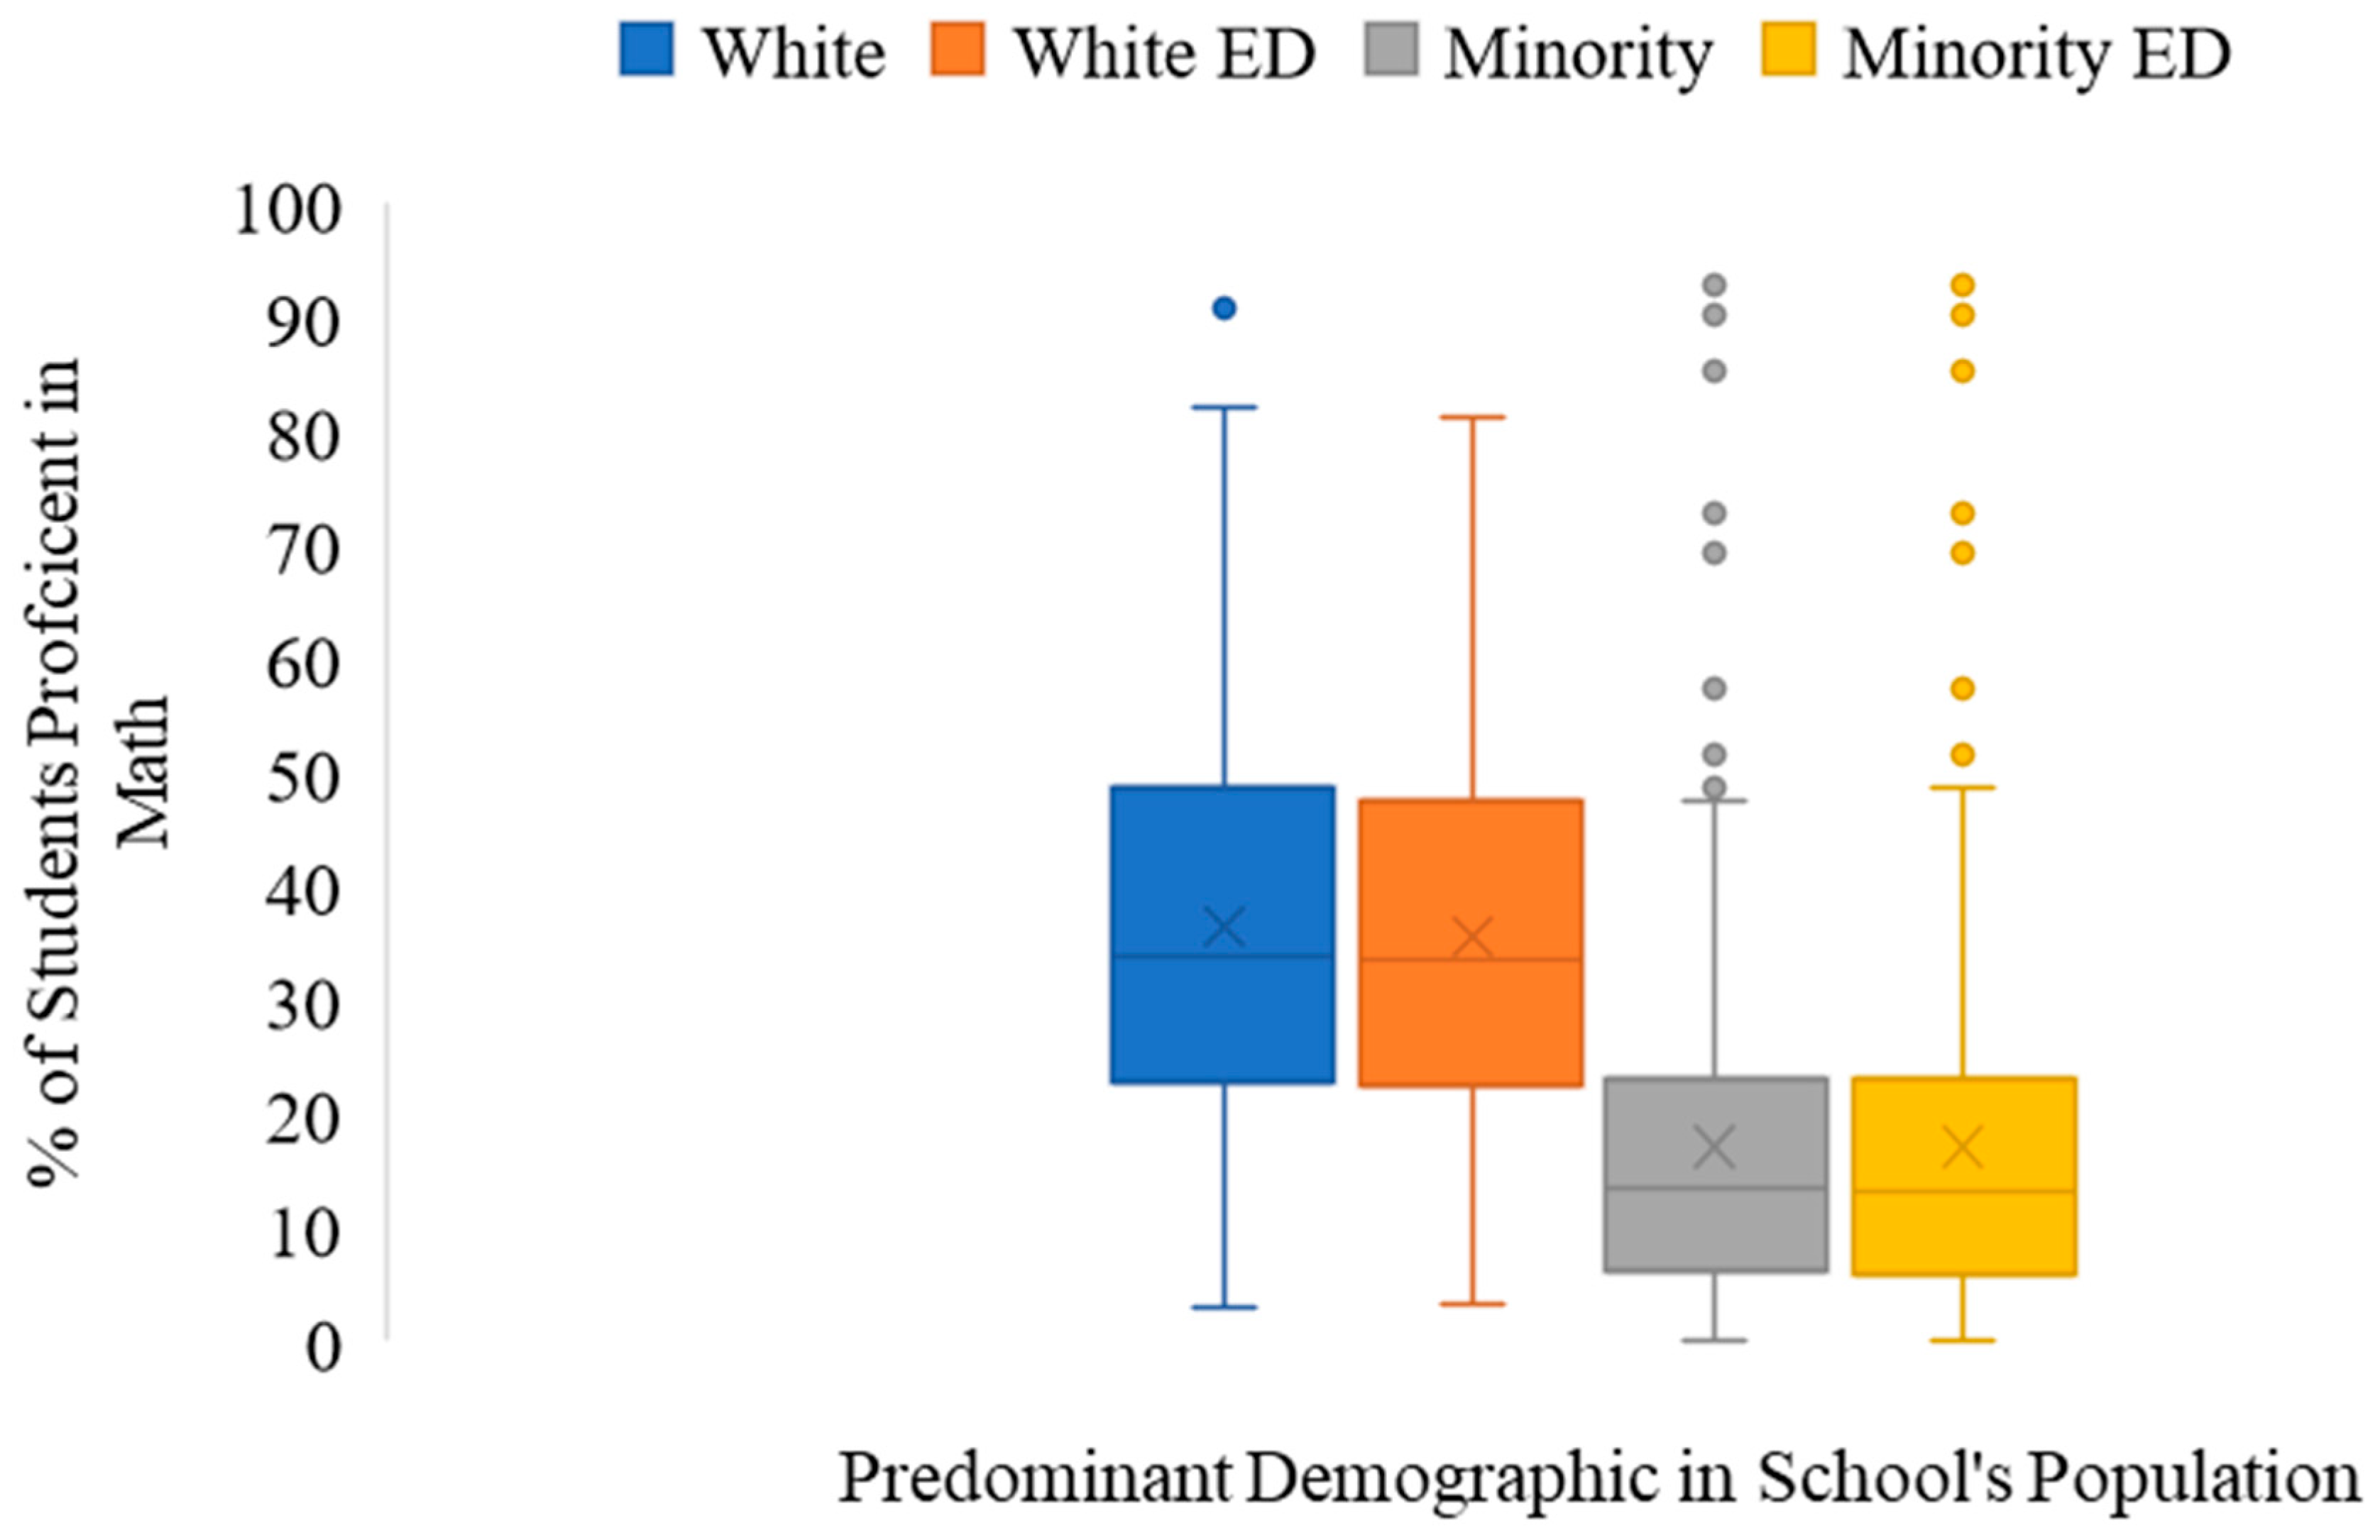
Figure 1 illustrates the raw data described. Performing a skewness test in Excel revealed that the data for all variables (except proficiency rates of predominantly white and predominantly white E.D. schools) were moderately to severely right-skewed, as seen in
Table 1 and
Table 2. The proficiency rates of predominantly white and predominantly white E.D. schools were mildly right-skewed, but with an absolute value of less than 0.5, both were still considered approximately normal. On the other hand, the predominantly minority and predominantly minority E.D. schools were severely right-skewed, both with skewness values around 1.9. Since the data contained zeros, we could not perform a log-based or reciprocal transformation, so we opted for a square root transformation, such that
, which brought the skewness values of all variables to −0.467 ≤ skewness ≤ 0.391. This transformed data was then used to perform the remaining tests/analyses. (All descriptive statistics were performed prior to this manipulation.)
To determine the effects of emergency or provisional certification and inexperienced rates on proficiency rates, correlation matrices and linear regression analyses were computed using Microsoft Excel. We also used Excel to create a correlation matrix to assess the general relationship between the variables before considering the sample schools’ racial compositions. Although the sample size represented a substantial proportion of Alabama public schools in comparison to the population of Alabama public schools (n = 1030, N = 1358), the true population variances were not known due to a lack of information and/or inconclusive information from the 24.15% of schools that were excluded. For this reason, we used the t-test instead of the z-test.
After establishing whether there is a significant difference in the means of each variable based on the predominant race of the schools, we ran a regression analysis in Excel to determine to what degree teacher experience and certification are associated with differences in students’ mathematical proficiencies. This analysis also provides information regarding whether these effects differ between each school composition.
3. Data Analysis
This study is based on an analysis using data from school data posted to the Alabama Archives’ website. Data was drawn from the federal and state report cards, specifically: Student Demographics, Student Participation and Proficiency, Educator Credentials, and Educator Experience. The Alabama State Department of Education (ALSDE) maintains and updates this database yearly based on information provided by the schools each year. As of the 2023–2024 school year, there are 1358 public schools in the state of Alabama [
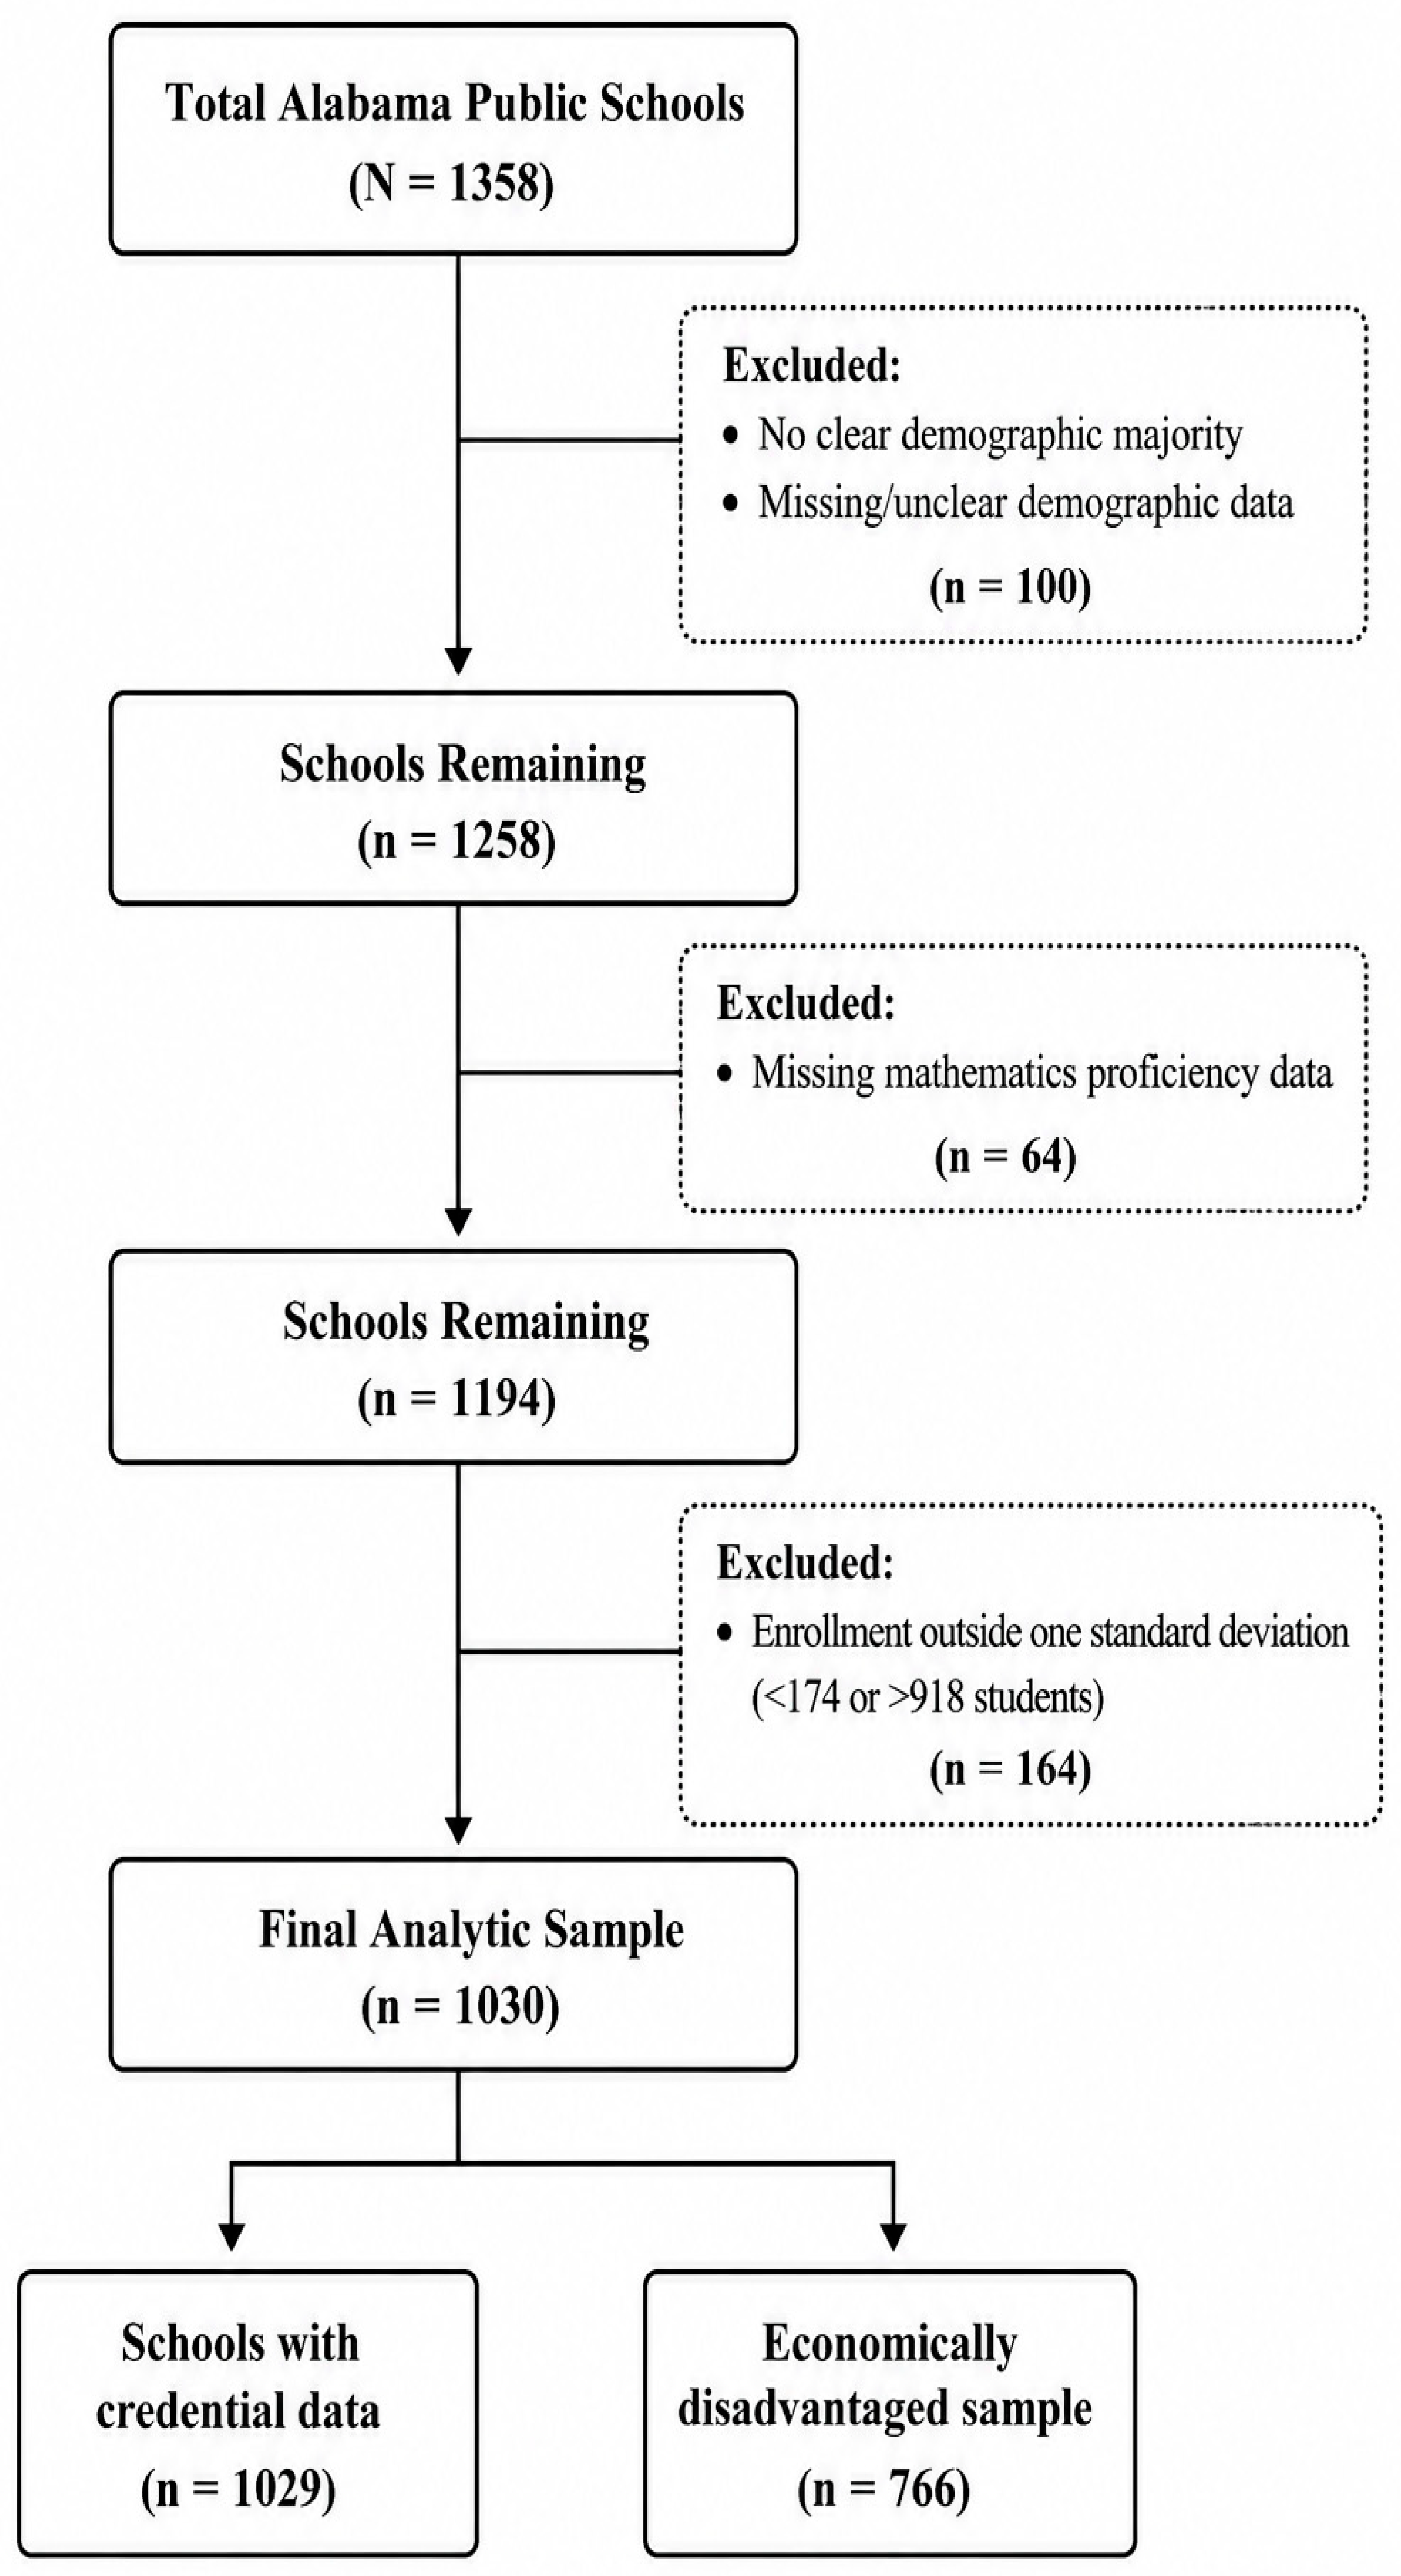
29]. The study employed a stratified sampling approach designed to facilitate comparisons across schools serving different student populations. Rather than selecting schools through random sampling, all Alabama public schools with sufficient publicly available information were considered for inclusion. Schools were subsequently classified according to their predominant demographic composition and then subjected to a series of exclusion criteria intended to improve the interpretability and comparability of the analyses. These procedures were implemented sequentially and are summarized in
Figure 2. The sample construction process began with the Student Demographics dataset. To analyze the data based on the predominant race within these school populations for the first hypothesis, schools were classified into two categories: those that served predominantly white students and those that served predominantly non-White students. To ensure a clear majority, schools with a population of no less than 51% of the named racial group were included. Schools with missing/unclear demographic data or those without a clear majority were excluded from the sample. One hundred schools were excluded due to this criterion. Schools lacking a clear demographic majority were excluded because the primary analyses relied on comparisons between schools serving distinct demographic populations. Including schools without a majority group could have introduced ambiguity into the classification process and reduced the interpretability of the resulting comparisons. The Student Participation and Proficiency document was then used to identify the overall math proficiency rates of the remaining schools. Another 64 schools were omitted due to missing proficiency information. Schools with missing mathematics achievement information were excluded because proficiency rates served as the principal outcome variable in this study. Including schools without valid outcome data would have prevented meaningful comparisons and subsequent statistical analyses.
To improve transparency regarding the analytic sample and to provide readers with a clearer understanding of the schools included in the present study,
Table 3 summarizes the demographic characteristics and sample selection process used to construct the final dataset. Because the focus of this investigation is on school-level structural conditions rather than the characteristics or performance of individual students, the classifications presented in the table reflect the predominant demographic composition of schools as reported through publicly available administrative data obtained from the Alabama State Department of Education. Specifically, schools were categorized according to whether at least 51% of enrolled students identified as White or as members of historically marginalized racial and ethnic populations. This threshold was established to ensure that each school included in the analysis represented a clear demographic majority and to reduce ambiguity in the assignment of schools to comparison groups. It is important to emphasize that these classifications were used solely to examine broad institutional patterns associated with school demographic composition and should not be interpreted as implying homogeneity within diverse racial and ethnic communities or as defining individual students in relation to dominant groups. The table also documents each stage of the sample selection process, including exclusions resulting from missing or unclear demographic information, missing proficiency data, and the application of enrollment criteria designed to minimize the influence of unusually small or exceptionally large schools whose organizational characteristics may differ substantially from those of typical public schools. In addition, the table reports the composition of the economically disadvantaged subsamples, thereby illustrating the substantial overlap between the demographic profile of schools and socioeconomic disadvantage within Alabama public schools. Presenting these descriptive statistics allows readers to assess the representativeness and scope of the analytic sample, understand how the final sample was derived from the statewide population of schools, and interpret the subsequent findings within the appropriate methodological context. Moreover, by explicitly reporting the number and proportion of schools included at each stage of the selection process, the study enhances methodological transparency and provides a clearer basis for evaluating both the strengths and limitations of the analyses. Although these broad demographic categories necessarily reduce the granularity of the available data and may obscure important within-group differences among specific racial and ethnic populations, they provide a practical framework for investigating whether patterns of educational opportunity, teacher qualifications, and mathematics proficiency differ systematically across schools serving distinct student populations. Consequently,
Table 3 serves not only as a descriptive overview of the sample but also as an important aid for understanding the institutional context in which the study’s statistical analyses and interpretations should be situated.
As very small schools and very large schools can yield vastly different results, we controlled the school size. The school population of the remaining 1194 schools was between 30 and 6894. Schools with a population of below 174 and above a population of 918, which was outside one standard deviation of the mean were omitted. This lowered the total number of schools by another 164 schools, leaving 1030 schools.
Figure 2 presents the progression of the sample from the statewide population of Alabama public schools to the analytic samples used in the study. The figure summarizes each exclusion criterion and illustrates how the economically disadvantaged and educator credential subsamples were derived. Providing this visual representation enhances methodological transparency and enables readers to assess the representativeness and scope of the final analytic samples.
This enrollment restriction was used to reduce the influence of extremely small or unusually large schools, where proficiency percentages may be unstable or shaped by organizational conditions that differ substantially from typical public schools. Very small schools may produce highly variable proficiency rates because a small number of students can strongly affect the percentage, while very large schools may reflect institutional structures not comparable to most schools in the sample. However, we acknowledge that this decision may have affected the representativeness of the final sample by excluding some relevant schools. Therefore, the findings should be interpreted as applying to schools within the retained enrollment range rather than to all Alabama public schools without qualification.
Finally, the Educator Credentials and Educator Experience document was used to identify the percentage of teachers with either an emergency or provisional certification. There was a named group for teachers with “unspecified” certification types; however, this data was not included because it is unclear whether they completed the specific requirements for a certain certification type or did not have a certification at all. There was only one school without any information about their teachers’ certification, therefore 1029 schools were analyzed.
To test the second part of the first hypothesis, the two lists from above were narrowed further using the Economically Disadvantaged/Non-Economically Disadvantaged subpopulation of the Student Demographics file. The economically disadvantaged subgroup analyses were conducted to examine whether the observed school-level patterns persisted within contexts characterized by elevated socioeconomic disadvantage. Restricting the analyses to schools with a majority of economically disadvantaged students allowed for a more focused exploration of the interaction between demographic composition and socioeconomic context. Only schools with 51% of their students categorized as “economically disadvantaged” (E.D.) were included in this part of the analysis. Whether a school was considered E.D. was calculated by dividing the total number of students by the total number of E.D. students. The percentages of each racial group were then taken into account. Schools were included if the predominant race of the population was the same as the major race of the economically disadvantaged (i.e., a predominantly white school with a higher percentage of white E.D. students than minority E.D. students). Another 263 schools were omitted from the study due to missing/unclear data or because the race with the largest percentage of economically disadvantaged students did not match the predominant race of the school’s population. The resulting economically disadvantaged subsample consisted of 766 schools.
The dependent variable of this analysis for both research questions is the math proficiency scores of the students. The students’ math proficiencies were calculated based on the percentage of students with valid scores on the state assessment of math who scored within proficiency levels three or four, meaning they were determined to be either proficient or advanced based on their grade-level appropriate assessment [
30]. Starting in second grade, elementary and middle school students are assessed using the Alabama Comprehensive Assessment Program (ACAP) Summative assessment. To achieve a level three or four, the student must have a strong or advanced understanding of grade-level standards and demonstrate the knowledge and skills at this level of learning, as described in the Alabama Course of Study Standards [
21]. High school students in eleventh grade are assessed based on their ACT scores. Based on the conversion metrics of the ALSDE, students’ proficiency levels correspond with the following ACT score ranges: Level 1 = 1–15, Level 2 = 16–18, Level 3 = 19–24, Level 4 = 24–36 [
21]. For the ACT, scores within levels three and four signify performing at an expected or exceptional level [
31].
The first independent variable for both research questions was school demographic composition. Race and ethnicity were reported through school-level demographic categories, including Asian, Black/African American, American Indian/Alaskan Native, Native Hawaiian/Pacific Islander, White, and Two or more races. For the purposes of this school-level analysis, schools were grouped according to whether the majority of enrolled students identified as White or as members of historically marginalized racial and ethnic populations. This classification was used to examine institutional patterns associated with the demographic profile of schools rather than to position students in relation to whiteness or to suggest homogeneity among diverse racial and ethnic communities. This grouping was used to examine broad structural patterns in school-level outcomes rather than to make claims about individual students or specific racial and ethnic groups. We recognize that combining multiple racial and ethnic populations into a single non-White category reduces analytical precision and may obscure important within-group differences. Therefore, the results should be interpreted as describing broad school-level demographic patterns, not as evidence of uniform experiences among all non-White student populations (White students were chosen as the reference group because 66.5% of the schools in the sample served predominantly white students, as well as the fact that white students make up 51% of the student population of Alabama’s public schools [
21].
The second independent variable for both research questions was socioeconomic status. This binary variable was reported by the schools, labeling students as either economically disadvantaged or non-economically disadvantaged. Students marked as economically disadvantaged are those who are eligible for free or reduced-price school meals, which are reserved for students with a household income below the poverty rate [
32].
The following two variables were considered dependent variables in the first research question and independent variables in the second research question:
Teacher certification. In Alabama, math-specific teachers at every level can have any of nine different types of certification: Adjunct Instructor Permit, Additional Teaching Field, Alabama Educator Preparation Program, Certificate Reciprocity, Emergency Certificate, Foreign Credentials, Interim Employment Certificate, National Board for Professional Teaching Standards, and Provisional Certificate in a Teaching Field [
30]. However, the ALSDE Federal Report Card requires schools to report teachers in one of the following six categories: Six-Year (Class AA), Master’s Degree (Class A), Bachelor’s Degree (Class B), Not Specified, Emergency Certification, and Provisional Certification. The percentages of the various certification types held by individuals in those positions are determined based on the total number of teachers, principals, and other school leaders [
32]. We only included the data for teachers in this study. While Class B, A, and AA certifications are earned through a teaching certification program, provisional and emergency certifications are not. Provisional certifications allow teachers to earn their teaching certificate while teaching full-time for up to three years. They are only required to have a general bachelor’s degree (which can be in any subject) and to enroll in a teacher preparation program or complete an educational master’s degree. Emergency certifications, on the other hand, are issued by the school superintendent if there is no certified teacher available to fill a teaching vacancy (PraxisExam.org:
https://praxisexam.org/praxis-ii/, accessed on 10 March 2025) [
33].
Teacher experience. This rate is reported by the school as the total number of individuals serving as teachers, principals, and other school leaders, and the percentage of those individuals who have more than 2 years of experience in the position for which they are serving [
32]. For this study, we included only the inexperienced teachers who had less than 2 years of experience in their current positions.
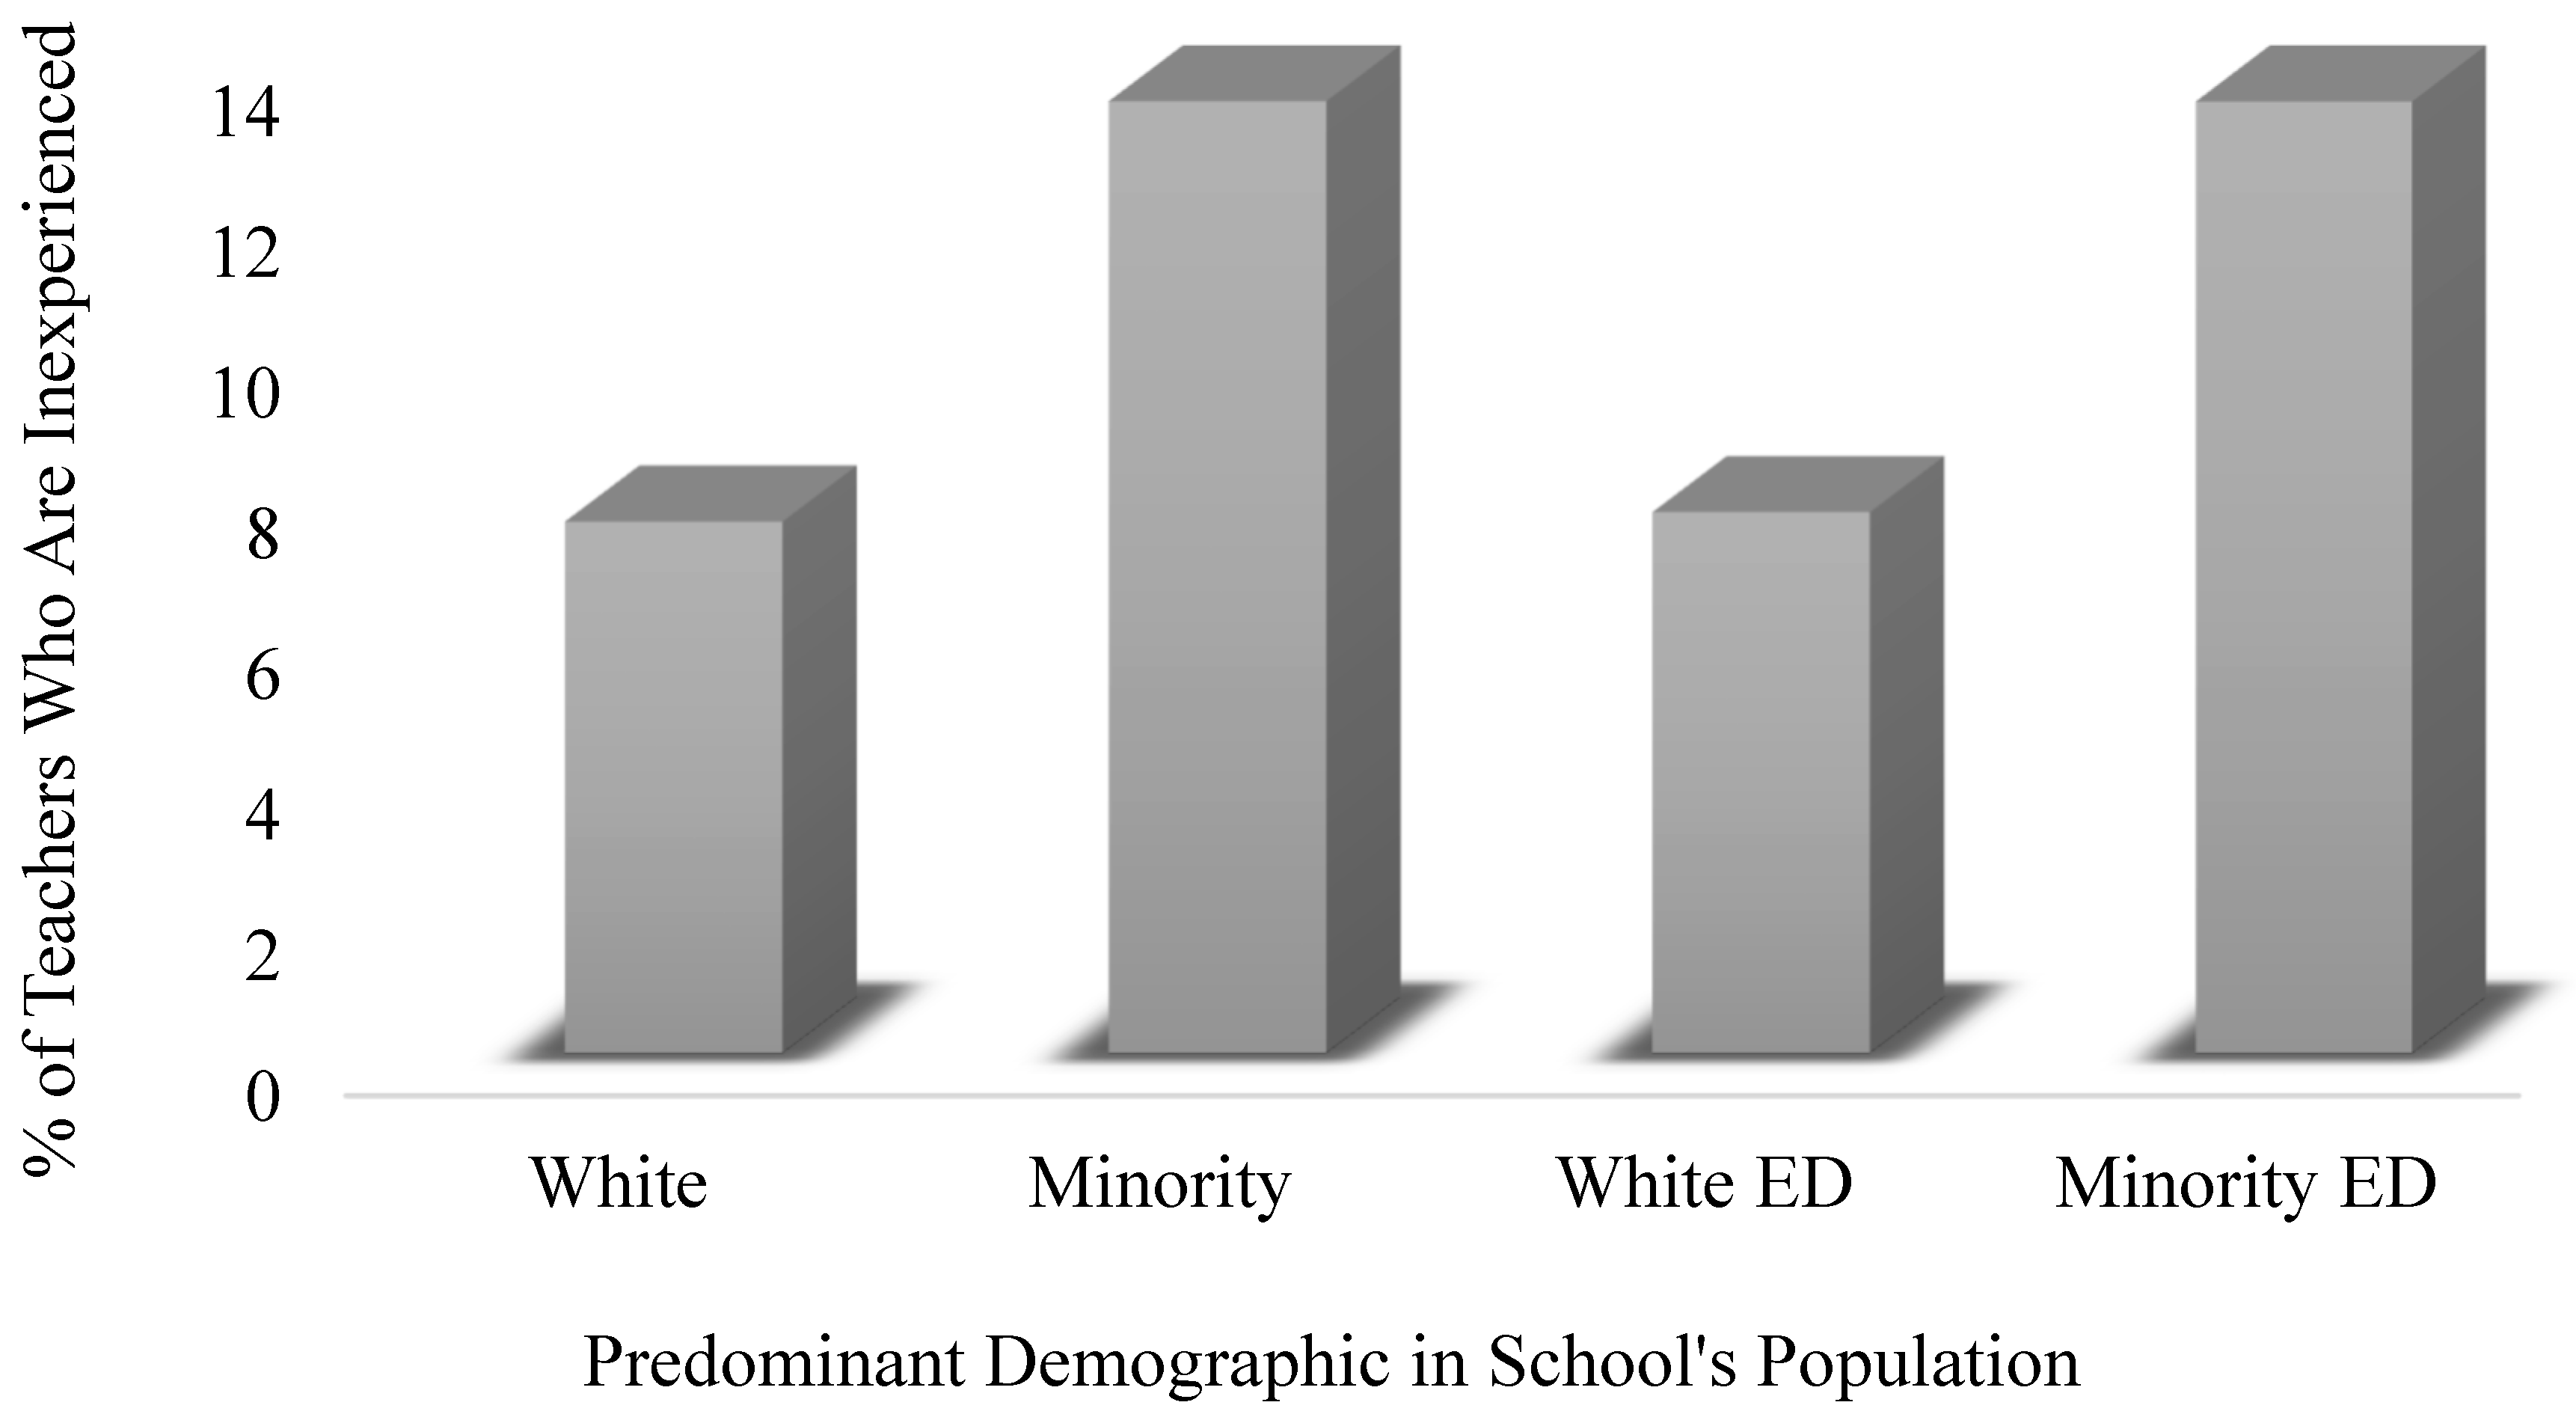
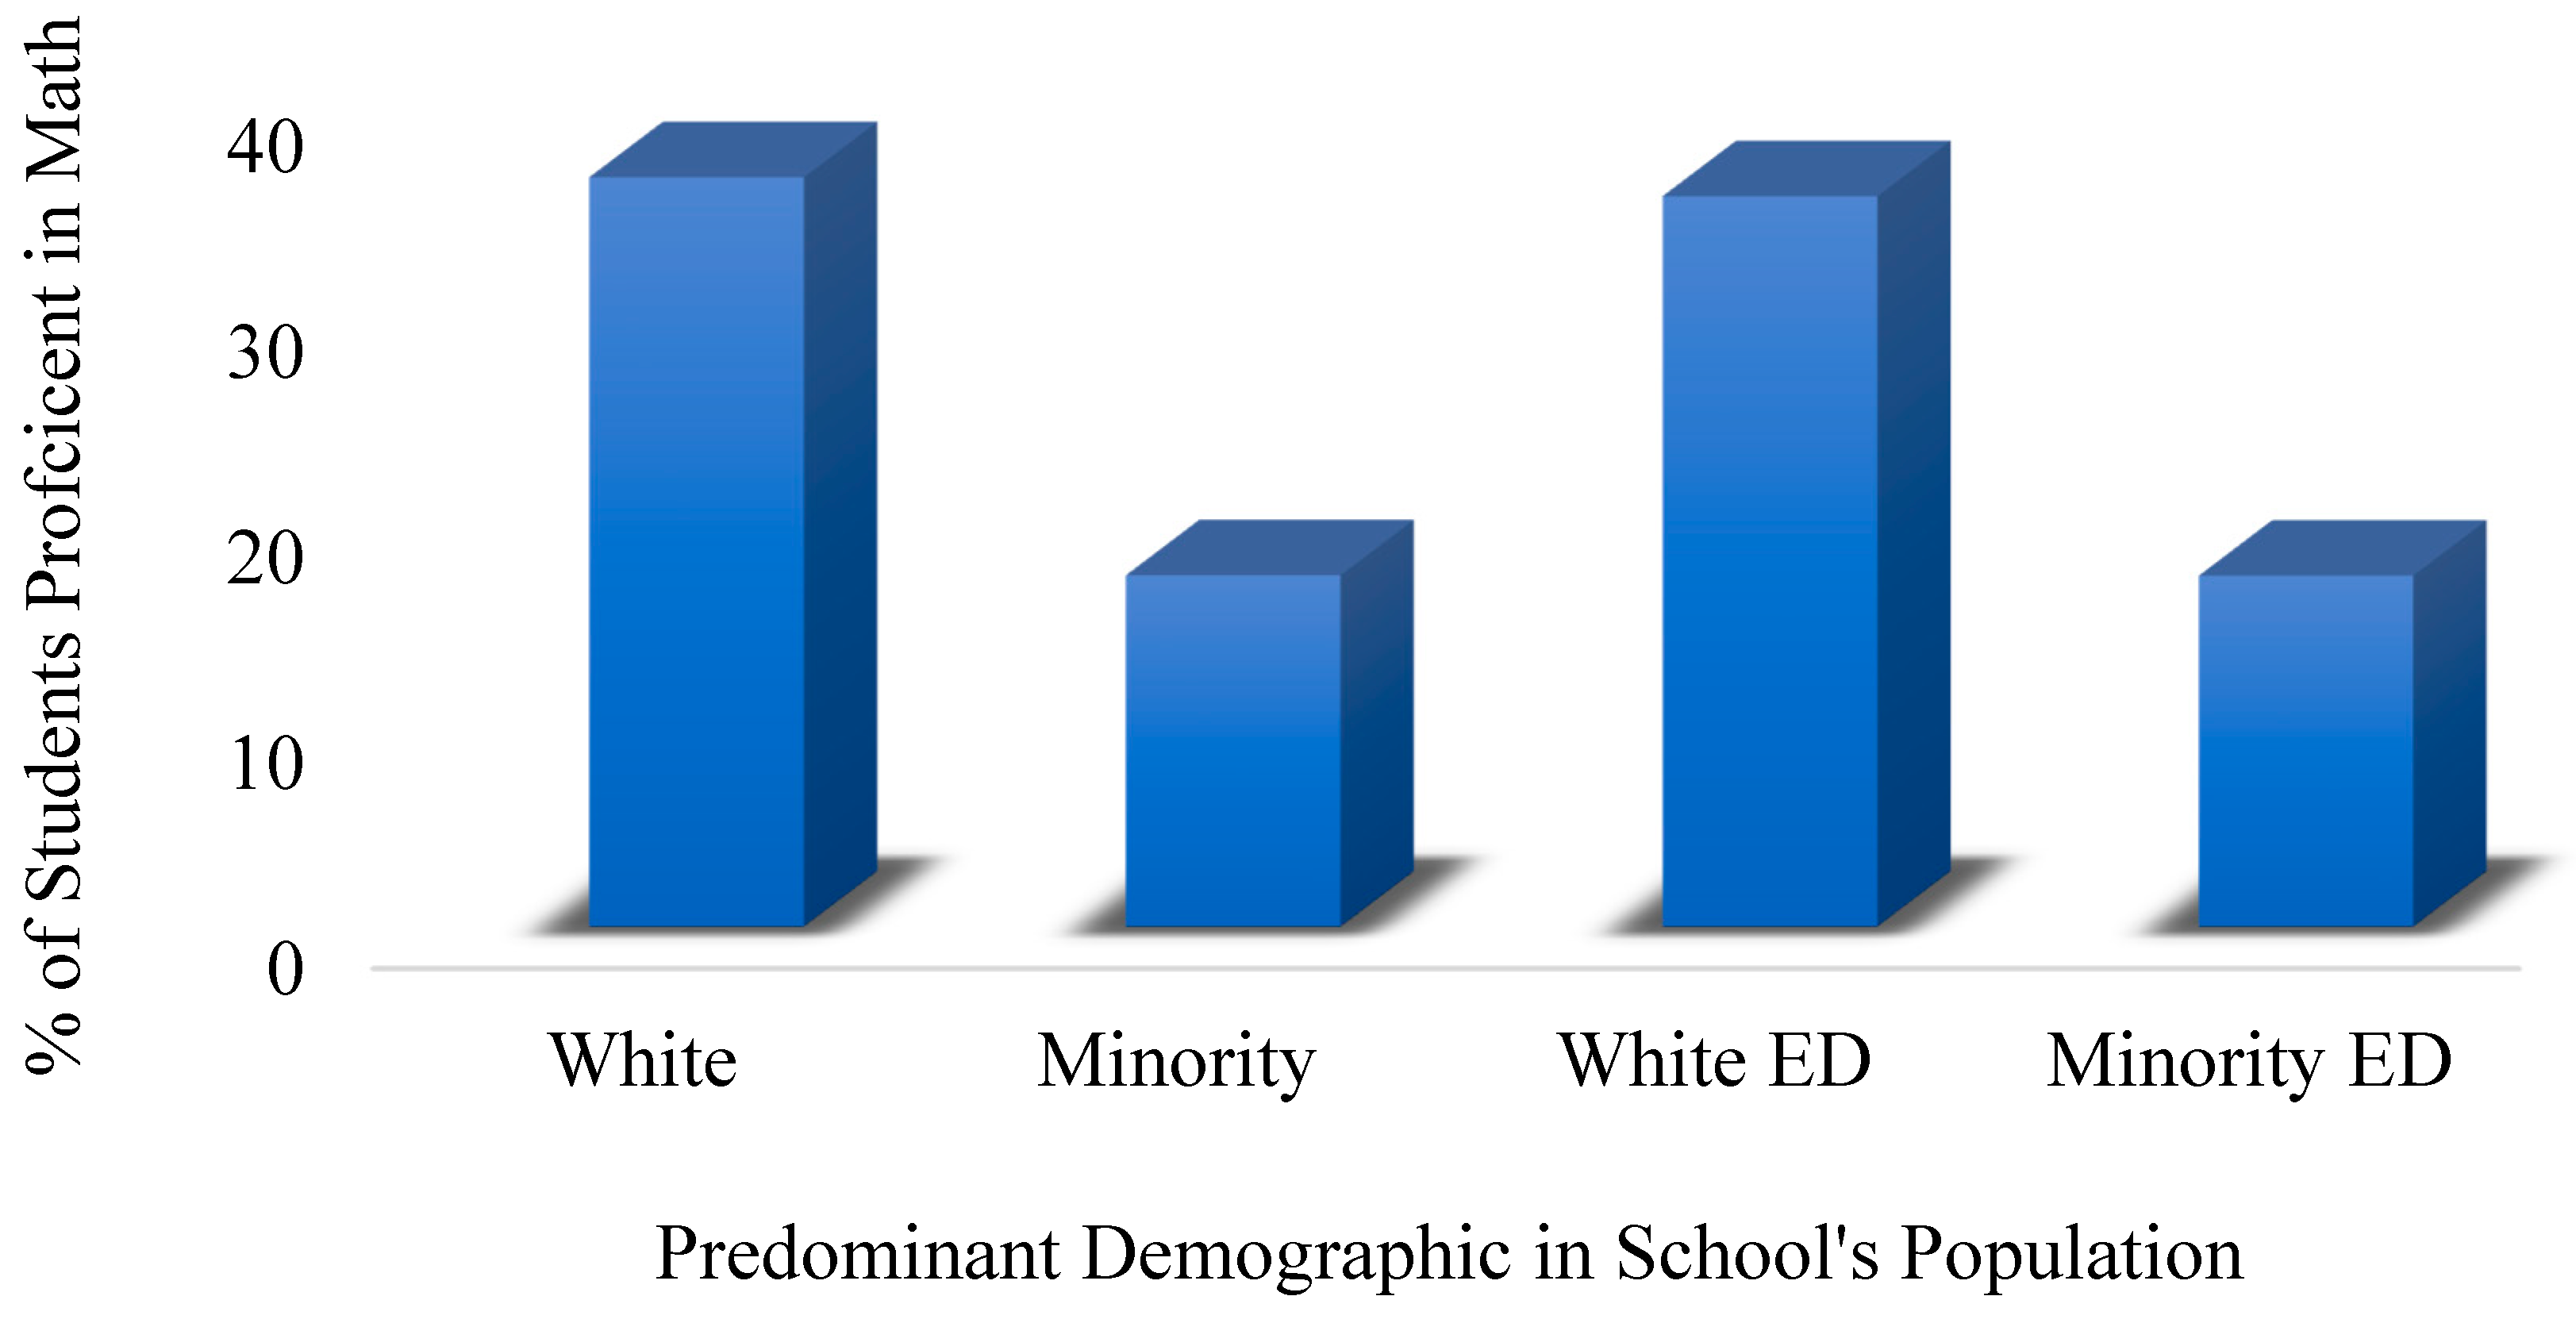
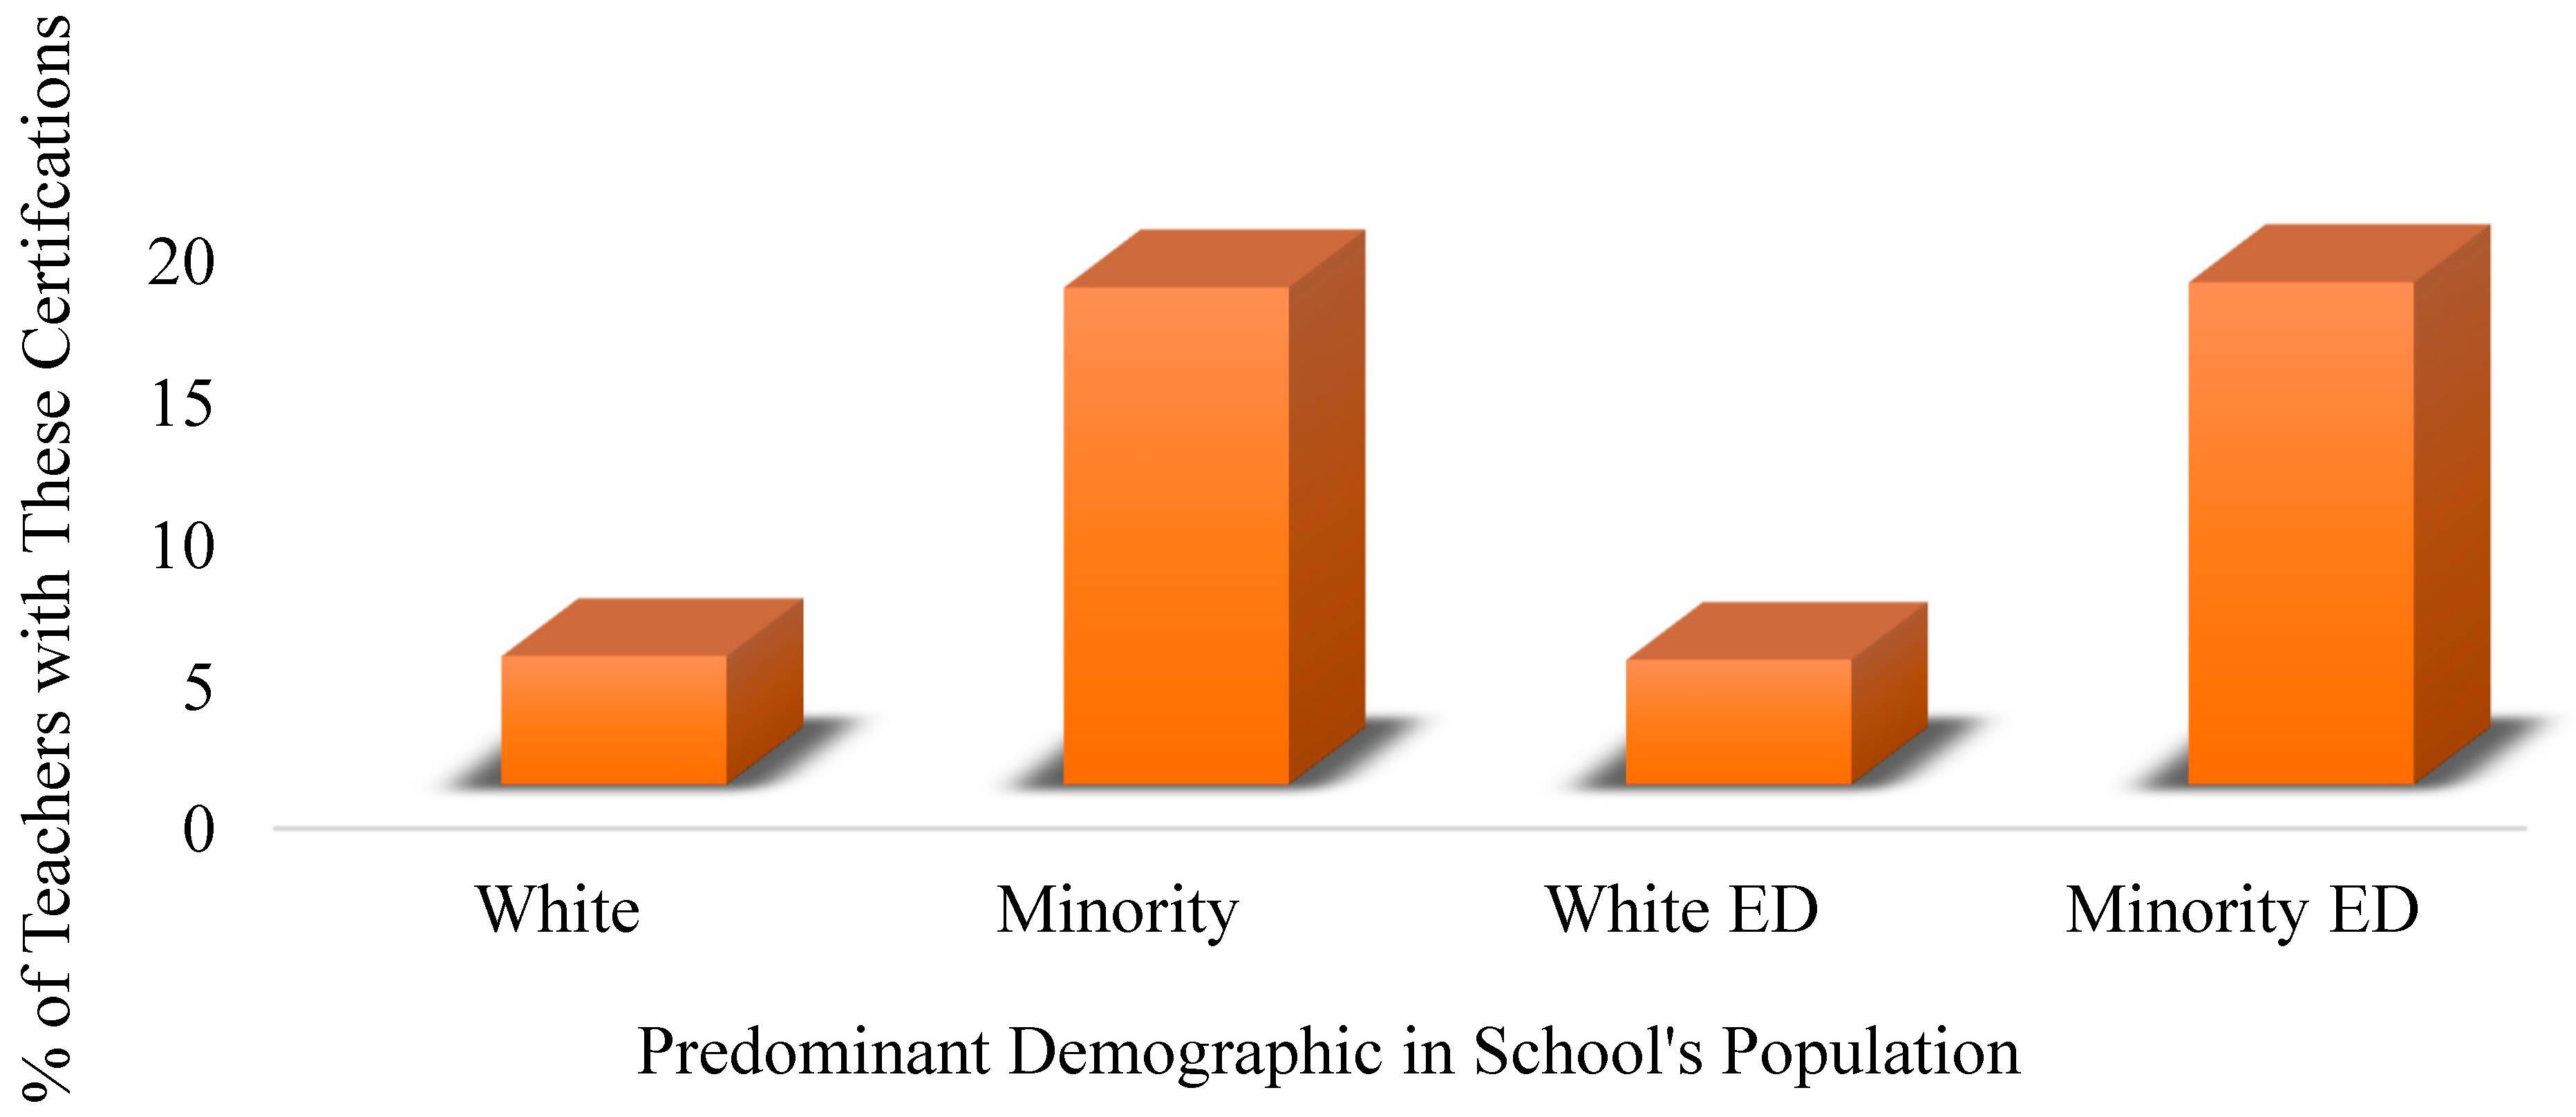
All the figures below display the sample means of each variable given the racial/socioeconomic group.
Figure 3,
Figure 4 and
Figure 5 all show the sample means based on each of the three dependent variables: inexperienced rates, proficiency rates, and emergency or provisional certification rates, respectively. Moreover,
Figure 4 shows the mean math proficiency rates of each sample group by race and by socioeconomic status. With these four representations, it is clear to see the similarities between the means of white and white E.D. schools, as well as minority and minority E.D. schools; however, this is discussed mathematically later in this section.
Table 4 displays a matrix created in Excel to analyze the correlation between Math Proficiency Rate, Emergency or Provisional Certification Rate, and Inexperienced Rate. Based on the data from all 1029 schools (regardless of their racial composition), the emergency or provisional certification rate has a largely negative effect on proficiency, inexperience has a moderately negative effect on proficiency, and inexperience has a moderate effect on emergency or provisional certification.
Table 5 shows the results of three separate independent
t-tests comparing the mean (a) proficiency rates, (b) emergency or provisional certification rates, and (c) inexperienced rates. We decided to compare the white schools and non-White schools, the white E.D. schools and minority E.D. schools, along with each racial group and its corresponding E.D. sample. Each table includes the groups being compared, the mathematical difference between the two means of said groups, the t-stat result, the one-tailed
p-value, and the degrees of freedom. The relatively higher t-statistics and significantly lower
p-values in the “white vs. non-White” and “white E.D. vs. minority ED” group comparisons indicate a significant difference between their sample means. On the other hand, the relatively lower t-stat results and the
p-values above 0.5 indicate that there is no significant difference in the sample means of the “white vs. white ED” and “minority vs. minority ED” group comparisons.
Finally,
Table 6 illustrates the results of the linear regression analysis. Each table is separated based on the predominant demographic of the school and includes the coefficients of each variable in the regression equation, the standard error, and the
p-value, along with the R-squared value listed below each table. The R-squared values for all four regression models were relatively low, approximately 0.14, indicating that teacher certification and teacher experience accounted for only a limited portion of the variation in mathematics proficiency. Therefore, these models should not be interpreted as strong predictive models. Instead, the regression results are best understood as identifying statistical associations between teacher qualification measures and proficiency outcomes within the available school-level data. Based on the
p values, it is clear that the rate of inexperienced teachers is not significantly different from zero, effectively suggesting that the rate of inexperienced teachers was not statistically associated with mathematics achievement in these models.
4. Results
The data from the three
t-tests in
Table 5 all support rejecting both null hypotheses for the first research question. In context, this means that, on average, predominantly white schools have significantly higher mathematical proficiency scores, fewer teachers with emergency or provisional certification, and fewer inexperienced teachers than predominantly schools serving historically marginalized populations. The same relationships can be stated for predominantly economically disadvantaged white schools and predominantly economically disadvantaged schools serving underrepresented student populations. It is also noteworthy that 64.36% of the predominantly White schools in the sample served predominantly economically disadvantaged White students, whereas approximately 94% of the schools serving historically marginalized populations also served predominantly economically disadvantaged minority students, highlighting the overlap between racial composition and socioeconomic disadvantage within Alabama public schools. Furthermore, the absence of statistically significant differences between predominantly White schools and predominantly White economically disadvantaged schools, as well as between predominantly minority schools and predominantly minority economically disadvantaged schools, suggests that disparities associated with school demographic composition remained observable within economically disadvantaged subsamples. However, these findings should be interpreted cautiously. Because this study did not simultaneously control for other school-level characteristics that may influence mathematics proficiency, including funding patterns, school resources, community contexts, or additional indicators of socioeconomic disadvantage, the analyses do not permit conclusions regarding the relative importance of racial and socioeconomic factors. Rather, the results indicate that both dimensions of inequality remain important considerations in understanding differences in educational outcomes across Alabama public schools.
These findings are broadly consistent with earlier scholarship suggesting that differences in mathematics achievement are closely tied to disparities in educational opportunities rather than inherent differences among students. Ref. [
6], for example, argued that achievement gaps frequently reflect unequal access to qualified teachers, adequate resources, and supportive learning conditions. Similarly, ref. [
10] documented that schools serving historically marginalized student populations often encounter fewer institutional supports and less favorable staffing conditions. The present findings extend this body of work by demonstrating that these patterns remain evident within contemporary Alabama public schools and continue to be observable even within economically disadvantaged subsamples. Taken together, the results suggest that disparities in mathematics achievement are embedded within broader patterns of structural inequality that shape students’ opportunities to learn.
Also, the absence of significant differences between predominantly White schools and predominantly White economically disadvantaged schools, as well as between predominantly minority schools and predominantly minority economically disadvantaged schools, suggests that disparities associated with the demographic profile of schools remained observable within economically disadvantaged subsamples. However, because the present analyses did not account for additional school- and community-level factors that may influence mathematics proficiency, these findings should not be interpreted as evidence that racial inequities are more consequential than socioeconomic inequities. Instead, they underscore the complex and interconnected nature of educational disparities in Alabama public schools.
Concerning the effects of teacher certifications and inexperience on mathematical proficiencies, the data in
Table 6 both reject and fail to reject parts of the null hypothesis for the second research question. Because all four R-squared values were so small, we can conclude that the linear regression models found cannot be used as a sole indication of math proficiency; however, this was to be expected based on the prior research findings. The
p-values of the intercept and emergency or provisional certification coefficients suggested that their values are significantly different than zero and thus can be used as math proficiency indicators. On the other hand, the inexperienced rate for all four racial groups has
p-values that suggest the coefficient is not significantly different from zero and thus cannot be used as a math proficiency indicator for any of the four groups. If the models were to be presented based on the linear regression results, they would be as follows:
Predominantly white schools: p = 6.6065 − 0.3989C − 0.0455I,
Predominantly schools serving underrepresented student populations: p = 5.3147 − 0.3706C − 0.0452I,
Predominantly white E.D. schools: p = 6.5504 − 0.3800C − 0.0651I,
Predominantly minority E.D. schools: p = 5.4485 − 0.3802C − 0.0749I,
where
p denotes the square-root-transformed proficiency rate, C denotes the emergency or provisional certification rate, and I denotes the inexperienced teacher rate. In order to obtain the actual proficiency rates, you would need to square the variable
p, since the data used for this regression model was found based on the square root of the values in the original data. Also, though the difference is small, teacher certification has a slightly more negative effect (approximately 0.02) on predominantly white schools than on the other three school compositions. In addition, the R-squared values of
Table 6a–c are slightly less than those of
Table 6d, suggesting that the emergency or provisional certification coefficient is a slightly better indicator of math proficiency for predominantly economically disadvantaged schools serving historically marginalized populations than the other three school compositions.
The relatively low explanatory power of the regression models is also consistent with previous research emphasizing the multifaceted nature of educational inequities. Ref. [
6] cautioned against attributing achievement differences to any single factor, while [
28] highlighted the interconnected influences of institutional capacity, demographic context, and resource allocation. Likewise, ref. [
27] found that school-level conditions interact with socioeconomic disadvantage in complex ways that cannot be adequately captured through a limited set of predictors. Consequently, the modest R
2 values observed in this study should not be interpreted as evidence that teacher qualifications are unimportant, but rather as an indication that mathematics proficiency is shaped by multiple overlapping institutional and contextual factors.
5. Discussion
With teacher certification type being a viable indicator of students’ proficiency in math, it is worth discussing why it is needed and its implications. Though emergency and provisional certifications are very helpful for keeping schools staffed with teachers during teacher shortages, teachers with these types of certifications do not always have the necessary training to effectively present math instruction. Although professional growth continues throughout a teacher’s career, effective teaching requires a foundation of knowledge and skills related to learning theory, instructional strategies, classroom management, and student engagement. These foundational competencies are typically developed through teacher preparation and certification programs before educators assume responsibility for their own classrooms. Their importance is particularly evident in Alabama public schools, where the average student-to-teacher ratio is approximately 16:1 [
34]. To better serve students, it would be beneficial to research the cause of the current teacher shortages and make strides to keep the teachers we have while effectively teaching and training new interested teachers as well.
The observed association between emergency or provisional certification and lower mathematics achievement also echoes recent evidence regarding unequal access to qualified educators. Ref. [
35] reported that racial disparities in educational experiences remain closely linked to differences in students’ access to high-quality teachers, while [
25] demonstrated that opportunity-to-learn conditions continue to shape ethnic inequalities in mathematics achievement. Although the present study cannot establish causal relationships, the consistency between these findings and prior research strengthens the interpretation that staffing patterns may represent one mechanism through which broader structural inequities influence educational outcomes.
Future research could be strengthened by incorporating school-level expenditure data. This data was not readily available in a format that presented each school’s funding, which was not conducive to its inclusion in this study; however, with the proper resources for the inclusion of this variable, we hypothesize that it would significantly impact the results of this study and help move closer to understanding Alabama’s math proficiency gap. On the other hand, unlike many other studies, this research focuses on the inequity in learning based on the overall school population rather than simply the race of the students. When only considering the race of students and not the overall school structure, there is a missing component. Yet even this research is flawed in that it only considers public schools, leaving out private and home-schooled students.
Though this type of research is important, in the grand scheme of racial and educational equity, there is also a broader discussion to be had about mathematical proficiency in the Alabama public school system. If schools serving predominantly White student populations demonstrated higher average mathematics proficiency rates than schools serving predominantly non-White student populations while also employing more experienced and certified teachers, yet fewer than half of the students in those schools achieved proficiency in mathematics, the findings suggest substantial room for improvement in mathematics achievement across Alabama public schools. These findings should not be interpreted as reflecting inherent differences in student capability, but rather as evidence of persistent systemic inequities in educational access, staffing, and institutional support. This is likely the change being targeted by the Alabama Numeracy Act. However, additional policy interventions may be necessary to address persistent achievement disparities. Observed differences should not be interpreted as evidence of inherent differences in student capability, but rather as indicators of persistent structural inequities impacting educational opportunity. Importantly, these findings should not be understood merely as another example of what [
14] described as “gap-gazing.” Rather than documenting proficiency differences in isolation, the present study examined whether those differences corresponded with indicators of educational opportunity, including teacher certification, teacher experience, and socioeconomic context. Consistent with [
15] argument that gap analyses remain valuable when they inform action, the findings point toward specific school-level conditions that policymakers and educational leaders may target to promote greater equity.
These findings suggest that policy responses should move beyond documenting achievement differences and instead focus on modifying the institutional conditions associated with those differences. Efforts to recruit and retain certified mathematics teachers in schools serving historically marginalized and economically disadvantaged populations may represent one promising strategy. Additional investments in induction programs for novice teachers, ongoing professional development, instructional coaching, and equitable resource allocation may further strengthen schools’ capacity to support student learning. Such recommendations align with the [
1] emphasis on access to high-quality instruction and human resources, as well as with recent scholarship highlighting the role of school capacity in mitigating educational disadvantage [
10,
24]. Although no single intervention is likely to eliminate longstanding disparities, addressing multiple dimensions of opportunity simultaneously may offer a more effective pathway toward educational equity.
Beyond informing policy discussions, the present findings also have implications for classroom practice. Although the analyses were conducted at the school level, they suggest that mathematics teachers working in schools serving historically marginalized and economically disadvantaged populations may benefit from intentionally adopting instructional practices designed to expand students’ opportunities to learn. First, educators should maintain rigorous academic expectations for all students while providing differentiated supports that respond to students’ varying levels of prior knowledge and learning needs. Second, teachers may consider incorporating culturally responsive instructional approaches that connect mathematical concepts to students’ lived experiences and cultural backgrounds, thereby promoting engagement and a stronger sense of belonging in mathematics classrooms. Third, frequent formative assessment and timely intervention may help identify misconceptions early and provide targeted support before learning difficulties become entrenched [
35]. Finally, the findings underscore the importance of collaborative professional learning communities, mentoring programs for novice teachers, and instructional coaching that supports teachers in strengthening both mathematical content knowledge and pedagogical practice. Although individual teachers cannot eliminate the systemic inequities highlighted in this study, classroom practices that emphasize high expectations, responsive instruction, and equitable access to meaningful mathematical experiences may help mitigate some of the barriers faced by students and contribute to more inclusive learning environments.
Several limitations should be acknowledged when interpreting these findings. First, the cross-sectional design permits the identification of statistical associations but does not support causal inference. Second, the regression models had relatively low explanatory power, with R-squared values around 0.14, indicating that the included teacher qualification variables explained only a limited proportion of the variation in mathematics achievement. Third, the analyses relied on publicly available school-level data and could not control for potentially important confounding variables, including district funding, school climate, parental educational attainment, neighborhood conditions, student mobility, instructional resources, and access to supplemental academic support [
36]. Fourth, classifying schools into broad demographic categories may obscure meaningful differences among racial and ethnic groups with distinct educational experiences and historical contexts. Although this approach facilitated the examination of school-level structural patterns using the available administrative data, it necessarily reduced analytical granularity. Future studies should employ disaggregated racial and ethnic categories to explore whether the observed institutional patterns vary across specific populations. Finally, excluding schools outside one standard deviation of enrollment size helped reduce the influence of unusually small or large schools but may also have limited the representativeness of the sample. Future research should use more detailed student- and school-level data, disaggregated racial and ethnic categories, and multilevel or longitudinal models to better examine how demographic composition, socioeconomic conditions, staffing patterns, and institutional resources interact to shape mathematics achievement.