1. Introduction
Earthquakes are mechanically complex: fault friction, heterogeneous stress, pore-pressure transients, and unmapped structures make direct, physics-based observation difficult; yet, their occurrence statistics display robust regularities. Empirically, we observe size scaling via the Gutenberg–Richter law, time scaling via Omori–Utsu aftershock decay, and spatial clustering with a percolation-like structure [
1,
2,
3,
4]. Modeling helps to turn these regularities into insight, using approaches that differ in physical detail and computational cost. At one end, dynamic-rupture simulations resolve fault mechanics but are expensive and sensitive to uncertain parameters [
5,
6]. At the other, statistical triggering models such as ETAS efficiently fit and forecast catalogs but are not easily interpretable in geometric terms [
7,
8], while cellular-automaton and slider-block models provide cheaper, more abstract analogs of fault networks [
9,
10,
11].
Burst-based percolation models sit between these extremes. They grow clusters on disordered lattices through discrete activation bursts, naturally producing synthetic event catalogs with known underlying geometry. The constrained Leath invasion percolation (CLIP) [
12] and avalanche invasion percolation (AIP) [
13,
14,
15,
16] models are two such constructions. Both generate loopless clusters on a hypercubic lattice with quenched bond strengths and segment growth into bursts that can be interpreted as event groups or microseismic clusters. Prior work has emphasized their ability to reproduce approximate Gutenberg–Richter-like size scaling and percolation-like spatial organization, making them useful geometric testbeds for induced-seismicity behavior [
17].
Classical percolation theory [
18], however, predicts fixed, dimension-dependent cluster-size exponents, whereas both field catalogs and previous CLIP analyses show apparent non-universal, drifting exponents in burst-size distributions. Injection-induced sequences in particular often display
b-values that vary between stages, wells, or operational regimes [
19,
20,
21]. This raises two related questions: which geometric mechanisms within burst-based percolation could produce such variability, and how should we interpret the resulting exponent changes in terms of an equivalent Gutenberg–Richter
b-value?
Compared with widely used seismicity models, CLIP and AIP deliberately trade physical detail for geometric transparency. They do not attempt to represent friction or stress transfer explicitly, nor are they designed as operational forecasting tools in the way that ETAS-type models are. Instead, they provide synthetic event catalogs in which the underlying fracture-like network and growth rules are fully known, making it possible to isolate how purely geometric effects, such as the dimensionality of the lattice or re-use of previously activated pathways, affect observable size–frequency statistics. In that sense, CLIP/AIP should be viewed as conceptual geometric analogs that sit between abstract percolation theory and more fully mechanical earthquake models, and as providing controlled testbeds for developing data-analytics tools.
In this work we address these questions by treating CLIP and AIP purely as controlled synthetic-catalog generators and focusing on the role of interference during burst growth. We define an interference fraction as the proportion of attempted growth steps that terminate on previously activated bonds, quantifying the degree to which existing structure inhibits further expansion. We then ask whether interference can systematically modify burst-size statistics in ways that depend on the burst number and spatial dimension, and whether such behavior is generic across different burst segmentation rules.
More concretely, we investigate four questions:
Does imposing a loopless constraint on Leath-type bond percolation growth change the underlying Fisher exponents for single-burst clusters, or do they remain consistent with classical percolation scaling?
How do effective burst-size exponents evolve with the burst number and spatial dimension in multi-burst sequences, and how far do they depart from universal percolation behavior?
Can a simple, dimension-dependent interference fraction, measuring geometric overlap between bursts, quantitatively account for the observed exponent drift?
Are these interference–scaling relationships specific to CLIP, or do they also appear in AIP, indicating a more general feature of burst-driven loopless invasion processes?
Our results show that single-burst clusters reproduce the expected percolation exponents across dimensions, confirming that the loopless constraint alone does not produce non-universal scaling. In contrast, multi-burst sequences exhibit systematic, dimension-dependent drift of the effective exponent with a burst number that is strongly correlated with the interference fraction. CLIP and AIP are indistinguishable under these diagnostics, suggesting that interference-driven exponent variability is a generic property of burst-based loopless invasion rather than a model-specific artifact. Mapping the burst-size exponent to an equivalent Gutenberg–Richter b-value yields ranges comparable to those reported for injection-induced seismicity, supporting the interpretation of interference as a geometric proxy for mechanical inhibition that limits the growth of large events in real fracture networks.
The remainder of the paper is organized as follows.
Section 2 summarizes the CLIP and AIP models, the lattice and disorder settings, and the synthetic catalogs and observables used in our analysis.
Section 3 presents the scaling and correlation results, beginning with single-burst behavior and then adding multiple bursts and interference measurements across dimensions and models.
Section 4 discusses implications for interpreting
b-value variability in induced seismicity, outlines how interference-based analytics might be adapted to real catalogs, and highlights limitations and directions for more physically detailed models.
2. Models and Observables
2.1. Lattice, Disorder, and Loopless Invasion
All simulations are performed on an abstract
D-dimensional hypercubic lattice
. The lattice is used only to define the neighborhood structure: each site has
nearest neighbors, connected by bonds of equal geometric length. We do not impose a finite bounding box. Instead, the cluster grows outward from an initial seed until a stopping condition is met, allowing us to avoid finite-size effects. This setting follows standard invasion percolation and percolation studies on hypercubic lattices [
18,
22].
We consider spatial dimensions
. The lower dimensions
are most directly analogous to planar or quasi-planar fault networks [
4], while higher dimensions
–6 provide a controlled way to vary the coordination number
and connectivity. Varying
D in this way allows us to probe how interference and burst statistics depend on the effective interaction range without changing the underlying growth rules.
Disorder is introduced through quenched bond strengths. For every bond
e that ever becomes adjacent to the growing cluster, we assign a strength
independently for each bond. These strengths are quenched, meaning that, once drawn, they remain fixed for the entire simulation. The set
defines a disordered medium that is common to both CLIP and AIP. In later sections we use these bond strengths to define invasion thresholds and to partition the continuous invasion process into discrete bursts, but no additional randomness is introduced into the bond properties.
Cluster growth proceeds by invading one bond at a time from the current growth front, defined as the set of bonds that connect any site in the invaded cluster to a neighboring, uninvaded site. The specific rule used to select which front bond invades next depends on the model variant (CLIP or AIP) and is described in
Section 2.2. Independent of that choice, both models share a common loopless invasion constraint: if the candidate bond connects two sites that are already in the invaded cluster, invading it would close a cycle. In this case the bond is never invaded and is instead permanently discarded.
As a result, the invaded structure is always a tree embedded in
, with no closed loops. This differs from ordinary bond percolation, where sites or bonds are occupied independently and loops are common within supercritical clusters [
18]. In our setting the loopless constraint idealizes a sparse, branching backbone of activated pathways and simplifies both the identification of temporally ordered bursts and the definition of interference metrics, since every bond either extends the tree or is rejected as a loop-forming candidate.
For each dimension
D we also use known bond-percolation thresholds
on the hypercubic lattice as geometric benchmarks [
23,
24,
25]. These thresholds are listed in
Table 1 together with the corresponding coordination numbers
z and the number of independent realizations
generated for each
pair. The thresholds define the critical reference point used to verify that single-burst clusters recover classical percolation exponents, and they provide a convenient scale for specifying the near-critical invasion levels used in the multi-burst simulations.
On this common geometric and disordered background, CLIP and AIP differ only in how candidate front bonds are selected for invasion and how the resulting invasion trajectory is segmented into bursts.
2.2. CLIP and AIP Burst Construction
On the lattice and disorder background defined previously, we construct the constrained Leath invasion percolation (CLIP) and avalanche invasion percolation (AIP) models [
12,
13]. Both grow a single loopless tree on the hypercubic lattice by invading one bond at a time and both partition this growth into discrete bursts that we later interpret as events. They differ only in how candidate bonds on the growth front are chosen and how the resulting invasion trajectory is segmented into bursts.
In both models, a burstis defined as a spatially contiguous sequence of bond invasions initiated from a single seed under fixed growth parameters. The union of all bursts in a realization forms a single loopless cluster, and successive bursts interact geometrically through the pre-existing tree.
In CLIP, the microscopic growth rule within a burst is a loopless variant of the Leath algorithm for bond percolation [
18,
26]. We fix a control parameter
that plays the role of an occupation threshold and proceed as follows for each burst:
Initialize the burst from a single seed site. All bonds incident to the seed constitute the initial growth front.
At each step, select any bond e on the current growth front whose strength satisfies . If no such bond exists, the burst terminates.
If e connects the current cluster to a previously uninvaded site, invade e and add the new site to the cluster. All bonds incident to this new site are added to the growth front.
If e connects two sites that are already part of the cluster, we do not invade e and we discard it as a rejected loop-forming candidate.
Within a single burst, this procedure generates a tree-like cluster of bonds with
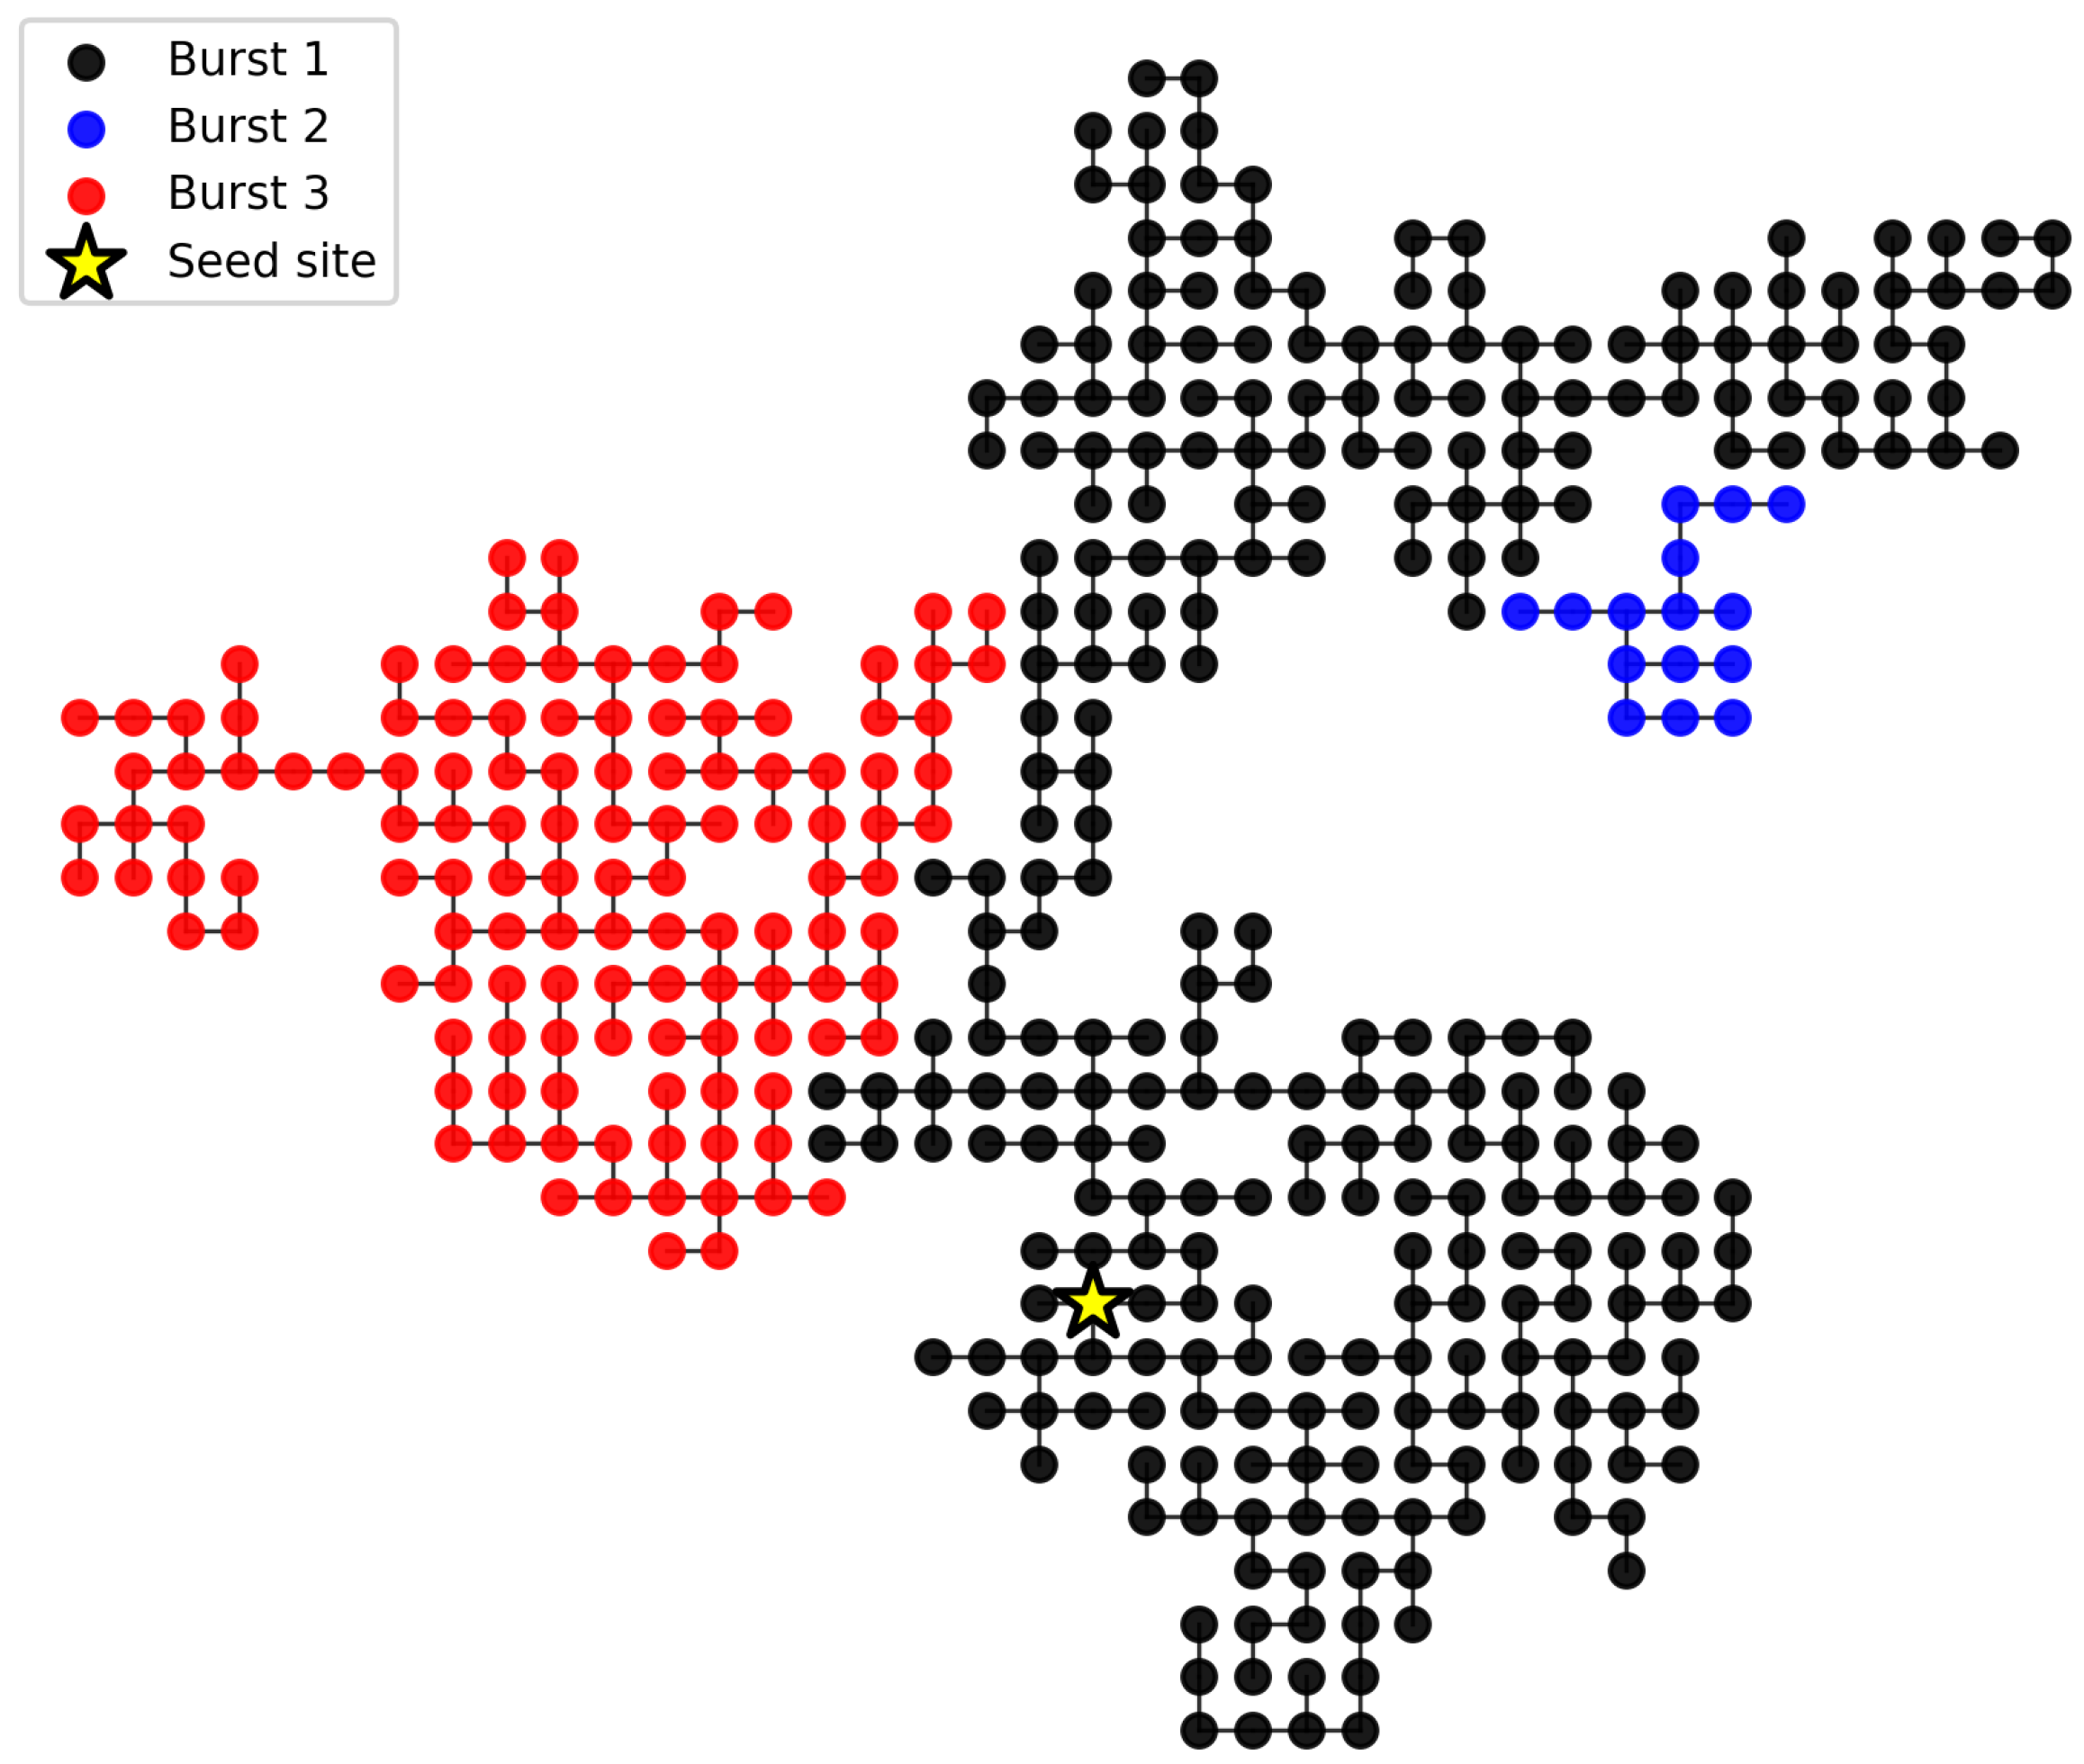
attached to the seed. Multi-burst CLIP realizations are obtained by chaining together repeated Leath episodes on the same quenched disorder. After a burst terminates, a perimeter site is chosen at random, serving as the seed site for the next burst, which grows according to the loopless Leath algorithm. This construction produces a multi-burst CLIP realization consisting of
Leath episodes connected through a single loopless tree [
12]. The size of burst
k,
, is defined as the number of bonds invaded during episode
k, and the index
k records its position in the growth sequence. A visual of the resulting cluster is presented in
Figure 1.
In AIP, the underlying growth is instead a loopless invasion percolation process driven by extremal dynamics on the growth front [
22]. Rather than imposing a fixed occupation threshold during growth, we proceed as follows:
Initialize the cluster from a single seed site; all bonds incident to the cluster form the growth front.
At each step, among all bonds
e on the growth front, identify the bond with minimum strength,
If connects the cluster to a previously uninvaded site, invade , add the new site, and update the growth front by including any newly exposed bonds. Otherwise, discard without invasion and continue with the next-weakest bond on the growth front.
This extremal rule produces a loopless invasion percolation tree whose geometry is controlled entirely by the quenched strengths
. When interpreted in terms of an effective control parameter, the invaded bonds tend to cluster near
with self-organized fluctuations about that value [
13].
To define bursts in AIP in a way directly comparable to CLIP, we segment the continuous invasion trajectory a posteriori using a fixed invasion threshold pth. Let denote the sequence of bond strengths in order of invasion steps t. The current burst terminates and a new burst begins whenever an invading bond first exceeds the threshold, th, and this triggering bond is included in the new burst. Growth of the new burst continues until the threshold is crossed again.
This procedure yields an ordered sequence of AIP bursts on a single loopless invasion percolation tree. As in CLIP, we retain only the first bursts in each realization for analysis. In this framing, bursts in AIP are not an additional dynamical ingredient but an interpretive lens applied to the underlying invasion percolation trajectory. The extremal growth rule determines which bonds are invaded, while the fixed threshold pth partitions this trajectory into discrete avalanche-like episodes.
2.3. Synthetic Catalogs
Given the loopless burst constructions in
Section 2.1 and
Section 2.2, we now describe how we assemble synthetic catalogs for statistical analysis. Throughout, we interpret each burst as the analog of a single event (e.g., an earthquake or microseismic episode). A single simulation run (realization) therefore yields a finite sequence of bursts on a common loopless cluster, which we treat as one synthetic catalog.
For each choice of spatial dimension
D and model variant (CLIP or AIP), we generate an ensemble of independent realizations under the shared geometric and disorder settings of
Section 2.1. In CLIP, repeated Leath-type episodes at fixed
are initiated from breakthrough sites on the current perimeter. In AIP, a single continuous invasion percolation trajectory is segmented a posteriori using a fixed threshold
pth [
12,
13,
14]. In both cases, the union of all bursts forms a single tree on the lattice comprising sequential bursts.
We define the length of each catalog by fixing the number of bursts per realization rather than imposing a maximum cluster size or finite bounding box. Specifically, we choose a target number of bursts and terminate the simulation as soon as the -th burst ends. This choice avoids artificial outer-boundary effects and ensures that all statistics are conditioned on the same number of bursts per realization. For the remainder of this work, we set .
To obtain robust ensemble statistics, we repeat this procedure for
independent realizations for each
pair. The values of
and the corresponding percolation thresholds
used as geometric benchmarks are summarized in
Table 1. Across the ensemble, the full dataset can be viewed as a collection of synthetic event catalogs indexed by realization
r and burst number
k, from which we extract burst-size distributions, interference fractions, and related observables as described in
Section 2.4.
2.4. Observables and Scaling Metrics
We characterize the models using two primary classes of observables: burst-size statistics and an interference fraction that quantifies the relative importance of interference-driven bursts as the invasion progresses. A burst is defined as a connected invaded cluster of size s (number of bonds). In the multi-burst setting, bursts are indexed by along each realization, where denotes the first burst encountered, the second, and so on.
In standard percolation notation, the cluster number distribution scales as , where is the number of clusters of size s per lattice site. In our simulations we instead grow clusters from a randomly chosen occupied seed site. The probability that a randomly chosen seed belongs to a cluster of size s is proportional to . The burst-size probability density observed in CLIP and AIP therefore scales with exponent . Throughout this work we fit and report this site-weighted exponent directly, since it is the quantity most closely tied to burst statistics in these models.
All scaling exponents are estimated from the complementary cumulative distribution function (CCDF) of burst sizes,
rather than from binned probability densities, in order to reduce binning bias and emphasize the tail. For single-burst statistics we follow the protocol of Ref. [
23]: clusters are grown at the critical point
in each spatial dimension, and only the first burst in each realization is retained. For multi-burst statistics we work in the subcritical regime at fixed reduced distance
for all dimensions, so that the distance to criticality is held constant when comparing
k and
d. For each dimension
d and burst index
k, we form the CCDF of burst sizes over all realizations and estimate an effective exponent
.
Power-law fits are obtained using the procedures for heavy-tailed data outlined in Ref [
27]. For a given lower cutoff
, the exponent is estimated for
, where the optimal
is chosen by minimizing the Kolmogorov–Smirnov distance between the empirical and fitted CCDFs. The resulting exponents are reported as
for single bursts and as
as a function of the burst index in the multi-burst analysis.
The interference fraction
summarizes how much of the
kth burst is generated by interference events. At the level of individual invasion steps, sites (or bonds) are classified as interference or non-interference according to the geometric rules described in
Section 2.2. For each realization and burst index
k, we define
where
is the number of invaded sites in the
kth burst that are labeled as interference-driven and
is the total number of sites in that burst. Averaging
over realizations yields a mean interference fraction
for each model and dimension. The sequences
and
are the main observables for the interference–scaling analysis in later sections, including correlation measures between
and
.
Uncertainty on all reported quantities is assessed by nonparametric bootstrap resampling [
28]. Within each model–dimension combination, we resample realizations with replacements and, for each bootstrap sample, recompute the observables of interest (single- and multi-burst exponents, interference fractions, and correlation coefficients). Unless stated otherwise, error bars and shaded bands correspond to the 2.5th and 97.5th percentiles of the bootstrap distributions, which define
confidence intervals.
3. Results
We organize the results in four steps. We first verify that single-burst clusters in both CLIP and AIP recover classical percolation scaling, confirming that the loopless constraint alone does not alter the universal exponents. We then examine how the effective burst-size exponent evolves with burst index in multi-burst CLIP sequences, followed by a quantitative analysis of a dimension-dependent interference fraction and its correlations with the scaling exponent. Finally, we compare multi-burst behavior in CLIP and AIP to test whether the interference–scaling relationship is specific to one model or generic across loopless invasion-percolation-type constructions.
3.1. Single-Burst Scaling and Loopless Universality
We begin with single-burst clusters grown at the bond percolation threshold
in each spatial dimension
. For each
pair, we retain only the first burst in each realization and estimate the site-weighted burst-size exponent
from the CCDF
using the Clauset–Shalizi–Newman procedure described in
Section 2.4.
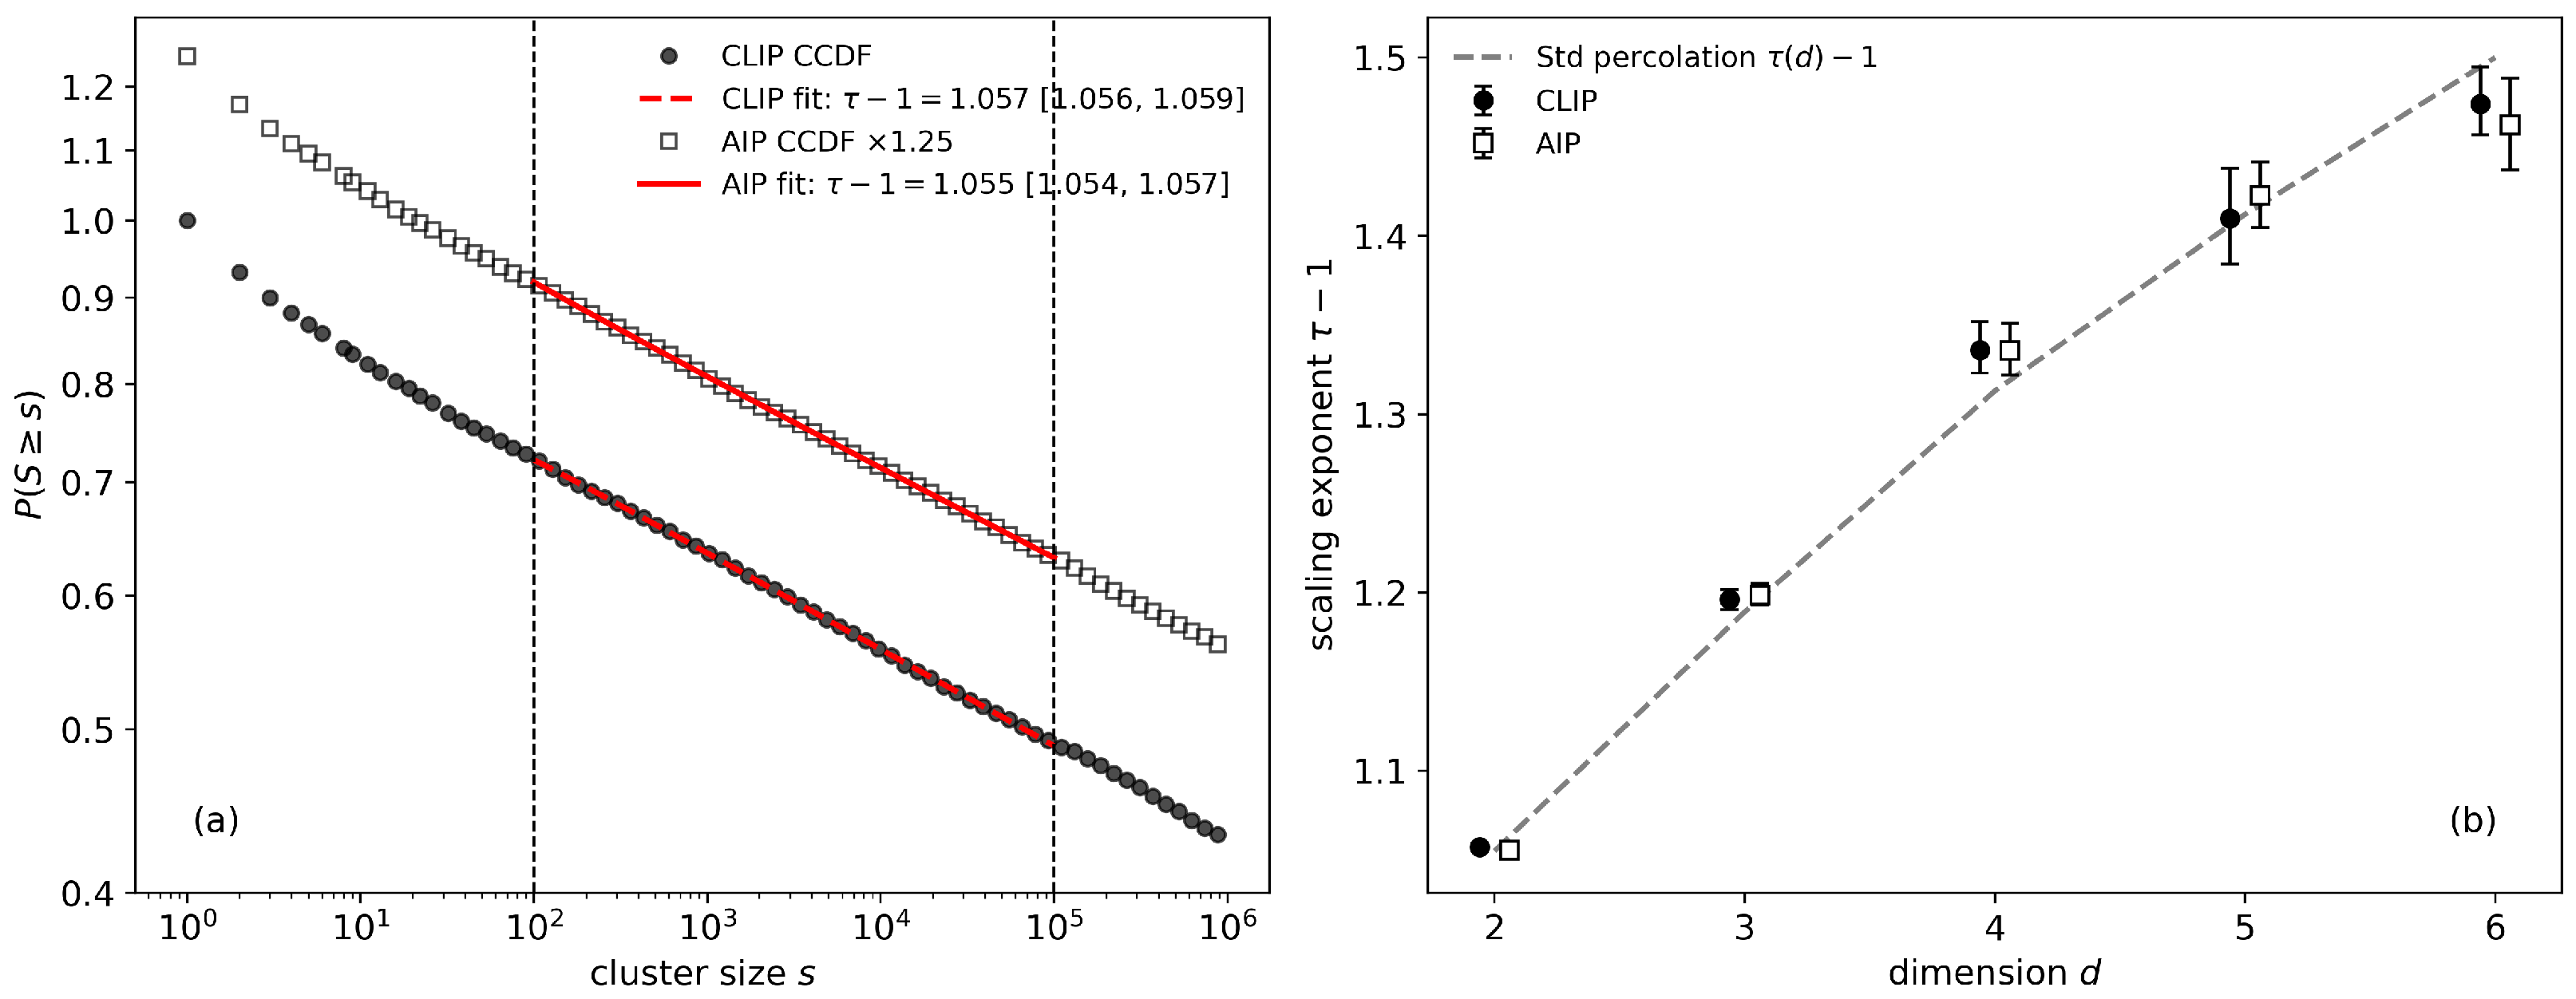
Figure 2a shows representative CCDFs for single-burst cluster sizes in two dimensions for CLIP and AIP. Both models exhibit clean power-law tails over several orders of magnitude, and the fitted exponents agree within the bootstrap confidence intervals.
Figure 2b summarizes the fitted
across dimensions: for both CLIP and AIP, the estimates are consistent, within uncertainty, with reference values obtained for ordinary bond percolation on hypercubic lattices. This confirms that imposing a loopless constraint on Leath-type or invasion percolation growth does not, by itself, change the underlying Fisher exponent, in agreement with earlier work on loopless site percolation [
29].
These single-burst results establish a baseline that isolated bursts in both CLIP and AIP lie in the same universality class as classical percolation, and any apparent non-universal scaling in multi-burst sequences must therefore arise from how successive bursts interact, rather than from the loopless constraint or the microscopic growth rule alone.
3.2. Multi-Burst Scaling in CLIP
We next examine how the effective burst-size exponent evolves with burst index
k in multi-burst CLIP sequences. For each dimension
, we generate
independent realizations, each consisting of
bursts grown at a fixed reduced distance from criticality,
and estimate an effective exponent
for each burst index
k from the CCDF of burst sizes pooled over realizations.
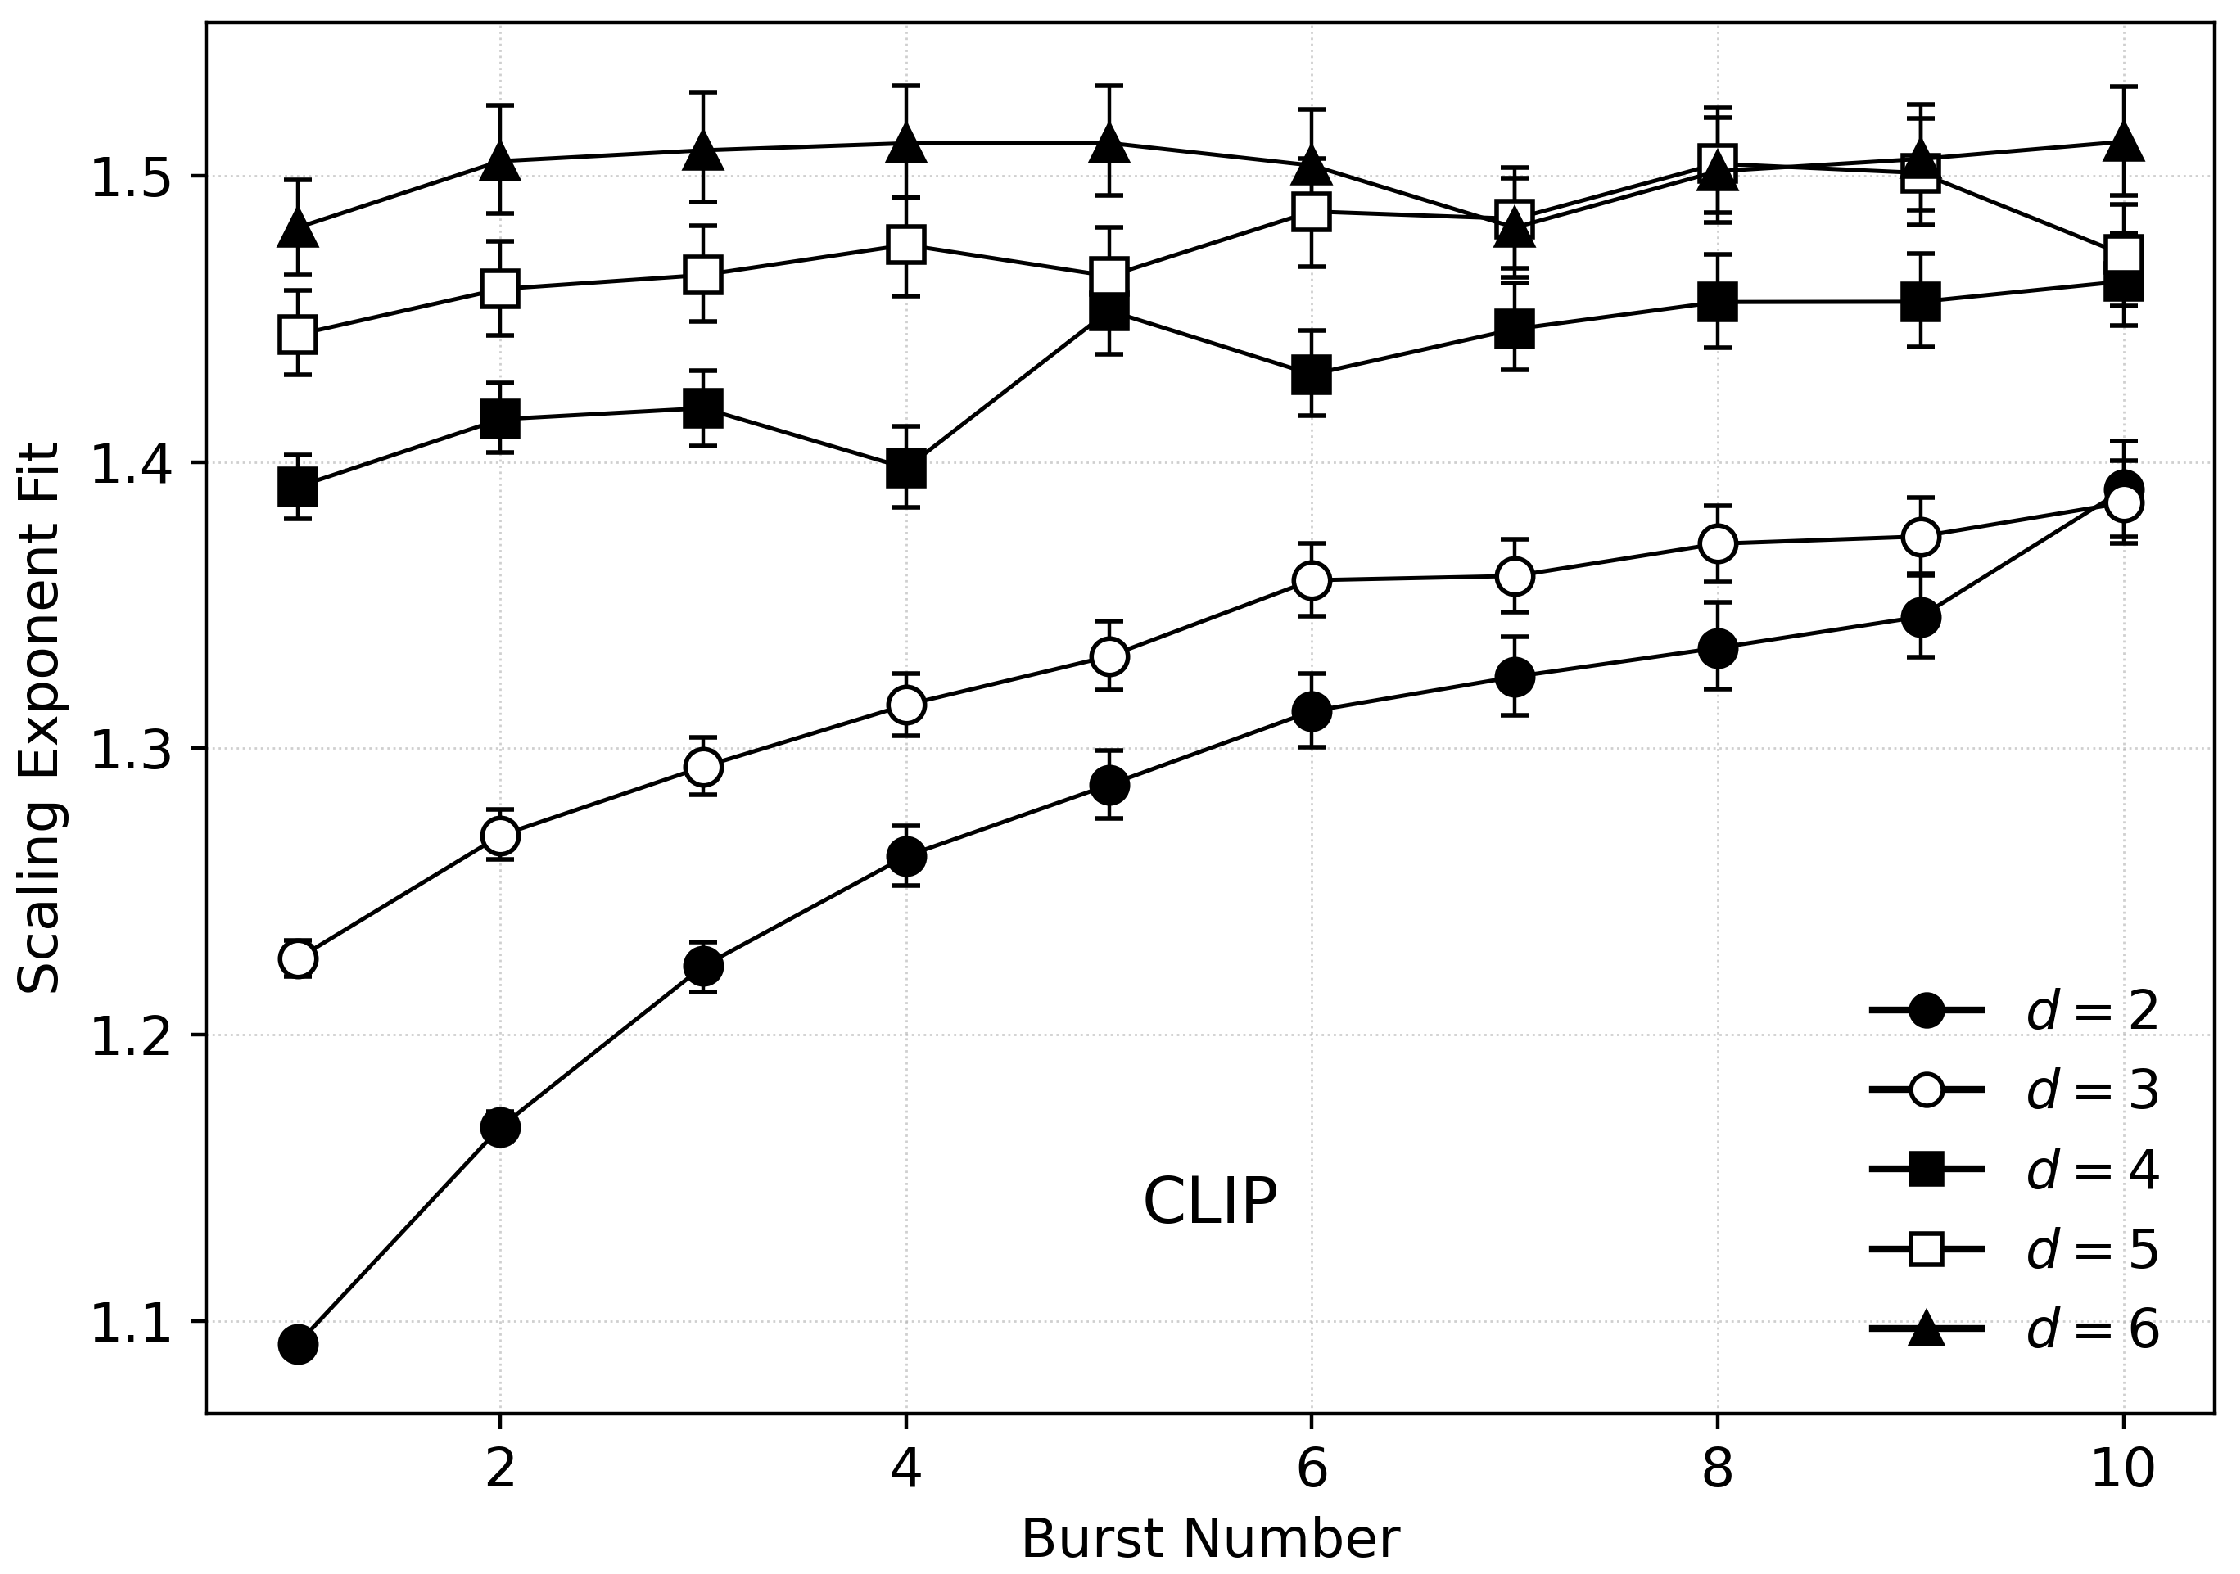
The resulting evolution of
with
k for CLIP is shown in
Figure 3. For all dimensions, the first burst
reproduces, within error, the single-burst exponent at criticality, consistent with the baseline established in
Section 3.1. For later bursts, the exponent increases systematically with
k, indicating a progressive steepening of the burst-size distribution and a relative suppression of large bursts as the invasion proceeds.
The magnitude of this drift depends strongly on dimension. In and 3, increases rapidly over the first few bursts before approaching a plateau, implying that the size distribution for late bursts is substantially steeper than for the first burst. As d increases, the slope of versus k decreases and the curves become progressively flatter. By , the drift with k is weak and the exponents for early and late bursts are nearly indistinguishable within their confidence intervals. This dimensional trend is consistent with the intuition that higher coordination number provides more available directions for growth and reduces the likelihood that later bursts are strongly constrained by the pre-existing structure. In the limit of very high dimensions, where percolation exponents approach their mean-field values, we expect this interference-driven drift to become negligible.
Taken together, these results show that CLIP exhibits dimension-dependent non-universality in multi-burst sequences. Each burst individually is consistent with classical percolation scaling when considered in isolation but the aggregate statistics of bursts in a fixed sequence display a systematic dependence of the apparent exponent on burst order that weakens with dimension.
3.3. Interference Fraction and Correlation Analysis
To test whether the exponent drift described above can be attributed to geometric interference between bursts, we analyze the interference fraction defined in
Section 2.4. For each realization and burst index
k, we compute Equation (
4) and then average over realizations to obtain a mean interference fraction
for each dimension.
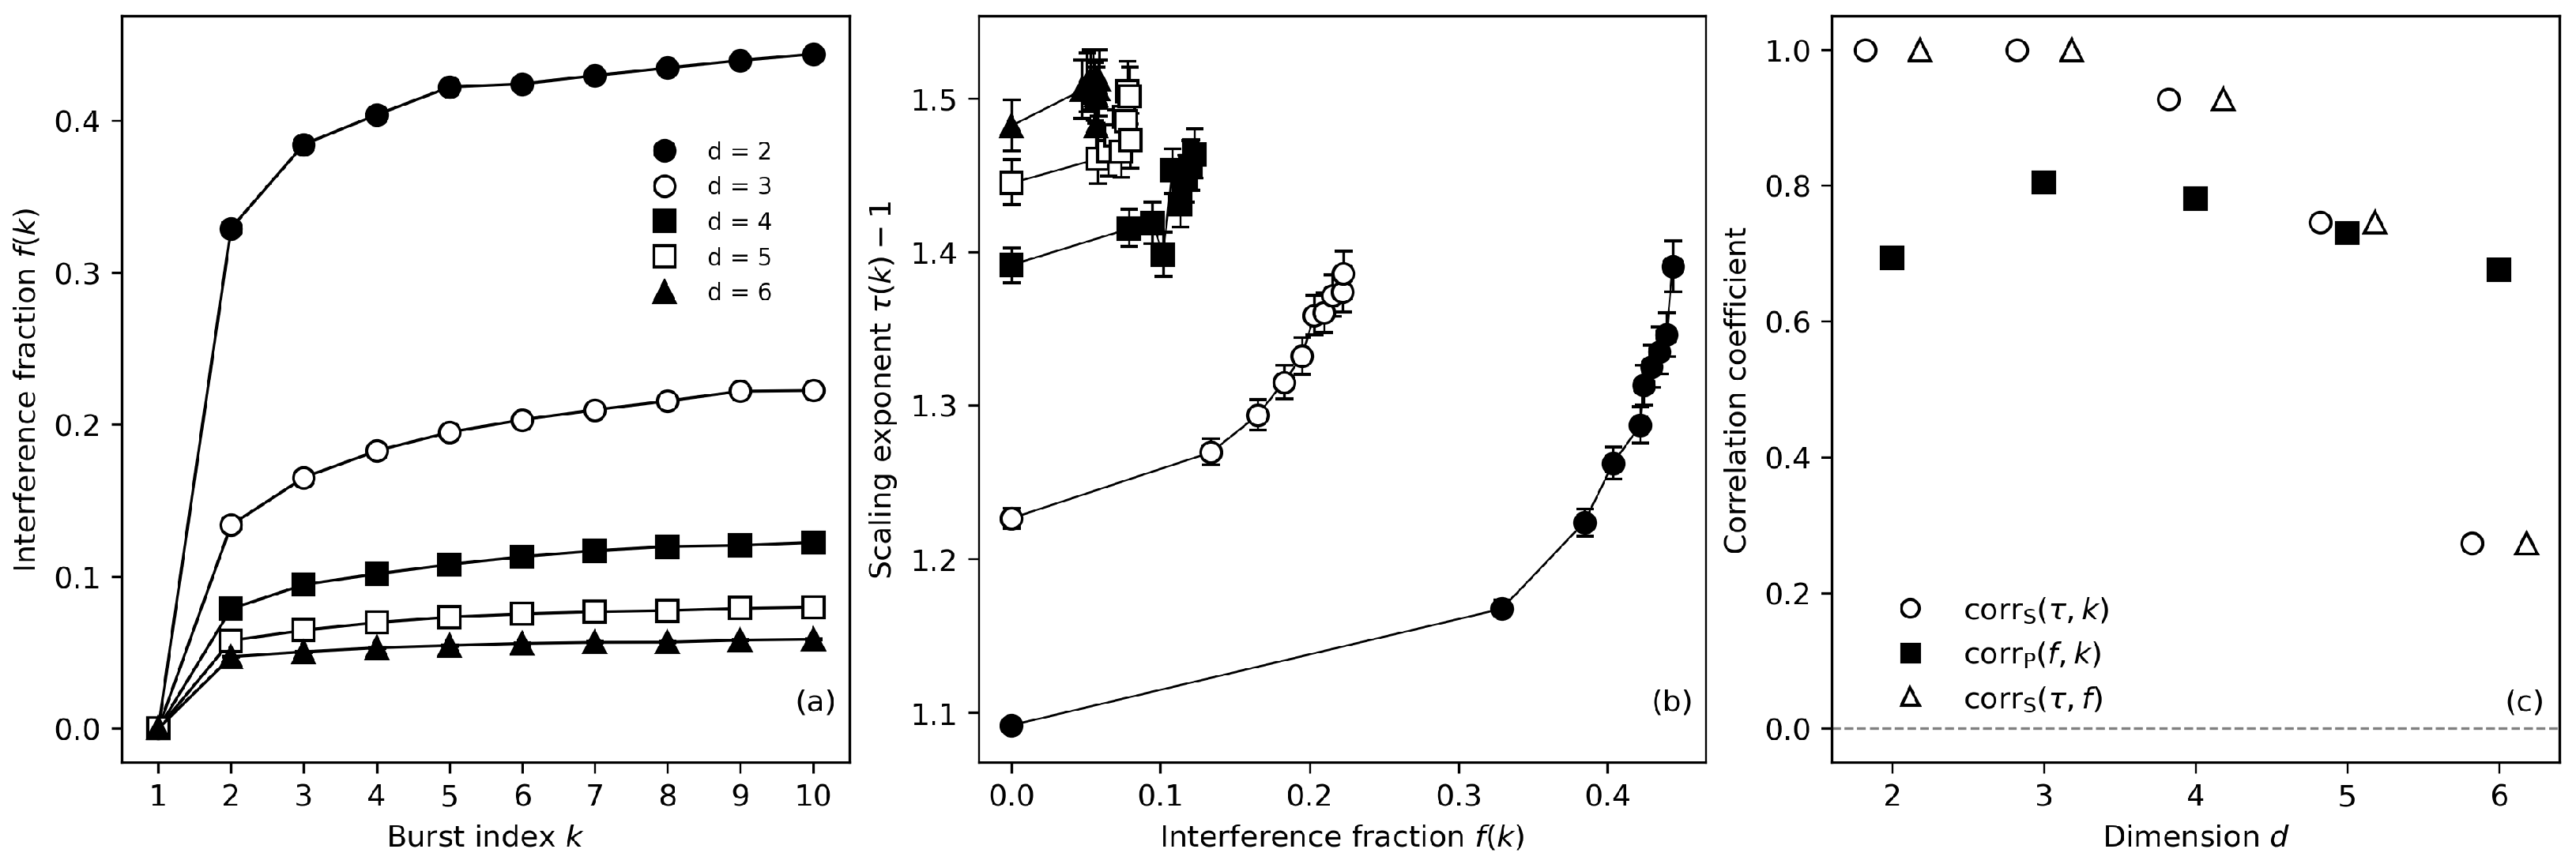
Figure 4a shows
as a function of burst index for CLIP. As expected,
for all
d because the first burst grows into an initially empty lattice. For
, the interference fraction increases with
k and then approaches a dimension-dependent plateau. The plateau values decrease monotonically with dimension. Interference is strongest and saturates at the highest levels in
, and weakens progressively as the number of available growth directions increases.
The direct relationship between interference and scaling is illustrated in
Figure 4b, which plots
against the corresponding
. For all dimensions the points lie on an approximately monotonic curve, indicating that bursts experiencing higher interference systematically exhibit steeper size distributions. This suggests that the apparent non-universal exponent drift in
Figure 3 is driven by the accumulation of interference, rather than by the burst index itself.
To quantify these trends, we compute Pearson [
30] and Spearman [
31] correlation coefficients between three pairs of quantities:
,
, and
, using
and bootstrap resampling over realizations to estimate uncertainty. The resulting correlation coefficients are summarized in
Figure 4c. In low dimensions (
–3), both correlation measures between
and
k are strongly positive, reflecting the clear increase in the exponent with burst order. The correlations between
and
k are also strong, indicating that interference accumulates systematically over the burst sequence.
As dimension increases, the Pearson correlations between
and
k and between
and
k decrease in magnitude, while the Spearman correlations remain high, especially for
versus
k. This pattern suggests that, in higher dimensions, the dependence of interference and exponent on the burst index becomes weaker and more nonlinear. The correlation between
and
is strong and positive in
and 3, consistent with the approximate functional relationship in
Figure 4b, but decays with
d and becomes statistically weak by
. This dimensional weakening mirrors the reduced drift in
Figure 3 and supports the interpretation that interference is the primary driver of the effective exponent variability in CLIP, particularly in low dimensions.
3.4. Comparison of CLIP and AIP Multi-Burst Sequences
Finally, we test whether the interference–scaling relationship identified in CLIP is specific to that model or generic across loopless invasion-percolation-type constructions by comparing multi-burst behavior in CLIP and AIP. For AIP we use the loopless bond variant described in
Section 2.2, segmenting the continuous invasion trajectory into bursts using a fixed threshold
pth chosen to match the CLIP control parameter. We then repeat the same analysis used for CLIP, estimating
from CCDFs of burst sizes at each burst index and dimension.
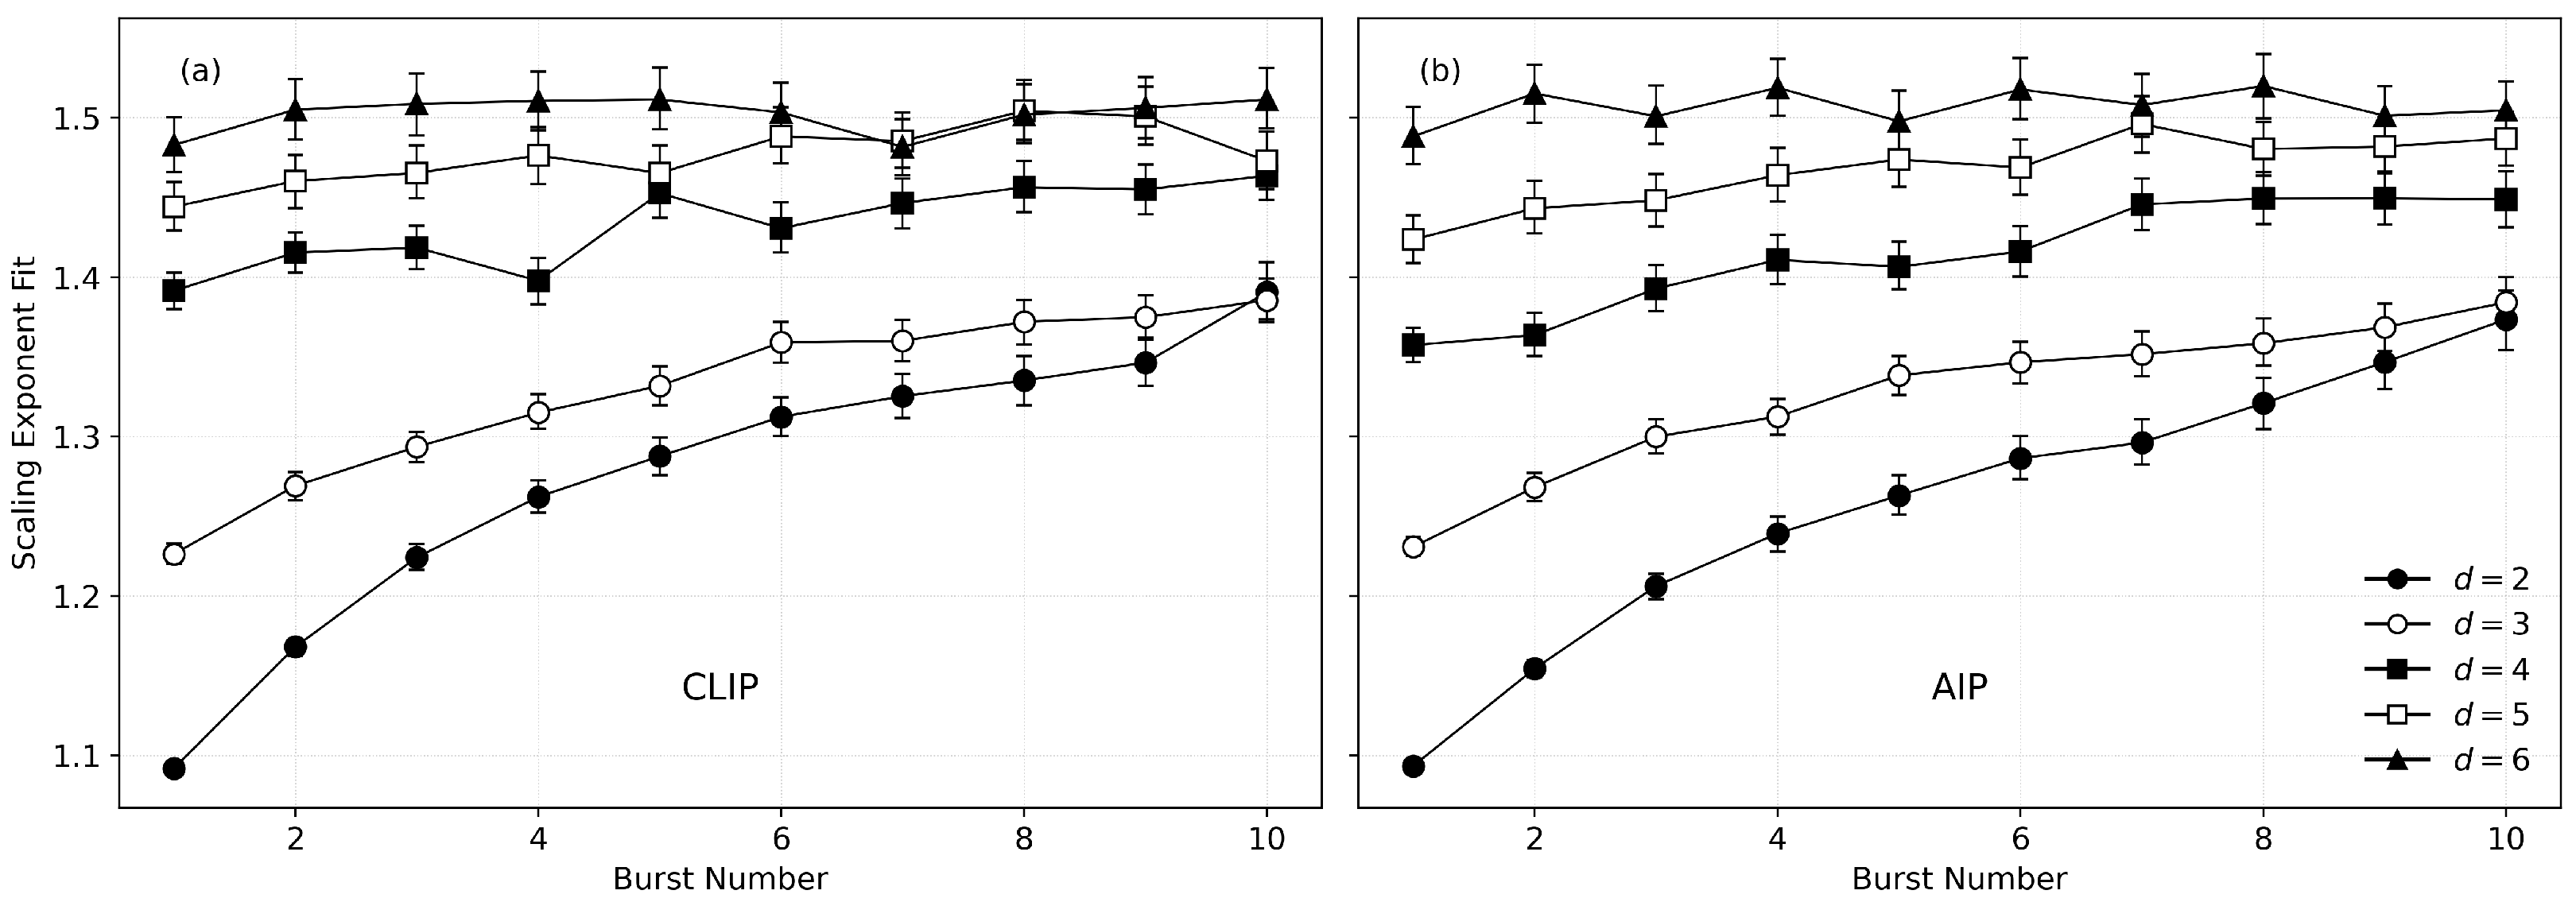
Figure 5 compares
versus
k for CLIP (
Figure 5a) and AIP (
Figure 5b). Within each dimension, the two models produce nearly indistinguishable curves: the initial exponents at
agree within confidence intervals, and the subsequent drift with the burst index has the same magnitude and shape. Differences between CLIP and AIP are smaller than the bootstrap uncertainties for all
d and
k considered.
This close agreement shows that, under the diagnostics used here, CLIP and AIP are effectively equivalent: once the growth is constrained to be loopless and segmented into bursts on a common disordered lattice, the detailed microscopic rule (Leath-type growth with a fixed threshold versus extremal invasion with a posteriori thresholding) does not alter the observed evolution of the burst-size exponent. Instead, the key control parameter is the dimension-dependent interference fraction, which both models generate in essentially the same way. In this sense, interference-driven exponent drift emerges as a generic property of burst-based loopless invasion processes rather than an artifact of a particular implementation.
4. Discussion and Conclusions
4.1. Summary of Main Findings
The results show that loopless burst growth by itself is compatible with standard percolation, and that apparent non-universal exponents arise only once multiple bursts interact on a shared tree. Single-burst clusters in both CLIP and AIP recover the Fisher exponent of ordinary bond percolation across dimensions
–6, within uncertainty of reference values on hypercubic lattices [
18,
23,
25]. This confirms that the loopless constraint and invasion-style growth do not alter the underlying single-cluster universality class.
In contrast, multi-burst sequences exhibit systematic evolution of the effective burst-size exponent
with burst index
k (
Figure 3,
Figure 4 and
Figure 5). In CLIP, the first burst approximately reproduces the single-burst exponent, while later bursts show progressively larger
, indicating a relative suppression of large events as the invasion proceeds. The magnitude of this exponent drift decreases with spatial dimension, consistent with the increasing coordination number and the larger number of distinct pathways available at higher
D.
An interference fraction
quantifies the proportion of sites in burst
k that were activated through geometrically defined interference events. The mean interference fraction
increases with burst index, is larger in low dimensions, and correlates strongly with
(
Figure 4). Correlation coefficients between
,
, and
k summarize this trend and show that stronger interference is statistically associated with steeper size–frequency exponents. Finally, the CLIP and AIP models are indistinguishable under these diagnostics (
Figure 3), implying that interference-driven exponent variability is a generic feature of loopless burst-based invasion rather than an artifact of a particular implementation, threshold rule, or growth protocol [
12,
13,
15].
4.2. Conceptual Mapping and Implications for Induced Seismicity
If bursts are interpreted as analogs of earthquakes or microseismic episodes, the burst-size-distribution exponent
can be mapped to an effective Gutenberg–Richter
b-value using the relation between seismic moment and moment magnitude, following the construction of Rundle et al. for CLIP [
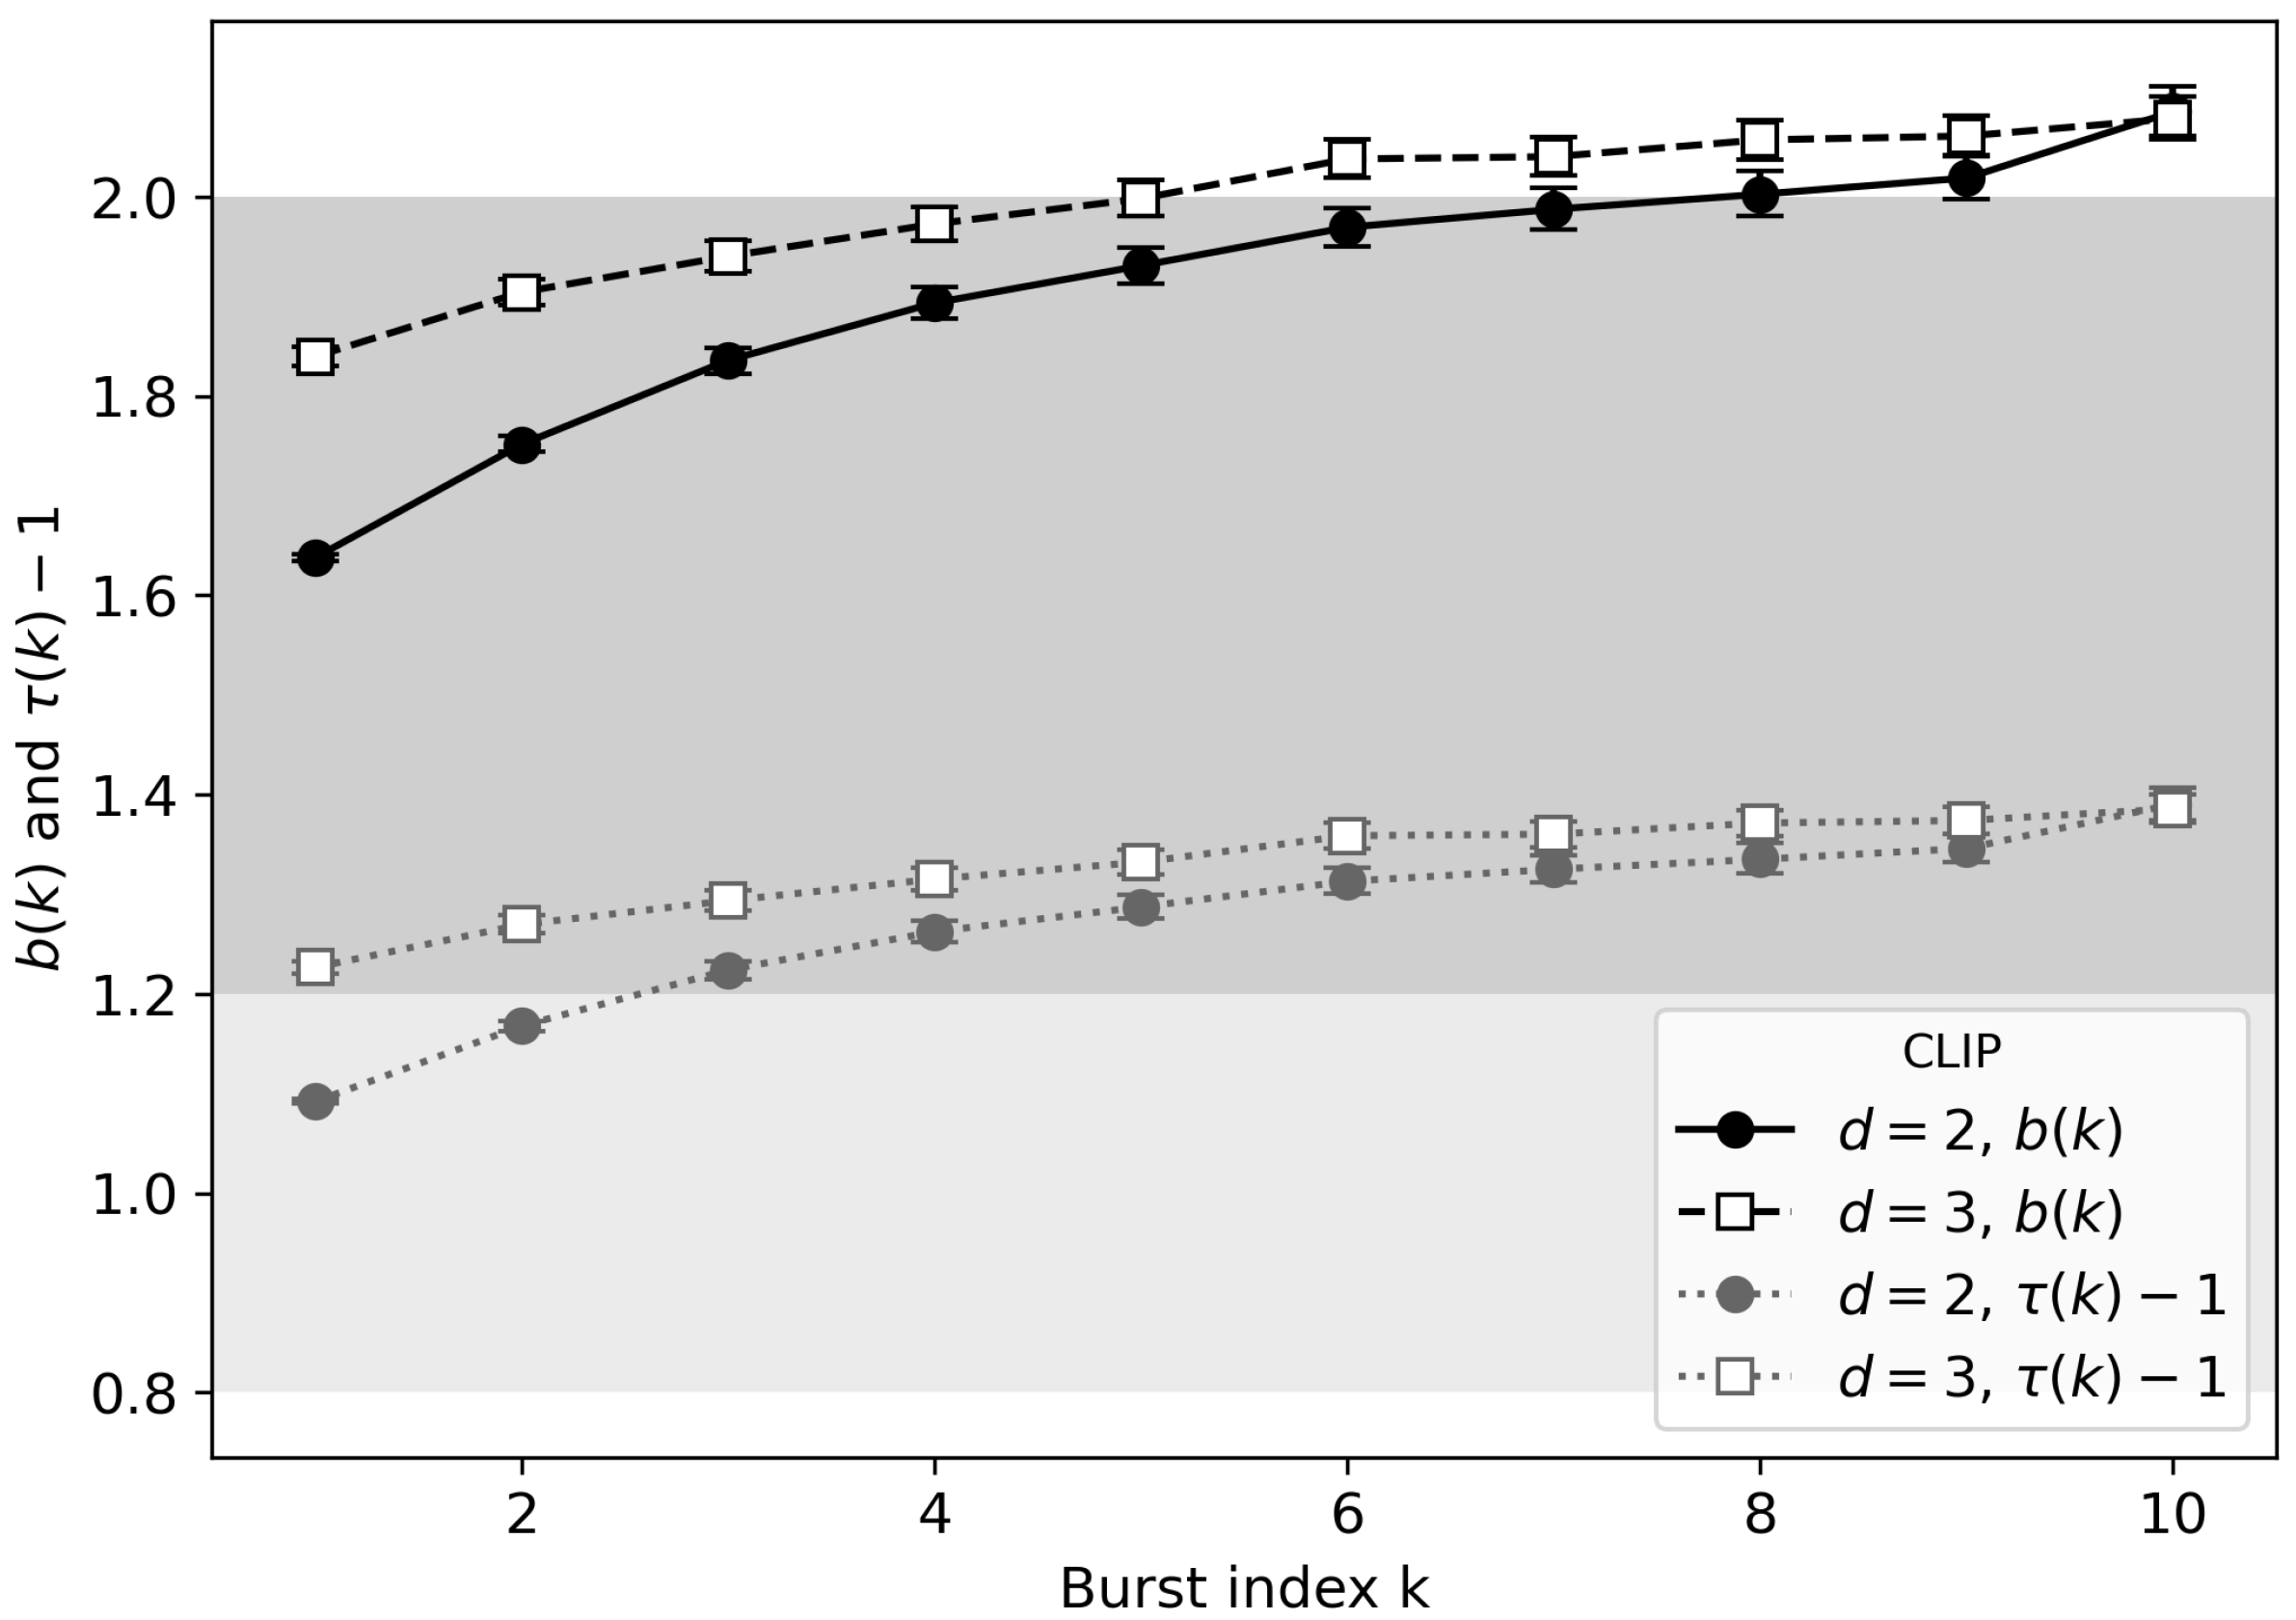
12]. In this paper we adopt that mapping as a conceptual device and apply it to the multi-burst exponents in order to visualize how interference-driven changes in
would appear in a more familiar seismicity metric (
Figure 6).
Under this mapping, increasing interference along a multi-burst sequence in low dimensions corresponds to an increase in effective
b, that is, a steeper magnitude–frequency relation and a relative reduction in large events. The ranges obtained for the mapped
b-values lie within the broad interval reported for tectonic and induced sequences in the literature, typically ranging between about
and
depending on stress regime, structural setting, and operational conditions [
19,
20,
21,
32,
33,
34,
35,
36]. This consistency should not be viewed as a quantitative fit, since CLIP and AIP do not include most of the physics relevant to real faults or reservoirs, but it does show that purely geometric interference can generate apparent
b-value variability comparable in scale to that observed in field catalogs.
In the context of induced seismicity, the mapping highlights one possible geometric contribution to the commonly observed drift of
b-values between stages, wells, or operational phases [
19,
21,
33,
34]. In the models, interference is controlled by the re-use of previously activated pathways on a loopless tree. In a real stimulated volume, this could reflect complex combinations of fracture-network geometry, evolving connectivity, and preferential flow along previously pressurized structures. Our results therefore support the qualitative statement that part of the observed variability in
b-value in induced settings could, in principle, originate from evolving geometric constraints on where and how bursts of failure can grow, rather than solely from changes in stress, pore pressure, or material properties.
At the same time, the mapping is intentionally schematic. The burst size in CLIP and AIP is not a calibrated measure of seismic moment, and the mapping ignores catalog incompleteness, heterogeneity in detection thresholds, and the many ways in which real fracture networks differ from a regular hypercubic lattice. The effective b-values shown here should therefore be interpreted only as conceptual indicators of how interference reshapes the tail of the burst-size distribution, not as predictions for specific reservoirs or operational scenarios.
4.3. Interference as a Geometric Proxy for Mechanical Inhibition
The interference fraction is defined purely geometrically as the fraction of sites in a burst that are added through interference events, that is, steps in which the growth front is forced to terminate on a pre-existing structure rather than exploring fresh parts of the lattice. In this sense, measures how strongly the existing invasion tree constrains further growth. High interference implies that many attempted growth steps are blocked or redirected by the current cluster, while low interference indicates that the invasion can expand into previously unactivated regions with relatively little hindrance.
This geometric picture suggests an interpretation of as a proxy for mechanical inhibition in more realistic systems. In faults or fractured reservoirs, several mechanisms can inhibit the growth of large slip events or microseismic bursts, including coseismic stress shadows, aseismic slip that relaxes stress on favorably oriented patches, damage localization that redirects rupture paths, and pore-pressure equilibration that reduces effective driving stress in already stimulated regions. Each of these mechanisms reduces the amount of “available” high-stress or high-pressure material that can participate in the next event, analogous to how previously invaded bonds limit future growth in the models.
The dimensional trends support this interpretation. In two and three dimensions, where the coordination number is small and alternative pathways are limited, interference grows rapidly with burst index, and departs strongly from its single-burst value. In higher dimensions, the invasion has more directions in which it can expand, interference grows more slowly, and the effective exponent remains closer to the percolation value. This mirrors the idea that, in systems with many alternative pathways or weak geometrical constraints, mechanical inhibition is less effective and size–frequency statistics remain closer to a universal form.
It is important to emphasize that is not a direct measure of stress or pore pressure. Rather, it is an observable in a purely geometric model that encapsulates how strongly past activity restricts future growth. The present results indicate that such a quantity can provide a useful diagnostic for how “crowded” or “inhibited” a burst sequence is, and thus may inform the interpretation of b-value changes in settings where the underlying fracture geometry is complex but not directly observable. In more physically detailed models, an analogous interference-like metric could be defined in terms of the fraction of rupture area interacting with previously slipped or pressurized regions, allowing for direct comparison between geometric and mechanical notions of inhibition.
4.4. Relation to Other Modeling Frameworks
CLIP and AIP sit between several established modeling approaches used in seismicity and fracture studies. Dynamic-rupture simulations resolve elastodynamics, fault friction, and off-fault damage at high resolution, and can reproduce complex rupture patterns and ground motions [
5,
6]. However, they are computationally intensive and depend on poorly constrained constitutive parameters. Stochastic point-process models such as ETAS provide efficient representations of triggering and clustering in earthquake catalogs and are widely used for hazard forecasting [
7,
8]. These models capture empirical scaling laws but hide the underlying geometry of the fault network. Cellular automaton and slider-block models, beginning with Burridge and Knopoff [
9] and later nonconservative self-organized critical systems [
10,
11], abstract faulting into coupled elements that can generate avalanche-like events and approximate Gutenberg–Richter statistics.
Relative to these frameworks, CLIP and AIP deliberately exclude most mechanical detail in order to isolate how geometry alone, through loopless invasion and burst segmentation, affects size–frequency statistics. They generate synthetic catalogs in which the underlying geometry, growth rules, and burst segmentation are fully known, providing a controlled environment for developing and testing analytics such as interference fractions, multi-burst exponents, and their correlations. In particular, the models show that large shifts in effective exponents can arise without any change in the underlying disorder distribution, driving stress, or failure criterion, simply due to how events share or compete for a common network of pathways.
As such, CLIP and AIP should not be viewed as competitors to ETAS or dynamic-rupture simulations for forecasting, nor as realistic models of specific reservoirs. Instead, they complement these approaches by clarifying how much apparent
b-value variability can be attributed to geometric effects, and by suggesting new diagnostics that could be computed on more physical models or on observed catalogs. For example, interference-like measures might be constructed from synthetic catalogs generated by fully coupled flow and geomechanical simulations of injection [
33,
34], or from microseismic data where event clusters can be mapped onto an inferred fracture network.
4.5. Limitations and Outlook
The models analyzed here introduce several idealizations that limit the strength and scope of the conclusions. First, CLIP and AIP evolve on regular hypercubic lattices with independent, identically distributed bond strengths, whereas real fracture networks are highly heterogeneous, often anisotropic, and embedded in complex three-dimensional geological structures. The loopless constraint idealizes a sparse backbone of activated pathways; in real media, loops, branches, and multi-scale structures are ubiquitous.
The models neglect explicit stress evolution, pore-pressure diffusion, and frictional constitutive laws. Interference arises entirely from geometric re-use of previously activated bonds and does not include effects such as rate–state friction, inelastic deformation, or fluid–rock coupling, which are central to the physical mechanisms of induced earthquakes [
33]. This means that while interference can be interpreted as a geometric proxy for mechanical inhibition, it cannot capture the full range of processes that control seismic productivity in real systems.
Use of higher spatial dimensions –6 is intended as a universality-style probe rather than a claim about physical dimensionality. Varying D changes the coordination number and thus the effective interaction range and crowding, but extrapolating these trends to real three-dimensional reservoirs requires caution. The main role of higher dimensions here is to demonstrate that interference and exponent drift weaken as additional geometric degrees of freedom are added.
Lastly, the mapping between burst-size exponents and Gutenberg–Richter
b-values that originates in [
12] is used as a conceptual rather than calibrated metric. It assumes a fixed relation between burst size and seismic moment and does not account for magnitude completeness, catalog biases, or the distinction between single events and multi-event clusters [
19,
32,
35]. Consequently, the effective
b-values presented in
Figure 6 should be regarded as illustrative of how interference reshapes the tail of the burst-size distribution rather than as quantitative predictions for specific sites.
These limitations point to several directions for future work. One avenue is to embed CLIP- or AIP-like burst constructions into more realistic fracture networks, for example, by using discrete-fracture models or networks inferred from field data, in order to test how interference metrics behave in heterogeneous geometries. Another is to couple burst-based invasion to simplified mechanical models, such as quasi-static stress transfer or poroelastic pressure diffusion, and to compare geometric interference with stress-based inhibition directly. A third direction is to compute interference-like diagnostics on synthetic catalogs from physics-based simulations of induced seismicity and on observed microseismic catalogs, using the present models as a baseline for interpreting the magnitude and variability of inferred geometric inhibition.
Overall, the present results demonstrate that interference in loopless invasion-percolation models can generate substantial, dimension-dependent variability in effective burst-size exponents while leaving single-burst scaling unchanged. When mapped onto an effective Gutenberg–Richter b-value, this variability spans ranges similar to those observed in induced seismicity, suggesting that geometric competition for pathways is a plausible contributor to observed b-value drift. Incorporating interference-based analytics into more physically detailed models and observational studies may help to disentangle geometric from mechanical contributions to seismicity statistics and clarify how an evolving network structure shapes the size–frequency distribution of earthquakes and microseismic bursts.