Abstract
Due to the effect of room acoustics on musical interpretation, a musician’s rehearsal may be greatly enhanced by leveraging virtual and augmented reality technology. This paper presents a preliminary study on a rehearsal tool designed for musicians, enabling practice in a virtual acoustic environment with audience-positioned playback. Fourteen participants, both professional and non-professional musicians, were recruited to practice with the rehearsal tool prior to performing in an unfamiliar venue. Throughout the rehearsal, the subjects either played in a virtual environment that matched the acoustics of the performance venue or one that was acoustically different. A control group rehearsed in an acoustically dry room with no virtual acoustic environment. The tool’s effectiveness was evaluated with two 16-item questionnaires that assessed quality, usefulness, satisfaction with the rehearsal, and aspects of the performance. Findings indicate that rehearsing in a virtual acoustic environment that matches the performance venue improves acoustic awareness during the performance and enhances ease and comfort on stage compared to practising in a different environment. These results support the integration of virtual acoustics in rehearsal tools to help musicians better adapt their performance to concert settings.
1. Introduction
Virtual and augmented reality technologies have grown beyond entertainment into fields like education, healthcare, and design. A key factor in creating compelling experiences is realism, which includes not only lifelike visuals but also accurate sound. Virtual acoustic environments (VAEs) are computer-generated simulations of auditory settings, enabling users to perceive and interact with sounds as though they were in a real environment. By integrating digital signal processing, psychoacoustics, and immersive technologies, VAEs enhance the sense of presence in virtual spaces. As examples, Ref. [1] explored how VR environments can facilitate social interactions without relying on visual or verbal cues, focusing on enhancing user presence and engagement through alternative sensory modalities while Ref. [2] investigated the effects of audio and visual congruency in theatrical performance VR environments.
In the real world, sound is shaped by reflections, diffraction, and absorption, which alter its intensity, spectrum, and timing. These effects are fundamental to how we perceive and navigate our surroundings, playing a crucial role in sound source localization [3]. To create realistic VAEs, these phenomena must be accurately reproduced, often requiring trade-offs between physical accuracy and computational efficiency. Once these challenges are overcome, high-fidelity VAEs can elicit natural reactions and behaviors in controlled environments [4]. Beyond their applications in gaming, they are particularly valuable for architectural acoustics studies, music and hearing research, and therapy development.
Virtual choirs, which utilize digital technology to enable remote participation in group singing, gained widespread recognition during the COVID-19 pandemic when in-person gatherings were limited [5]. More recently, Daffern et al. [6] introduced a multi-user virtual reality (VR) experience designed to allow individuals to sing together while immersed in a pre-recorded choir, with the aim of enhancing the health-related quality of life, physical well-being, and mental well-being of care home residents.
Keeping the focus on music production, VR technology enables live performances in virtual acoustic environments [7], which can potentially support a musician’s rehearsal activities. In live music, it is common for musicians to rehearse or tune in a performance space beforehand to acclimate to the venue’s acoustics. However, this practice is not always possible due to location or time constraints for the performer.
In a series of informal interviews, musicians reported that adapting to an unfamiliar environment while performing live can be both uncomfortable and challenging. Additionally, several musicians highlighted the benefits of experiencing a venue’s acoustics from the audience’s perspective, rather than only from the stage, before a concert. VAEs can allow a musician to explore and attune to a performance space by providing a controlled and realistic acoustic simulation without the performer setting foot in said space.
This study examines the influence of a VAE on musical rehearsal in an unfamiliar venue. A VAE rehearsal tool was designed to allow musicians to perform on a virtual venue’s stage and hear/experience the response of the room in real-time. The tool also permits the musicians to record their performance and listen to their rehearsal from various positions in the audience, accounting for the acoustical differences between the seating locations. The objective of the study is to better understand the effect of the VAE rehearsal tool on a musician’s adaptation to a venue’s acoustics. (This article is a revised and expanded version of a paper entitled “Preliminary evaluation of a virtual acoustic environment for rehearsal and performance in unknown venues”, presented at International Symposium On Musical and Room Acoustics, New Orleans, 24–27 May 2025.)
2. Literature Review
Previous studies have shown that acoustics affect musicians’ performance, with adaptations occurring at both individual and ensemble levels. The explained variance in musical performance due to acoustic features ranges from 11% to 58%, depending on the context [8,9,10]. In such studies, the acoustics of the performance space is quantified using various metrics [11] which can describe various components of the temporal and spatial energy distribution of the acoustic response (the room impulse response, RIR). The fundamental parameter in room acoustics is the reverberation time (denoted RT or ), or the time it takes a sound pressure level to decay by 60 (i.e., by a factor of ). is a measure of the reverberation time, calculated over a decay of 30 , starting from a decay of 5 after the direct sound, as a more realisable measure given typical signal-to-noise conditions. The decay rate is then extrapolated to an equivalent decay of 60 , as per the definition of RT. The energy decay rate can also be analyzed in temporal regions, such as the early decay time (EDT), which examines the first 10 (), or 15 () of the energy decay. Another parameter, strength (G), quantifies the general amplification of the space, compared to what would be heard in an anechoic environment (an environment free from any and all room reflections).
Gari et al. [12] reported that variations in EDT, RT, and G significantly impacted performance level and timbre for trumpet soloists. Schärer Kalkandjiev and Weinzierl [9] observed that musicians adjusted their timbre to account for the early support () of a space on stage, producing brighter and harder timbral renditions when performing in more reverberant rooms ( is a measure of strength of early reflections, often considered a key parameter for stage acoustics, quantified as the ratio of energy arriving in the first 80 to the direct sound). Luizard et al. [13] found that EDT and bass ratio (BR) had a notable impact on the spectral centroid and flux of solo singers (Bass Ratio is the average RT in the lower octave bands (125 to 250 ) divided by the average RT in the medium octave bands (500 to 1000 )). Similarly, Schärer Kalkandjiev and Weinzierl [9] noted that global tempi were influenced by the RT of a room, particularly for slower tempi. Bolzinger and Risset [14] also demonstrated that RT was significantly correlated with the duration of silences for solo pianists. Specifically related to singing, Luizard and Henrich Bernardoni [15] found that 13% of the variation in vocal production parameters could be explained by acoustic factors, with intensity emerging as the most sensitive parameter to acoustic changes. Similarly, Bottalico et al. [16] demonstrated that 33% of the variance in vibrato extent could be attributed to acoustic variation, while only 23% was associated with inter-singer differences.
Interestingly, the adaptation of musicians to the acoustics of a space has been shown to be a conscious process [17,18]. Gari et al. [12] further reported that this adaptation could be perceived by external listeners. The influence of acoustics on musicians also varies with their musical practice level. For example, Bottalico et al. [19] found greater pitch accuracy in classically trained singers when external auditory feedback was present, compared to non-professional singers. In a similar vein, Bolzinger and Risset [14] showed that for non-expert pianists, acoustics were not a significant factor in explaining changes in performance, while they were for expert pianists.
Musician preference is another important factor to consider when studying the relationship between acoustics and musical performance. Several studies have investigated how acoustic preferences vary depending on the style of music being performed [20,21].
Traditionally, studies on the influence of acoustics on musical performance have relied on real rooms. This could be through the use of rooms with adjustable acoustics [14] or by requiring musicians to physically move between different spaces [8,22].
While the influence of acoustics on musical interpretation has been widely studied, relatively few studies have investigated the role of acoustics during the rehearsal process. Recent research has shown that musicians’ acoustic preferences vary depending on the focus of their practice during rehearsal. Matsuo et al. [23] found that, at the beginning of the rehearsal process, musicians preferred a dry acoustic environment to facilitate technical evaluation, whereas later in the process, they favored more reverberant acoustics to support the expressive aspects of performance. Similarly, Wingfield et al. [24] explored the use of virtual reality (VR), combining audio and visual immersion, in vocal rehearsal. Although auditory rendering in VR still faces technical limitations, the study showed that such environments can help performers adapt more effectively to unfamiliar performance spaces, as evidenced by objective permanence analyses.
The present research seeks to build upon and extend this growing body of work by focusing specifically on the integration of acoustic considerations into rehearsal practices. It addresses a gap in the literature by examining how VAEs may not only simulate performance acoustics, but also support the rehearsal process itself. From a methodological standpoint, this study introduces a virtual rehearsal tool that offers high-fidelity auditory rendering, aiming to approximate the perceptual qualities of real acoustic spaces. In parallel, it provides empirical data on musicians’ subjective experiences with such a system, both during rehearsal and in live performance settings. By doing so, the research contributes to a deeper understanding of the acoustic dimensions of musical preparation and the potential of immersive technologies to support interpretive work.
3. Paper Aim and Organization
This paper presents a preliminary study investigating how a virtual acoustic environment (VAE) can support music rehearsal and prepare musicians for performing in unfamiliar concert spaces. The primary research question is:
To what extent can a high-quality, immersive VAE improve the rehearsal process and facilitate musicians’ adaptation to the acoustics of a performance venue?
To explore this question, we introduce a novel low-latency VAE system specifically designed for rehearsal. This system enables musicians to rehearse in a realistic virtual replica of a target performance space, including the option to listen from different audience perspectives. The acoustic rendering is based on recent advances in spatial audio and virtual reality technologies, aiming to closely approximate the perceptual experience of a real concert hall.
The novelty of this study is twofold. Methodologically, it employs state-of-the-art audio VR techniques to create an acoustically convincing rehearsal environment, which, to our knowledge, has not been systematically evaluated in the context of musical rehearsal. Empirically, it provides new insights into the subjective impact of such environments on musicians, comparing responses from both expert and non-expert performers. The study examines how the VAE affects perceived comfort, satisfaction, and ease on stage. Towards these aims, the specific hypotheses proposed and subsequently evaluated through the analysis are that:
Hypothesis 1.
The proposed VAE rehearsal tool is of good quality, comfortable, and easy to use.
Hypothesis 2.
Rehearsing in a virtual environment helps musicians perform on an unfamiliar stage.
Hypothesis 3.
The benefits of the VAE rehearsal tool are moderated by the musician’s skill level.
4. Design of the VAE Rehearsal Tool
4.1. General Overview
To address the intention of the study, the rehearsal tool should allow musicians to:
- Perform on a virtual venue’s stage, with several rooms available, providing real-time auditory feedback from the simulated room.
- Replay performances from various positions in the room, for users to assess the impact of the acoustics on their music.
The rehearsal tool first captures the dry acoustic output of the musicians performance with a microphone. It then sends that signal to the VAE that “projects” it in the simulated acoustics of a virtual room. The resulting audio stream is then rendered to the musician over headphones. This rendering, called an auralization, is the audible analogy of a “visualization”. A schematic diagram of the rehearsal system is shown in Figure 1.
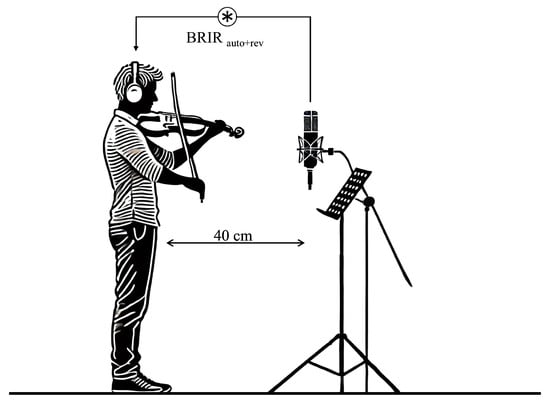
Figure 1.
Schematic diagram of the rehearsal system. The direct sound captured by the microphone is convolved (∗) in real-time with the for the corresponding performance space, then rendered over headphones. Distance between acoustic source center and microphone was 40 .
Rendering the dry signal in the virtual acoustics is based on the convolution with a room impulse response (RIR) [25], which represents the time-domain version of the room’s transfer function from a given source to receiver, capturing the collection of acoustic propagation paths and the cumulated absorptive and diffusive qualities of the room’s surfaces. An RIR can be measured using a microphone to capture the sound of a loudspeaker in a room using a test signal which excites the span of frequencies in the audible range [26]. Convolving an anechoic audio stimulus signal (i.e. a recording of the direct sound of a source without any room reflection components) with the measured RIR results in an audio stream that replicates the situation of the stimulus signal being recorded in the room for an acoustic source and listener located at the loudspeaker and microphone positions, respectively. It is this process, allowing listeners to perceive how acoustics would behave in a given space, that is referred to as auralization.
To further improve the realism of the auralizations, the rehearsal tool relies on binaural RIRs (BRIRs). Binaural refers to a method of recording, processing, or reproducing sound that mimics human hearing by using two channels to create a spatial audio experience, typically through headphones [3]. Using BRIRs, e.g., recorded using a mannequin head [27], auralizations can be virtually indistinguishable from the real listening experience [28,29].
4.2. Room, Microphone and Musician Placement
Musicians used the rehearsal tool in an acoustically damped studio, with an ambient noise level below 30 dBA and a reverberation time of averaged over the 500 and 1000 Hz octave bands. Such a low reverberation time helps limit contributions of the natural acoustics of the rehearsal room to the virtual acoustics. The performance was captured with an omnidirectional microphone (Bedrock BAMT 1, Delft, Netherlands) chosen for its flat frequency response regardless of source position. The microphone was positioned at a fixed distance of approximately from the musician’s instrument. A visual marker was placed on the floor to ensure that participants remained at a constant distance from the microphone while using the rehearsal tool.
4.3. Autophonous Auralization
While most auralizations in practice are created with source and receiver positions in two distinct locations, the source and receiver for the auralizations in the present study needed to be co-located since the musician’s instrument and ears are approximately in the same position compared to the size of an auditorium. When the listener is also the acoustic source in a VAE, this can be termed an autophonous auralization (originally termed for vocal performer auralizations [13]). Such auralizations can be more demanding due to temporal alignment, computation speed requirements, and spectral coloration concerns. In the current study, the VAE used convolutions with BRIRs recorded with loudspeaker and microphone located as close as possible to each other on stage. Furthermore, the direct sound and first floor reflection were zeroed-out in the BRIR such that the musicians only heard the natural direct sound from their own instruments, followed by the acoustic response of the virtual room environment. Such BRIRs are referred to as in the remainder of the paper, as the autophonous (“auto”) response represents the source and receiver being co-located, but with only the room reverberation (excluding the direct sound; i.e., “rev”) included.
To ensure that the real-time VAE reverberation was accurately time aligned with the natural direct sound of the musician, the system latency was evaluated. The total system latency was measured to be 128 samples (I/O vector size of 64 samples), equating to less than 3 at the 48 sampling rate at which the audio interface operated. Since this latency was smaller than the propagation delay in the between the first floor reflection and following early reflections, it was possible to time-align the real-time VAE auralization with the natural direct sound from the musicians playing in the studio. Zeros in the signal at the beginning of the , representing the acoustic propagation delay, were removed so that the resulting total system latency matched the time delay measured between the direct sound and the early reflections in the original measured BRIRs [30,31].
4.4. Signal Processing and Rendering
The signal of the microphone was forwarded for convolution to a real-time digital audio signal processing application (Cycling’74 Max 8, San Francisco, CA, USA) using an audio interface (RME Fireface UCX, Haimhausen, Germany). Convolution was performed using the RoomZ VST plugin [32], a low-latency multichannel partitioned convolution engine. The result was rendered through the sound card to an amplifier that powered a pair of open headphones (AKG K1000, Northridge, CA, USA), or headspeakers. Using completely open headphones was considered necessary so as not to affect the direct sound perceived by the musician of their instrument. Previous studies have shown that these headphones are sufficiently acoustically transparent for musicians to hear their natural direct sound without attenuation or coloration artefacts [7,31,33,34].
4.5. Calibration
A gain calibration procedure was applied to ensure that the rehearsal tool did not unnaturally boost or attenuate the acoustics of the virtual room. The goal of the calibration was to adjust the gain of the system so that an auralization using only the direct sound component that had a unit-gain of 0 dB would sound from the headspeakers as loud to the musicians as the natural direct sound from their instrument. Once this gain was applied, swapping the direct-only unit-gain BRIR with a which was normalized to unit-gain prior to removing its direct sound, would result in a calibrated auralization in which the direct-to-reverberant ratios were consistent and true to the real rooms. For the auralization of the audience positions, the levels of the associated BRIRs were adjusted with the same gain as that used for the on-stage , preserving the level differences measured in-situ. Mullins and Katz [31] further discusses the process of calibrating autophonous auralizations, including for a musician ensemble.
The calibration was implemented using an acoustic calibrator (Brüel and Kjær TYPE 4231, Nærum, Denmark), generating a pure tone of 1 at 94 SPL, placed on the microphone of the rehearsal tool. The use of a calibration tone is standard common practice for system gain calibration, and the microphones and headspeakers utilized in the experiment have linear and relatively flat responses across the frequency range of interest, which would maintain the timbral fidelity and direct-to-reverberant ratios of the auralizations. On the other end of the chain, a sound level meter (Brüel and Kjær TYPE 2250, Nærum, Denmark) was placed inside a mannequin head (Neumann KU80, Berlin, Germany), at the entrance of the ear canal. The headphones were then placed on the mannequin head, and the overall gain of the system was adjusted to reach 94 for each ear.
5. Experimental Design
The experiment consisted of 2 phases: a rehearsal in a studio with the VAE (Phase 1), and a performance on the stage of an auditorium (Phase 2). The auditorium used for the experiment was that of Sorbonne University’s Pierre et Marie Curie campus. To assess the effect of the rehearsal tool on the musical rehearsals, three groups of participants were formed. The rehearsal tool of the first group was configured to render the auditorium VAE. The second group, acting as control, rehearsed in the bare acoustics of the studio. To further understand the importance of matching the VAE to the performance space, a third group rehearsed with a tool configured with a different VAE, namely the Grand Amphitheatre of Sorbonne University, selected because it was acoustically quite different from the auditorium. The three groups are respectively referred to as , , and .
5.1. RIR Measurements
The Auditorium is an approximately 500 seat modern, multi-purpose hall. In contrast, the Grand Amphitheatre of Sorbonne University is a large 19th-century multi-purpose hall of approximately 930 seats, with a main floor, stalls, and five galleries. BRIR measurements were performed in both spaces using a loudspeaker (Genelec 8030A, Iisalmi, Finland) and a mannequin recording head (Neumann KU-100, Berlin, Germnay). The stimulus used was a logarithmic sine sweep [26] with a sampling rate of 48 . This loudspeaker was used as a rough substitute to approximate the average directivity of a musical instrument [35].
Four source/receiver configurations were recorded in both the amphitheatre and the auditorium: one autophonous with both loudspeaker and mannequin head co-located on the stage, three with the loudspeaker on stage and the mannequin head at various positions in the audience. Figure 2 illustrates the BRIR measurement setups in both the auditorium and the amphitheatre. For the autophonous configuration, the mannequin head was placed above the loudspeaker, to mimic as closely as possible the position of the ears with respect to the mouth position. The perceptual impact of the slight offset between the source and receiver position for the autophonous configuration was judged negligible, particularly as both the direct sound and first floor reflection are removed from the [31]. For the other configurations, the mannequin head was positioned near the front, center, and back of the audience.
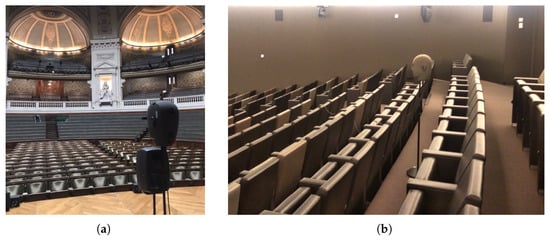
Figure 2.
Photos of measurement sessions. (a) Grand Amphitheatre, autophonous configuration. (b) Auditorium, configuration with the source on the stage and the receiver at the back of the room.
These positions defined the potential listening positions for playback within the rehearsal tool. They were selected to provide three distinct listening perspectives for musicians to fully appraise the interaction between their performance and the acoustics of the actual space.
An additional set of RIRs was recorded to quantify the acoustic properties of each space. Measurements were performed in all three spaces using a dodecahedron omnidirectional loudspeaker (Lookline 103, Massa Finalese, Italy) and an omnidirectional measurement microphone (Bedrock BAMT 1, Delft, The Netherlands). The results of this characterization, including that of the studio in which the rehearsal tool was setup, are reported in Table 1, providing , , and ( is a standardized measurement for musical clarity calculated on the RIR. It is the logarithmic ratio of early energy, arriving in the first 80 , to the late energy, arriving after 80 . Clarity is defined as the ability to perceive separate sounds in a musical performance as opposed to the notes blurring together [21]) values. These metrics show that there are stark differences between the three different rooms. According to ISO standard 3382 [11], the just noticeable difference (JND), i.e., the smallest amount of deviation in a metric required for a listener to perceive a contrast between two stimuli, for is . There are 40 JNDs between the measured reverberation times for the Studio and the Auditorium and 27 JNDs between the Auditorium and the Grand Amphitheatre, meaning that there are large perceptual differences in reverberation for these rooms. Similarly, with a JND for of 3 [36], the Studio and Auditorium are perceptually distinct in terms of clarity by approximately 3 JNDs while the Auditorium and Grand Amphitheatre are 10 JNDs apart. Relative to the effects of the room’s acoustics, a source would sound very clear in the studio, somewhat clear in the Auditorium, and somewhat unclear in the Grand Amphitheatre.

Table 1.
Acoustic characterization of the three rooms considered in the study, following Ref. [11]. Reported values are computed from the omnidirectional RIRs averaged across the 500 and 1000 octave bands.
5.2. Detailed Protocol
Phase 1 was the rehearsal in the VAE. It began with a 10 min demonstration of the rehearsal tool and explanation of the experimental protocol. Participants were instructed to:
- Not remove the headphones during the rehearsal.
- Take 1 to prepare for a performance in the room emulated by the VAE.
- Freely use the playback feature to listen to their last performance from three distinct positions in the room.
- Record at least one version as ideally performed on stage in a concert situation.
Participants were free to select the piece they wanted to rehearse. This decision was made to ensure that each participant would practice on a piece adapted to their own instrument and expertise, challenging them enough to justify a 1 rehearsal while not too complicated so that they would be able to concentrate on the acoustics of the performance [22].
Phase 2 mainly consisted of a musical performance on stage. It was carried out within 2 weeks of Phase 1 for every participant. It was divided into two parts: a 20 min warm-up/rehearsal in the studio with the same VAE as in Phase 1 (Phase 2.1) and an on-stage performance in the auditorium (Phase 2.2). Travelling from the studio to the auditorium took approximately 2 , a duration intentionally kept short to limit remembrance biases reported in previous studies [30].
During Phase 2.2, participants were instructed to perform the piece they had rehearsed during Phase 1 and Phase 2.1. They were also instructed to directly start their performance upon arrival in the auditorium to limit their interaction with its acoustics. Figure 3 shows several example participants during both phases of the experiment.
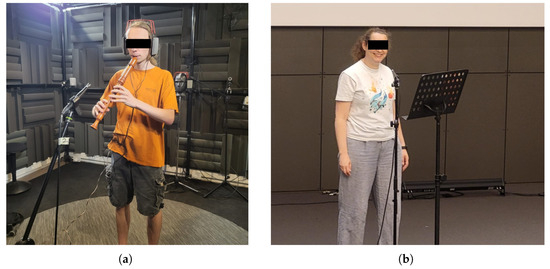
Figure 3.
Several example participants during (a) Phase 1 and (b) Phase 2.2 of the experiment.
5.3. User Interface
The interface of the rehearsal tool mainly consisted of a record and a replay button. The latter allowed participants to playback their last recorded performance from the four available auralization positions: on stage, in front of the room, at its center, or at its back. An additional “Choose this recording as your favorite” button allowed participants to save their last recorded performance at any time. A timer was displayed on the interface, updated every 15 so as not to stress participants while providing information about how long they had before the end of the session.
5.4. Participants
A total of 14 musicians took part in the experiment (6 women and 8 men, years old), all with at least 5 years of musical practice experience. They were further categorized into two levels of proficiency: experts and non-experts. Expert musicians were professional, in the process of obtaining or who had obtained a diploma of musical study from a conservatory (DEM: diplôme d’étude musicale). Table 2 details how instruments and expertise levels were distributed between the three groups. The participants were pseudo-randomly assigned into a group to balance the types of instruments across all three conditions—for example, there is one violinist in each of the groups. Due to the limited number of participants, the groups were unable to be balanced by both level and instrument type.
Table 2.
Distribution of instruments and expertise across groups.
Worth noting, one of the participants had previously performed in both the the auditorium and the amphitheatre, but in an orchestra setting. Two experts, a guitarist in and a singer in reported generally practicing in an amplified context. Out of the 14 participants, 7 reported having prior experience with virtual reality, 7 to having none. Concerning auralization, 6 of the participants were familiar with the concept, 8 were not.
5.5. Questionnaire
Participants were asked to complete two questionnaires, one after Phase 1 and one after Phase 2.2. Each questionnaire presented 32 assertions, aimed at assessing various points:
- Quality of the tool from a sound and practical point of view;
- Musicians’ satisfaction with their rehearsal while using the VAE tool;
- Usefulness of the tool during the rehearsal;
- Impact of the rehearsal tool on their final musical performance;
- Fatigue induced by the use of the tool.
Participants evaluated assertions using 5-point Likert scales, ranging from “Strongly Disagree” to “Strongly Agree”. The order of the assertions was randomized for each participant. The polarity of the assertions varied, such that the participants were required to either answer in the affirmative or negative and did not become accustomed to responding in one particular way. The average time for completing each questionnaire was 25 min. The assertions in the questionnaires are reported in Table 3.
Table 3.
Questionnaires used at the end of Phase 1 and Phase 2.2. The polarity of questions marked with a * has been inverted in the analysis, so that a 5 (resp. a 1) always corresponded to the most positive (resp. negative) evaluation of an assertion.
5.6. Objective Performance Analysis
Objective performance analysis of the audio recordings was conducted to compare alignment, and pitch accuracy between Phase 2.1 and Phase 2.2. The beginning and end of the performances were manually cropped. Audio signals were downsampled for faster computation and filtered to remove low-frequency background noise present in the Phase 2.2 recordings. Harmonic-to-noise ratio, short time energy, and fundamental frequency were extracted using MATLAB (version R2024b) audioFeatureExtractor function. The harmonic-to-noise ratio and short time energy were used to detect silences by applying a threshold of 0.45 for harmonic to noise ratio and 0.001 on short time energy values. Fundamental frequency values were set to zero during the silence periods. The fundamental frequency estimates were then smoothed to suppress aberrant values.
A dynamic time warping (DTW function, Matlab) algorithm was applied to the fundamental frequency arrays to align performances of Phases 1 & 2. The alignment was calculated as the difference between the number of gaps added in the Phase 2.2 recording and the number of gaps added in the Phase 2.1 recording to achieve optimal alignment. This score is closely related to overall duration and, therefore, tempo of the performed musical passage. A positive alignment score indicates that more gaps were added in Phase 2.2 than in Phase 2.1, suggesting a generally faster tempo in Phase 2.2. Once aligned, pitch sequences were compared note by note, and the mean absolute pitch difference in cents between the two performances was calculated. Alignment metrics and mean absolute peach differences have been normalized by the duration of performance by participant.
Due to the polyphonic nature of the pieces played by the guitar players, the two guitarists were excluded from the objective performance analysis.
5.7. Data Analysis
Statistical analysis of participants’ responses was performed using a multi-factor analysis of variance (ANOVA) in RStudio (version 2021.09.0). The factors identified were the group (, , and ), the phase (Phase 1 rehearsal and Phase 2.2 performance), and the expertise level (expert and non-expert). Post-hoc pairwise comparisons for significant factors were made with Tukey–Kramer adjusted p-values. For all tests, statistical significance was determined for p-values below a threshold. Due to the relatively small number of participants and the study’s exploratory nature, results with a p-value of less than 0.1 are reported as trends. Effect size metrics, Cohen’s d and values, are reported where appropriate. The notation is adopted to indicate p-values below .
The validity of the questionnaire was evaluated with a test of internal consistency using Cronbach’s [37]. Since the items were distributed in two parts (after Phase 1 and Phase 2.2, respectively, with 16 items each), the validation tests were conducted on each instrument separately. Additionally, the test-retest reliability of the participants was assessed by examining Cronbach’s for two questions that had similar framing and in which similar responses were expected, namely P5 and P6.
Additionally, an exploratory factor analysis (EFA) was performed to evaluate the construct validity [37]. The EFA was constructed in R with a varimax rotation for each of the questionnaires separately by iteratively adjusting the number of factors in the model and tracking the cumulative explained variance (VE), uniquenesses of the items (U), and -test of sufficient number of factors. A threshold for VE was set at 0.80 while ensuring that the U of each different item did not exceed 0.50. Moreover, the probability of the -test needed to be less than 0.05 to indicate that the number of factors adequately accounts for all of the variance in the variables (i.e., that the number of factors chosen was sufficient). The number of factors was verified by a Scree test of the eigenvalues of the factor analysis.
6. Results
6.1. Validity of the Questionnaire
Cronbach’s was used to assess the internal consistency of the items of the questionnaires in Phase 1 and Phase 2.2, respectively. The Phase 1 questionnaire exhibited an value of 0.88, while Phase 2 had an value of 0.81. In both of these cases, the value exceeded 0.7, which is generally considered an “acceptable” level of reliability with values above 0.8 being considered “good”. The test-retest reliability of the participants was also checked by evaluating the -coefficient between two items that were similar: P5 and P6. In this case, the value was found to be 0.89, again exceeding 0.7, demonstrating that the participants were reliable.
The EFA revealed that both questionnaires, respectively, could be grouped into six factors (Phase 1: , with none exceeding , ; Phase 2.2: , with none exceeding , ). The majority of the items in each questionnaire only contributed to a single factor (e.g., Q1 only contributed to Factor 6 and Q3 only contributed to Factor 3). This result means that most factors consisted of a weighting of individual items and were interpretable. Based on the interpretation of factors and the clustering of items in the questionnaire, the construct validity of the instrument was confirmed. More information on the EFA performed can be found in Appendix A.
6.2. Evaluation of the Rehearsal Tool After Phase 1
As reported in Figure 4, participants overall appreciated the rehearsal tool itself during Phase 1. Comfort (Q1), sound quality (Q2) and ease of use (Q4) were rated quite high (, and , respectively). The relatively lower comfort score is likely due to the use of the rather large headphones which could have obstructed larger instruments. In the open-ended questions posed to the participants, the two cellists in the study reported that the headspeakers sometimes touched the tuning pegs of their instrument, interfering with their practice.
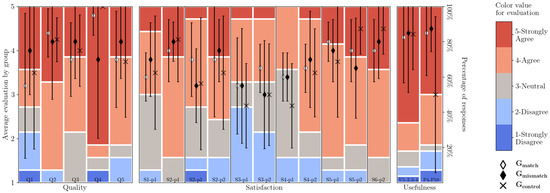
Figure 4.
Participants ratings of the rehearsal tool after Phase 1 and Phase 2.2. Error bars indicate mean and standard deviation of ratings. The stacked histogram represents ratings distributions.
All participants appeared satisfied with the realism of the VAE (Q3, ), indicating that they overall felt ready to perform on its physical counterpart (Q5, ). These judgments, made without comparison to a real acoustic reference, were likely based on personal internal references, criteria related to pleasantness of the acoustics or sound quality. Even the , rehearsing with no auralization, judged the VAE as realistic. A very similar result was observed regarding the usefulness of the tool, as illustrated in ratings aggregated over U1, U2, U3, and U4 in Figure 4.
6.3. Evaluation of the Rehearsal Tool After Phase 2.2
These usefulness ratings were compared to those reported after Phase 2.2, aggregated this time over P4 and P10 in Figure 4. Analysis indicated that there was an interaction between the group and phase factors regarding the two sets of ratings (, , ). While participants in and gave similar usefulness ratings after both phases, ratings dropped between Phase 1 and Phase 2.2 ( vs. , , ). This result confirms that, regardless of the criteria used by participants for ratings in Phase 1, the quality of the auralization was definitely used to assess usefulness after Phase 2.2.
Further analysis revealed an impact of participants’ group on similarity ratings between the virtual and the real room (P1, , , ). Pairwise comparison indicated that participants of rated the VAE as more similar to the auditorium than participants in ( vs. , , ). Participants in also tended to rate the VAE as less similar to the auditorium than but the difference was not significant (, , ). As reported in Figure 5, this effect was even more pronounced for expert participants. experts gave the VAE a similarity rating of ), followed by experts of () and ().
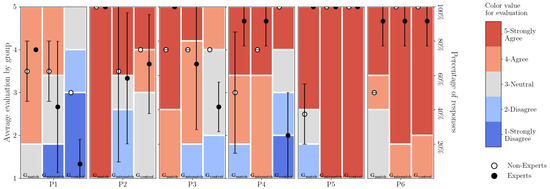
Figure 5.
Participants’ ratings of the rehearsal tool after Phase 2.2. Error bars indicate mean and standard deviation of ratings. The stacked histogram represents ratings distributions.
Analysis indicated a trend that participants’ group impacted their ease of play during Phase 2.2 (P2, , , ). Pairwise comparison indicated a trend difference between ratings of and ( vs. , , ). Participants in also tended to rate the ease of play during Phase 2 lower than , but the difference was not significant (, , ).
There was also a tendency for group to affect the musicians’ the comfort on stage (P3, , , ). Pairwise comparison indicated a difference between and ( vs. , , ). Participants in also rated the comfort on stage lower than , but the difference was not significant (, , ). This effect was again more pronounced for expert participants ( for vs. and for and ).
Group also impacted how the tool helped the musicians take the the acoustics of the room into account (P4, , , ). Pairwise comparison indicated that experts of and rated P4 higher than experts ( vs. ), but this result was not seen for non-expert musicians.
6.4. Additional Results
There was no effect of group on overall musicians’ satisfaction with their performance during Phase 1. During the open-ended interview after Phase 1, however, most participants in and mentioned that they enjoyed playing with the acoustic feedback supporting their performance and masking imperfections. participants, on the other hand, indicated that the dry acoustics highlighted every fault of their performance, valuable during rehearsal but not very pleasant. A similar result was previously reported by Matsuo et al. [23]. This response to the open-ended questions is also reflected in the ratings for S4-p1 reported in Figure 4 ( for and vs. for ).
Analysis indicated expertise affected the reported fatigue of the participants after Phase 1 (F1 + F2, , , ). Pairwise comparison revealed that experts were less fatigued than non-experts after the 1 rehearsal session ( vs. , , ). There was also an impact of expertise on the number of recordings made during Phase 1 (, , ). While participants made recordings on average, non-experts made more recordings than experts ( vs. , , ). Ratings of fatigue were correlated with the number of recordings made for non-experts (), with non-experts reporting more fatigue with a higher number of recordings (see Figure 6). However, there was no correlation between these responses for experts (). Similarly, there was a significant correlation between the number of recordings and participant satisfaction with the rehearsal for non-experts (), which did not exist for experts (). While it may seem that non-experts showed more mental fatigue because on average, they recorded more times than the experts, the outlier expert musicians who made a number of recordings on par with the non-experts did not report being mentally fatigued. Therefore, non-expert participants most likely showed a higher level of fatigue due to how long musicians are used to practicing every day depending on their expertise level, which was also suggested by participants during the interview.
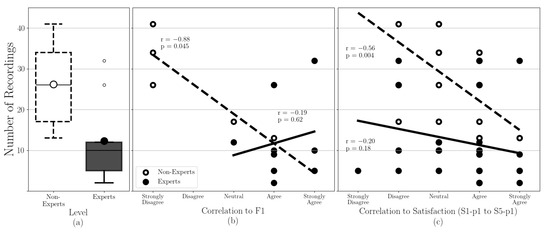
Figure 6.
Comparison between experts and non-experts of (a) the number of recordings made during Phase 1, (b) correlation between the number of recordings and ratings of mental fatigue (F1), and (c) correlation between number of recordings and mean ratings on satisfaction items (S1-p1 through S5-p1).
6.5. Objective Performance Results
No statistically significant differences in alignment between Phases 1 & 2 were observed across groups (, , ). As seen in Figure 7, there was quite a bit of variance in both the and groups, which likely was due to participant experience level and lack of effect size. The analysis also revealed no effect of group on pitch distance between Phase 2.1 and Phase 2.2 (, , ). It is unclear why there was a high variance in pitch differences observed in , though it could be that there were issues in tuning for a particular instrument or musician.
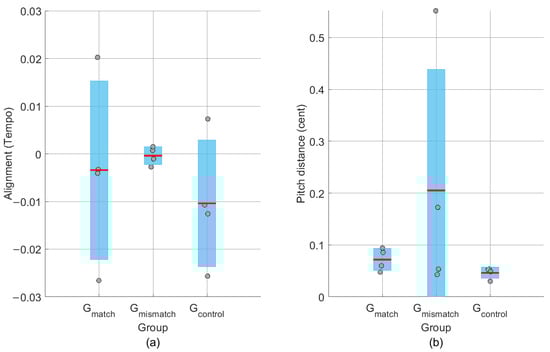
Figure 7.
Comparison between Phase 2.1 and Phase 2.2 on the (a) alignment (i.e., tempo differences) and (b) pitch distance between the two recordings. The box details the 95% confidence intervals on the raw data (gray •) with the mean (red —).
7. Discussion
Three main findings emerged from the reported results. First, the tool was generally assessed as comfortable, easy to use, and of high sound quality. This result supports Hypothesis 1. It is worth noting that the next iteration of the design should further take into account ergonomics to avoid hindering musicians like cellists during their performance, e.g., by using different headphones or loudspeaker arrays.
Secondly, Hypothesis 2 that prior exposure to a venue’s acoustics can reduce onstage uncertainty was supported by the questionnaire in Phase 2.2. The participants who rehearsed in a virtual environment that matched the real venue reported feeling more at ease on the actual stage, finding it less challenging to adapt to the hall’s acoustics at the start of the performance. This benefit would align with a body of literature indicating that foreknowledge of a hall’s reverberation, clarity, and support parameters can streamline a musician’s interpretative decisions regarding balance and articulation [9,13].
On the other hand, the objective performance analysis revealed that there were no group differences in tempo or pitch between performance and rehearsal. While this finding differs from [24], who reported variations in vibrato between rehearsal and performance depending on the use of virtual reality during the performance, the current study tests multiple different instrument types that limits the type of objective analyses that can be performed. Furthermore, the participants’ statements in the open-ended questions provide valuable insights into the perceived value of using such a tool for musicians. Because musicians were instructed to tune their instruments during rehearsal in Phase 2.1, the pitch difference analysis did not account for tuning variations (e.g., differences in diapason), which could, depending on the instrument, result in mean pitch differences between the two phases due to tuning effects in Phase 2.2. Only alignment and pitch distance were assessed in the objective performance analysis. Additional parameters should be included in future work. Analysis of vibrato effects, as performed in [24], was not possible due to the variety of instruments, as was the case for other timbre-related parameters, which are highly dependent on the instrument. A more targeted study should be conducted to further assess objective differences related to the use of such a rehearsal tool.
The third main result is that expertise played an important moderating role, supporting Hypothesis 3. Expert musicians noticed and reported clear parallels between the virtual and real settings, while the non-experts showed greater fatigue and sometimes struggled to capitalize on the virtual acoustic feedback. This result agrees with previous studies [14,38], which both showed that a higher level of training enhances a musician’s sensitivity to acoustic details.
Methodological Considerations
Several methodological choices shaped both the design of the rehearsal tool and the interpretation of its outcomes. First, the measured autophonous BRIRs were recorded with a fixed orientation of the mannequin head and a directional loudspeaker, meaning that dynamic head-turning or instrument-rotation effects were not accounted for. This decision helped maintain high spatial fidelity, avoiding interpolation or synthetic processing errors, but may have restricted the sense of full spatial interactivity. Musicians who often move or pivot mid-performance might perceive this issue when compared to a system with head-tracking and real-time directivity updates. In a previous study with singers, however, Eley et al. [39] reported that they did not show a sensitivity to dynamic rotation during their performance. Incorporating dynamic rendering, e.g., via ambisonic RIRs [40], might be an interesting next step as computational power and measurement methods continue to improve. Such a design choice would likely require an additional shift from measured to simulated RIRs, which are required to handle modeling limitations and simplifications [41] as well as spatial resolution artefacts due to recording and rendering techniques [42].
Second, the present study did not account for the individual directivity of each instrument in the auralizations since it was not feasible to have variable loudspeaker directivity measurements for all possible conditions. Instead, the BRIRs were measured with a Genelec 8030A (Iisalmi, Finland) loudspeaker, which substituted as an average directivity for all of the instruments. This experiment design decision was chosen over an omnidirectional source, which can over-excite the rear direction towards the back of the stage. Although the Genelec speaker may accentuate the frontal direction towards the audience for some instruments, such as a violin, no subjects reported unnatural room acoustic conditions in the virtual environment. Moreover, the participants that rehearsed in the same virtual environment as the performance space reported the similarity of the spaces highly, which shows that the directivity of the source is not a major limiting factor of this study.
In calibrating the virtual environment, the aim was to preserve correct direct-to-reverberant ratios and overall loudness cues using a reference sound pressure level and a consistent microphone-to-instrument distance. Minor variations in a performer’s head or instrument position during rehearsal might still have introduced some discrepancies in perceived loudness or timbre. For reference, assuming a free-field propagation for a given reference distance of , a change in distance of 5 will result in a change in captured sound pressure level of 1 , which is the generally accepted just-noticeable-difference for a passive listener. A change in distance of 16 would result in a change in captured sound pressure level of 3 , generally accepted as a clearly noticeable difference for a passive listener. Preliminary analysis of several video monitor excerpts of subjects showed average and standard deviation radial distance around the reference point of [43]. However, we note that this positional variation results in a change in the VAE’s reverberant level only, not the significantly louder natural direct sound level of the instrument. We can assume that an active musician will be less sensitive than a passive listener to such changes.
Finally, there are limitations in the interpretation of the results due to the small number of participants. Since there are only 4–5 participants per group, the effect size and power of the study is quite low. While this methodological choice was deemed sufficient for a preliminary study of the VAE tool, further research is required to more definitively ascertain the impact of the VAE tool on a musician’s rehearsal. The participant pool ranged from semi-professional to professional musicians, but did not systematically control for variables such as sight-reading ability, repertoire complexity, or prior experience with virtual rehearsal systems. Moreover, there was an insufficient number of participants to adequately test the interactions between expertise level and other factors in the current study. A subsequent study with a more homogeneous and much larger sample could yield valuable insights into how skill level, musical genre, or instrument type modulate responses to virtual rehearsal.
8. Summary and Conclusions
This study set out to determine whether a virtual acoustic rehearsal tool could help musicians prepare for performances in unfamiliar venues. The proposed tool allowed musicians to (1) rehearse as though they were on an actual stage and (2) listen back from various audience positions. Three groups of participants used the tool prior to performing on the stage of an auditorium. During rehearsal, only one group was immersed in an acoustic environment that matched that of the auditorium. The other two groups respectively rehearsed in VAEs emulating an amphitheatre (with very different acoustics from that of the auditorium) and a dry recording studio. After the experiment, questionnaires were administered and analyzed to assess the perceived usefulness, quality, and validity/similarity of the rehearsal tool.
From the perspective of perceived realism and comfort, the rehearsal tool proved largely successful. Musicians generally described the virtual acoustics as natural and reported that the headphones allowed a clear blend of their instrument’s direct sound with the simulated acoustics. Similarity ratings indicated that participants generally perceived that the auditorium VAE matched the acoustics of the auditorium. Participants rehearsing in the VAE emulating the acoustics of the auditorium tended to report that they found it easier and more comfortable to play on stage during the final performance compared to the other two, though the result was not statistically significant due to the low number of participants.
Several methodological limitations temper these findings. Certain instrument-specific concerns arose, including the fact that larger instruments such as cellos were sometimes awkward to play with the bulky headphones used to create natural auralizations. These concerns could be moderated by using different, smaller headphones, which may affect the harmonic quality of the auralization, but can still produce a realistic VAE. In the same vein, the use of the VAE tool is currently limited to unamplified instruments; however, it can conceivably be implemented for amplified instruments by including loudspeakers in the virtual environment. Furthermore, because of implementation constraints, the system did not allow for realistic head or instrument movements during the rehearsal, or at least did not take them into account in the auralization. A future tool might include motion tracking or real-time directivity adjustment to capture this additional realism for both instrument and musician. A next iteration of this study would also benefit from a broader pool of participants and instruments. Complementing subjective ratings with more detailed acoustic analyses of the recorded performances would further allow a characterization of whether musicians really adapted to the virtual venue prior to the final performance.
This study highlights the extent to which high-quality spatial audio can meaningfully influence training, practice, and performance outcomes. Beyond musicians, professionals such as theatre actors, public speakers, or anyone who relies heavily on auditory cues might find similar benefits in VR systems implementing accurate acoustic renderings.
Author Contributions
Conceptualization, C.F., M.S.L., D.P.-Q. and B.F.G.K.; methodology, C.F., M.S.L., D.P.-Q. and B.F.G.K.; software, C.F. and D.P.-Q.; validation, C.F., M.S.L. and B.F.G.K.; formal analysis, C.F., M.S.L.; investigation, C.F.; resources, B.F.G.K.; data curation, C.F.; writing—original draft preparation, C.F.; writing—review and editing, M.S.L., D.P.-Q. and B.F.G.K.; visualization, C.F.; supervision, M.S.L., D.P.-Q. and B.F.G.K.; project administration, B.F.G.K.; funding acquisition, B.F.G.K. All authors have read and agreed to the published version of the manuscript.
Funding
Funding was provided in part by the French project PHEND (The Past Has Ears at Notre-Dame, Grant No. ANR-20-CE38-0014, https://pasthasears.dalembert.upmc.fr/doku.php/phend (accessed on 31 July 2025)). Additional funding provided by the SONICOM project (www.sonicom.eu (accessed on 31 July 2025)), European Union’s Horizon 2020 research and innovation program grant agreement No. 101017743.
Institutional Review Board Statement
The study was conducted in accordance with the Declaration of Helsinki and approved by the Ethics Committee of Sorbonne University (protocol code CER-2025-KATZ-EVAA-rveval-00400, 28 May 2025).
Informed Consent Statement
Informed consent was obtained from all subjects involved in the study.
Data Availability Statement
The data are available from the corresponding author on request.
Acknowledgments
The authors are grateful to Renato Mariano Braga and Sarabeth S. Mullins for the room acoustic measurement campaign.
Conflicts of Interest
The authors declare no conflicts of interest. The funders had no role in the design of the study; in the collection, analyses, or interpretation of data; in the writing of the manuscript; or in the decision to publish the results.
Appendix A. Results of the Factor Analysis for Construct Validation
The results of the factor analysis for the Phase 1 questionnaire can be seen in Table A1. For this analysis, six factors were chosen based on a cumulative explained variance of 0.86, mean uniqueness of 0.15 (none exceeding 0.45), and probability of <.
Table A1.
Factor analysis of Phase 1 questionnaire with 6 factors. A loading threshold of 0.4 was applied for each factor.
Table A1.
Factor analysis of Phase 1 questionnaire with 6 factors. A loading threshold of 0.4 was applied for each factor.
| Item | Factor 1 | Factor 2 | Factor 3 | Factor 4 | Factor 5 | Factor 6 |
|---|---|---|---|---|---|---|
| Q1 | 0.93 | |||||
| Q2 | 0.67 | 0.55 | ||||
| Q3 | 0.63 | |||||
| Q4 | 0.86 | |||||
| Q5 | 0.48 | 0.79 | ||||
| S1-p1 | 0.69 | |||||
| S2-p1 | 0.81 | |||||
| S3-p1 | 0.70 | |||||
| S4-p1 | 0.81 | 0.46 | ||||
| S5-p1 | 0.84 | |||||
| U1 | 0.90 | |||||
| U2 | 0.74 | 0.41 | ||||
| U3 | 0.80 | |||||
| U4 | 0.76 | 0.46 | ||||
| F1 | 0.81 | |||||
| F2 | 0.73 |
It is interesting to note that while Q2, Q5, S4-p1, U2, and U4 all appear in two factors, the other items are limited to single factors. Thus, the interpretation of these factors is as follows: Factor 1 relates to how the VAE tool quality contributed to the ability to take the acoustics into account. Factor 2 could be interpreted as “overall satisfaction and confidence in rehearsal”, while Factor 4 seems to be related more strictly to the “musical ability in rehearsal”. Factor 3 includes questions related to the “realism of the auralization”. Lastly, Factor 6 only contains Q1 about “headphone discomfort”, which is in fact a question focused on a unique construct compared to the other items.
For the Phase 2.2 questionnaire (Table A2), once again six factors were chosen. The cumulative explained variance was 0.84, mean uniqueness was 0.16 with none being greater than 0.32, and probability of <.
Table A2.
Factor analysis of Phase 2.2 questionnaire with 6 factors. A loading threshold of 0.4 was applied for each factor.
Table A2.
Factor analysis of Phase 2.2 questionnaire with 6 factors. A loading threshold of 0.4 was applied for each factor.
| Item | Factor 1 | Factor 2 | Factor 3 | Factor 4 | Factor 5 | Factor 6 |
|---|---|---|---|---|---|---|
| S1-p2 | 1.00 | |||||
| S2-p2 | 0.55 | −0.61 | ||||
| S3-p2 | 0.50 | 0.66 | ||||
| S4-p2 | 0.58 | 0.56 | ||||
| S5-p2 | 0.47 | 0.51 | ||||
| S6-p2 | 0.59 | −0.52 | ||||
| P1 | 0.52 | 0.59 | 0.45 | |||
| P2 | 0.74 | |||||
| P3 | 0.75 | 0.45 | ||||
| P4 | 0.85 | |||||
| P5 | 0.85 | |||||
| P6 | 0.99 | |||||
| P7 | 0.86 | |||||
| P8 | −0.92 | |||||
| P9 | 0.76 | |||||
| P10 | 0.83 |
In this case, there were 7 items that contributed to multiple factors: S2-p2, S3-p2, S4-p2, S5-p2, S6-p2, P1, and P3. However, the interpretation of the factors was once again relatively straightforward: Factor 1—Musician’s satisfaction with similarity between real and virtual rooms, Factor 2—Evaluation of the VAE tool, Factor 3—Overall satisfaction in the performance, Factor 4—Ability to take the acoustics into account, Factor 5—Similarity between performance and rehearsal, and Factor 6—Novelty of the auditorium. Factor 6 once again had only 1 item in the cluster as this item on the novelty of playing in this auditorium was conceptually different from the others.
References
- Biggs, B.; Murgaski, S.; Coppin, P.; Walker, B.N. Creating Non-Visual Non-Verbal Social Interactions in Virtual Reality. Virtual Worlds 2025, 4, 25. [Google Scholar] [CrossRef]
- Postma, B.N.J.; Katz, B.F.G. Influence of visual rendering on the acoustic judgements of a theater auralization. Proc. Meet. Acoust. 2017, 30, 015008. [Google Scholar] [CrossRef]
- Blauert, J. Spatial Hearing: The Psychophysics of Human Sound Localization; MIT Press: Cambridge, MA, USA, 1996. [Google Scholar] [CrossRef]
- Vorländer, M. Auralization: Fundamentals of Acoustics, Modelling, Simulation, Algorithms and Acoustic Virtual Reality, 1st ed.; Springer: Berlin/Heidelberg, Germany, 2008; pp. 80–103. [Google Scholar]
- Leiper, T. A study of the impact on health and wellbeing of amateur choir singers as face-to-face group singing moved online. Voice Speech Rev. 2023, 17, 48–65. [Google Scholar] [CrossRef]
- Daffern, H.; Weatherly, H.; Saramago, P.; Steele, K.; Greaves, D.; Kavanagh, M.; Cooney, L.; Spreadborough, J.; Honnan, S.; Johnston, D.; et al. Virtual choirs in care homes: The development and early assessment of a new virtual reality choir intervention. Virtual Worlds 2025, 4, 8. [Google Scholar] [CrossRef]
- Mullins, S.; Le Page, V.; De Muynke, J.; Canfield-Dafilou, E.K.; Billiet, F.; Katz, B.F.G. Preliminary report on the effect of room acoustics on choral performance in Notre Dame and its pre-Gothic predecessor. J. Acoust. Soc. Am. 2021, 150, A258. [Google Scholar] [CrossRef]
- Schärer Kalkandjiev, Z.; Weinzierl, S. The influence of room acoustics on solo music performance: An empirical case study. Acta Acust. United Acust. 2013, 99, 433–441. [Google Scholar] [CrossRef]
- Schärer Kalkandjiev, Z.; Weinzierl, S. The influence of room acoustics on solo music performance: An experimental study. Psychomusicol. Music Mind Brain 2015, 25, 195–207. [Google Scholar] [CrossRef]
- Luizard, P.; Steffens, J.; Weinzierl, S. Singing in different rooms: Common or individual adaptation patterns to the acoustic conditions? J. Acoust. Soc. Am. 2020, 147, EL132–EL137. [Google Scholar] [CrossRef] [PubMed]
- ISO 3382-1; Acoustics—Measurement of Room Acoustic Parameters—Part 1: Performance Spaces. International Organization for Standardization: Geneva, Switzerland, 2009.
- Gari, S.A.; Kob, M.; Lokki, T. Analysis of trumpet performance adjustments due to room acoustics. In Proceedings of the International Symposium on Room Acoustics, Amsterdam, The Netherlands, 15–17 September 2019; pp. 65–73. [Google Scholar]
- Luizard, P.; Brauer, E.; Weinzierl, S.; Bernardoni, N.H. How singers adapt to room acoustical conditions. In Proceedings of the Institute of Acoustics, Hamburg, Germany, 4–6 October 2018. [Google Scholar] [CrossRef]
- Bolzinger, S.; Risset, J.C. A preliminary study on the influence of room acoustics on piano performance. J. Phys. IV 1992, 2, C1-93–C1-96. [Google Scholar] [CrossRef][Green Version]
- Luizard, P.; Henrich Bernardoni, N. Changes in the voice production of solo singers across concert halls. J. Acoust. Soc. Am. 2020, 148, EL33–EL39. [Google Scholar] [CrossRef]
- Bottalico, P.; Łastowiecka, N.; Glasner, J.D.; Redman, Y.G. Singing in different performance spaces: The effect of room acoustics on vibrato and pitch inaccuracy. J. Acoust. Soc. Am. 2022, 151, 4131–4139. [Google Scholar] [CrossRef]
- Ueno, K.; Kato, K.; Kawai, K. Effect of Room Acoustics on Musicians’ Performance. Part I: Experimental Investigation with a Conceptual Model. Acta Acust. United Acust. 2010, 96, 505–515. [Google Scholar] [CrossRef]
- Kato, K.; Ueno, K.; Kawai, K. Effect of room acoustics on musicians’ performance. Part II: Audio analysis of the variations in performed sound signals. Acta Acust. United Acust. 2015, 101, 743–759. [Google Scholar] [CrossRef]
- Bottalico, P.; Graetzer, S.; Hunter, E.J. Effect of training and level of external auditory feedback on the singing voice: Volume and quality. J. Voice 2016, 30, 434–442. [Google Scholar] [CrossRef]
- Long, M. Design of Rooms for Music. In Architectural Acoustics, 2nd ed.; Academic Press: Cambridge, MA, USA, 2014; pp. 723–777. [Google Scholar] [CrossRef]
- Beranek, L. Acoustics and musical qualities. J. Acoust. Soc. Am. 1996, 99, 2647–2652. [Google Scholar] [CrossRef]
- Eley, N.; Lavandier, C.; Psychoyou, T.; Katz, B.F.G. Listener perception of changes in historically informed performance of solo Baroque music due to room acoustics. Acta Acust. 2024, 8, 6. [Google Scholar] [CrossRef]
- Matsuo, A.; Nagano, Y.; Ueno, K.; Ise, S. Room acoustics preference of solo singers for mastering a piece—experiments using “Sound Cask”: A 3D sound field simulation system. In Proceedings of the Forum Acusticum, Torino, Italy, 11–15 September 2023; pp. 4055–4060. [Google Scholar] [CrossRef]
- Wingfield, C.J.; Redman, Y.G.; Nudelman, C.J.; Bottalico, P. Virtual Reality for Performance Preparation. In Proceedings of the Forum Acusticum 2025: 11th Convention of the European Acoustics Association, Málaga, Spain, 23–26 June 2025. [Google Scholar]
- Kleiner, M.; Dalenbäck, B.I.; Svensson, P. Auralization—An overview. J. Audio Eng. Soc. 1993, 41, 861–875. [Google Scholar]
- Farina, A. Advancements in impulse response measurements by sine sweeps. In Proceedings of the 122nd Audio Engineering Society Convention, Vienna, Austria, 5–8 May 2007; pp. 1–21. [Google Scholar]
- Zaunschirm, M.; Frank, M.; Zotter, F. Binaural rendering with measured room responses: First-order ambisonic microphone vs. dummy head. Appl. Sci. 2020, 10, 1631. [Google Scholar] [CrossRef]
- Gospodarek, M.; Warusfel, O.; Ripollés, P.; Roginska, A. Methodology for perceptual evaluation of plausibility with self-translation of the listener. In Proceedings of the Audio Engineering Society International Conference on Audio for Virtual and Augmented Reality, Redmond, VA, USA, 15–17 August 2022; pp. 401–410. [Google Scholar]
- Meyer-Kahlen, N.; Schlecht, S.; Garí, S.V.A.; Lokki, T. Testing Auditory Illusions in Augmented Reality: Plausibility, Transfer-Plausibility, and Authenticity. J. Audio Eng. Soc. 2024, 72, 797–812. [Google Scholar] [CrossRef]
- Eley, N. A Study on the Influence of Acoustics on Historically Informed Performance of Baroque Music. Ph.D. Thesis, CY Cergy Paris Université, Cergy, France, 2023. Available online: https://hal.science/tel-04109151 (accessed on 15 May 2025).
- Mullins, S.S.; Katz, B.F.G. Immersive auralisation for choral ensembles. In Proceedings of the International Conference on Auditorum Acoustics, Athens, Greece, 28–30 September 2023; Volume 45, pp. 1–8. [Google Scholar]
- Poirier-Quinot, D.; Stitt, P.; Katz, B.F.G. RoomZ: Spatial panning plugin for dynamic RIR convolution auralisations. In Proceedings of the Audio Engineering Society International Conference on Spatial and Immersive Audio, Huddersfield, UK, 23–25 August 2023; pp. 1–7. [Google Scholar]
- Schneiderwind, C.; Neidhardt, A.; Meyer, D. Comparing the effect of different open headphone models on the perception of a real sound source. In Proceedings of the Audio Engineering Society, 150th Convention, Online, 25–28 May 2021. [Google Scholar]
- Mullins, S. Des Voix du Passé: The Historical Acoustics of Notre-Dame de Paris and Choral Polyphony. Ph.D. Thesis, Sorbonne Université, Paris, France, 2024. Available online: https://theses.hal.science/tel-04879114 (accessed on 15 May 2025).
- Pätynen, J.; Tervo, S.; Lokki, T. A loudspeaker orchestra for concert hall studies. In Proceedings of the Auditorium Acoustics, Institute of Acoustics, Oslo, Norway, 3–5 October 2008; pp. 45–52. [Google Scholar] [CrossRef]
- Vigeant, M.; Celmer, R.; Jasinski, C.; Ahearn, M.; Schaeffler, M.; Blin, C.; Wells, A.; Ormsbee, C. The effects of different test methods on the just noticeable difference of clarity index for music. J. Acoust. Soc. Am. 2015, 138, 476. [Google Scholar] [CrossRef]
- Nunnally, J.C.; Bernstein, I.H. Psychometric Theory, 3rd ed.; Springer: Berlin/Heidelberg, Germany, 1994; pp. 84–94, 104–111, 251–255, 447–594. [Google Scholar]
- Lawless, M.S.; Vigeant, M.C. Effects of test method and participant musical training on preference ratings of stimuli with different reverberation times. J. Acoust. Soc. Am. 2017, 142, 2258–2272. [Google Scholar] [CrossRef] [PubMed]
- Eley, N.; Mullins, S.; Stitt, P.; Katz, B.F.G. Virtual Notre-Dame: Preliminary results of real-time auralization with choir members. In Proceedings of the Immersive and 3D Audio Conference, Bologna, Italy, 8–10 September 2021; pp. 1–6. [Google Scholar] [CrossRef]
- Katz, B.F.G.; Le Conte, S.; Stitt, P. EVAA: A platform for Experimental Virtual Archeological-Acoustics to study the influence of performance space. In Proceedings of the International Symposium on Room Acoustics, Amsterdam, The Netherlands, 15–17 September 2019. [Google Scholar] [CrossRef]
- Savioja, L.; Svensson, P. Overview of geometrical room acoustic modeling techniques. J. Acoust. Soc. Am. 2015, 138, 708–730. [Google Scholar] [CrossRef] [PubMed]
- Zotter, F.; Frank, M. Ambisonics: A Practical 3D Audio Theory for Recording, Studio Production, Sound Reinforcement, and Virtual Reality; Springer Topics in Signal Processing; Springer: Cham, Switzerland, 2019; pp. 1–210. [Google Scholar] [CrossRef]
- Fernandez, C.; Lawless, M.; Poirier-Quinot, D.; Katz, B.F.G. Preliminary evaluation of a virtual acoustic environment for rehearsal and performance in unknown venues. In Proceedings of the International Symposium on Music and Room Acoustics, New Orleans, LA, USA, 18–23 May 2025; pp. 1–11. [Google Scholar]


Disclaimer/Publisher’s Note: The statements, opinions and data contained in all publications are solely those of the individual author(s) and contributor(s) and not of MDPI and/or the editor(s). MDPI and/or the editor(s) disclaim responsibility for any injury to people or property resulting from any ideas, methods, instructions or products referred to in the content. |
© 2025 by the authors. Licensee MDPI, Basel, Switzerland. This article is an open access article distributed under the terms and conditions of the Creative Commons Attribution (CC BY) license (https://creativecommons.org/licenses/by/4.0/).