Article

Physics-Based Watercraft Simulator in Virtual Reality

1
Information Technology Laboratory, U.S. Army Engineering Research and Development Center, Vicksburg, MS 39180, USA
2
Coastal and Hydraulics Laboratory, U.S. Army Engineering Research and Development Center, Vicksburg, MS 39180, USA
*
Author to whom correspondence should be addressed.
Virtual Worlds 2023, 2(4), 422-438; https://doi.org/10.3390/virtualworlds2040024
Submission received: 11 April 2023 / Revised: 22 August 2023 / Accepted: 24 November 2023 / Published: 14 December 2023

Abstract

:
In this paper, watercraft and ship simulation is summarized, and the way that it can be extended through realistic physics is explored. A hydrodynamic, data-driven, immersive watercraft simulation experience is also introduced, using the Unreal Engine to visualize a Landing Craft Utility (LCU) operation and interaction with near-shore waves in virtual reality (VR). The VR application provides navigation scientists with a better understanding of how coastal waves impact landing operations and channel design. FUNWAVE data generated on the supercomputing resources at the U.S. Army Corps of Engineers (USACE) Engineering Research and Development Center (ERDC) are employed, and using these data, a graphical representation of the domain is created, including the vessel model and a customizable VR bridge to control the vessel within the virtual environment. Several dimension reduction methods are being devised to ensure that the FUNWAVE data can inform the model but keep the application running in real time at an acceptable frame rate for the VR headset. By importing millions of data points output from the FUNWAVE version 3.4 software into Unreal Engine, virtual vessels can be affected by physics-driven data.

1. Introduction

Navigation channels are essential for the economy and national security. Ship pilots who traverse these channels can provide valuable feedback to the civil engineers who design them, and pilot-operated simulators are a popular means of gathering this feedback. Ship simulators can reproduce, imitate, or represent likely occurrences of real-world phenomena and have many applications such as informing risk-based decision making. One way to ensure that simulations are as accurate as possible is through numerical models of physical systems. Calculations of mathematical equations can offer a physics-based representation of common, natural phenomena such as fluid mechanics. In the case of vessel simulation, these natural forces can have important interactions with a ship, affecting its operation. To achieve our research objective of creating accurate simulations, it is imperative to focus on the intricate interactions of vessels with near-shore waves. Near-shore waves present unique challenges due to their complex behaviors influenced by coastal topography. As such, the selection of an appropriate hydrodynamic modeler becomes crucial for this task. Therefore, our research team has chosen to incorporate the hydrodynamic modeler FUNWAVE, renowned for its precision and reliability in capturing near-shore wave dynamics [1]. Many forces act upon a vessel, including waves, current, and wind. One of the most difficult kinds of waves to simulate is near-shore waves. For this application, our research team has incorporated the hydrodynamic modeler FUNWAVE as the most accurate data source for modeling near-shore waves.
Natural phenomena can be visualized using computer graphics applications, which are valuable in understanding and communicating the data. In the past, OpenGL was the powerful tool most often used for demonstrating this capability, but in recent years, video game engines have been leveraged for high-definition graphical renderings. To gain a market edge, game design companies have been at the forefront of graphics. These techniques have been proprietary and hidden until tools such as Unreal Engine and Unity provided amateur developers with similar capabilities. Communities of content creators can now share tools that make the process of visualization much easier. Scientists and engineers are using game design and visual effects techniques to create high-definition graphics simulations of physical systems. Advancements in visualization techniques have significantly impacted the field, particularly with the adoption of video game engines like Unreal Engine and Unity. These engines empower researchers, including both professionals and amateurs, to create visually stunning simulations. For our research, Unreal Engine proves to be an ideal choice, given its robust graphics rendering capabilities, which will be instrumental in enhancing the visualization of ship operations and near-shore wave dynamics. We have chosen this application because of the high quality of graphics capability with the software compared to other applications such as Unity. Unreal Engine utilizes a more advanced and sophisticated rendering pipeline, known as the Unreal Engine 4 (UE4) rendering system. It features cutting-edge graphical techniques such as physically based rendering (PBR) [2], high-quality global illumination through its precomputed radiance transfer (LPV) [3] or real-time ray tracing (DXR) [4], and cinematic-quality post-processing effects [5]. These features contribute to more visually stunning and realistic graphics in Unreal Engine compared to Unity. Beyond merely seeing a visualization, researchers can now be immersed in the data, thanks to virtual reality (VR). Smartphone technologies have led to a resurgence of VR hardware utilizing small and powerful graphics processing unit (GPU) chips and micro light-emitting diode (LED) screens. Game design tools such as Unreal Engine and Unity have also enabled the explosion of VR content created by independent developers. In academia, government, and private industry, developers are going beyond gaming with VR to produce immersive communication solutions. Data immersion can help stakeholders make better informed decisions based on an enhanced experience of the information.
In this study, we harness the potential of virtual reality to provide a transformative data immersion experience. By integrating Unreal Engine’s cutting-edge graphics capabilities with VR technology (Table 1), our simulation will enable researchers and stakeholders to interact with the data in an immersive and comprehensive manner. The immersive nature of VR will foster a deeper understanding of the vessel behavior under various near-shore wave conditions, thereby contributing to enhanced decision making in coastal engineering, military operations, and navigational science.

2. Background

2.1. Ship Simulation

Ship simulation was developed to train mariners in areas such as safe vessel maneuvering techniques including avoiding collisions, which has been explored in previous studies [6]. While ship simulation was initially used for blue water navigation and deep-water harbors, the simulated environments have expanded to include the riverine and littoral environments. Its use promotes safe navigation in the world’s sea lanes and navigation channels by allowing mariners to hone their skills in a zero-risk, laboratory environment [7]. In the 1980s and 1990s, the U.S. Army Corps of Engineers (USACE) Engineer Research and Development Center (ERDC) began using ship simulation in a unique way: the analysis of navigation channel design [8]. Throughout these studies, the ERDC has continually evolved its methods in support of safe and efficient channel design. The ERDC has applied ship simulation technology to design improvement projects in nearly every major U.S. port and commercially navigated waterway in the United States including Alaska, Hawaii, and Puerto Rico. Ship simulation has proven to be an invaluable tool in helping evaluate safety and economic issues for maritime development projects. Using local area expertise, field data, stakeholder input, and experience, the ERDC employs unique ship simulation methods to analyze channel and port design alternatives. Visualization is what makes simulation such a powerful training and analysis tool, giving the mariner a real-time view of the physical environment. The medium for these visual environments began with computer monitors and projectors and has advanced to high-resolution screens, projection systems, and LED domes.
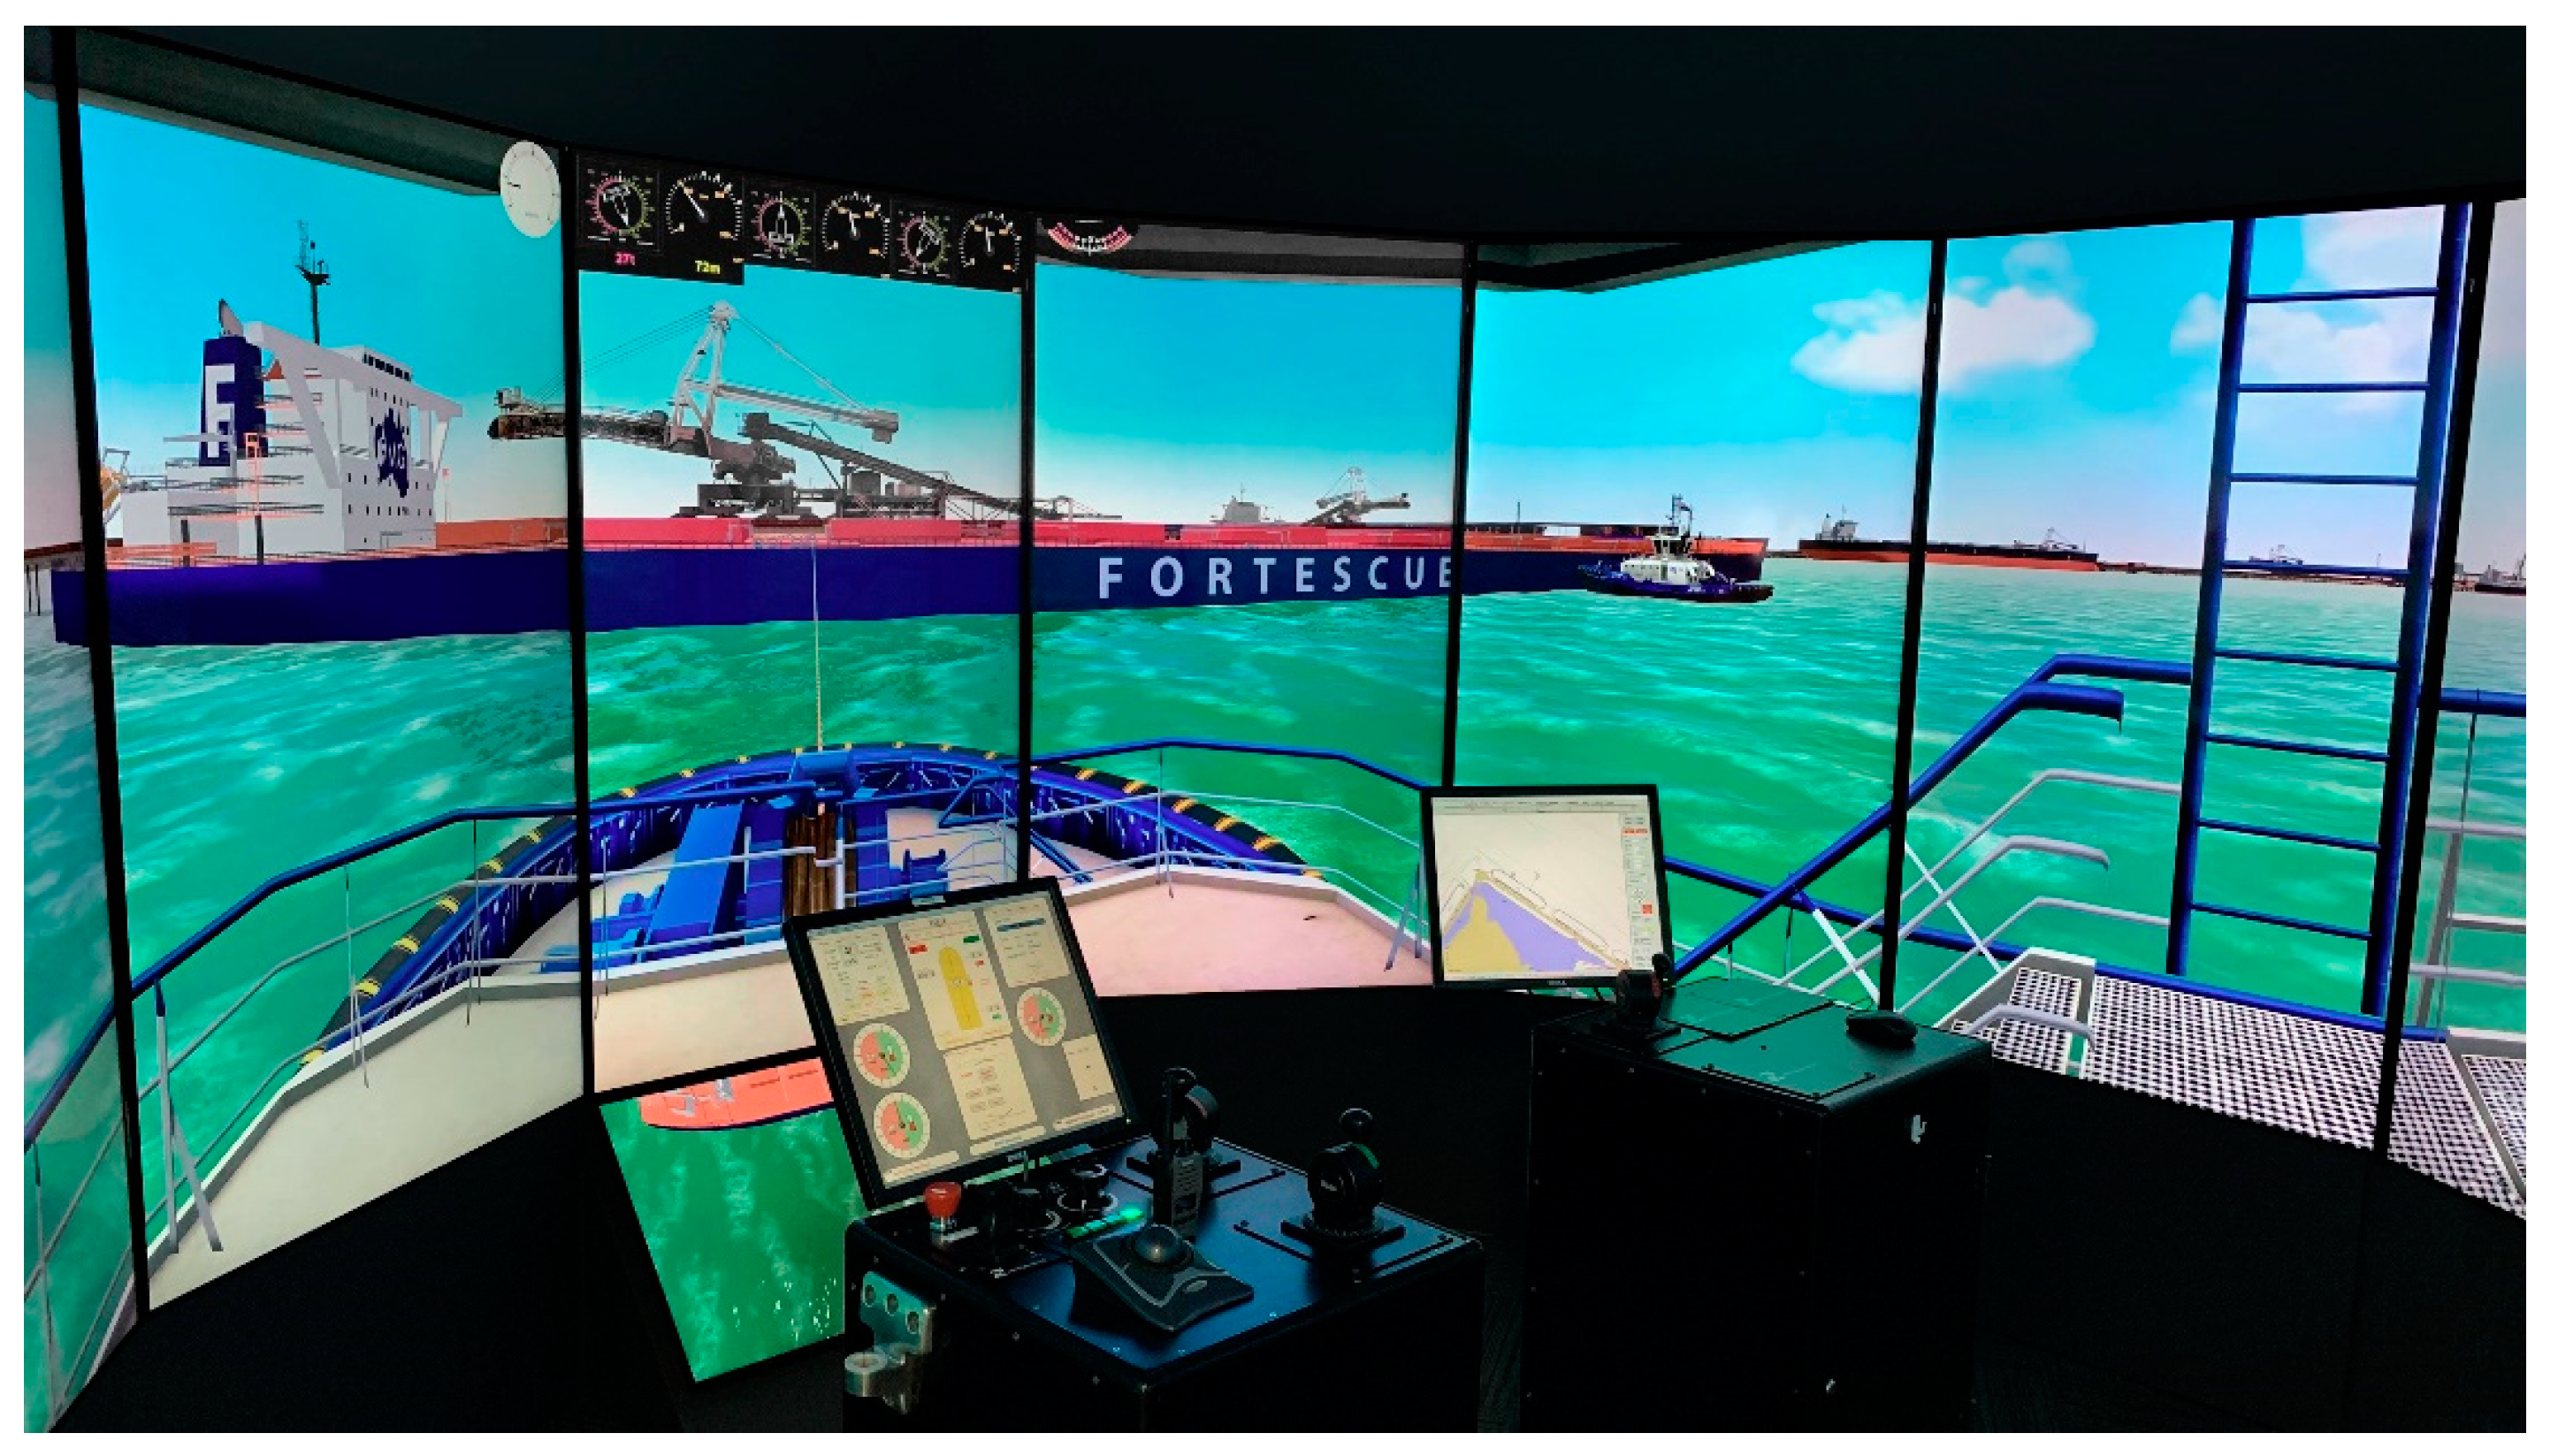
Currently, the visualization software used for ship simulators is essentially the same as gaming and VR applications [9]. Many of the major companies such as Kongsberg Marine (Figure 1) and HR Wallingford (Figure 2) use Unity or Unreal Engine as the basis for their software due to the ability to create interactive experiences. In the past, game engines did not offer the ability to create functionality at the code level and only offered some asset importation and customization. This severely limited the ability to adjust physics parameters or extend any built-in physics. Physics-based simulations had to be developed without the use of game engines [10]. This research focused on Unreal Engine and its ability to create custom adaptations through coding in Unreal Blueprints or by utilizing plugins, which act as software libraries.

2.2. Virtual Reality Simulation in Gaming Engines

Virtual reality has been revolutionary in the field of ship and watercraft simulation by providing a more immersive and realistic training environment. The advancements of VR over the years have greatly enhanced the capabilities for these simulations, giving users the experience of realistic scenarios without the need to pilot a ship in the real world. The use of Unreal Engine, a powerful gaming engine known for its high-fidelity graphics and interactive capabilities, has played a crucial role in driving these advancements. The gaming engine’s ability to render detailed environments and simulate complex physics has made it an ideal choice for watercraft and ship simulation.
The incorporation of VR allows for safer training scenarios and reduces the overall risk of accidents involved in training such as those that are common in the construction industry [11]. The realistic rendering of maritime environments enhances a pilot’s preparedness in critical situations. The ability to model various vessels gives pilots a broad range of options for training that greatly increases their overall knowledge, and they can practice on various bridge types. VR is also very effective for remote learning [12]. Ship simulators can be very large, containing many parts that cannot be easily moved such as screens, consoles, and desktop computers. VR offers a more mobile solution, bringing the training to the student, and saving costs on travel.

2.3. Hydrodynamic Visualization

Watercraft simulation in a VR environment is currently limited by the lack of sophisticated near-shore wave models and the need for the better visualization of wave surfaces. Most traditional wave models, based on linear wave theory, fail to accurately capture nonlinear wave interactions, wave breaking, and near-shore dynamics [13]. These limitations lead to a lack of fidelity in simulating critical hydrodynamic phenomena, resulting in less reliable predictions of ship responses and behavior in realistic sea conditions. To remedy this, it is important to use wave modeling simulations with higher accuracy, which has been shown in previous studies [14]. Advancements in computer hardware, such as high-performance supercomputing, makes it possible to use numerical modeling, such as Navier–Stokes equations, to simulate the important factors affecting ships [15].
FUNWAVE is a fully nonlinear, shallow-to-intermediate water phase resolving, Boussinesq numerical wave model. It provides high-fidelity simulations for many coastal processes including near-shore waves, currents, wave breaking with run-up and overtopping, harbor resonance, infra-gravity waves, and vessel-generated waves. Many of its capabilities are only possible due to its ability to resolve the phases between different super-positioned wave frequencies. This high degree of accuracy, however, comes at the cost of the application being unable to run in real time. Researchers at the Coastal and Hydraulics Laboratory are utilizing an HPC to reduce the computational costs.
The most important components of an immersive and realistic simulated environment are physics calculations and visualization. This is especially true for maritime simulations where pilots sail in both deep water and near-shore (shallow water). Multiple wave types and conditions like spray, splashing, foam, and wakes are necessary to accurately render these different environments and create useful visuals. Pilots, for example, use breaking waves and foamy patches to navigate waters, especially in the near-shore. There are currently two main calculation methods for simulating deep-water ocean waves: parametric and statistical. The former uses mathematical equations to procedurally create simple, trochoidal Gerstner waves. This implementation is based on deep-water waves and is the method used in Unreal Engine’s built-in water physics engine. The most formative example of a Gerstner-based wave simulation first appeared in the 1986 work of Fournier and Reeves [16]. Since then, oceanographers have moved beyond Gerstner waves and favor statistical models that generate “linear waves” or “gravity waves”, which result in a more realistic representation of the open ocean’s surface [17]. The statistical calculation method uses wave spectra data and Fast Fourier Transforms to statistically create a more realistic depiction of choppier waters. The individual waves themselves are still Gerstner waves, but they are superimposed in a way to create more complicated waveforms [18].
Simulating shallow water is more complex than simulating deep water. Oceanographers refer to these waves passing over a shallow bottom as “nonlinear waves” [17]. Unlike deep-water waves, which follow a sinusoidal shape, near-shore waves are sharp near the crest and flat near the trough. This change in shape results from the water depth and seabed terrain—not just wind and gravity. To simulate waves moving to the near-shore, a mathematical model of the seafloor topography is required. Previous work demonstrates that seafloor topography data and waveform data can be constructed simultaneously, making it possible to render near-shore waves in real time at a frame rate of 132 fps in OpenGL [19]. Perhaps more important than deep and shallow water rendering, in the context of ship simulation, is the rendering of visual context clues like breaking waves, spray, and foam. Extensive prior work has been conducted to realistically render breaking waves [16,20] and prove that very fast breaking wave behaviors are possible using OpenGL and NVIDIA Cg shading language [21]. Previous work has also shown how realistic ocean foam and spray can be achieved in real time using traditional texture-based methods [22]. More recent work has demonstrated improvements to these visualizations, including bubbles popping and clumping in natural patterns [23] and water spray as a two-continua for computer graphics wherein it does not appear to fall straight down [24].
In order to improve the near-shore wave physics of ship simulators, it is important to understand gaming physics engines. Programming logic combined with Newtonian equations offers the ability to simulate real-world physics-based events. These software packages are called “physics engines” for gaming and scientific simulation. Physics engines mainly deal with rigid body dynamics, soft body dynamics, collision response, and fluid dynamics. Physics-based particle systems for visual effects that simulate phenomena such as smoke, fog, dust, rain, snow, clouds, water, fire, and light offer enhanced virtual reality immersion [25]. In previous studies, physics engines have been compared, and some important factors have been identified [26]. Integrator performance determines numerical accuracy and is responsible for calculating a body’s position given the forces acting upon it. Constraint stability, collision system, object representation, material properties, and the way objects are stacked were also evaluated [27].
Since our research is mostly focused on using Unreal Engine 4.26, we examined the Nvidia PhysX engine. The research did not evaluate Unreal Engine 5’s new Chaos engine or Niagara Fluids but will be explored in a future work. For the PhysX system, three types of physics actors are static, dynamic, and kinematic. Static actors are immovable in the environment being used mostly for collision detection, dynamic actors are moveable bodies and act under the normal laws of physics, and finally, kinematic actors do not respond to outside forces and move under the user’s control [28]. Several techniques have been evaluated with PhysX for water and fluid simulation including the forces acting upon particles [29].
Data sets have been visualized in different ways, from dashboards with real-time data [30] to VR applications using scatter plots on a 3D graph [31]. Many examples of 3D geospatial terrain data being ingested into virtual reality game engine simulations exist [32]. Other examples show how digital elevation models can be used to create 3D scenes for immersive geographical VR applications [33]. Data ingestion for simulations is not limited to terrain, and examples exist of how meteorological data can be imported to visualize real-time volumetric clouds using Python and Unreal Engine [34]. Researchers have gone beyond the earth and have even modeled real-time cosmological visualizations using Unreal Engine and galaxy image data [35]. Other rarer examples exist of actual simulators implemented such as a vehicle traffic simulator created in Unreal Engine [36]. DataTables are gameplay elements that Unreal Engine uses to store related data. They can be accessed using either C++ or Blueprints, the Unreal Engine visual scripting system. DataTables allow Unreal Engine to input and output data from comma-separated values (CSV) and JavaScript Object Notation (JSON) files [37].

3. Methods

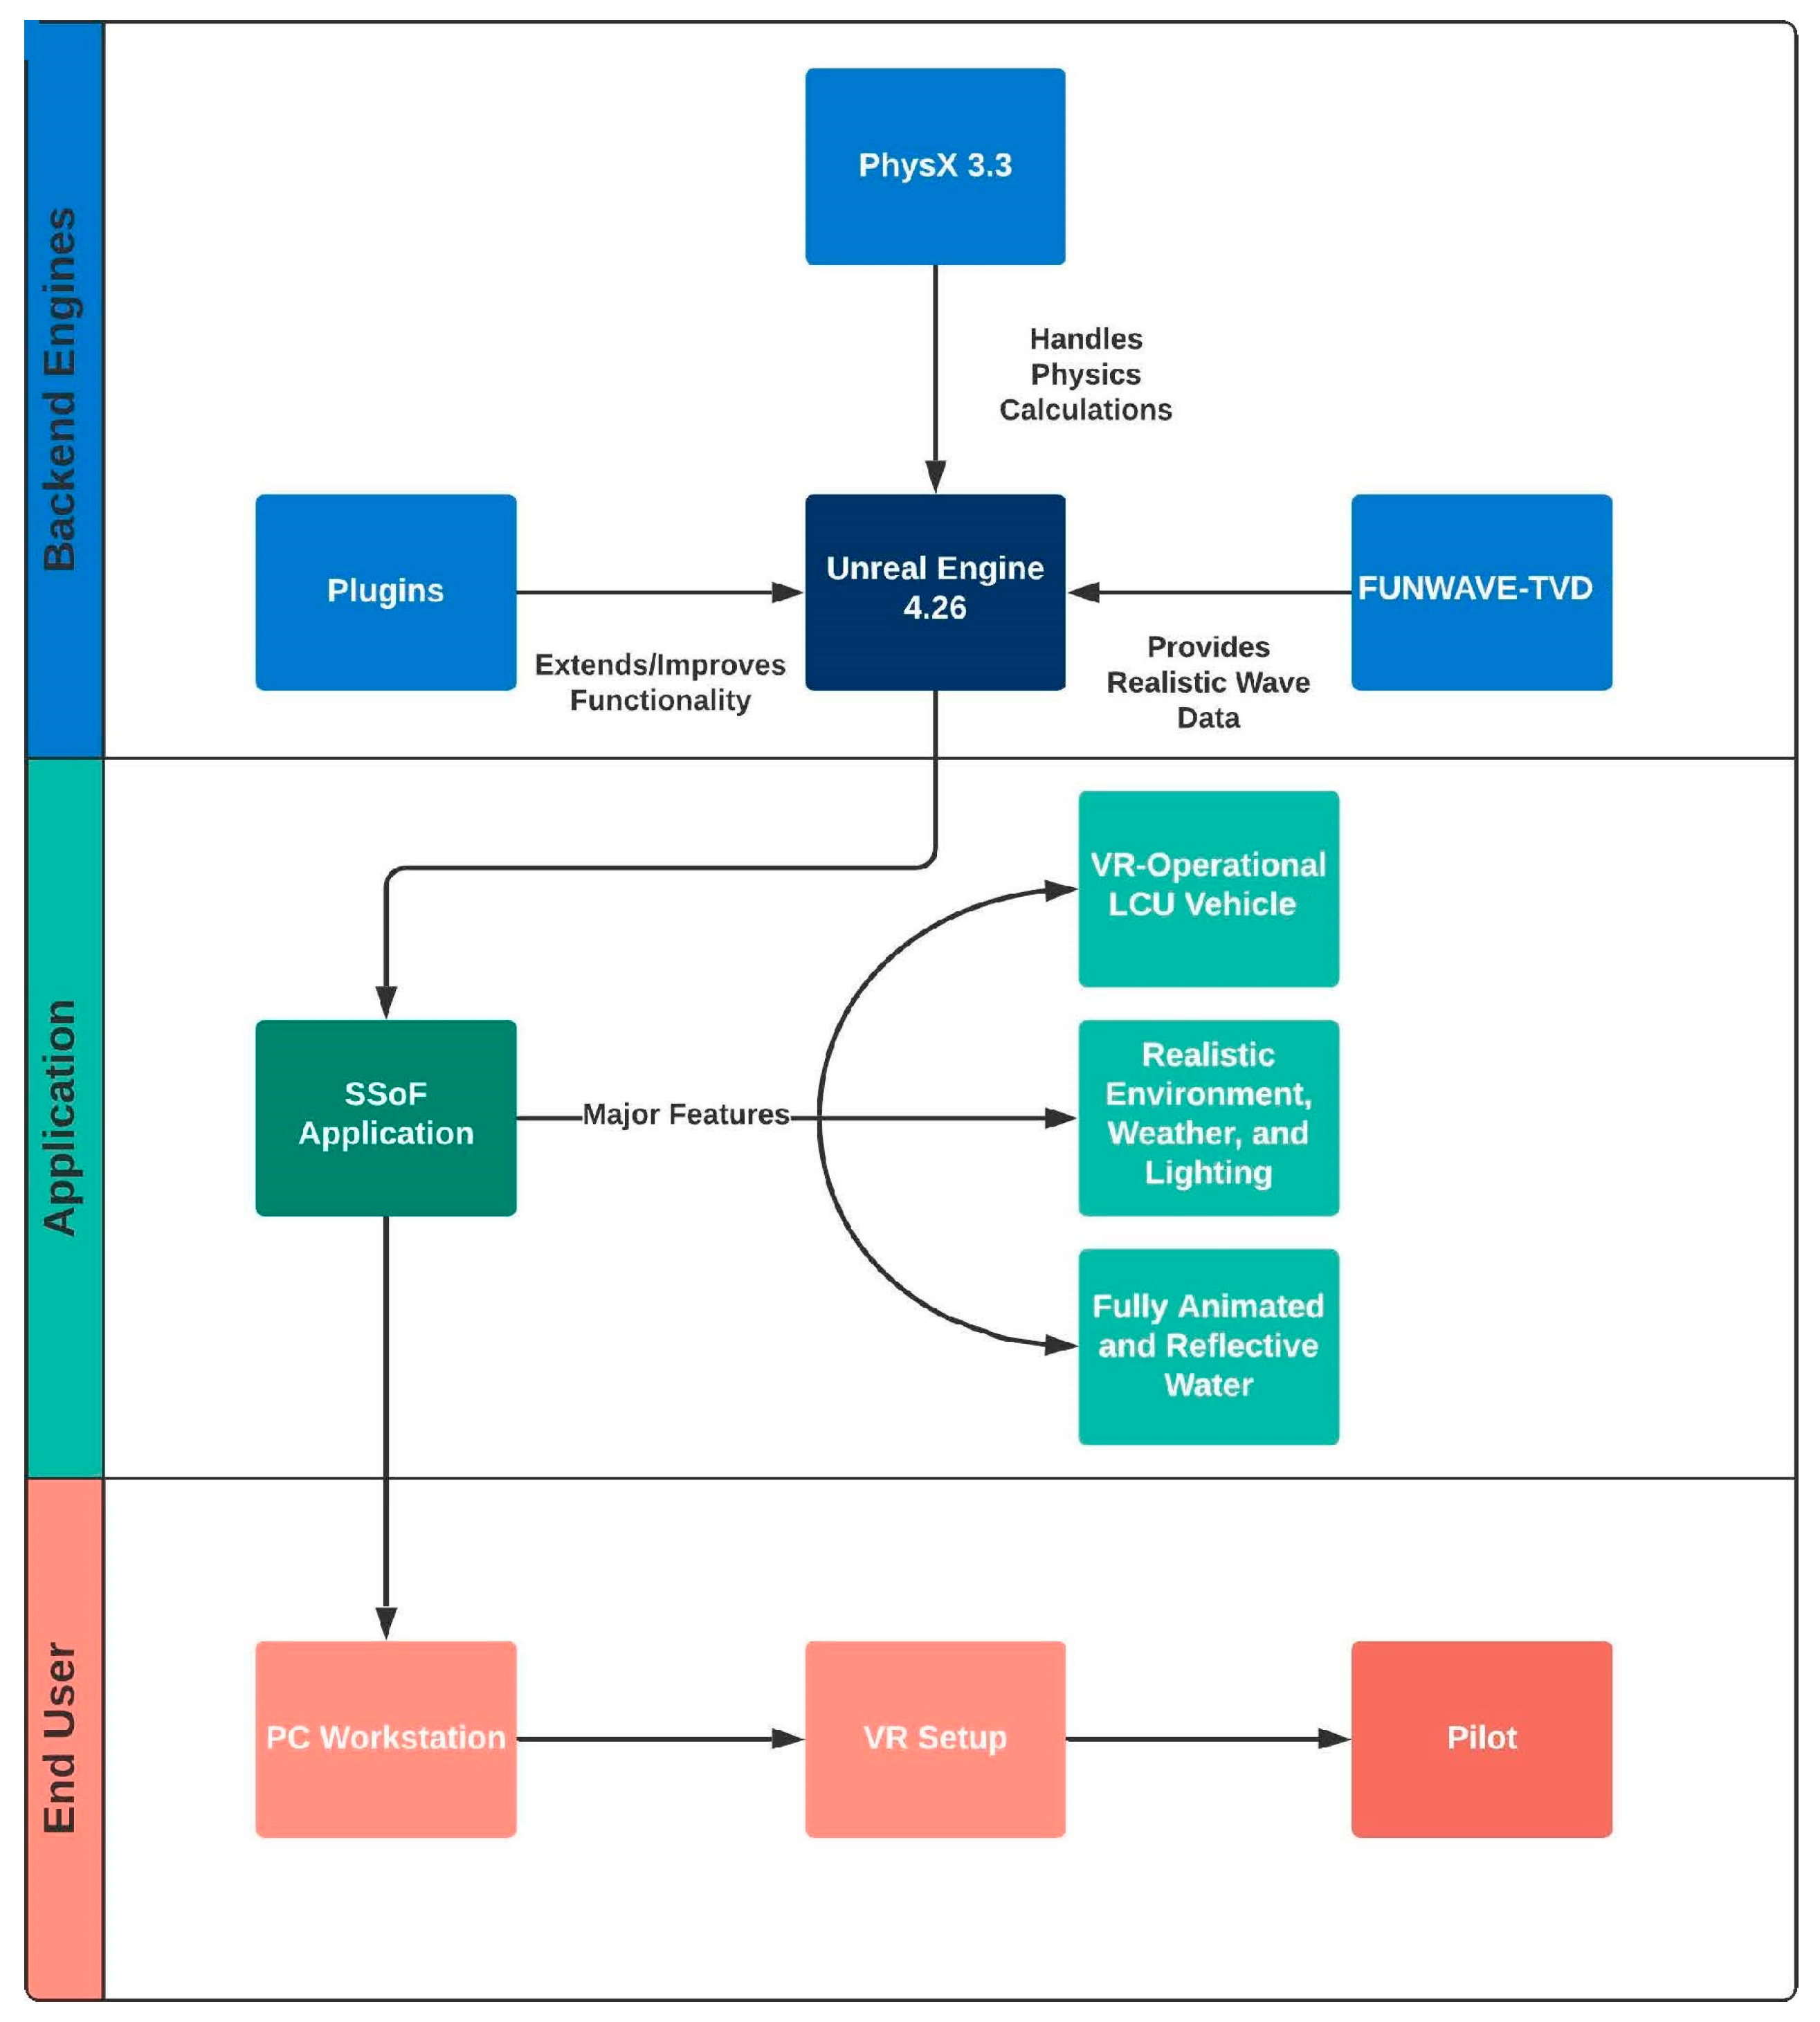
The core of the methodology revolves around a prototype, Landing Craft Utility (LCU), which is piloted in virtual reality. Our unique approach was to ingest FUNWAVE output data into Unreal Engine and represent it in a fully immersive virtual reality simulator. This survey shows how a hybrid approach of virtual reality watercraft piloting, hydrodynamic models, high-definition water rendering, and data ingestion can lead to more advanced simulators in the future. Utilizing the information explained above, we have created a framework that integrates those pieces (Figure 3). We have chosen to use Unreal Engine over another application such as Unity due to its favorable graphics capabilities. Unreal Engine provides the common data environment for our numerical modeler, rigid body physics, realistic computer graphics, and virtual reality simulation. The application consists of a backend developed on Unreal Engine 4.26 and its native handling of physics using PhysX 3.3. The water plugin that was created by Epic Games has options for creating animated Gerstner waves and giving game actors buoyancy. Unreal Engine’s water plugin does not have littoral or near-shore waves, which motivated this research. In order to enhance the realism of near-shore waves, we chose the FUNWAVE hydrodynamic numerical modeler as a source of data that could be ingested due to the high level of accuracy of the modeler.

3.1. Unreal Engine Implementation

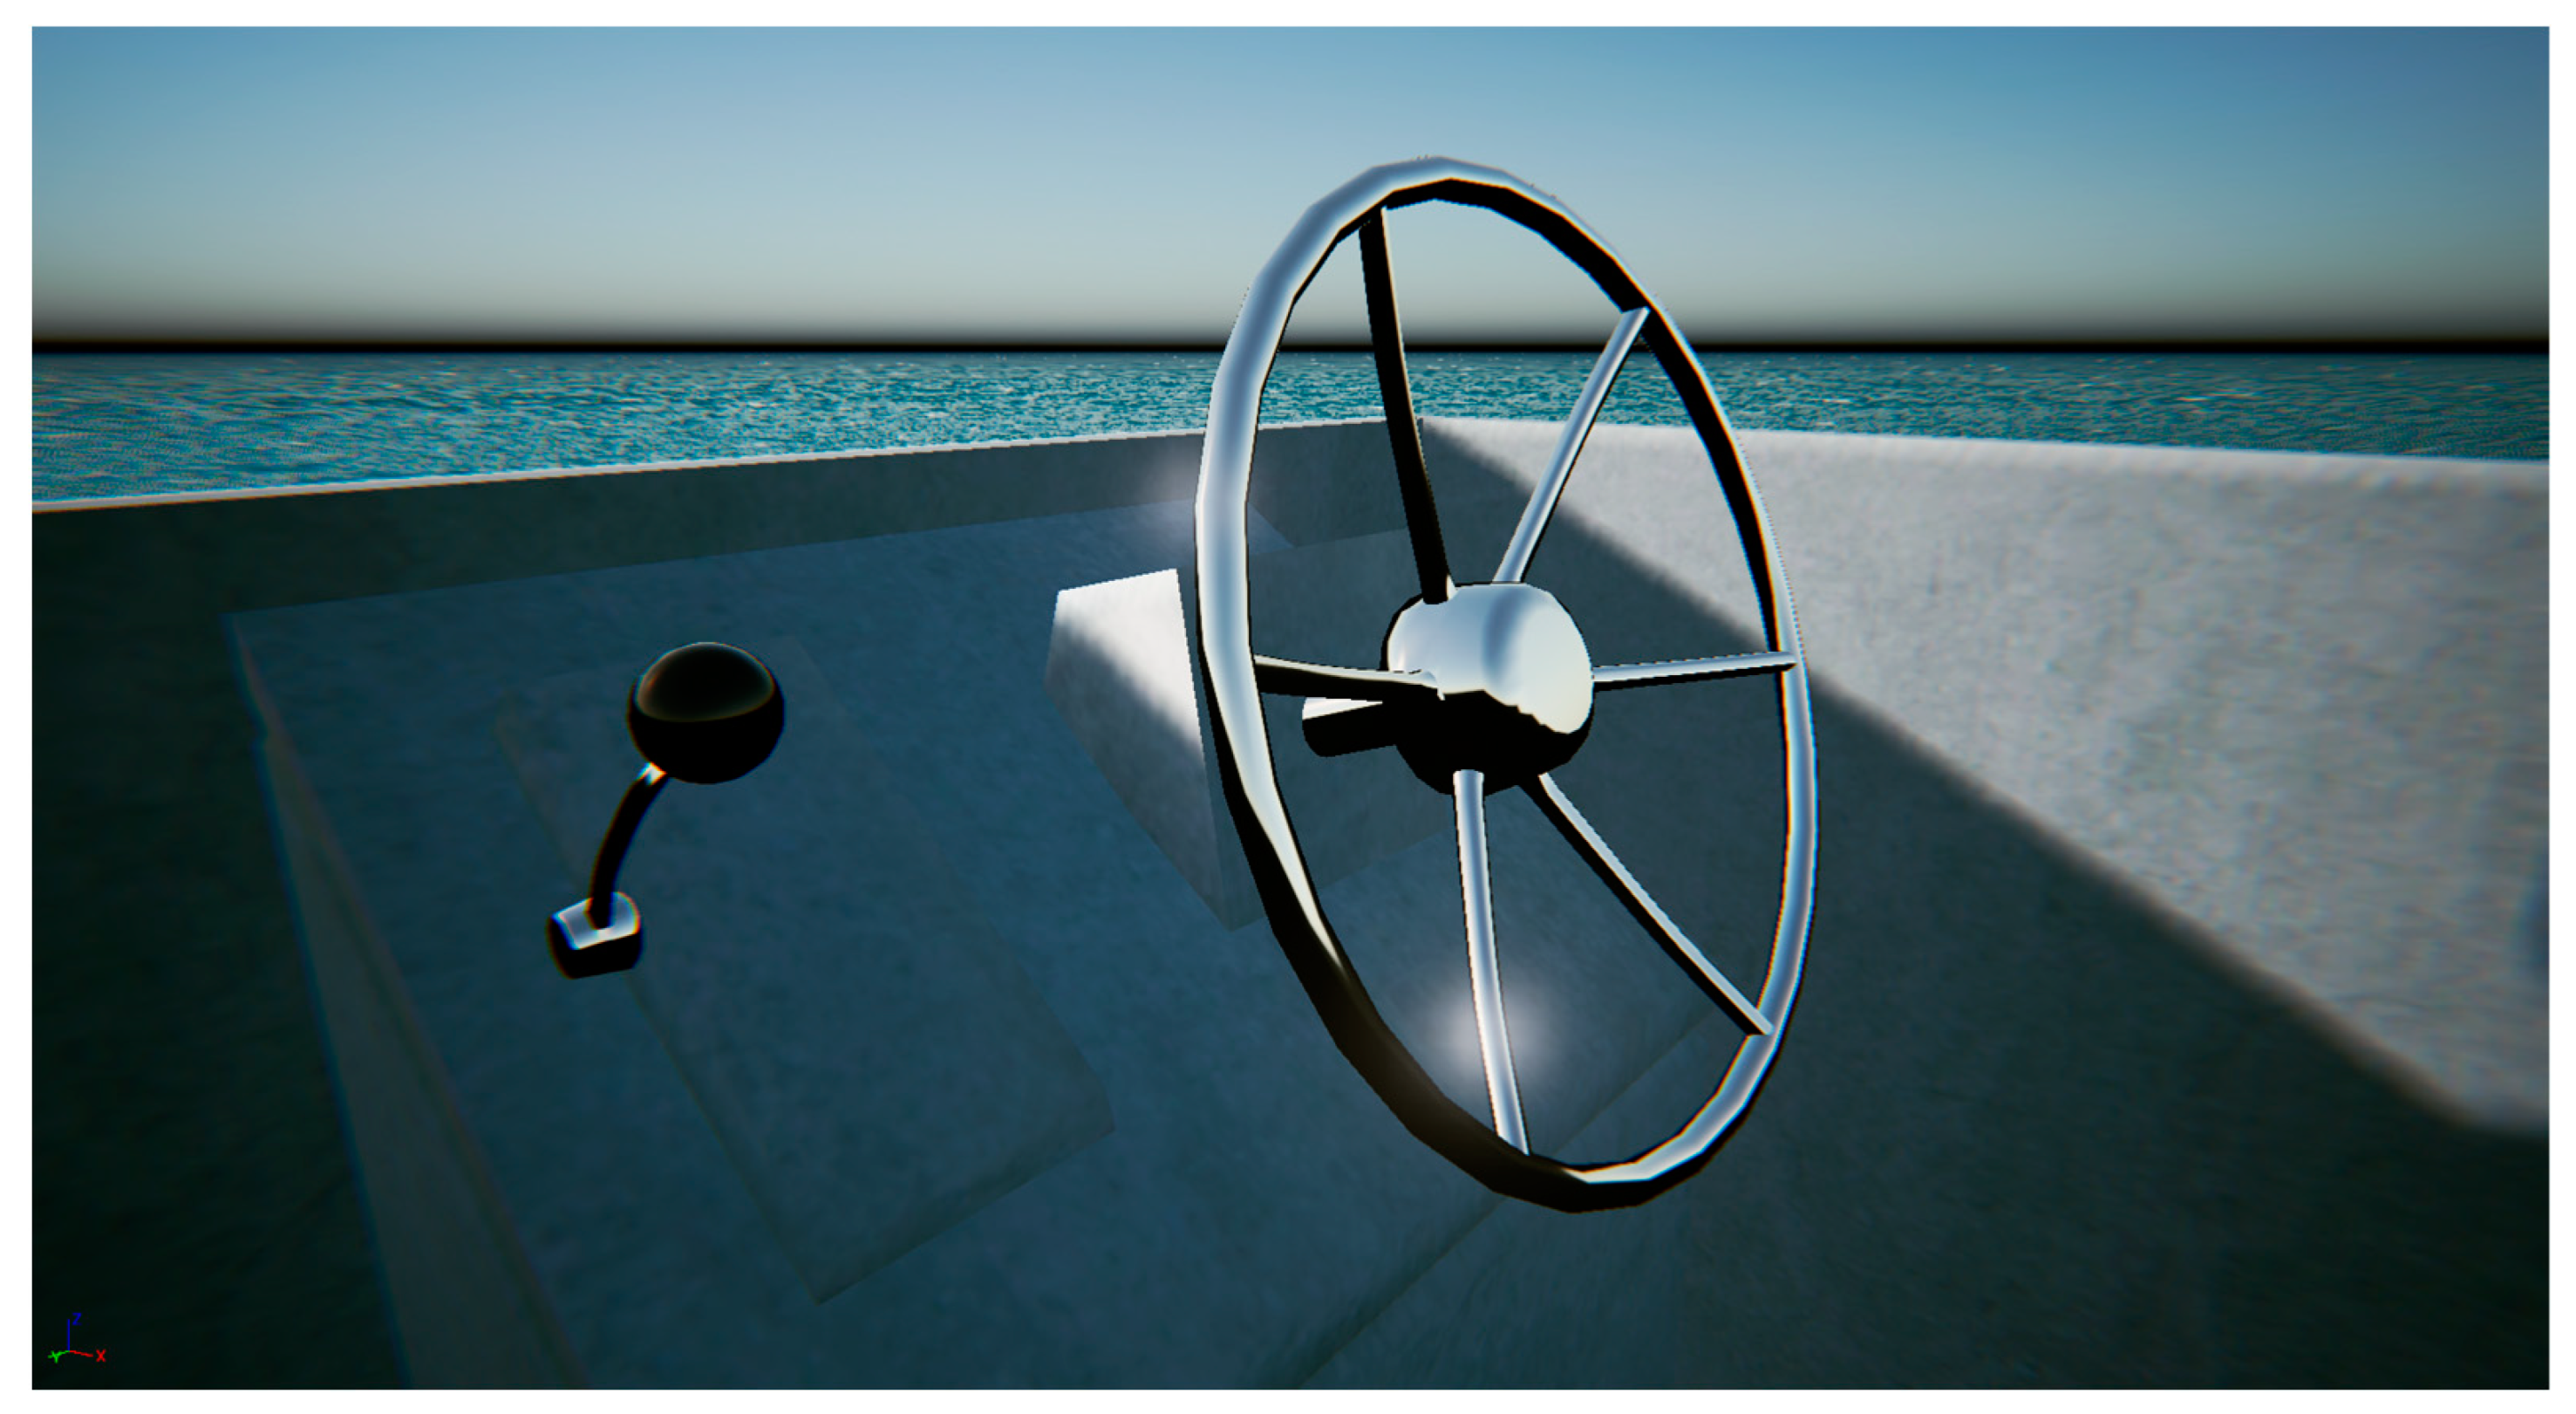
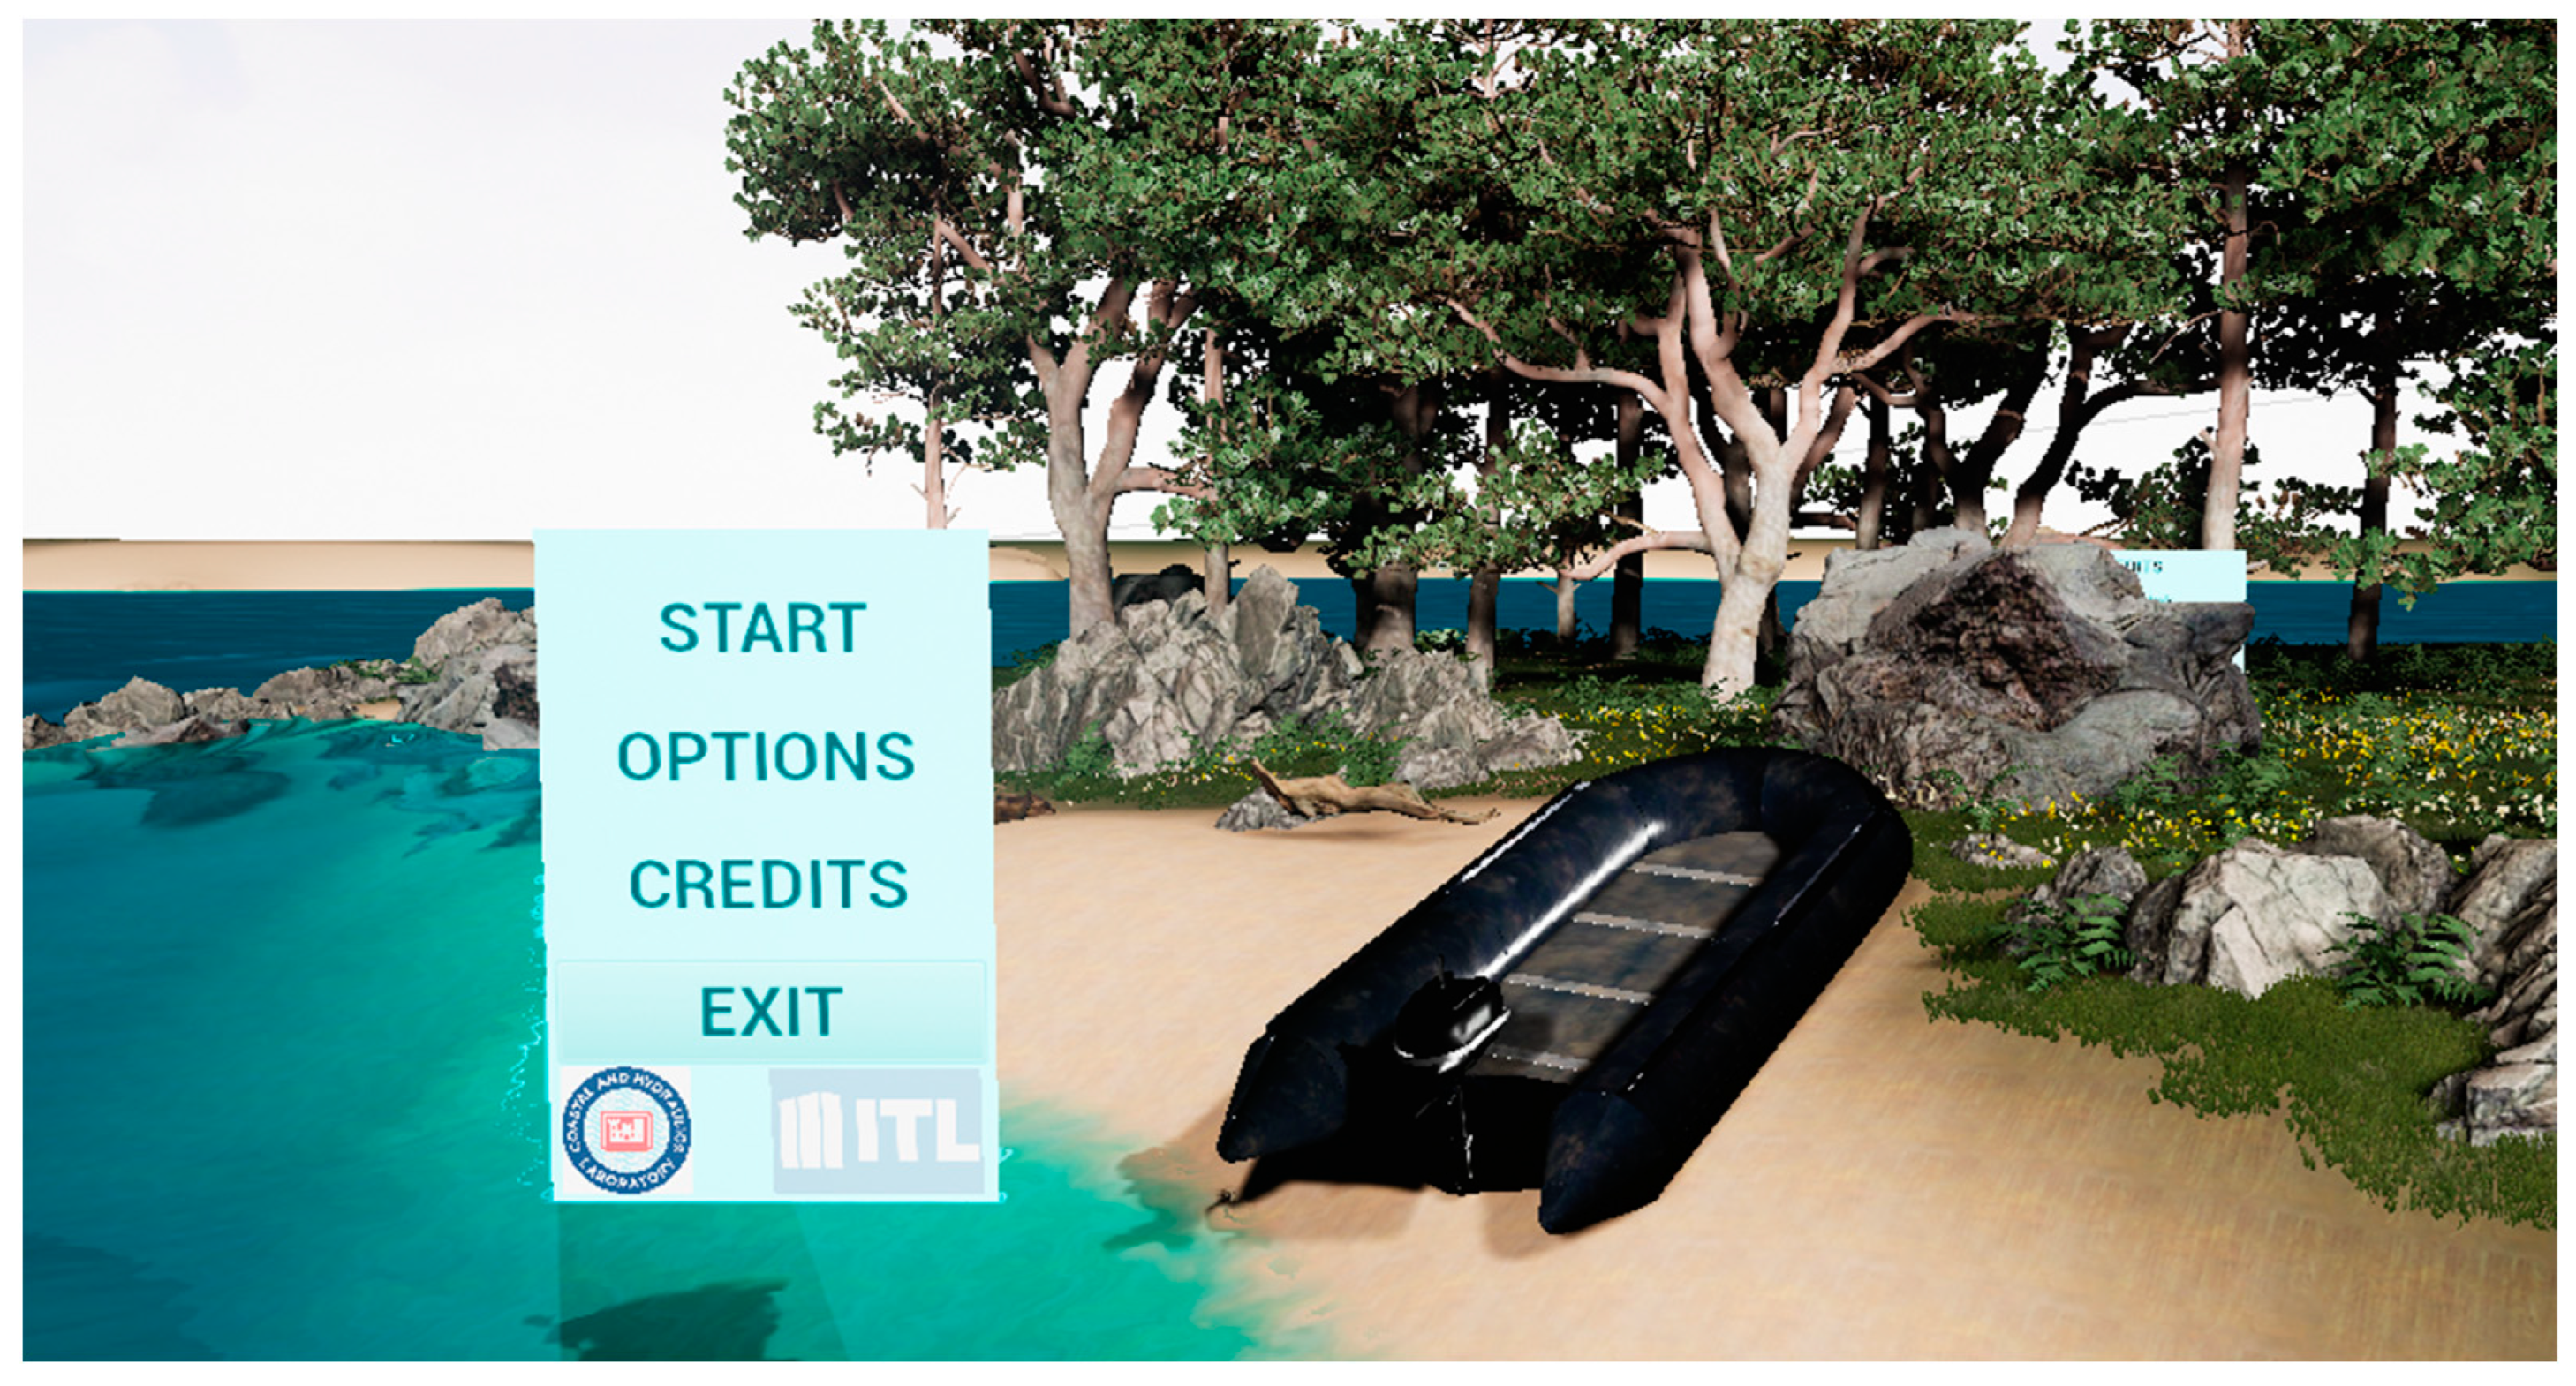
Our development team utilized Unreal Engine 4.26 to simulate an ocean environment where the user can drive an LCU using a throttle for forward and backward motion and using a steering wheel to turn from left to right (Figure 4). Like previously implemented systems [38], the platform simulates real-time six-degrees-of-freedom ship motion (pitch, heave, roll, surge, sway, and yaw) under user interactions and environmental conditions, linear and angular velocity, user gaze direction, as well as control and lever angles taken from the bridge. The fully immersive virtual reality watercraft is buoyant and floats on the surface of the simulated water consisting primarily of Gerstner-type waves. Other auxiliary features include a horn that can be activated, emitting a realistic audio signature. The ship model was designed by ERDC CHL’s Navigation branch. A menu system was included to give users a launch point and the ability to change options such as sound effects, music, and controller settings (Figure 5). A beach island scene was developed by the ITL team using Megascans library and a Combat Rubber Raiding Craft (CRRC) downloaded from Sketchfab.

3.2. Hydrodynamic Data Ingestion

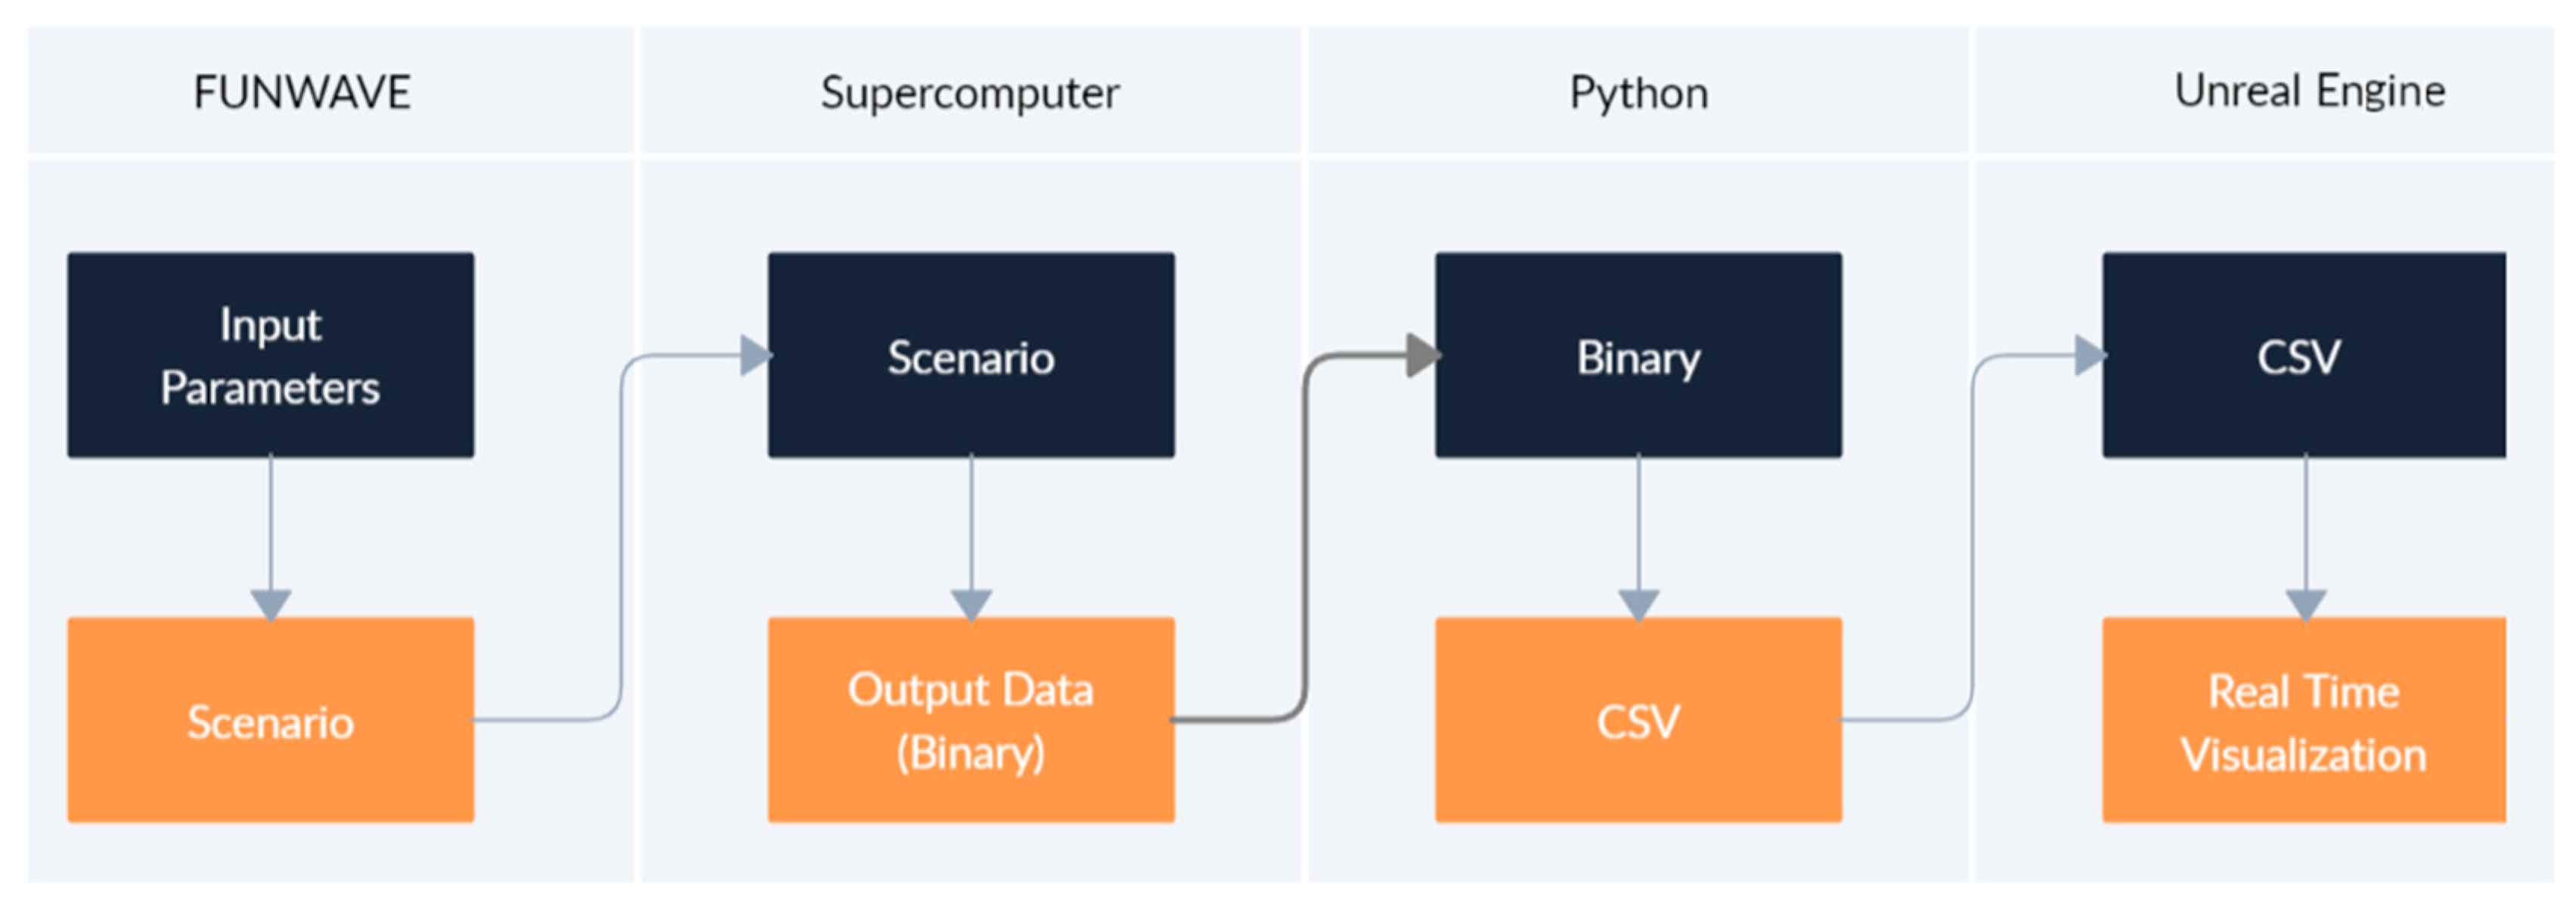
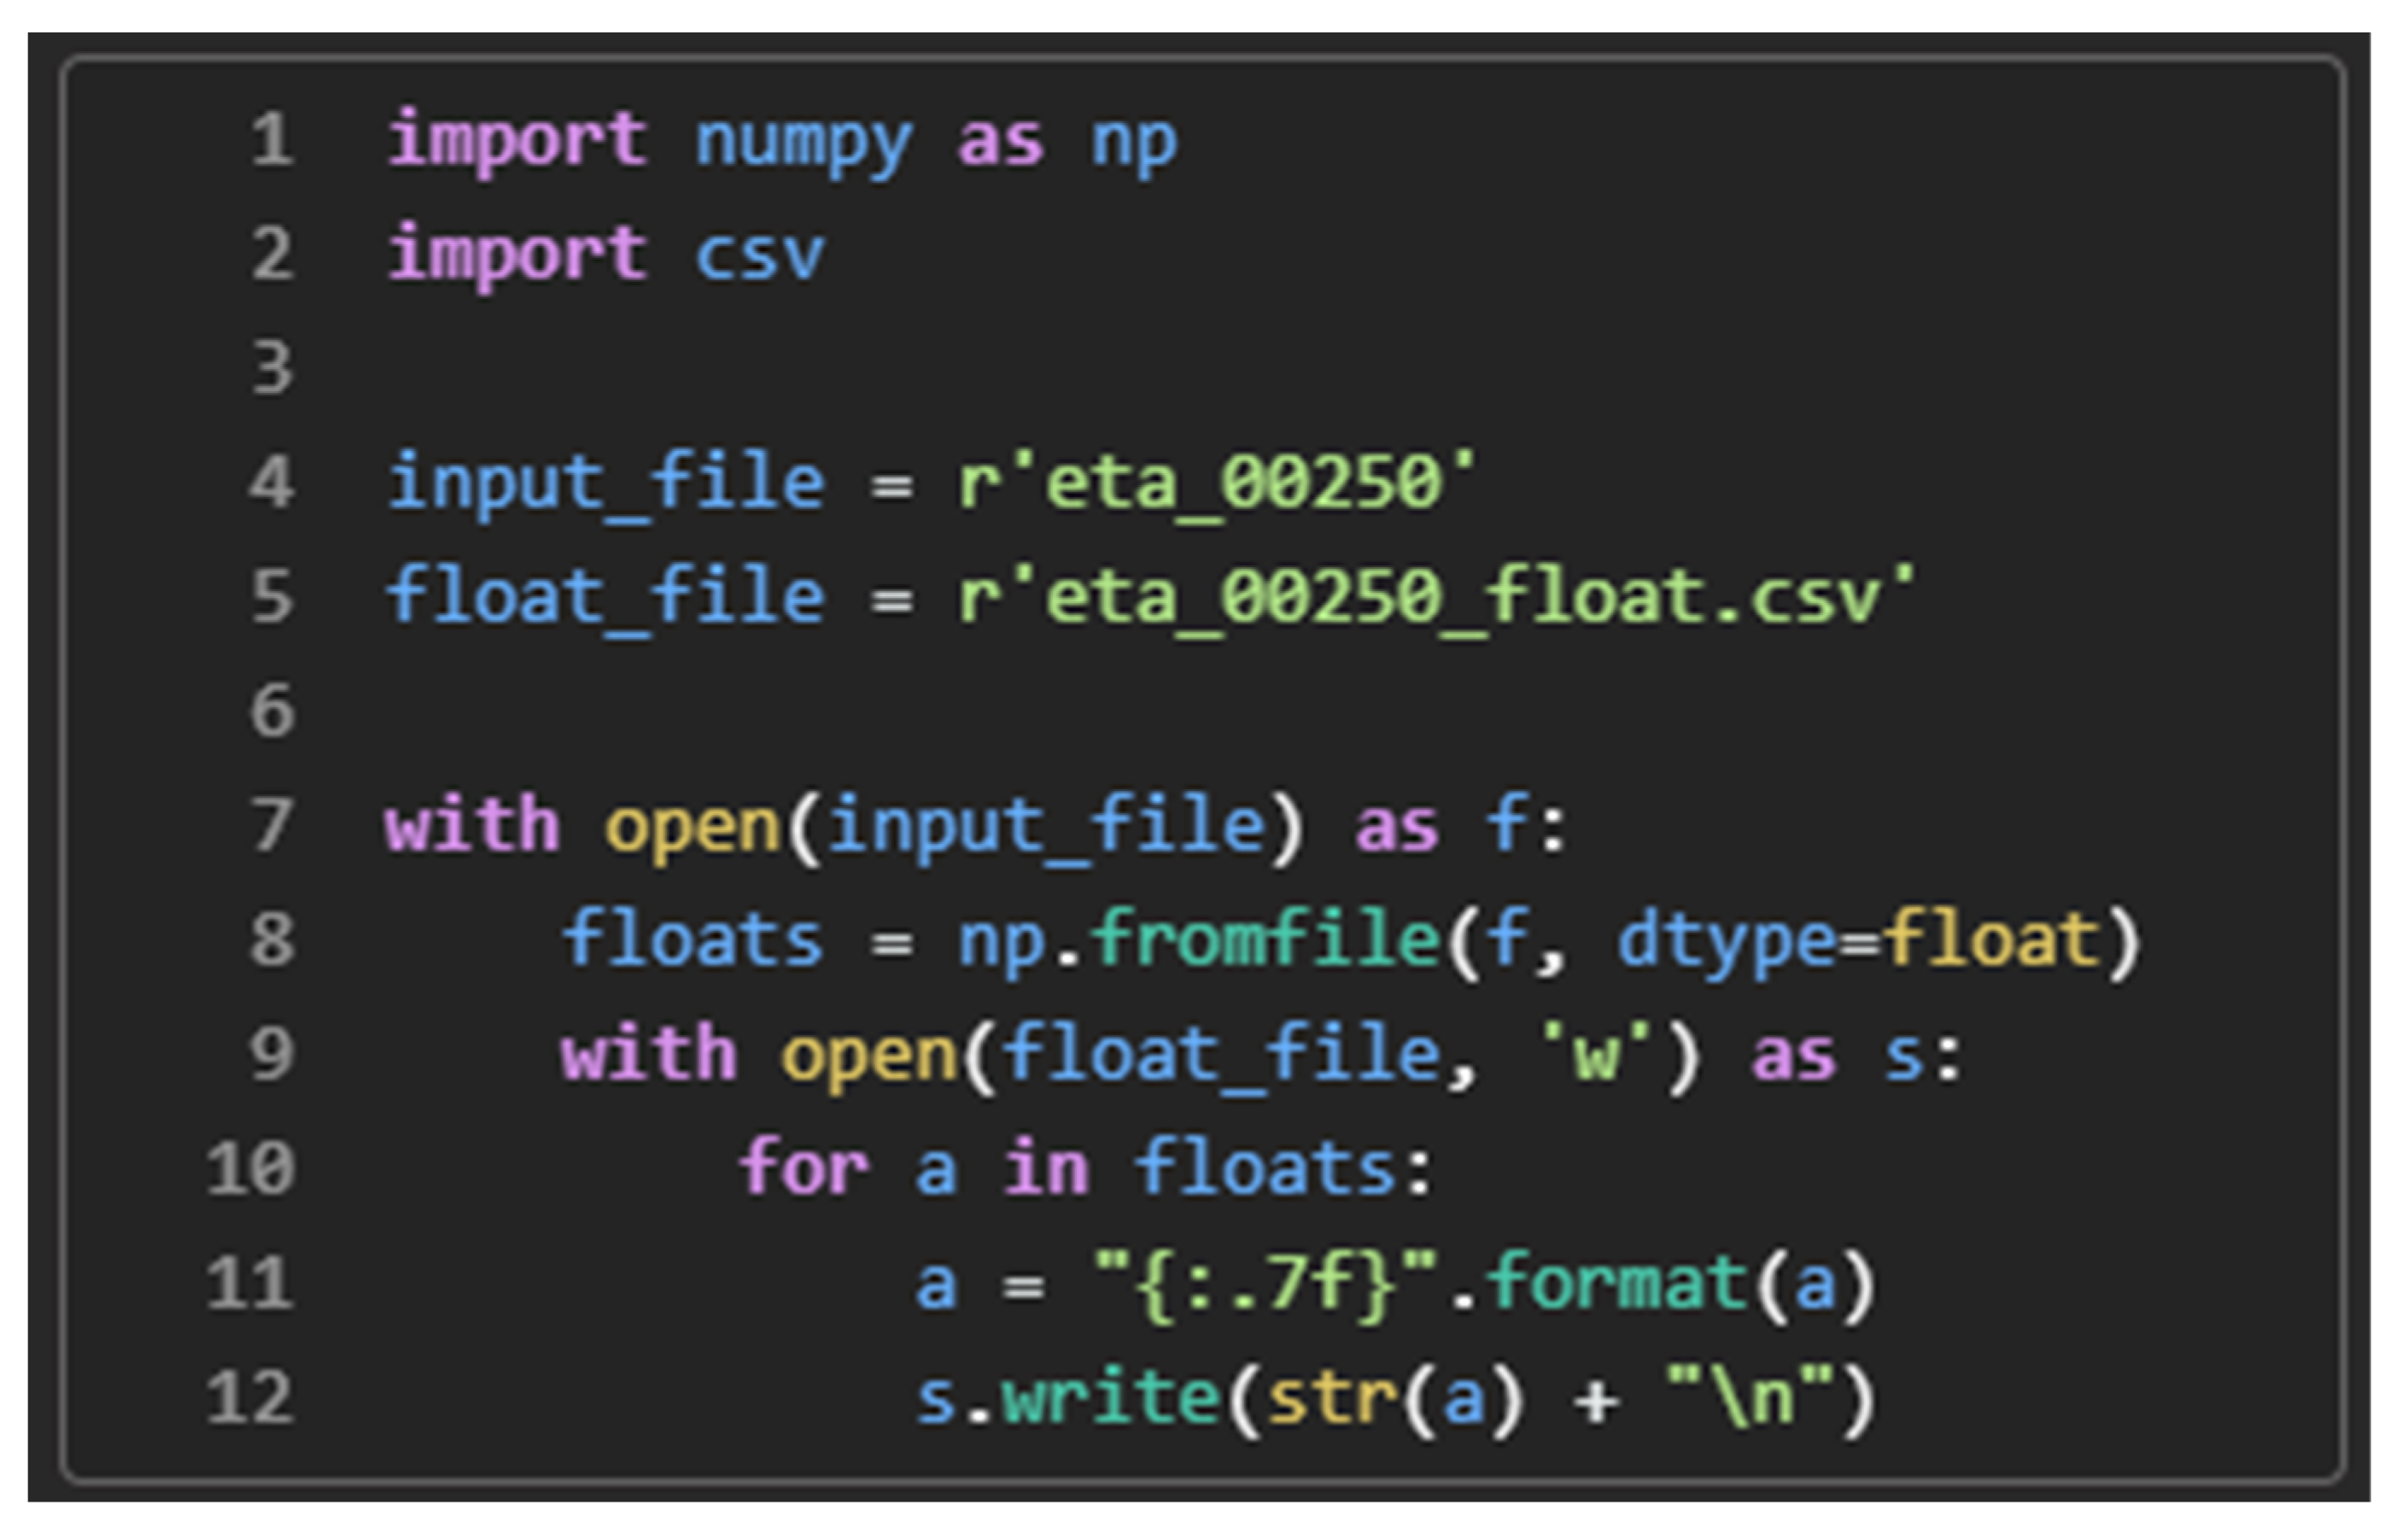
Data from FUNWAVE are essential to integrate high-accuracy physics into a virtual simulation. Currently, there is no way to integrate a live Boussinesq model into a VR simulation at the level of accuracy in FUNWAVE; therefore, the developed capability relies on precomputed hydrodynamic data (Figure 6). Simulation data can be any phase-resolved nonlinear wave model, but for this project, we used FUNWAVE. The model output, packaged in binary files, comprise cross-shore velocities (u), alongshore velocities (v), and water surface elevation (η). The data were unpacked from FUNWAVE’s native format and converted to the CSV format to be ingestible by Unreal Engine’s DataTables (Table 2). To unpack the binary file, our Python script (Figure 7), was used to convert the raw binary wave data into three columns of 7-point precision floating point numbers. Then, we transformed each float to 7-point precision before writing it as a string to the newly created CSV file.
FUNWAVE’s data are output in a structured 2D grid. Data points are discretized along a user-entered resolution/value (every 1 m, 2 m, 0.5 m, etc.). For each discretized data point (here after referred to as a “cell”), there are 3 values that we had FUNWAVE calculate:
-
U and V: Cross-shore and against-shore velocities (respectively);
-
Eta: The spatio-temporal instantaneous water level oscillating around the still-water level; these values can be positive (peak) or negative (trough).
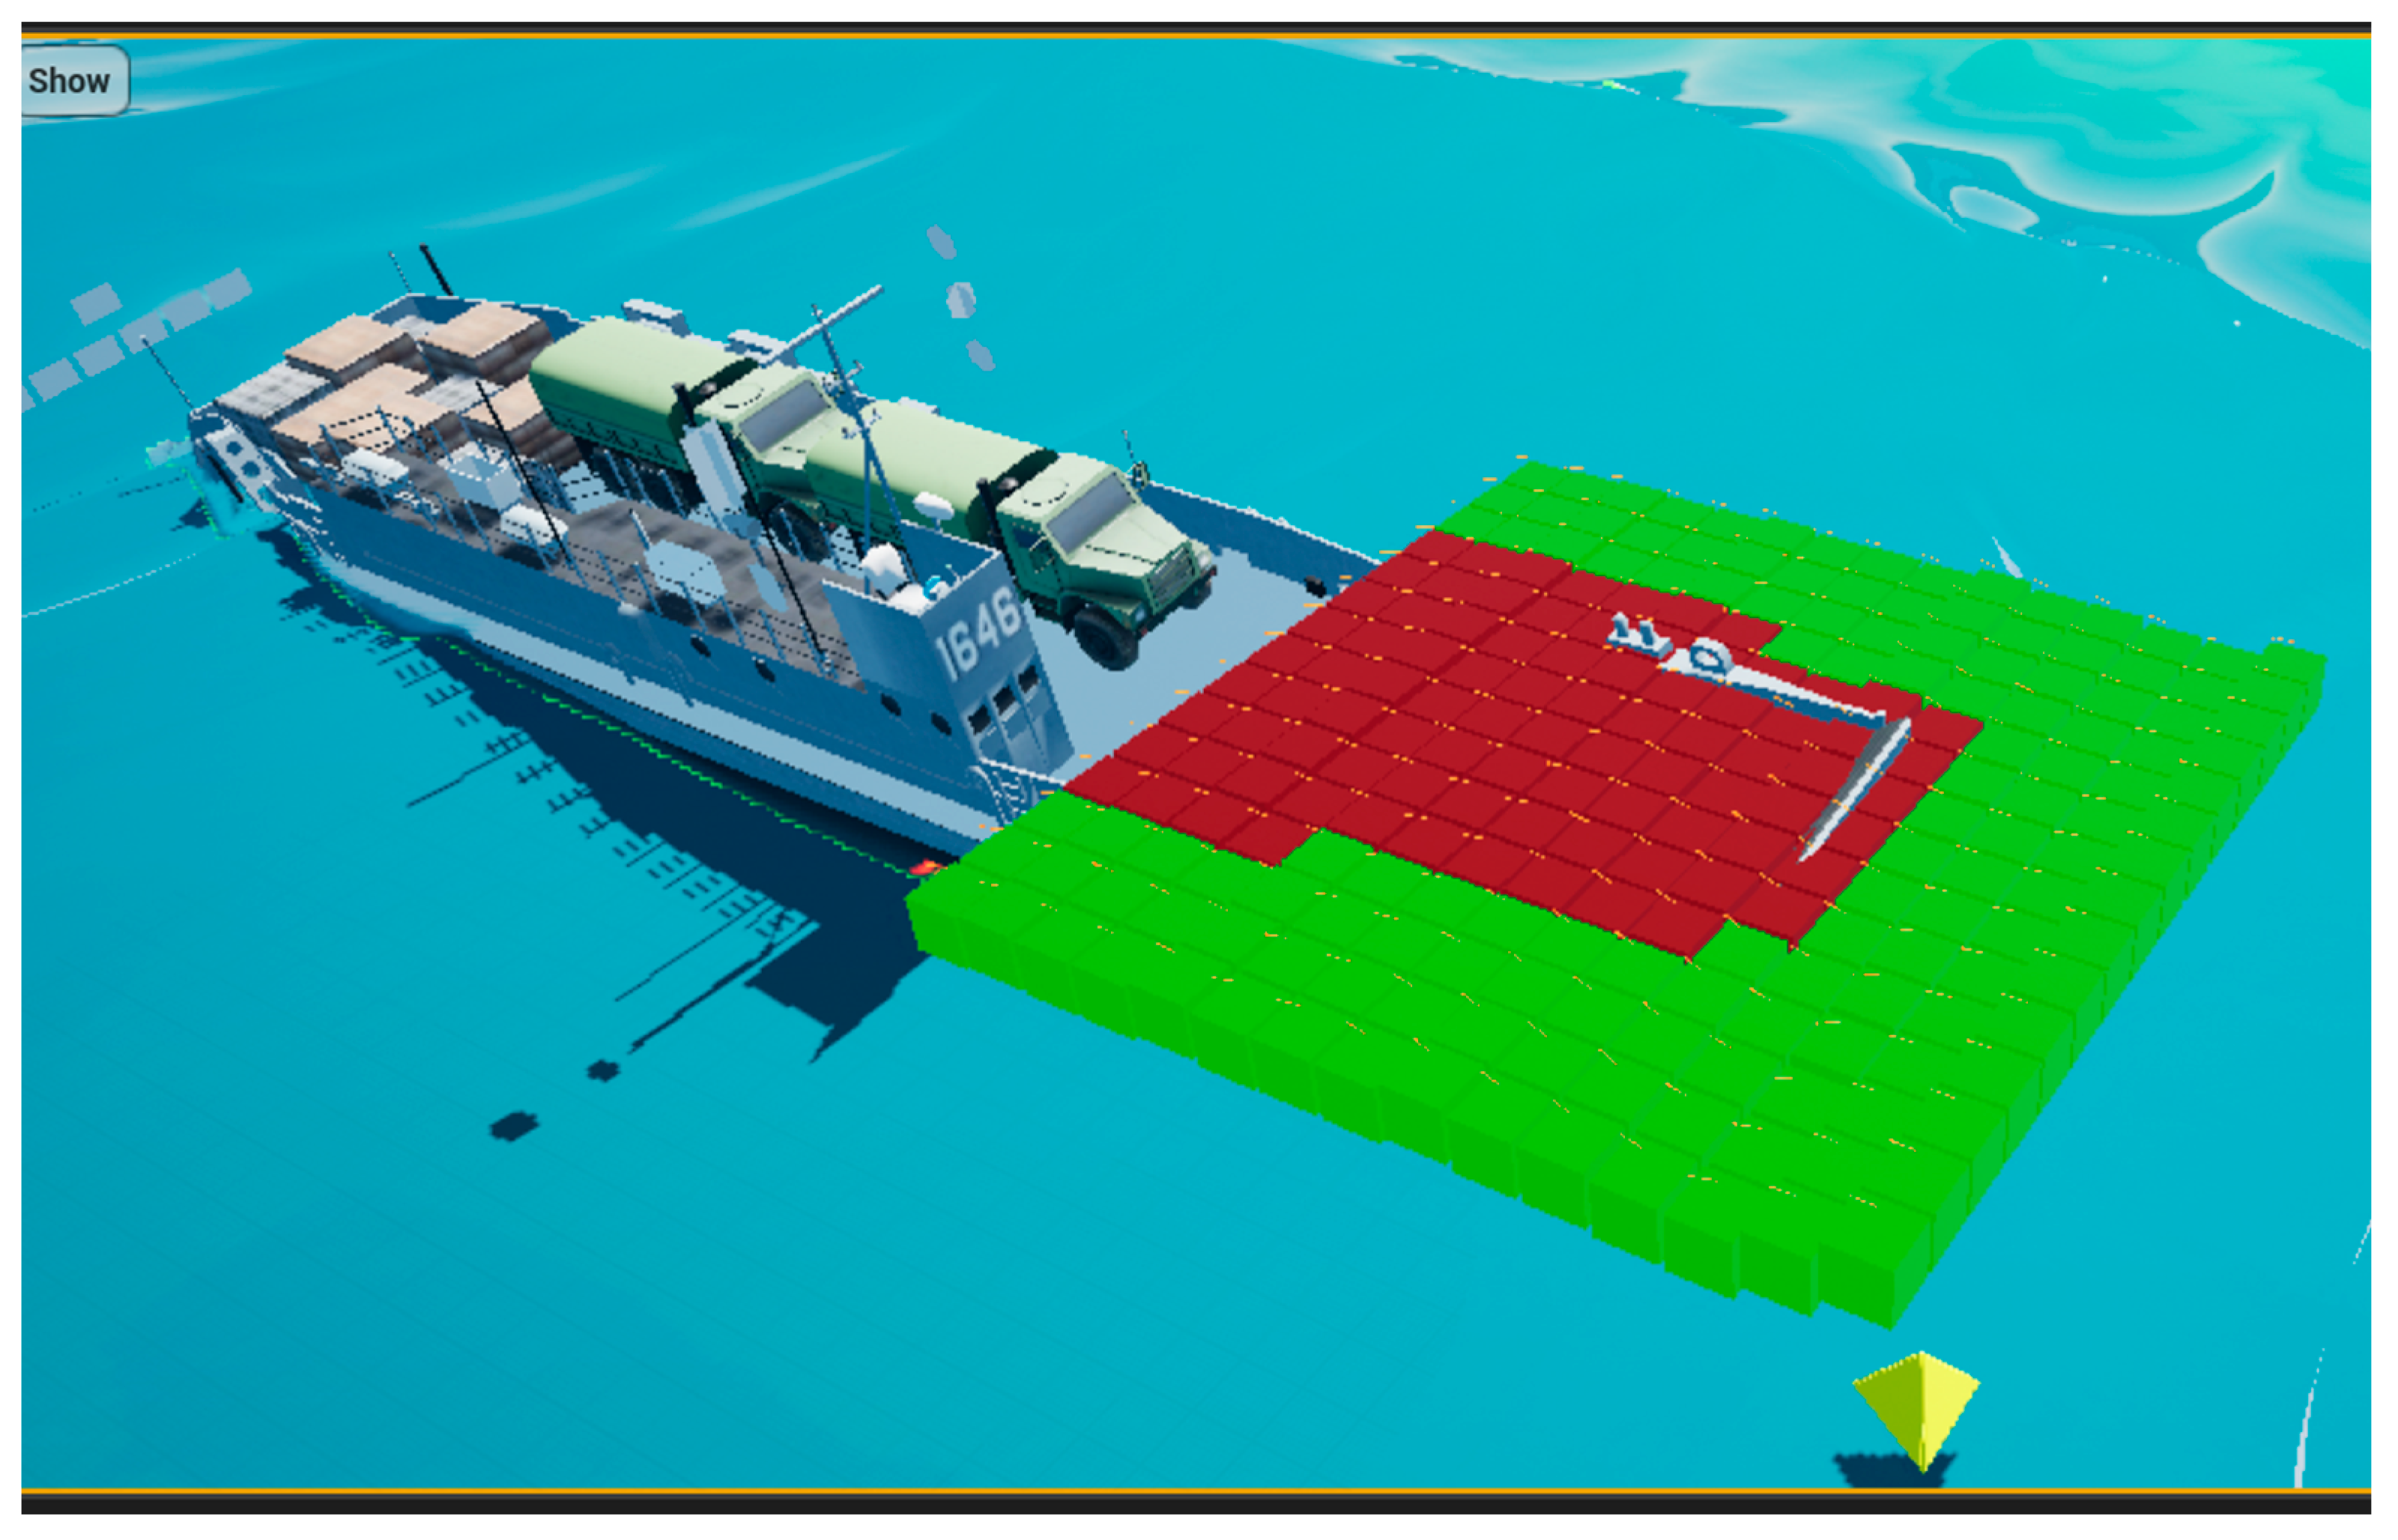
To render the simulation results of the littoral zone, a colored spatial grid was designed from the FUNWAVE data (Figure 8). Each colored cube represents one point in the FUNWAVE grid. Each cube represents a “u, v, eta” point, which will later be revised to be animated water in a future work. Red colored cubes represent the area where the ship is colliding with a FUNWAVE cell, illustrating how littoral waves affect the hydrodynamics of the ship, and vice versa. Data were accessed from each row in the DataTable, which consisted of three columns (u, v, eta) for each row. Each row represents a single time series point from FUNWAVE. Our Blueprint script iterated through the DataTable grabbed each row and assigned that to each cube.
The arrows on top of the cells indicate the direction in which they are pushing. The red cells are currently overlapping and pushing the ship, and as they come in and out, they will subscribe or unsubscribe themselves from the boat. The values can be adjusted on the side, such as the number of rows, columns, and the size of individual cells. These adjustments can be made prior to runtime, and the values are pulled from a DataTable generated from FUNWAVE that has the u, v, and eta columns, all stored in this data structure as floats.
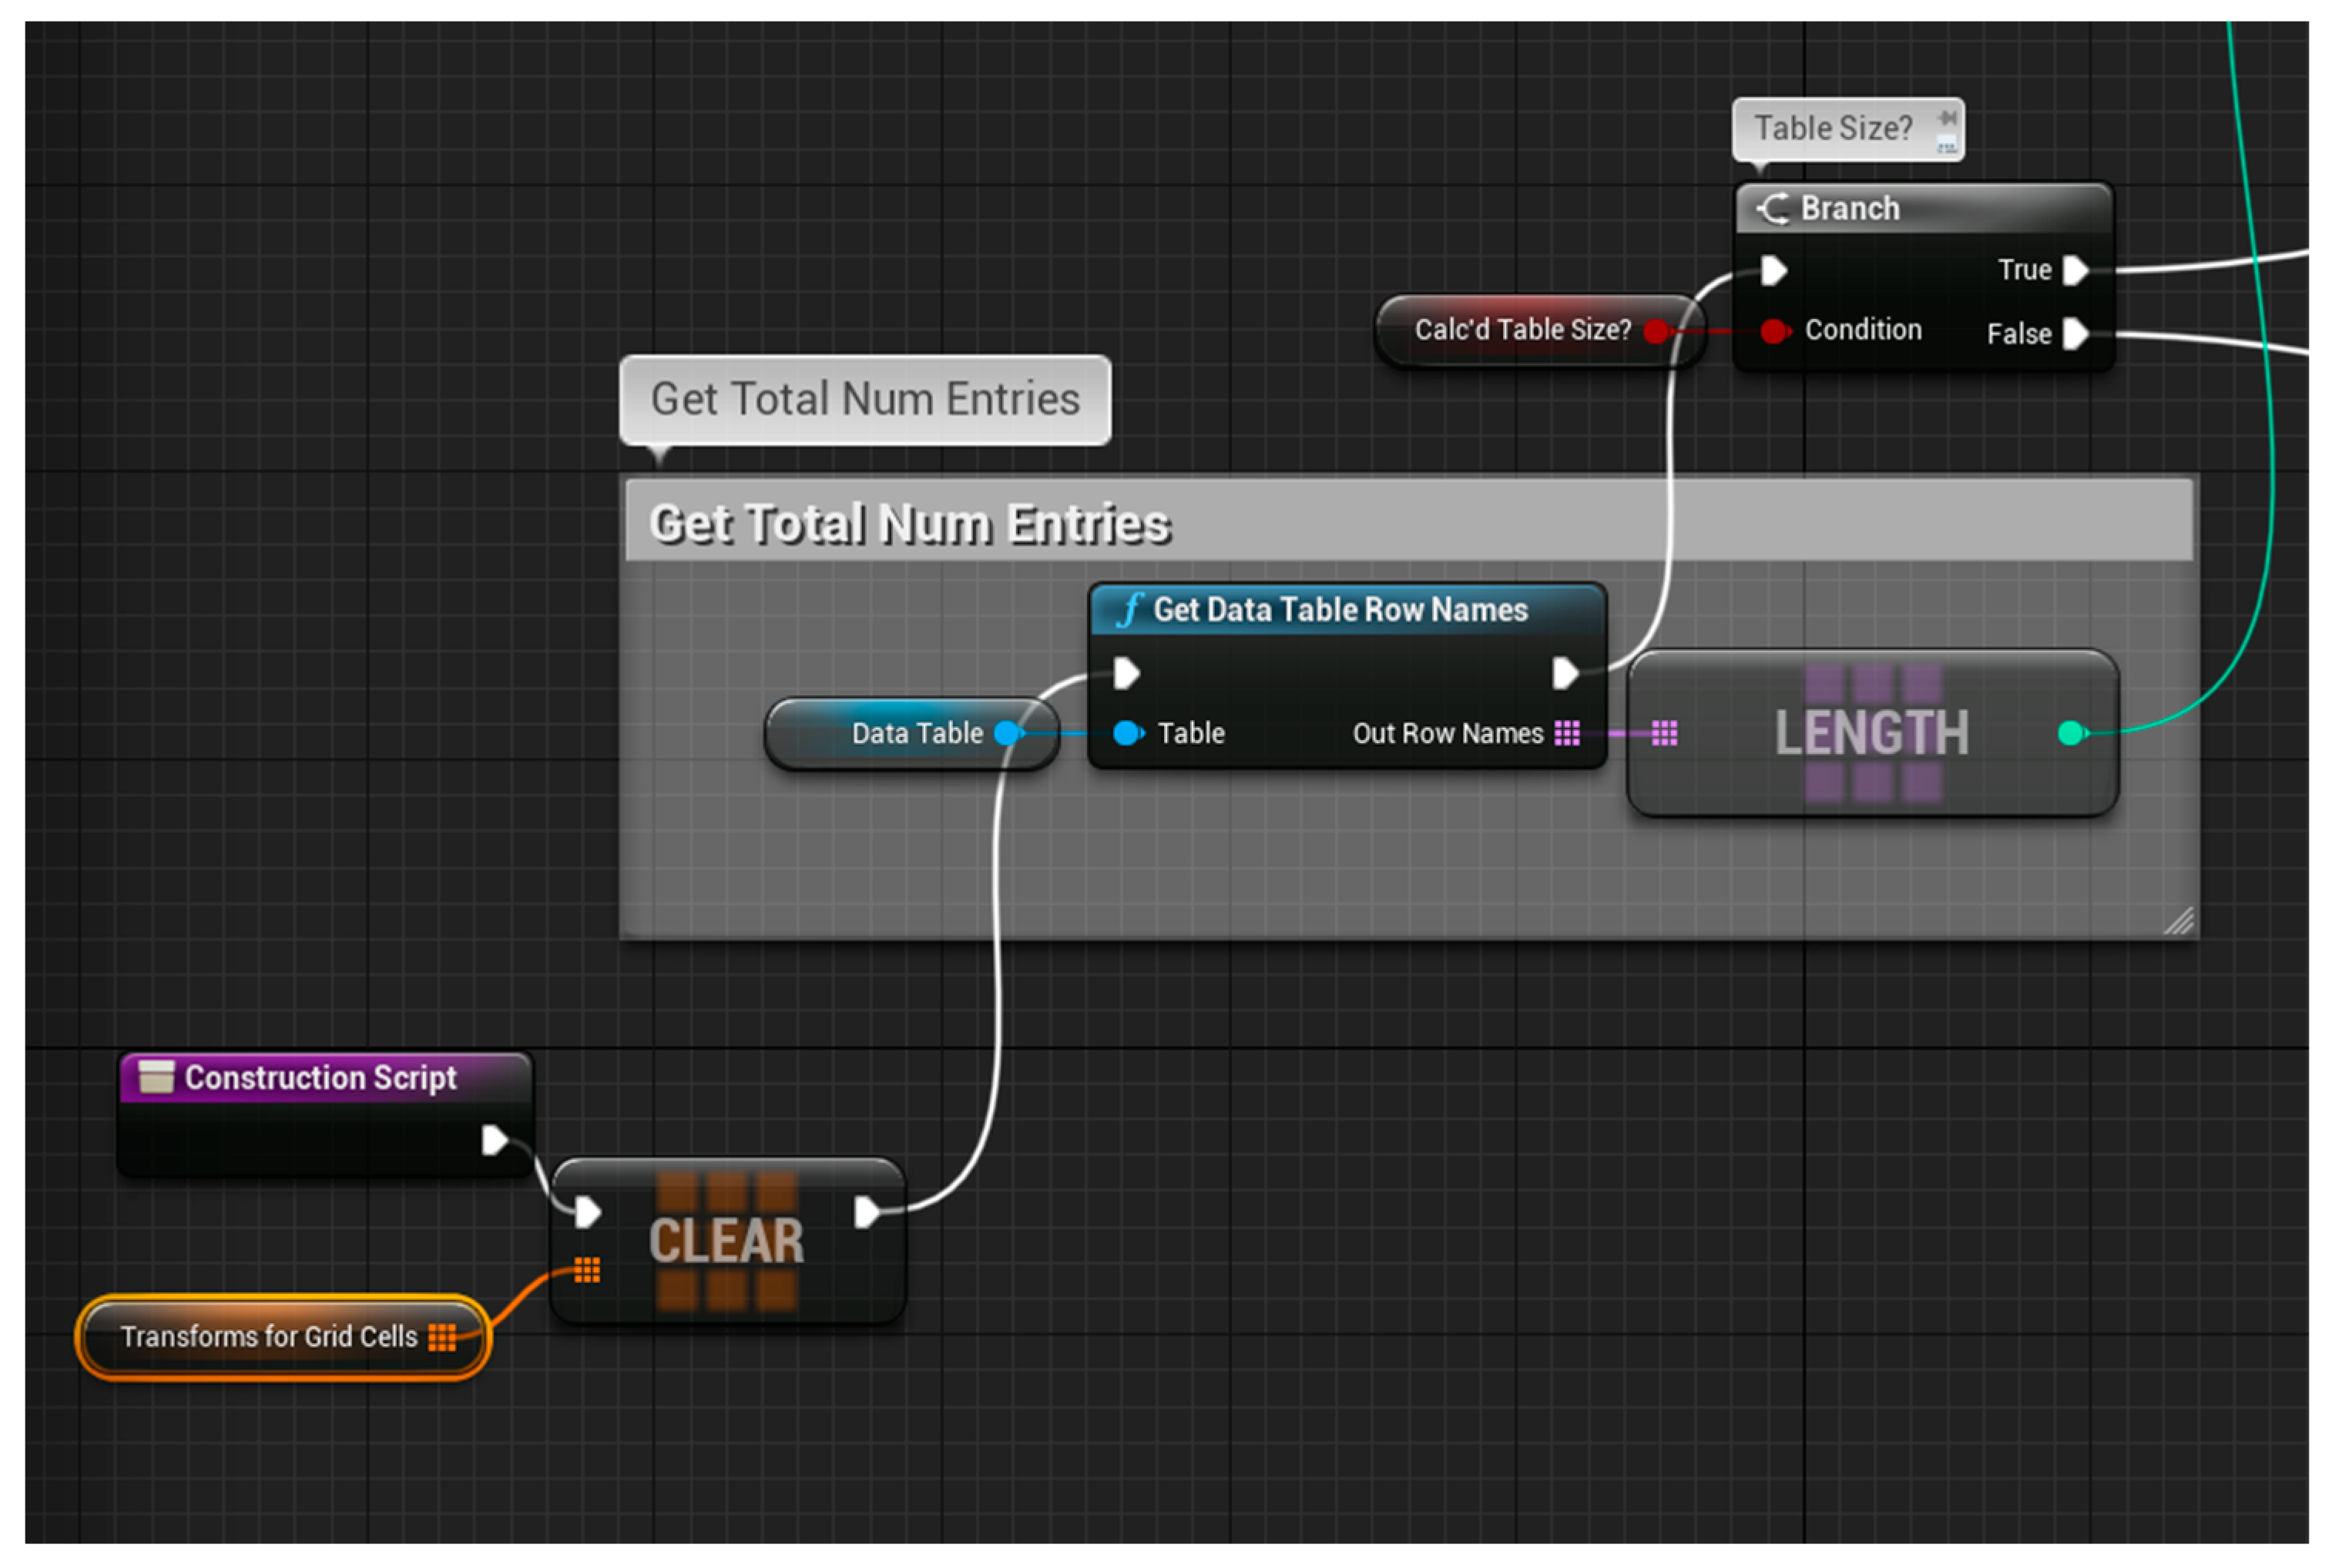
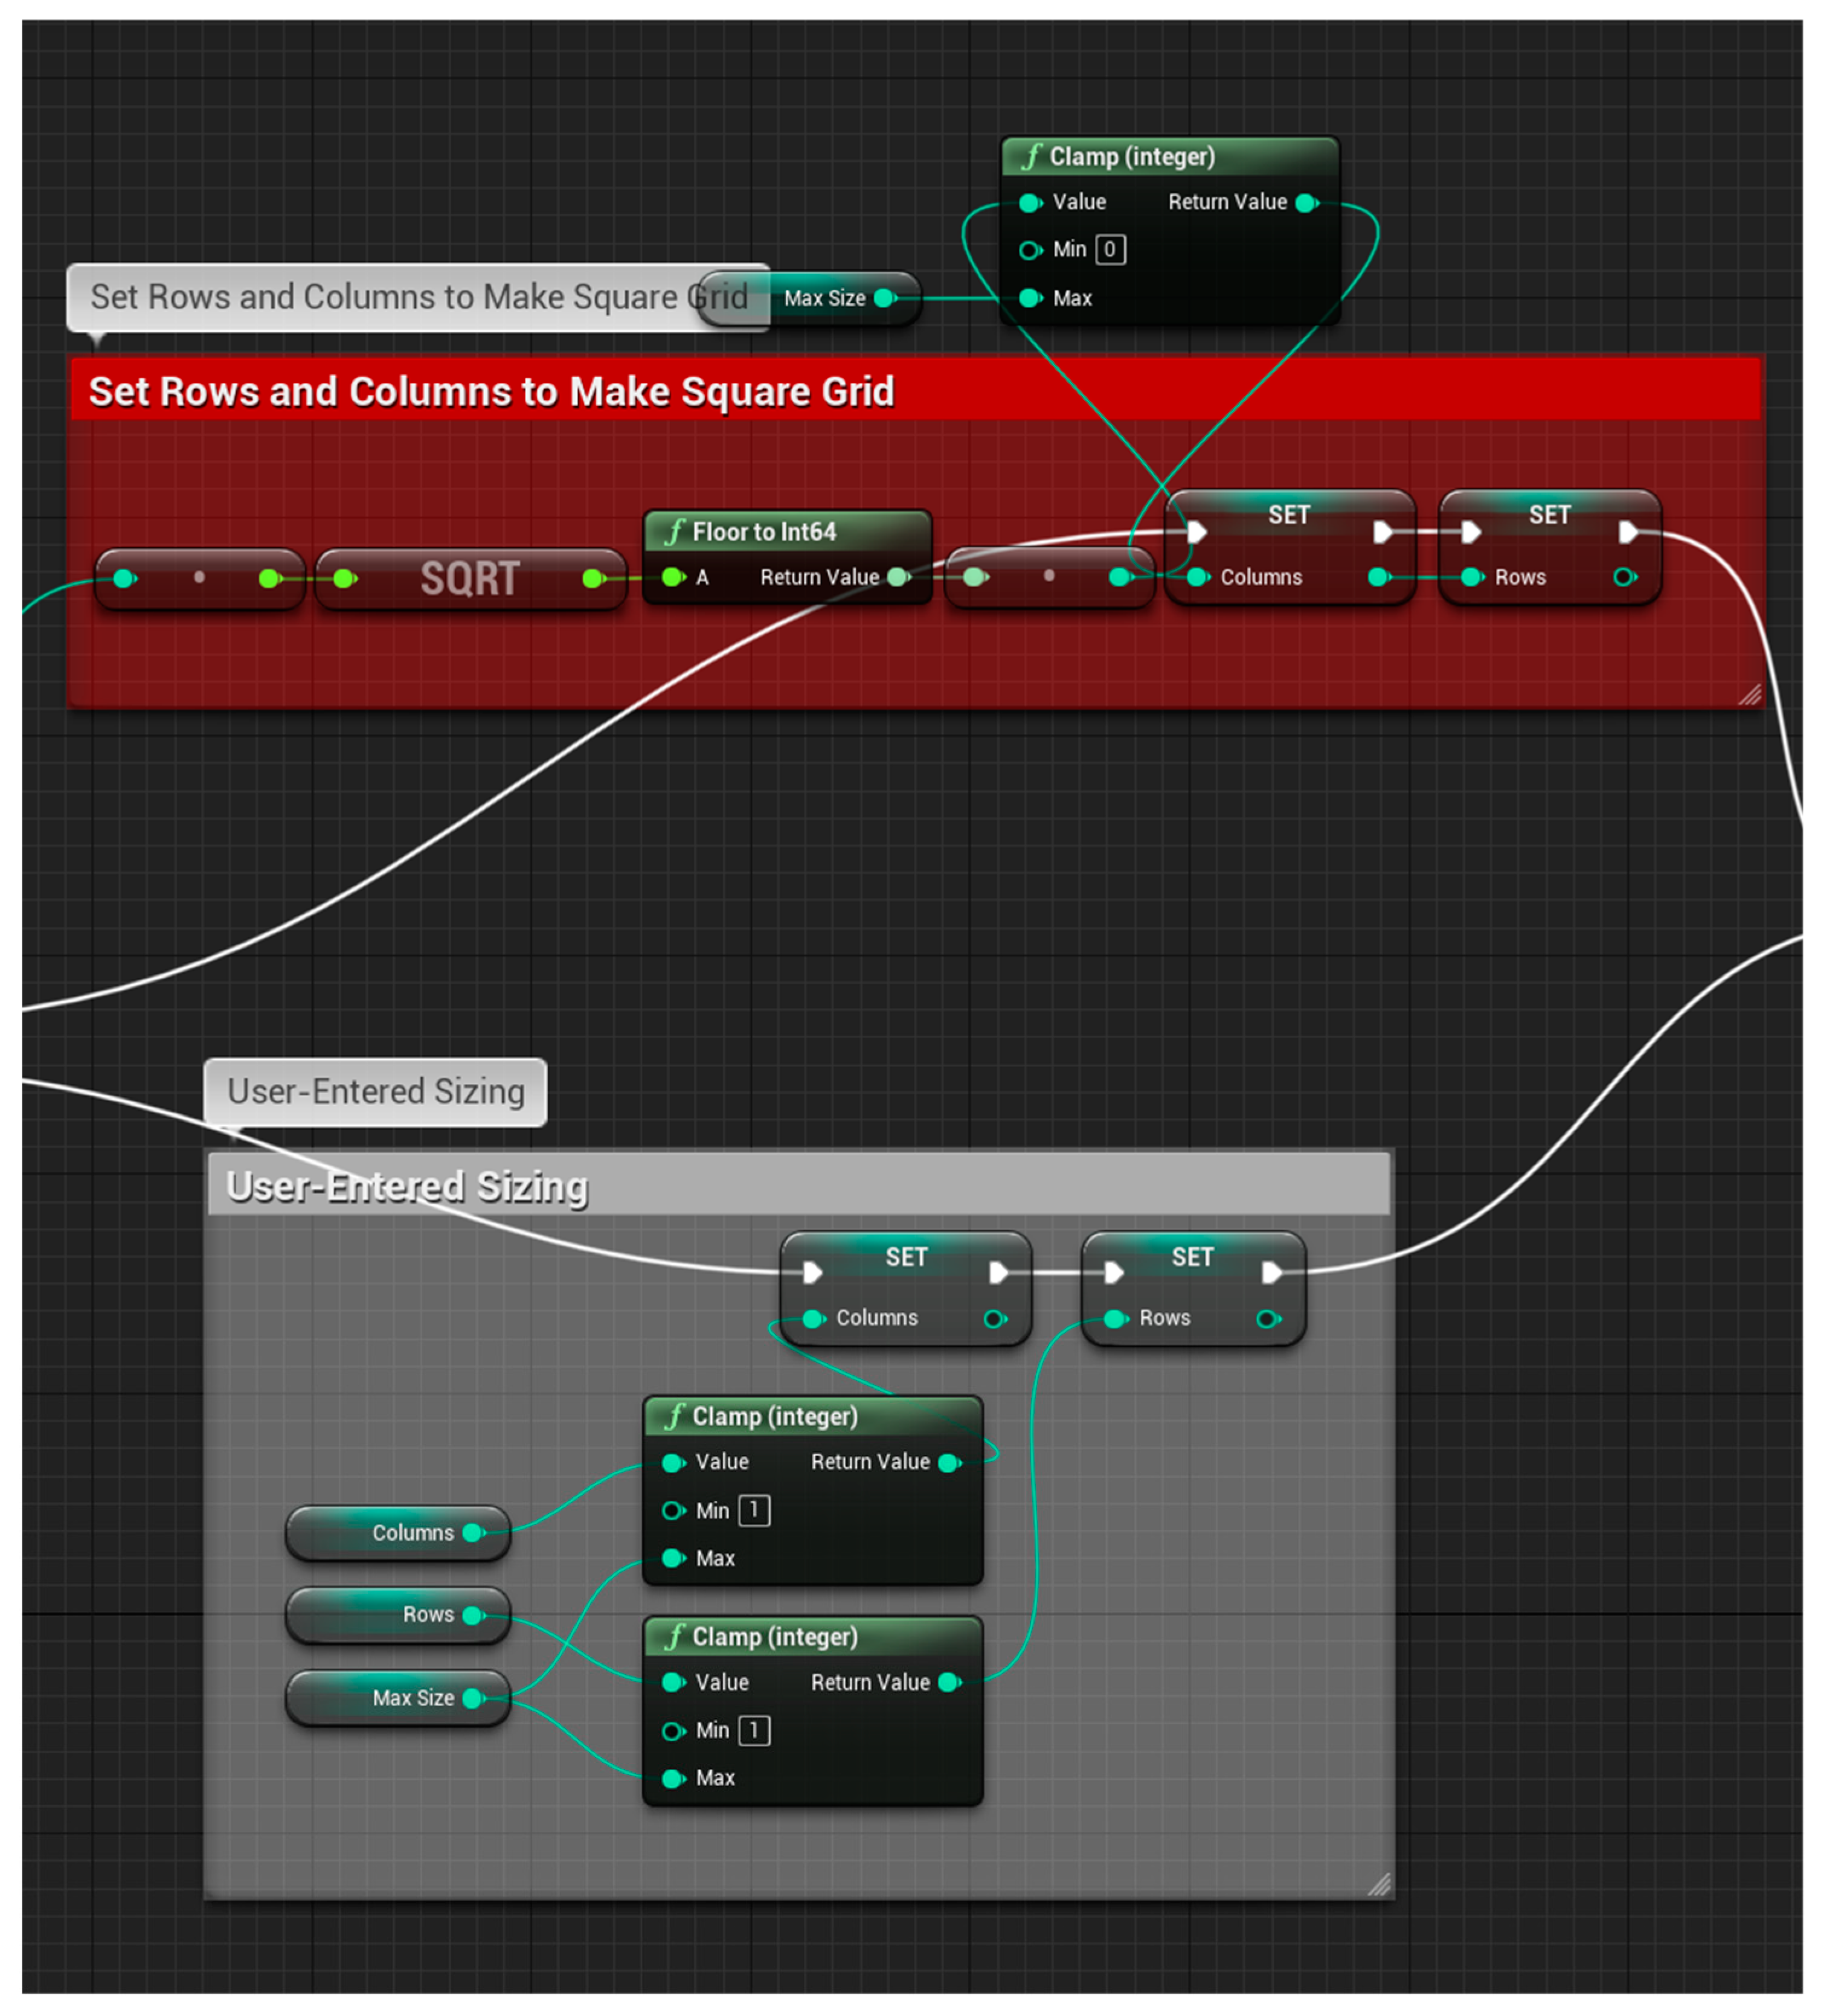
The wave tile spawning construction script keeps an array of transforms, which are spots in 3D space (Figure 9). It loops through the DataTable and creates a square grid for those transforms (Figure 10). For each transform, it stores the three values from the DataTable in an array, loops over them by rows and columns, and sets those transforms equal to those values plus the offset from the starting location (Figure 11). The individual grid cells are represented by green blocks that turn red when they overlap. They possess a force vector, which tells the ship to keep track of them when they begin overlapping and to stop keeping track of them when they stop overlapping. The following figures are snippets of code written with Unreal Engine Blueprints.
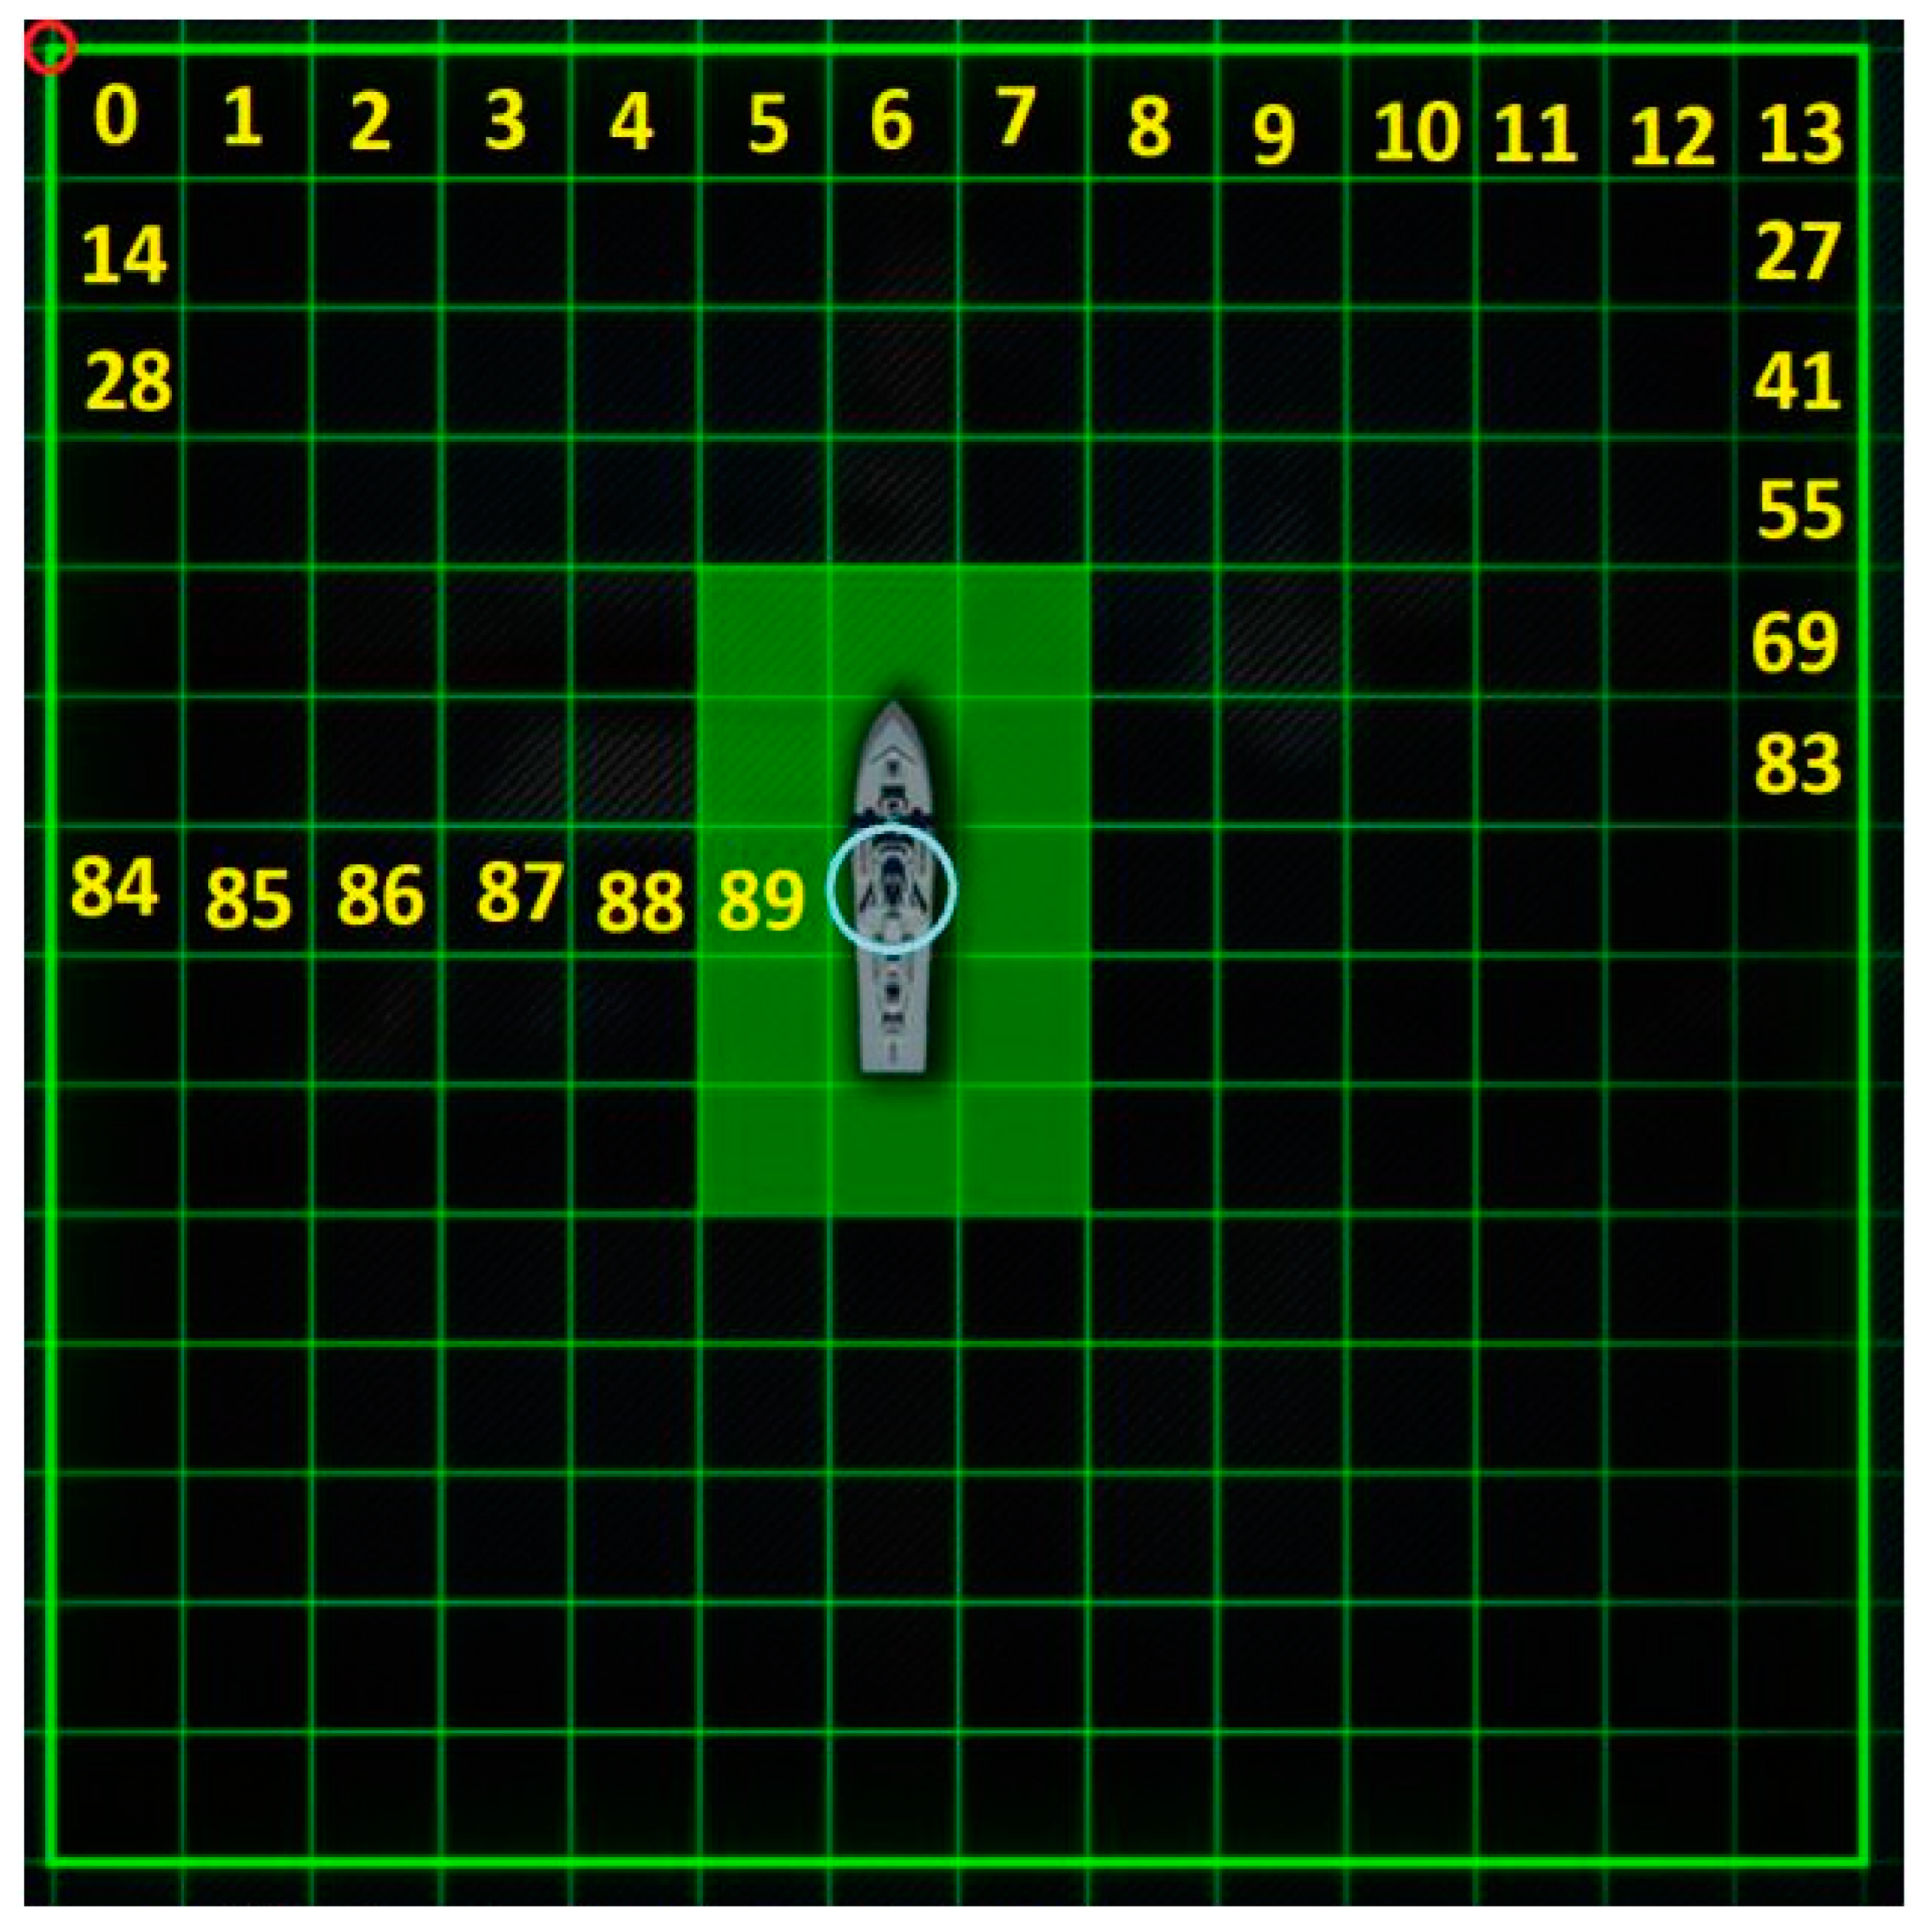
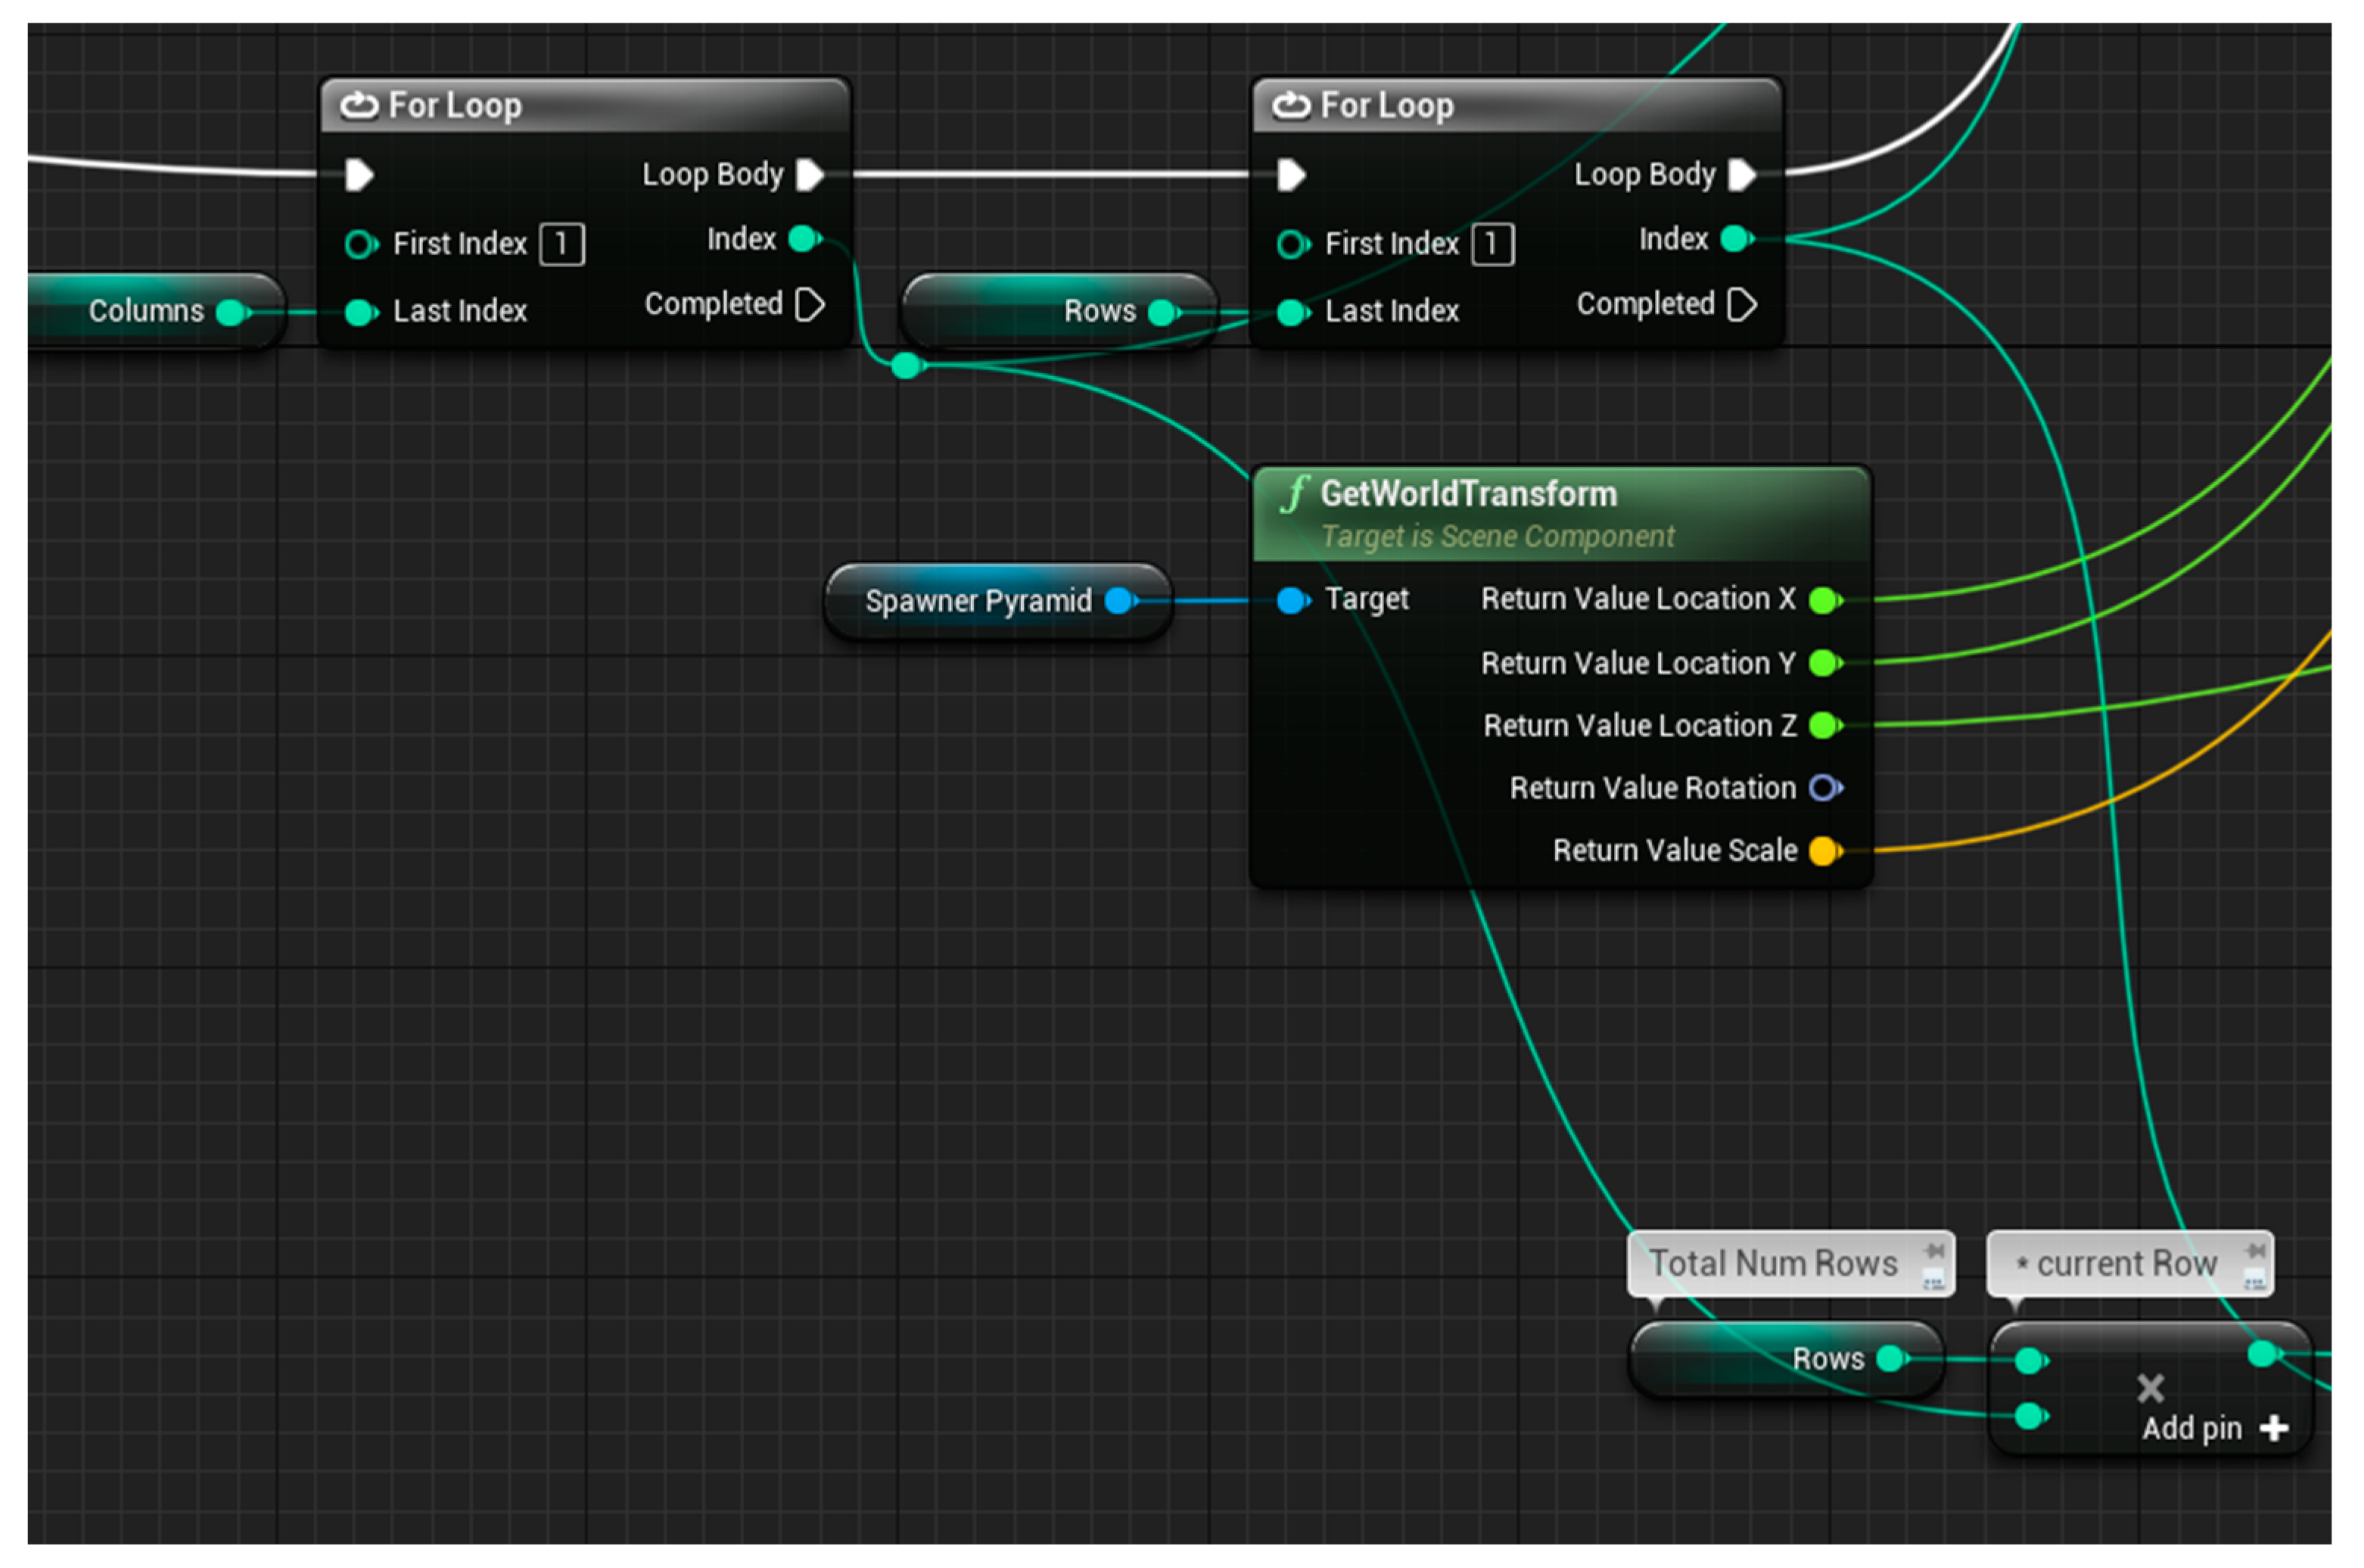
A Battleship-style board is used to illustrate the following example (Figure 12). The entire grid is too dense to load into memory at runtime, so we loaded a subset of those data, with a 1 cell radius around the vessel shown as highlighted areas. Because FUNWAVE’s output is indexed, we did not have to loop over the entire grid to find and load the values for these cells. Instead, we took the known location of the vessel in 3D space (which Unreal provides as a “Transform”). We then obtained the Transform for the top left corner of the entire grid (red circle). The difference between the grid corner’s location and the vessel’s location, divided by the size of each grid cell in meters, tells us how many “cells” are along X the vessel (Figure 13 and Figure 14).
(ShipXLocation − GridCornerXLocation)/CellSizeX = # of Cells on X
We used the same method to calculate how many cells away from the corner the ship is on Y.
(ShipYLocation − GridCornerYLocation)/CellSizeY = # of Cells on Y
The grid’s maximum dimensions in X and Y are known. So, given an (X:Y) grid, we calculated the index (the yellow number) of the cell directly under the center of the vessel (the blue circle). In this example, the center of the ship is on G7 (rows in Battleship start at 1, not 0). If we replace “G”, the column of that cell would also be 7 (on a Battleship board). The grid shown is 14 columns wide. So, each row is indexed as (0–13), (14–27), etc. See the yellow numbers (arrays in C++ start at 0, not 1). We know the center of the ship (blue circle) is on the 7th row of the grid, as well as the 7th column.
To calculate the index of this cell (the yellow number), we used the following formula:
{[ColumnWidth ∗ (RowNum-1)] − 1} + ColumnNum
{[ColumnWidth ∗ (RowNum-1)] − 1}
This portion accounts for all of the indexes of each “full” row above the target cell. It puts us on the correct “line”/row. We subtracted 1 from the RowNum so it did not count the row we were on as a full row (because we were not all the way to the right). We then subtracted 1 from the multiplied value to account for the fact that indexes in C++ arrays start at 0, and not 1. Rather than looping through the previous 90 cells and performing a calculation for each one to check if it was correct, we simply looked up the values for the cell at index 90. This changed the time complexity from O(n) to O(1), which is important due to FUNWAVE’s grid being millions of cells in length. Our array lookup had a check based on the grid’s dimensions to prevent wrapping (when the ship was at the grid’s edge). In our code, this radius of loaded cells is dynamic. The user can enter how large of a radius they would like to load. This process enabled us to represent the ingested FUNWAVE data to our ability at this point.
Further exploration of data representation will allow us to render the grid in a more realistic way that represents water waves in a littoral zone. This is currently being studied and will be presented in a future work. The purpose of this technique was to show how the highly accurate FUNWAVE output could be ingested in an immersive environment. Reading the physics data is a crucial process toward combining these systems. Through the approach of hybridization, we outlined above that each data point could be integrated into the VR immersive system.

4. Results

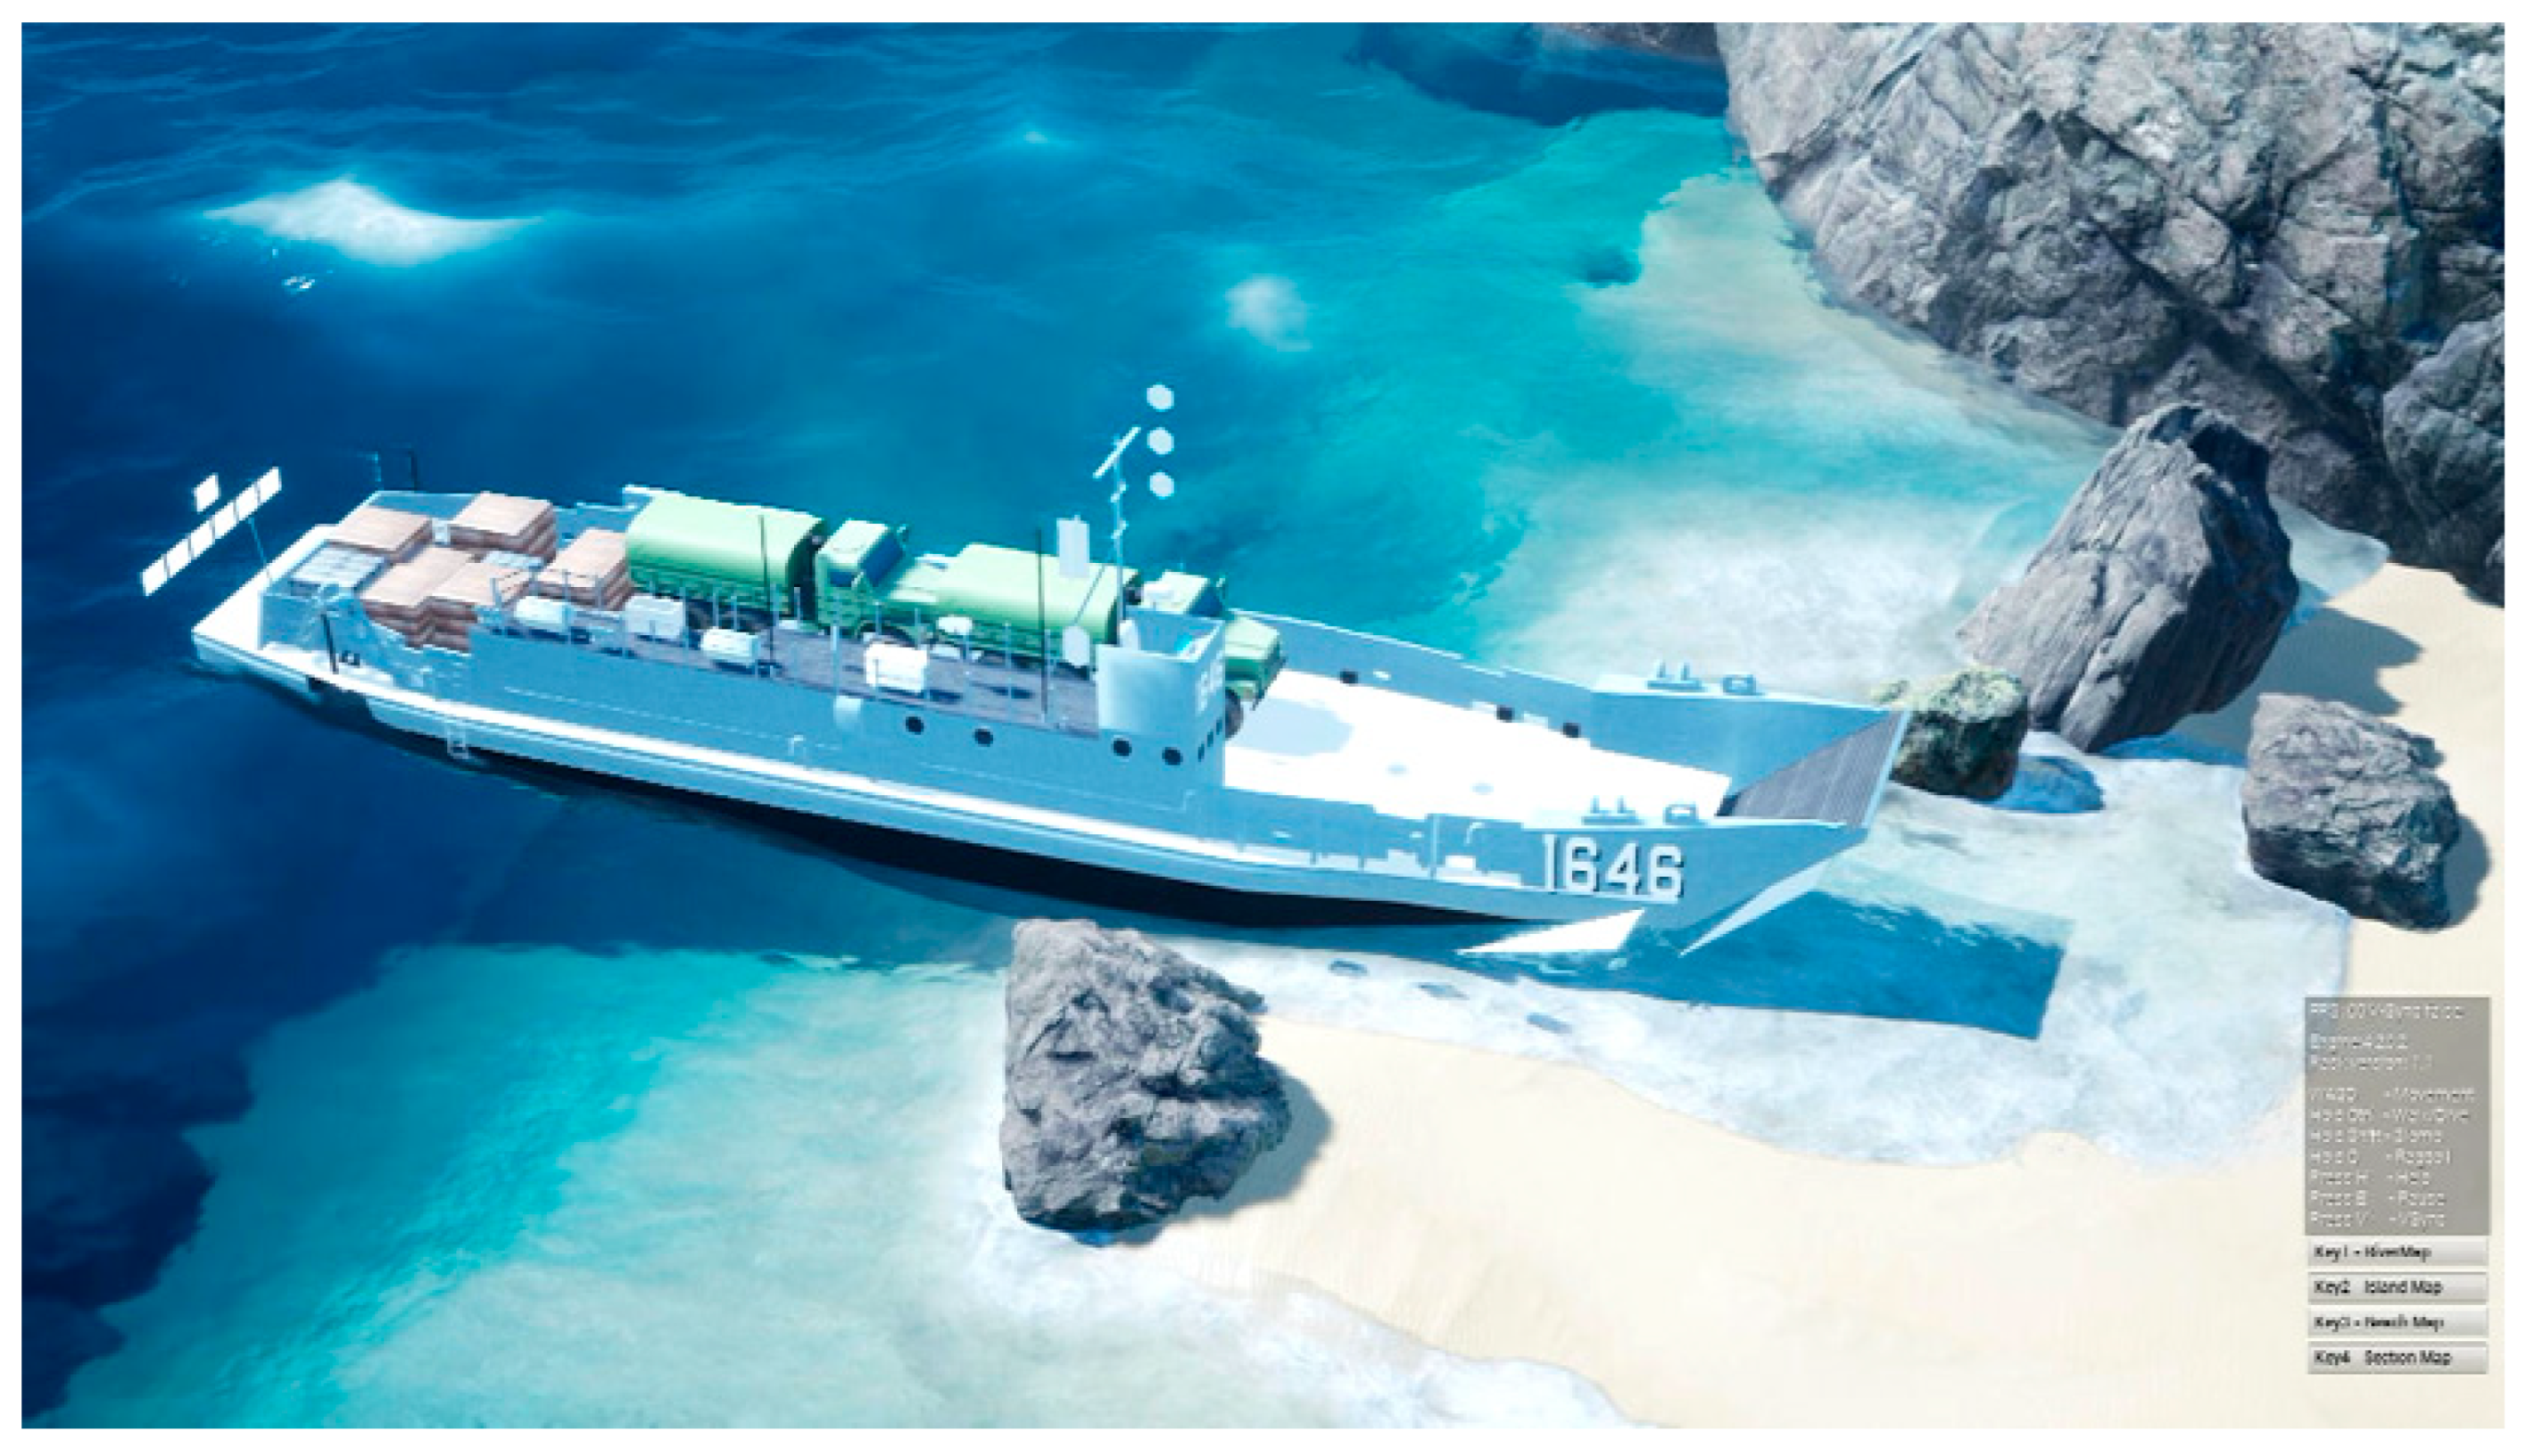
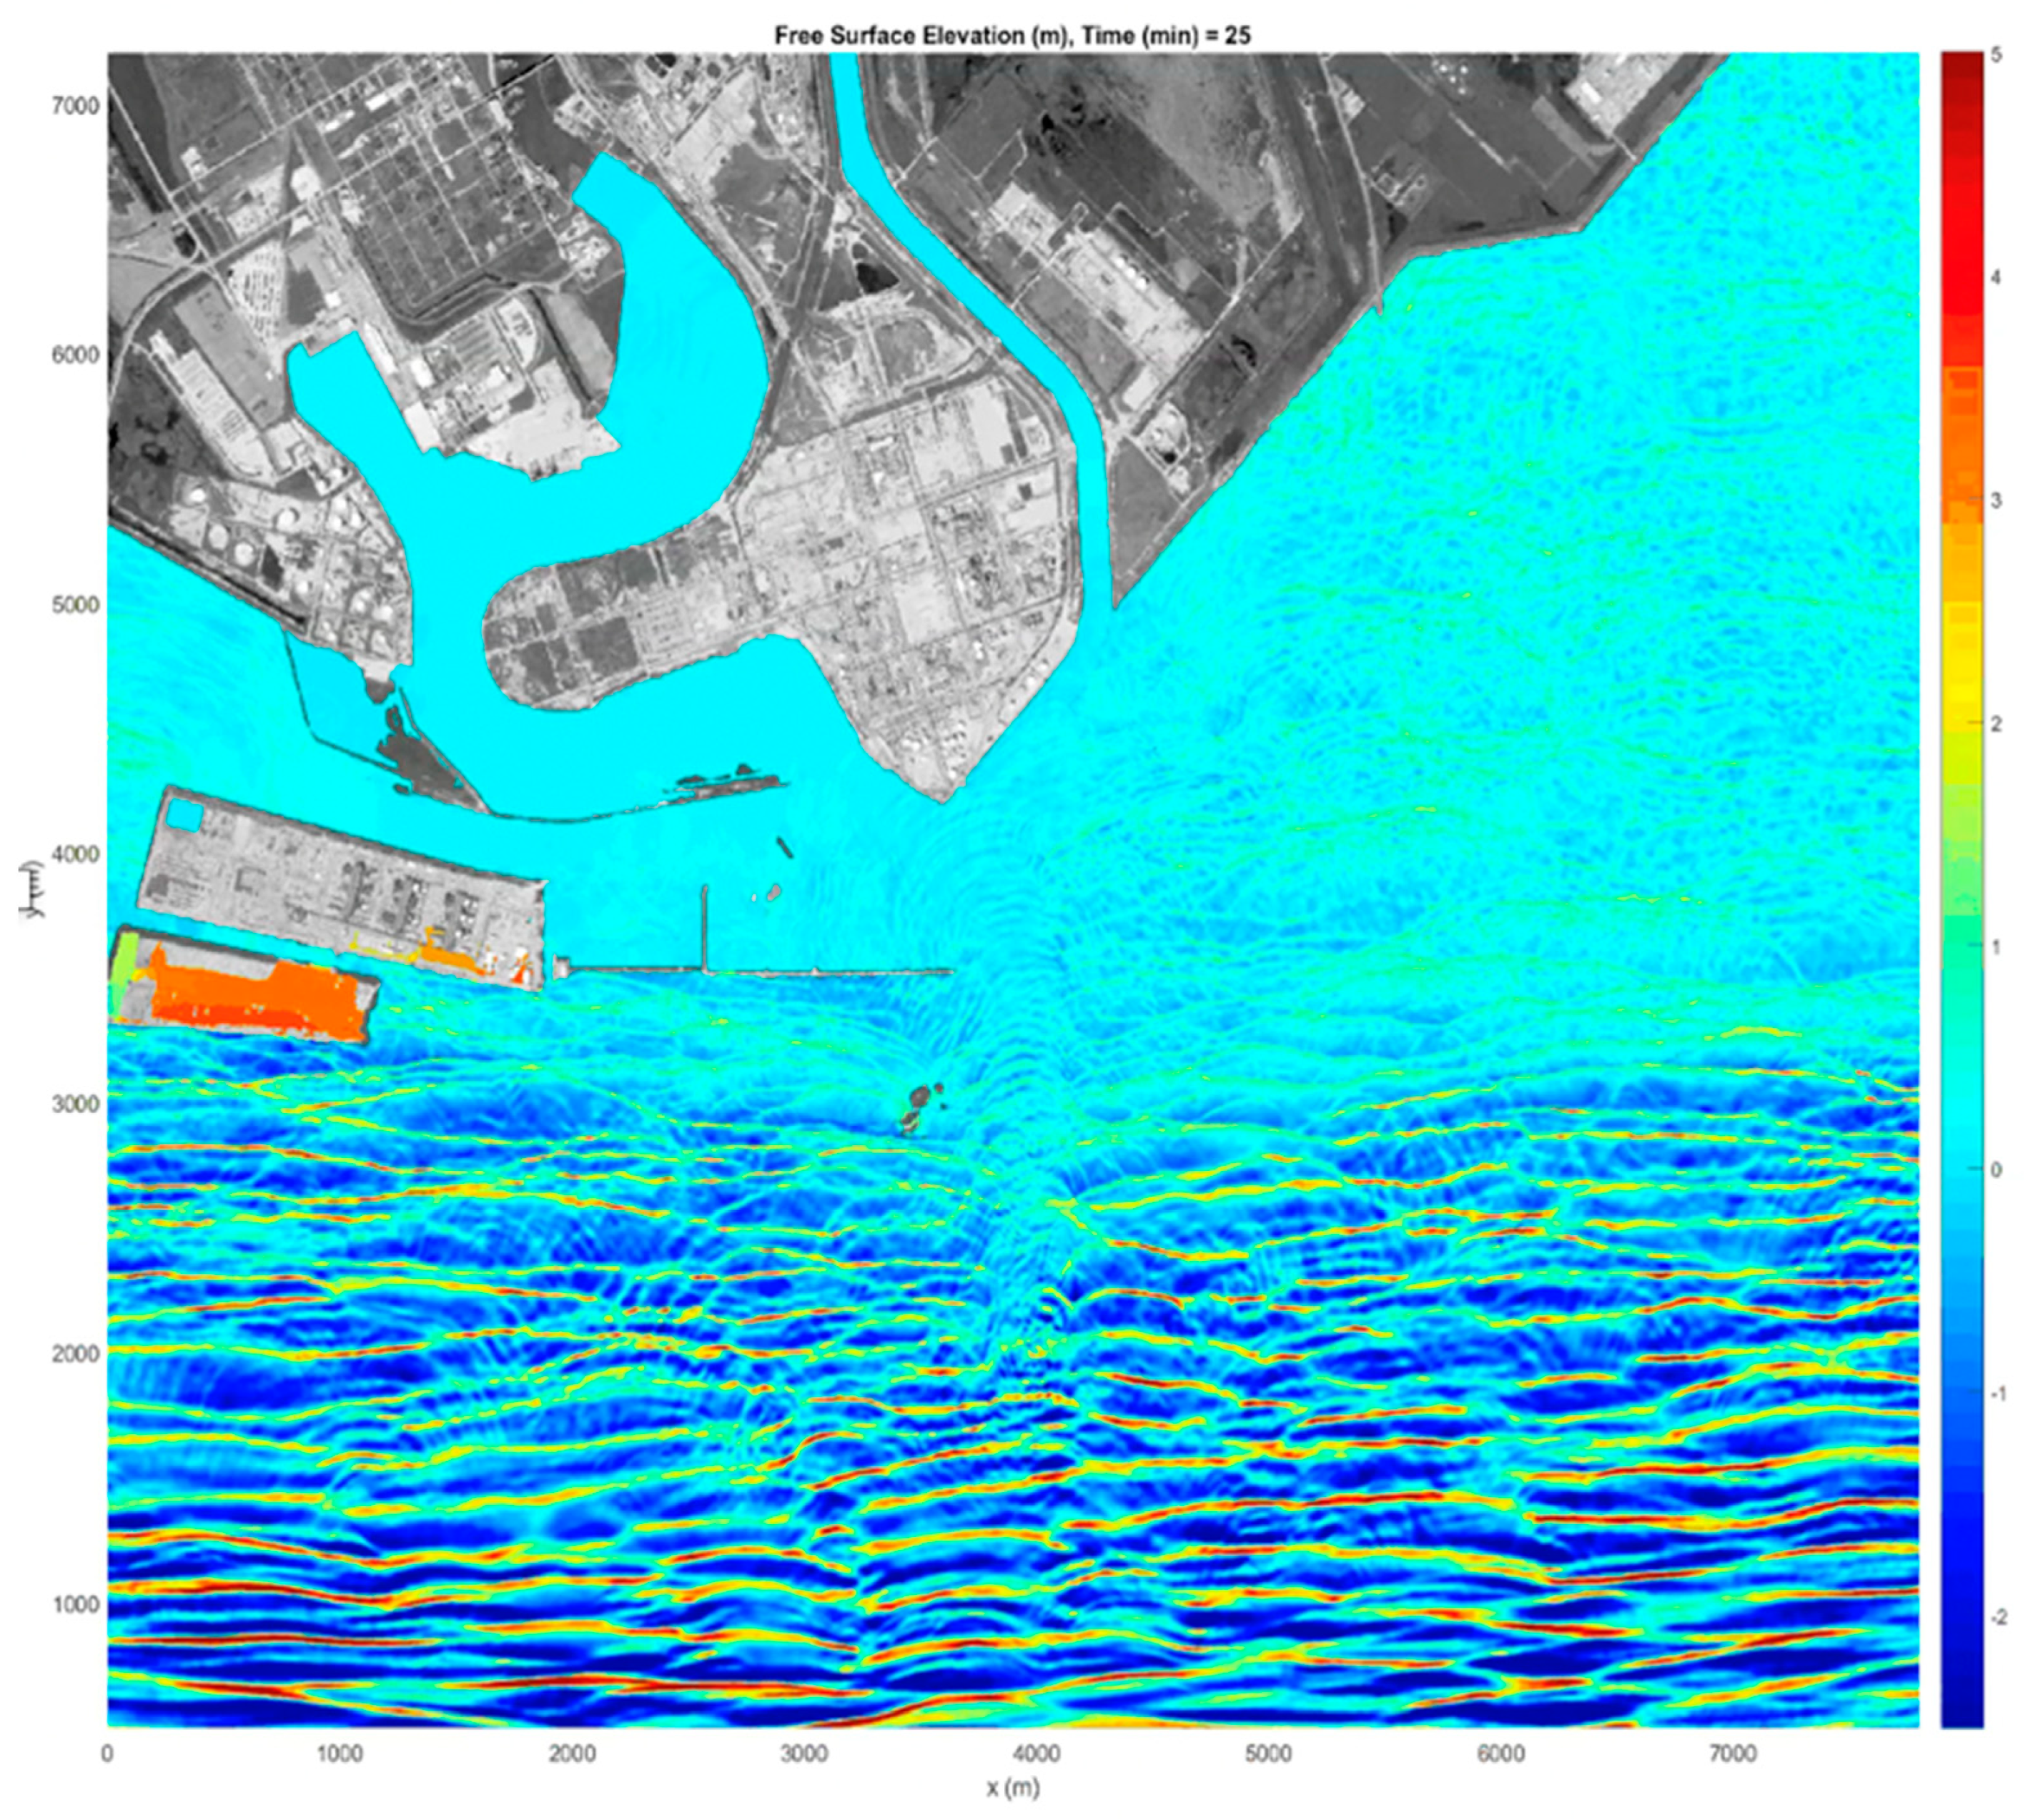
The integration of FUNWAVE numerical modeling data was successfully integrated into a VR simulation, showing that highly accurate physics from numerical modeling can be incorporated. Although FUNWAVE data can be visualized via plotting, they have yet to be visualized in 3D, much less in virtual reality. Our final Unreal application shows our results of a hybrid methodology. In Figure 15, we can see the final visualization of our virtual watercraft simulation performing a beach landing. We also included the native FUNWAVE-generated results for comparison (Figure 16). These figures show that FUNWAVE’s plot using Python can show more detail in the physics accuracy of the wave movements, but it lacks an immersive ability due to the nature of it being two-dimensional. A similar visualization can be rendered in 3D virtual reality in Unreal Engine, with integrated FUNWAVE data, greatly enhancing the physics accuracy of near-shore waves. Only a subset of the millions of data points was used due to being too computationally heavy, which resulted in lesser accuracy. Because FUNWAVE is run on a high-performance computer, this enables a high level of accuracy. We summarize the comparison in Table 3.
The hybrid prototype we developed demonstrates the ability to ingest physics-based output from computational modelers into a VR watercraft simulation running at 70 frames per second. We developed a framework to further explore this concept of physics data ingestion into VR development platforms for more immersive and scientifically accurate virtual experiences. Our current effort takes in FUNWAVE numerical output in the form of floating point numbers and ingests it into an Unreal Engine VR environment.

5. Discussion and Future Work

This project shows the potential of watercraft simulation advancement and the implications of adding valuable hydrodynamic numerical model data. By adding near-shore wave data through FUNWAVE simulation, LCU operators have a more accurate simulation that could potentially save soldiers’ lives through more informed decisions relating to watercraft operation in littoral environments. Coupling our prototype with high-fidelity hydrodynamic numerical modeling within a VR environment provides a means to enhance ship survivability in operational deployments. Another direction could be for autonomous robotic ships that also operate in the littoral zones. Simulations for those systems could potentially save costs by providing a safer means of testing.
Future work should include upgrading to Unreal Engine 5 and should offer added functionality, better physics, and graphics capability. Reading in HDF5 and binary output directly into Unreal via C++ classes is currently being researched and could provide a faster ingestion method. A potential issue will be ingesting millions of numbers in parallel as opposed to a slow sequential reading function. Blueprints were primarily used for this project, but the use of C++ will be further explored for greater functionality. Additionally, this work focused on using FUNWAVE as a phase-resolved near-shore wave model, and the framework was built around the FUNWAVE HDF5 binary output. Celeris could provide a Unity implementation for highly accurate and immersive visualization [39]. There are a number of other phase-resolved wave models that can be used to generate the same spatial output (u, v, and eta, each as a function of time) including, but not limited to, SWASH [40], COULWAVE [41], and NHWAVE [42]. The framework can ingest these models with a simple conversion script between each of those native model outputs and the native HDF5 format can be used as an output from FUNWAVE.

6. Conclusions

The purpose of this research was to understand and integrate several systems toward an advanced watercraft simulator that is capable of physics-based water rendering. Hydrodynamic waves in VR have been limited to deep-water Gerstner waves and our application aims to incorporate near-shore wave models for more accuracy in wave rendering. In order to accomplish this, numerical modeler FUNWAVE data were ingested into Unreal Engine to supplement the native physics engine. The results show that this can be successfully achieved with the use of DataTables. Other methods are being explored, including reading in HDF5 and binary directly from output files without DataTables. Overall, the hybrid pieces of various data sources can come together for a comprehensive approach, creating a useful framework for further research in the field of game simulation using physics numerical models. This research will both accelerate development and facilitate the simulation, planning, and rehearsal of multi-domain operations by ensuring a seamless integration of sea- and land-based modeling and simulation tools to enable physics-based real-time accuracy and run-time efficiency.

Author Contributions

Conceptualization, G.S., K.M. and J.B.; methodology, K.E., K.S. and S.C.; software, K.S., K.E. and S.C.; validation, K.S., K.E., S.B. and S.C.; formal analysis K.S., K.E., S.B. and S.C.; investigation, G.S.; resources, G.S. and J.B.; data curation, K.S., K.E. and S.C.; writing—original draft preparation, K.E.; writing—review and editing, K.E., K.M., S.B. and S.C.; visualization, K.E. and K.S.; supervision, J.B.; project administration, G.S. and J.B.; funding acquisition, G.S. and J.B. All authors have read and agreed to the published version of the manuscript.

Funding

This research was funded by the U.S. Army Corps of Engineers, Engineering Research and Development Center Flex 4 Program and by the Coastal and Hydraulics Laboratory.

Institutional Review Board Statement

Not applicable.

Informed Consent Statement

Not applicable.

Data Availability Statement

The data presented in this study are available on request from the corresponding author. The data are not publicly available due to USACE ERDC security policy.

Acknowledgments

The authors would like to acknowledge the Engineering Research and Development Center, Coastal and Hydraulics Laboratory, and Information Technology Laboratory.

Conflicts of Interest

The authors declare no conflict of interest.

References

  1. Shi, F.; Kirby, J.T.; Harris, J.C.; Geiman, J.D.; Grilli, S.T. A high-order adaptive time-stepping tvd solver for boussinesq modeling of breaking waves and coastal inundation. Ocean Model. 2012, 43, 36–51. [Google Scholar] [CrossRef]
  2. Games, E. Rendering and Graphics, Physically Based, Unreal Engine 4 Documentation. Available online: https://docs.unrealengine.com/4.27/en-US/RenderingAndGraphics/Materials/PhysicallyBased/ (accessed on 1 August 2023).
  3. Games, E. Building Worlds, Light Propagation Volumes, Unreal Engine 4 Documentation. Available online: https://docs.unrealengine.com/4.27/en-US/BuildingWorlds/LightingAndShadows/LightPropagationVolumes/ (accessed on 1 August 2023).
  4. Games, E. Rendering and Graphics, Ray Tracing, Unreal Engine 4 Documentation. Available online: https://docs.unrealengine.com/4.27/en-US/RenderingAndGraphics/RayTracing/ (accessed on 1 August 2023).
  5. Games, E. Rendering and Graphics, Post Process Effects, Unreal Engine 4 Documentation. Available online: https://docs.unrealengine.com/4.27/en-US/RenderingAndGraphics/PostProcessEffects/ (accessed on 1 August 2023).
  6. Ni, S.; Liu, Z.; Cai, Y. Ship maneuverability-based simulation for ship navigation in collision situations. J. Mar. Sci. Eng. 2019, 7, 90. [Google Scholar] [CrossRef]
  7. Fang, M.; Tsai, K.; Fang, C. A simplified simulation model of ship navigation for safety and collision avoidance in heavy traffic areas. J. Navig. 2018, 71, 837–860. [Google Scholar] [CrossRef]
  8. Hewlett, J.C. Ship Navigation Simulation Study, Houston-Galveston Navigation Channels, Texas. Report 1, Houston Ship Channel, Bay Segment; U.S. Army Corps of Engineers: Washington, DC, USA; Waterways Experiment Station: Vicksburg, MS, USA, 1994.
  9. Yin, J.; Ren, H.; Zhou, Y. The whole ship simulation training platform based on virtual reality. IEEE Open J. Intell. Transp. Syst. 2021, 2, 207–215. [Google Scholar] [CrossRef]
  10. Lindberg, O.; Bingham, H.B.; Engsig-Karup, A.P.; Madsen, P.A. Towards real time simulation of ship-ship interaction. In Proceedings of the 27th International Workshop on Water Waves and Floating Bodies, Copenhagen, Denmark, 22–25 April 2012. [Google Scholar]
  11. Lee, Y.S.; Rashidi, A.; Talei, A.; Beh, H.J.; Rashidi, S. A Comparison Study on the Learning Effectiveness of Construction Training Scenarios in a Virtual Reality Environment. Virtual Worlds 2023, 2, 36–52. [Google Scholar] [CrossRef]
  12. Qi, J.; Tang, H.; Zhu, Z. Exploring an Affective and Responsive Virtual Environment to Improve Remote Learning. Virtual Worlds 2023, 2, 53–74. [Google Scholar] [CrossRef]
  13. Ueng, S.; Lin, D.; Liu, C. A ship motion simulation system. Virtual Real. 2008, 12, 65–76. [Google Scholar] [CrossRef]
  14. Chen, C.; Shiotani, S.; Sasa, K. Numerical ship navigation based on weather and ocean simulation. Ocean. Eng. 2013, 69, 44–53. [Google Scholar] [CrossRef]
  15. Tai, T.C.; Carico, D. Simulation of dd-963 ship airwake by navier-stokes method. J. Aircr. 1995, 32, 1399–1401. [Google Scholar] [CrossRef]
  16. Fournier, A.; Reeves, W.T. A simple model of ocean waves. In Proceedings of the 13th Annual Conference on Computer Graphics and Interactive Techniques, Philadelphia, PA, USA, 14–16 July 1986; pp. 75–84. [Google Scholar]
  17. Tessendorf, J. Simulating ocean water. Simulating nature: Realistic and interactive techniques. SIGGRAPH 2001, 1, 5. [Google Scholar]
  18. Zhang, W.; Zhang, J.; Zhang, T. Fast simulation method for ocean wave base on ocean wave spectrum and improved gerstner model with gpu. J. Phys. Conf. Ser. 2017, 787, 012027. [Google Scholar] [CrossRef]
  19. Xu, J.; Gu, H.; Kang, F.; Yang, H.; Wang, S. Modeling and simulation of nearshore waves. AsiaSim 2012, 323, 358–364. [Google Scholar]
  20. Mihalef, V.; Metaxas, D.; Sussman, M. Animation and control of breaking waves. In Proceedings of the 2004 ACM SIGGRAPH/Eurographics Symposium on Computer Animation, Grenoble, France, 27–29 August 2004; pp. 315–324. [Google Scholar]
  21. Chen, J.; Yang, K.; Yuan, Y.; Wang, C. Visual simulation of breaking waves in shallow water. In Proceedings of the 2009 First International Workshop on Education Technology and Computer Science, Wuhan, China, 7–8 March 2009; IEEE: New York, NY, USA, 2009; Volume 2, pp. 246–249. [Google Scholar]
  22. Takahashi, T.; Fujii, H.; Kunimatsu, A.; Hiwada, K.; Saito, T.; Tanaka, K.; Ueki, H. Realistic animation of fluid with splash and foam. In Computer Graphics Forum; Wiley Online Library: Hoboken, NJ, USA, 2003; Volume 22, pp. 391–400. [Google Scholar]
  23. Yingst, M.; Alford, J.R.; Parberry, I. Very fast real-time ocean wave foam rendering using halftoning. In Proceedings of the 6th International North American Conference on Intelligent Games and Simulation (GAMEONNA); 2011; pp. 27–34. Available online: https://ianparberry.com/pubs/GAMEON-NA_GRAPH_04.pdf (accessed on 1 August 2023).
  24. Nielsen, M.B.; Østerby, O. A two-continua approach to eulerian simulation of water spray. ACM Trans. Graph. (TOG) 2013, 32, 1–10. [Google Scholar] [CrossRef]
  25. Wu, Y. A new exploration based on unreal engine4 particle effects of unreal engine in 3d animation scenes. Int. J. Innov. Sci. Res. Technol. 2021, 6, 691–696. [Google Scholar]
  26. Hamano, T.; Onosato, M.; Tanaka, F. Performance comparison of physics engines to accelerate house-collapsing simulations. In Proceedings of the 2016 IEEE International Symposium on Safety, Security, and Rescue Robotics (SSRR), Lausanne, Switzerland, 23–27 October 2016; IEEE: New York, NY, USA, 2016; pp. 358–363. [Google Scholar]
  27. Boeing, A.; Bräunl, T. Evaluation of real-time physics simulation systems. In Proceedings of the 5th International Conference on Computer Graphics and Interactive Techniques in Australia and Southeast Asia, Perth, Australia, 1–4 December 2007. [Google Scholar]
  28. Hongpan, N.; Yong, G.; Zhongming, H. Application research of physx engine in virtual environment. In Proceedings of the 2010 International Conference on Audio, Language and Image Processing, Shanghai, China, 23–25 November 2010; IEEE: New York, NY, USA, 2010; pp. 587–591. [Google Scholar]
  29. Wang, H.; Wan, J.; Zhang, F. Interaction of fluid simulation based on physx physics engine. In Proceedings of the 2015 4th International Conference on Sensors, Measurement and Intelligent Materials, Shenzhen, China, 27–28 December 2015; Atlantis Press: Dordrecht, The Netherlands, 2016; pp. 480–485. [Google Scholar]
  30. Toasa, R.; Maximiano, M.; Reis, C.; Guevara, D. Data visualization techniques for real-time information—A custom and dynamic dashboard for analyzing surveys’ results. In Proceedings of the 2018 13th Iberian Conference on Information Systems and Technologies (CISTI), Caceres, Spain, 13–16 June 2018; IEEE: New York, NY, USA, 2018; pp. 1–7. [Google Scholar]
  31. Millais, P.; Jones, S.L.; Kelly, R. Exploring data in virtual reality: Comparisons with 2d data visualizations. In Proceedings of the Extended Abstracts of the 2018 CHI Conference on Human Factors in Computing Systems, Montreal, QC, Canada, 21–26 April 2018; pp. 1–6. [Google Scholar]
  32. Stock, C.; Bishop, I.D.; O’Connor, A. Generating virtual environments by linking spatial data processing with a gaming engine. In Proceedings of the 6th International Conference for Information Technologies in Landscape Architecture, Dessau, Germany, 26 May 2005. [Google Scholar]
  33. Keil, J.; Edler, D.; Schmitt, T.; Dickmann, F. Creating immersive virtual environments based on open geospatial data and game engines. KN-J. Cartogr. Geogr. Inf. 2021, 71, 53–65. [Google Scholar] [CrossRef]
  34. Kenkenberg, A. Real-time Volumetric Cloud Visualization of Meteorological Simulation Data. Available online: https://gitlab2.cip.ifi.lmu.de/kenkenberg/cloud-thesis/-/tree/master (accessed on 1 February 2023).
  35. Marsden, C.; Shankar, F. Using unreal engine to visualize a cosmological volume. Universe 2020, 6, 168. [Google Scholar] [CrossRef]
  36. Prado, J.M. Using unreal engine as an engineering tool for traffic simulation and analysis. Collect. Open Thesis Transp. Res. 2020, 2020, 34. [Google Scholar]
  37. Games, E. Data Driven Gameplay Elements, Making Interactive Experiences, Unreal Engine 4 Documentation. Available online: https://docs.unrealengine.com/4.26/en-US/InteractiveExperiences/DataDriven (accessed on 1 May 2021).
  38. Sandurawan, D.; Kodikara, N.D.; Keppitiyagama, C.; Rosa, R. A six degrees of freedom ship simulation system for maritime education. Int. J. Adv. ICT Emerg. Reg. (ICTer) 2011, 3. [Google Scholar] [CrossRef]
  39. Tavakkol, S.; Lynett, P. Celeris: A GPU-accelerated open source software with a Boussinesq-type wave solver for real-time interactive simulation and visualization. Comput. Phys. Commun. 2017, 217, 117–127. [Google Scholar] [CrossRef]
  40. Marcel, Z.; Stelling, G.; Smit, P. SWASH: An operational public domain code for simulating wave fields and rapidly varied flows in coastal waters. Coast. Eng. 2011, 58, 992–1012. [Google Scholar]
  41. Lynett, P.; Liu, P.L.F.; Sitanggang, K.I.; Kim, D.H. Modeling Wave Generation, Evolution, and Interaction with Depth-Integrated, Dispersive Wave Equations COULWAVE Code Manual. Cornell University Long and Intermediate Wave Modeling Package v.2.0. 2002. Available online: https://www.semanticscholar.org/paper/Modeling-Wave-Generation-%2C-Evolution-%2C-and-with-%2C-v-Lynett-Liu/f07da390c4590b880607037be8d900538f42c992 (accessed on 1 February 2023).
  42. Derakhti, M.O.; Kirby, J.T.; Shi, F.E.; Ma, G.A. NHWAVE: Model Revisions and Tests of Wave Breaking in Shallow and Deep Water; Research Report No. CACR-15-18; Center for Applied Coastal Research, Department of Civil and Environmental Engineering, University of Delaware: Newark, DE, USA, 2015. [Google Scholar]
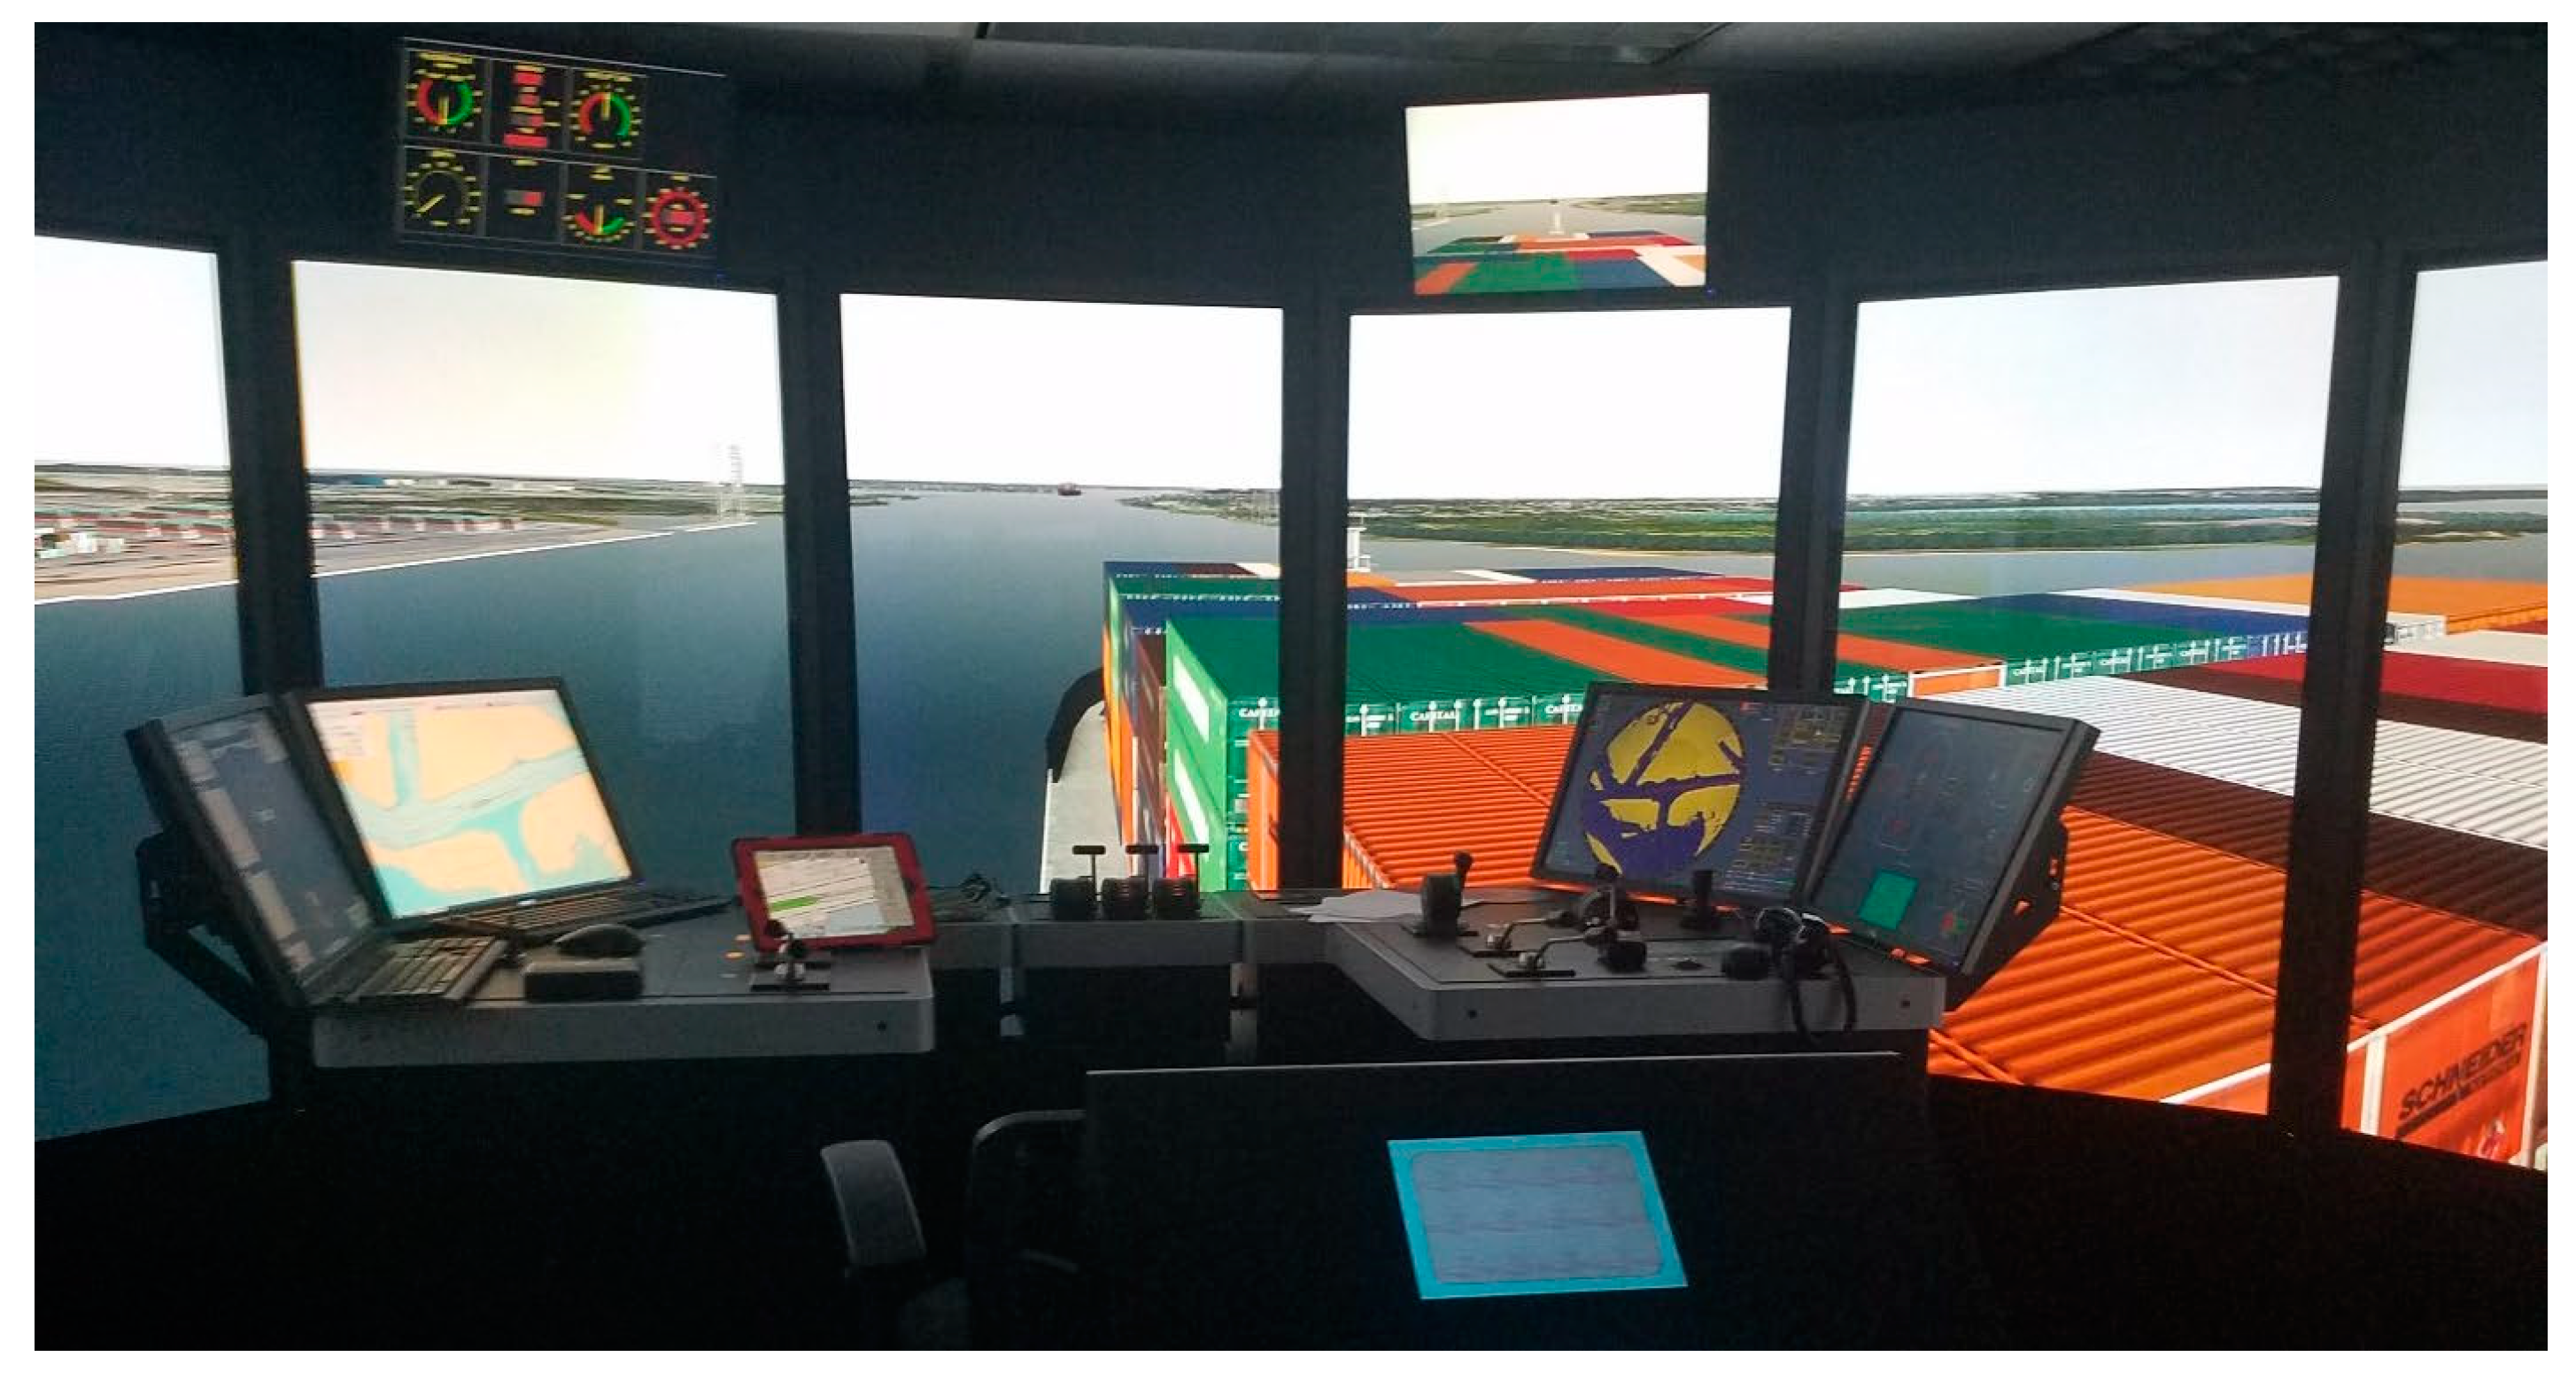
Figure 1. Kongsberg ship simulator at Engineering Research and Development Center.
Virtualworlds 02 00024 g001
Figure 2. HR Wallingford ship simulator.
Virtualworlds 02 00024 g002
Figure 3. Diagram of current implementation framework.
Virtualworlds 02 00024 g003
Figure 4. Steering and throttle modeled for Unreal Engine in Maya by the ITL team.
Virtualworlds 02 00024 g004
Figure 5. Beach environment main menu with default UE 4.26 water rendering.
Virtualworlds 02 00024 g005
Figure 6. FUNWAVE to Unreal Engine workflow.
Virtualworlds 02 00024 g006
Figure 7. Python code for reading in a binary file and converting it to CSV file.
Virtualworlds 02 00024 g007
Figure 8. Spatial grid showing FUNWAVE data interacting with the ship.
Virtualworlds 02 00024 g008
Figure 9. Blueprint snippet obtaining total number of entries.
Virtualworlds 02 00024 g009
Figure 10. Blueprint snippet making a square grid and user-entered sizing.
Virtualworlds 02 00024 g010
Figure 11. Blueprint script obtaining u, v, and eta values from the DataTable.
Virtualworlds 02 00024 g011
Figure 12. Battleship-style grid explaining radius of loaded cells.
Virtualworlds 02 00024 g012
Figure 13. Blueprint snippet showing transform location.
Virtualworlds 02 00024 g013
Figure 14. Blueprint snippet showing spawn location in XY.
Virtualworlds 02 00024 g014
Figure 15. Fully immersive VR scene of LCU performing landing operation.
Virtualworlds 02 00024 g015
Figure 16. FUNWAVE plot using Python only available in 2D.
Virtualworlds 02 00024 g016
Table 1. Hardware and software for virtual reality development.
PC Hardware SpecsVR HeadsetsSoftware
Processor: Intel i9Valve IndexUnreal Engine 4.26
Graphics Card: Nvidia GeForce RTX 3090
RAM: 64 GB
Hard drive: 2TB SSD
HTC Vive Pro 2FUNWAVE
Table 2. Example of DataTable with FUNWAVE data with approx. 1 million rows.
uvη
001.001615
0.2006940.0013180.951349
0.3804690.0300340.914848
−0.33905−0.014390.861739
0.217115−0.067270.805298
0.3420440.0036590.761927
0.3370630.0046340.711583
0.344882−0.005110.662127
0.352469−0.063680.613077
Table 3. Comparison between FUNWAVE visualization and Unreal Engine.
ApplicationPhysics AccuracyVisualization Capability
FUNWAVEHigher (numerical modeler run on HPC)Lower (only 2D plotting)
Unreal EngineLower (basic gaming physics engine)Higher (fully immersive 3D VR)
Hybrid ApproachHigh accuracy of physicsHigh level of visual graphics and immersive virtual reality
Disclaimer/Publisher’s Note: The statements, opinions and data contained in all publications are solely those of the individual author(s) and contributor(s) and not of MDPI and/or the editor(s). MDPI and/or the editor(s) disclaim responsibility for any injury to people or property resulting from any ideas, methods, instructions or products referred to in the content.