1. Introduction
Attention-deficit/hyperactivity disorder (ADHD) is a prevalent neurodevelopmental condition associated with functional impairment across academic, social, family, and occupational domains. Although national epidemiological data from Costa Rica remain limited, available local evidence suggests that ADHD is a clinically relevant condition in the country, with one Costa Rican screening study reporting an estimated point prevalence of approximately 5% in the evaluated sample [
1]. Methylphenidate remains one of the most widely used pharmacological treatments for ADHD and is available in immediate-release (IR) and extended-release (XR) formulations. These formulations differ in duration of action, dosing patterns, and labeled strengths, making formulation-specific analyses relevant for understanding changes in medication demand and treatment patterns at the health-system level [
2,
3,
4,
5].
In Costa Rica, methylphenidate is a controlled psychotropic medicine subject to regulatory monitoring. Prescribing and dispensing of controlled psychotropic medicines are managed through the national Digital Prescription System, which supports administrative control and surveillance of these products [
6]. Methylphenidate may be prescribed by authorized healthcare professionals and obtained through both public and private healthcare channels; however, these sectors differ in access pathways, product availability, institutional coverage, reimbursement or payment mechanisms, and dispensing records. Public-sector dispensing is not captured in the private-sector administrative dataset analyzed in this study. Therefore, private-sector dispensing data should be interpreted as a specific component of reported methylphenidate availability rather than as total national methylphenidate consumption.
Drug-utilization studies based on dispensing data provide an ecological perspective on medication availability and aggregate use over time. For controlled medicines such as methylphenidate, private-sector dispensing analyses can support surveillance of longitudinal trends, formulation mix, and presentation-specific distribution. Dispensed boxes are useful for administrative and supply-monitoring purposes, whereas Defined Daily Doses (DDDs) provide a standardized metric for comparing aggregate dose exposure across products with different labeled strengths. For oral methylphenidate, the World Health Organization reference DDD is 30 mg/day [
7]. However, DDDs are technical drug-utilization units and should not be interpreted as prescribed pediatric doses, patient-level exposure, adherence, treatment duration, or treatment prevalence. Similarly, dispensing data should be interpreted cautiously, as they do not directly measure diagnoses, treated patients, prescriptions, patient duplication, stockpiling, medication actually consumed, or clinical outcomes [
8,
9,
10].
International studies have reported increasing ADHD medication use across multiple countries and regions, although trends vary substantially by setting, regulatory context, healthcare access, reimbursement systems, product availability, and time period [
8,
9,
11,
12]. The COVID-19 pandemic further altered patterns of ADHD medication use in several countries, with reports of early disruption followed by recovery or expansion in later years [
11,
12]. Because the present study covers 2017–2024, it includes pre-pandemic, pandemic, and post-pandemic years, allowing description of private-sector methylphenidate dispensing across these periods. However, the aggregate annual design does not allow observed changes to be attributed causally to the pandemic. Evidence from Costa Rica remains limited, and prior local data have focused mainly on pandemic-era prescribing rather than longer-term private-sector methylphenidate dispensing trends by formulation and presentation [
13]. Thus, it remains unclear how reported private-sector methylphenidate dispensing changed over a longer period and whether interpretation differs when dispensing is measured as administrative volume, dose-standardized exposure, or population-standardized rates.
Based on international evidence of increasing ADHD medication use and the availability of both IR and XR methylphenidate formulations in Costa Rica, we expected reported private-sector methylphenidate dispensing to increase over time, with potentially different patterns according to formulation and metric. Therefore, this study aimed to describe reported private-sector trends in dispensed methylphenidate in Costa Rica from 2017 to 2024, comparing IR and XR formulations by recorded dispensed boxes and DDDs. Specifically, we assessed annual and cumulative dispensing volume, formulation-specific shares, XR-to-IR ratios, year-over-year changes, presentation-level distribution, population-standardized dispensing rates, DDD-based dose-standardized estimates, and the impact of ES-030 through sensitivity analysis. By focusing on aggregate administrative dispensing volume, this study provides an ecological overview of reported private-sector methylphenidate use while avoiding patient-level inferences not supported by the available data.
3. Discussion
3.1. Principal Findings
This private-sector ecological drug-utilization study documented a substantial increase in dispensed methylphenidate boxes in Costa Rica between 2017 and 2024. Total dispensing increased 2.81-fold, from 988,739 boxes in 2017 to 2,774,698 boxes in 2024. Excluding ES-030, the trajectory was less dramatic than when that code is included but remained consistent with meaningful growth, culminating in the highest annual volume in 2024. This increasing pattern was further supported by the exploratory log-linear trend analysis, which showed a statistically significant annual increase in total dispensed boxes and a stronger increasing trend for XR dispensing.
A second major finding was the contrast between box-based and DDD-based metrics. IR accounted for most dispensed boxes, whereas XR accounted for most cumulative DDDs. This indicates that formulation-level interpretation depends on whether the objective is to describe administrative dispensing volume or aggregate dose-standardized exposure. This distinction is important for surveillance because package counts and dose-standardized metrics answer different questions: boxes reflect administrative and supply volume, whereas DDDs better capture differences in labeled strength across formulations.
3.2. Interpretation in the Context of International ADHD Medication Trends
The observed increase in reported private-sector methylphenidate dispensing is consistent with international evidence showing increasing ADHD medication use across multiple healthcare systems. A multinational analysis of 64 countries and regions reported an overall increase in ADHD medication consumption from 2015 to 2019, although with substantial variation between countries and income settings [
8]. More recent European data also show increasing ADHD medication use across several countries from 2010 to 2023, with substantial heterogeneity by country, age, and sex [
14]. These international patterns support the interpretation that the Costa Rican trend is part of a broader global increase in ADHD pharmacotherapy, while also emphasizing the importance of country-specific analyses.
Additional evidence from Scandinavia, China, and South Africa further supports the need for context-specific interpretation of ADHD medication use. In Scandinavia, ADHD medication use increased between 2010 and 2020, but the magnitude of growth differed substantially across countries: Sweden showed the largest relative increase (+119%), followed by Denmark (+38%) and Norway (+16%). By 2020, Sweden also had the highest reported prevalence of ADHD medication use, reaching 35 users per 1000 inhabitants aged 5–19 years, compared with approximately 22 per 1000 in Denmark and Norway [
15]. Methylphenidate remained the most frequently used ADHD medication in the three countries, although its relative market share decreased over time as newer agents such as lisdexamfetamine, atomoxetine, and guanfacine became more widely used [
16]. Similarly, Chinese data showed substantial growth in ADHD medication prescribing between 2010 and 2019, with prescriptions increasing approximately five-fold and total medication costs increasing nearly nine-fold. Methylphenidate remained the predominant ADHD medication in China, although its prescription share decreased from 91.9% in 2010 to 76.9% in 2019 as atomoxetine use increased [
17].
South African private-sector data provide a particularly relevant comparator because they also used DDD-based drug-utilization metrics and focused on private healthcare. In that setting, methylphenidate consumption increased from 6.010 to 7.827 DDDs per 1000 inhabitants per day between 2013 and 2016, representing an approximate 30% increase. Methylphenidate accounted for the vast majority of ADHD medication consumption in the South African private sector, representing 95.85% of total ADHD medication consumption in 2013 and 96.40% in 2016 [
18]. More recent South African evidence has also described seasonal peaks in methylphenidate consumption in February, May, August, and November, coinciding with periods preceding school and university assessments [
19]. These findings suggest that academic calendars may influence stimulant dispensing patterns in some settings. However, direct comparison with Costa Rica should be cautious because the present study used annual aggregate dispensing data and therefore could not evaluate monthly seasonality. More broadly, differences in data sources, healthcare financing models, public versus private-sector coverage, reimbursement structures, age ranges, medication availability, and outcome metrics limit direct cross-country comparisons.
The COVID-19 pandemic may have influenced ADHD medication patterns internationally, but the direction and timing of its impact appear to have varied across settings. A study of 47 countries and regions reported that ADHD medication use in 2020 was lower than predicted in many countries, followed by heterogeneous post-pandemic patterns [
11]. A Costa Rica–Italy study also reported increasing ADHD medication prescriptions during the pandemic period, including methylphenidate and atomoxetine [
13]. In the present study, total methylphenidate dispensing remained relatively stable from 2018 through 2021, although total dispensing declined in 2020, the decline was not followed by a sustained downward trend, and volumes recovered in 2021. The strong increase observed in 2024 was primarily driven by IR dispensing. Because the dataset lacks patient-level, service-use, supply-chain, and regulatory variables, these patterns should not be attributed to a specific pandemic effect or causal mechanism.
The increase observed in Costa Rica may reflect several non-mutually exclusive contextual factors, including increased recognition of ADHD, changes in healthcare-seeking behavior, greater private-sector access, product availability, prescriber preferences, and post-pandemic changes in demand for ADHD care. Regulatory monitoring, reimbursement or out-of-pocket payment, market availability, and supply conditions may also shape dispensing patterns for controlled medicines. However, these factors were not directly measured in the available dataset. Therefore, the present findings should be interpreted as evidence of increased reported private-sector dispensing rather than as evidence of a specific causal mechanism.
3.3. Persistence of IR Dominance with XR Expansion
The apparent predominance of IR methylphenidate should be interpreted in light of the DDD-based analysis. Although IR accounted for most dispensed boxes, XR formulations contributed a larger share of aggregate DDD exposure in every study year. This divergence reflects differences in labeled strength: IR methylphenidate was recorded as 10 mg tablets, whereas XR formulations included higher-strength presentations. Therefore, box-based counts are informative for administrative volume and supply monitoring, but they may underrepresent the contribution of higher-strength formulations to aggregate dose exposure.
This contrast does not indicate that XR was prescribed to more patients than IR, because neither boxes nor DDDs measure treated individuals, adherence, or treatment duration. Rather, it shows that formulation-level interpretation depends strongly on the metric used. The coexistence of IR predominance by boxes and XR predominance by DDDs supports reporting both administrative volume and dose-standardized exposure.
The clinical and policy relevance of this finding is that reliance on box counts alone could overemphasize the apparent predominance of IR products, whereas reliance on DDDs alone could overstate the contribution of XR products if interpreted as patient-level use. For controlled-medication surveillance, both metrics are therefore complementary. Box counts may be more useful for monitoring dispensing activity, product demand, and supply planning, while DDDs are more useful for comparing aggregate dose-standardized exposure across presentations with different strengths.
3.4. Year-to-Year Variability and the 2024 Rebound
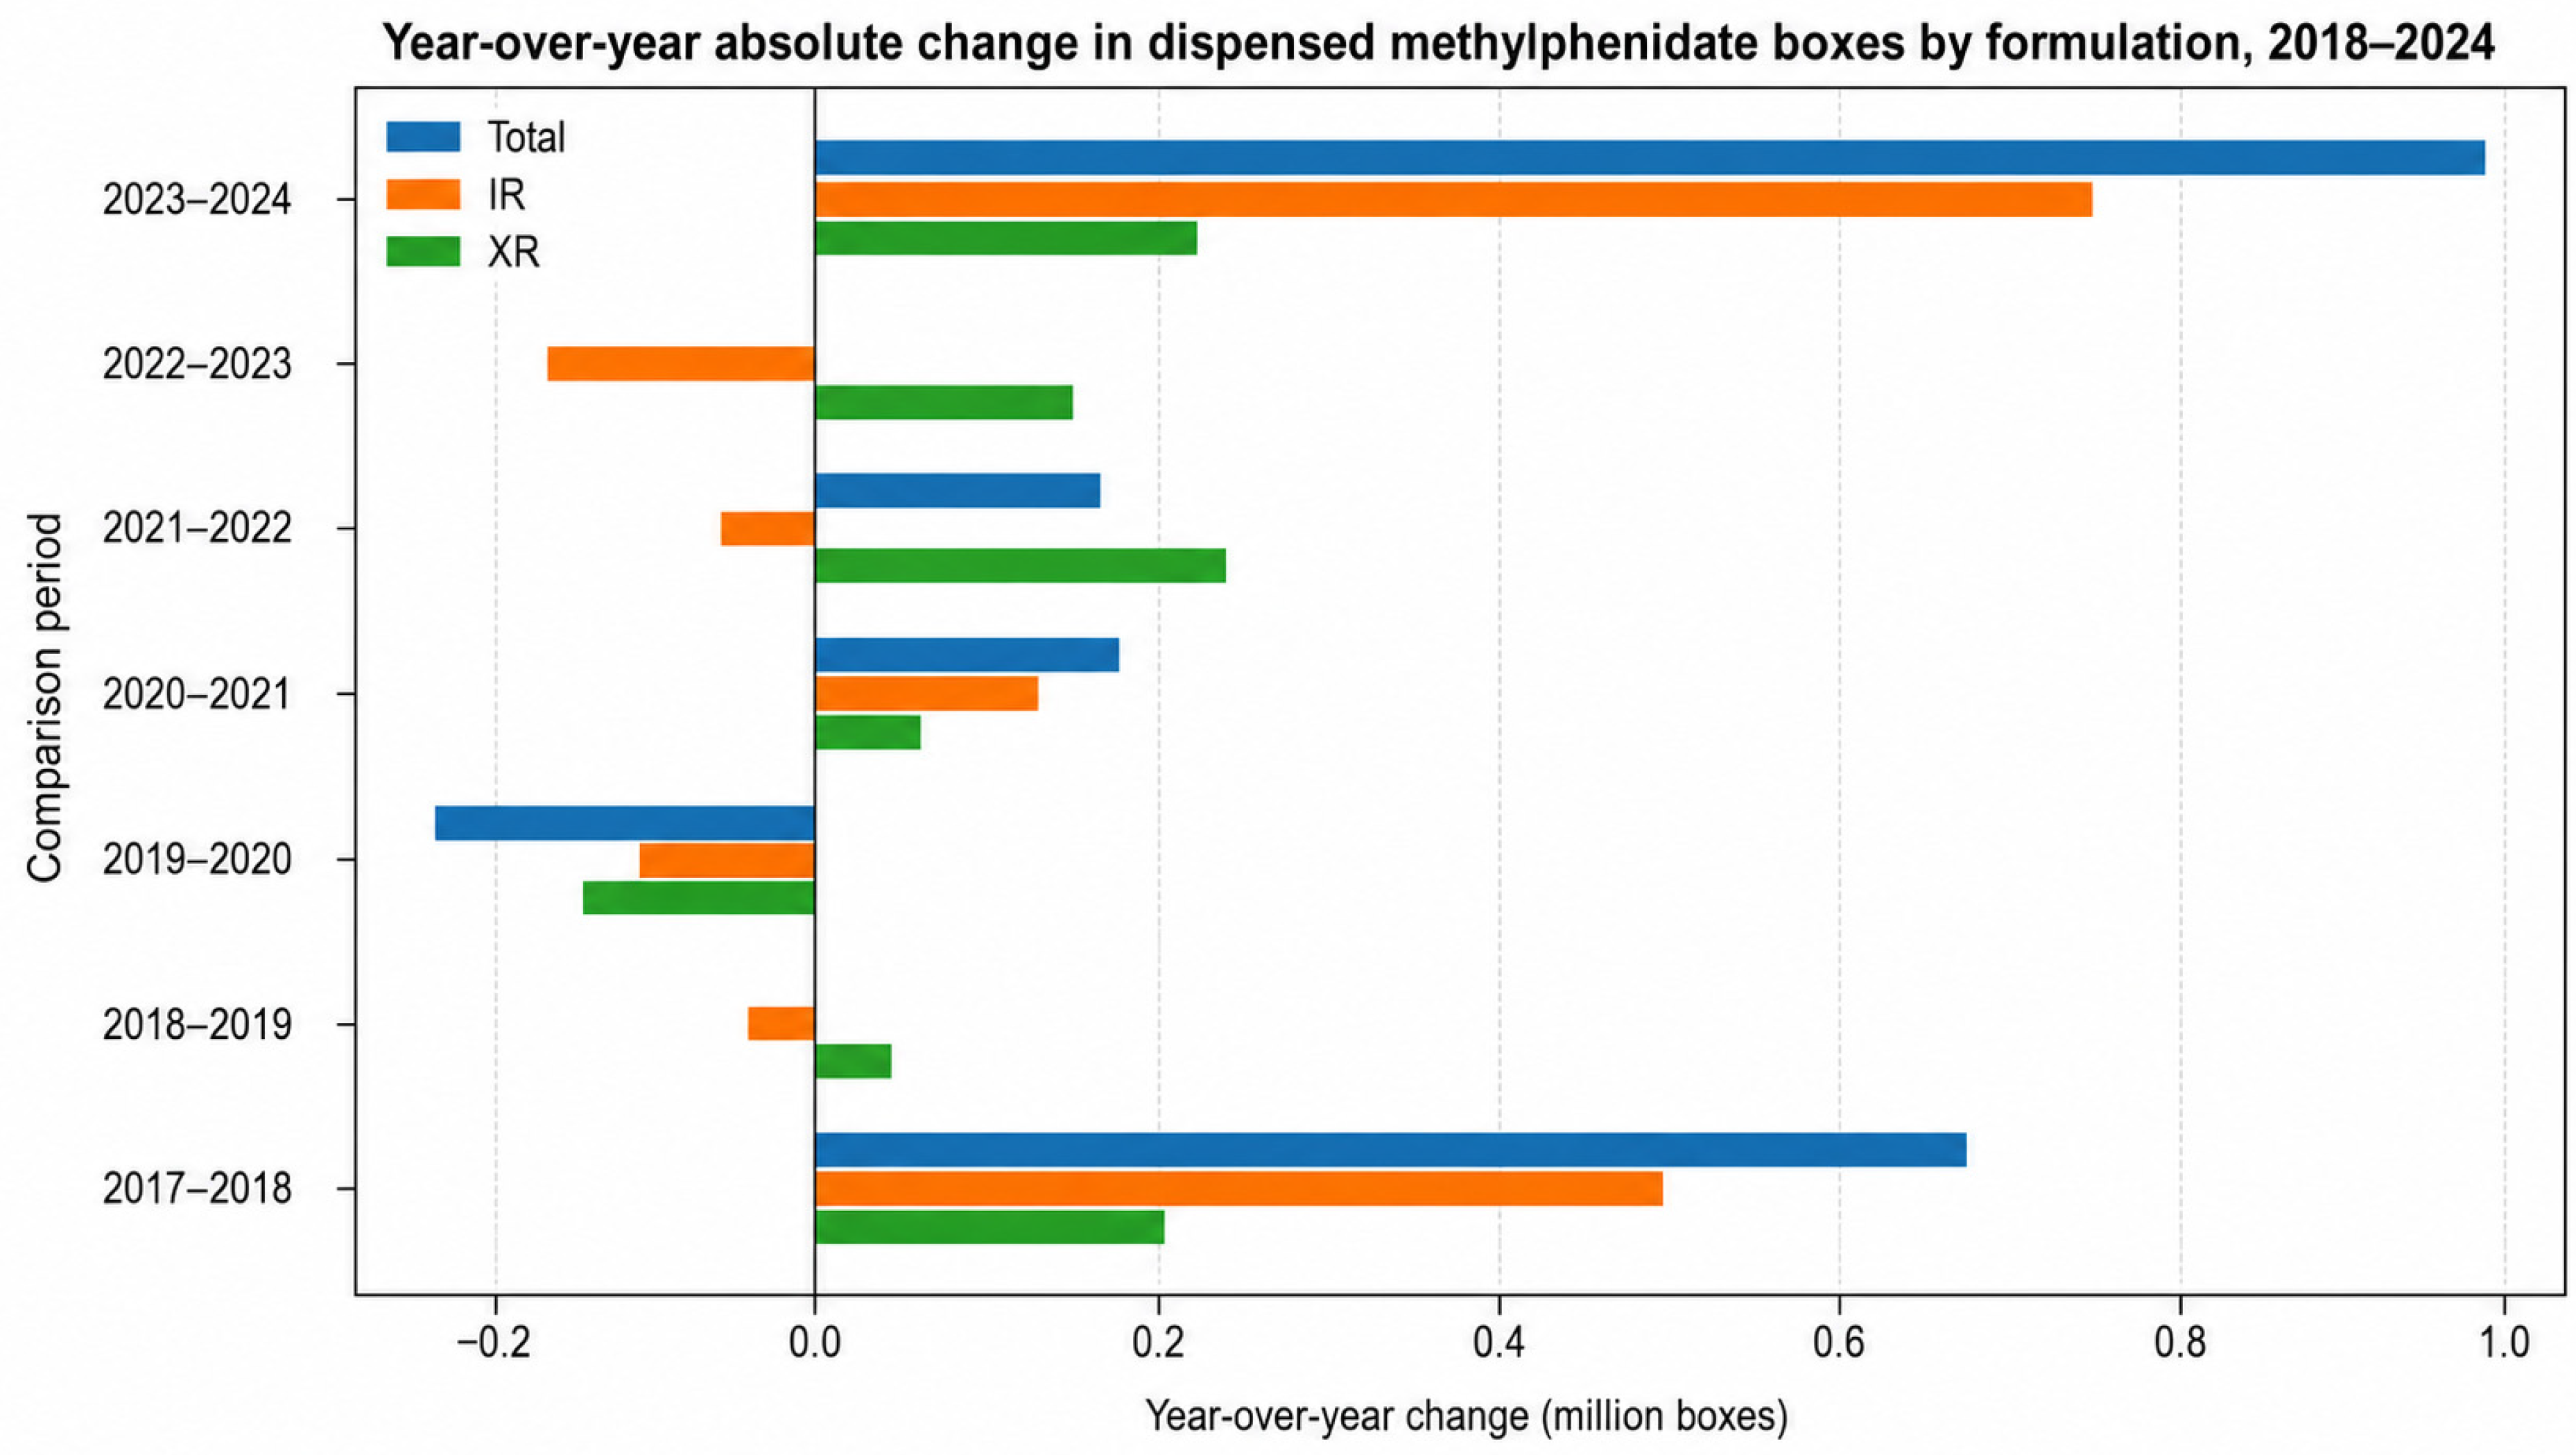
The year-over-year absolute-change analysis reveals a pattern that differs substantially from what was apparent when ES-030 records were included. The largest absolute increase of the study period occurred between 2017 and 2018, when total dispensing rose by 699,284 boxes (+70.72%), driven by growth in both IR and XR. From 2018 through 2021, total dispensed volume remained relatively stable, with year-over-year changes ranging from −14.05% to +12.19% and no single large contraction or expansion.
A notable divergence emerged from 2021 onward: IR decreased during 2021–2023 while XR increased, leaving total volume nearly unchanged in 2022–2023. The largest absolute increase occurred between 2023 and 2024, driven primarily by IR while XR continued to grow. These patterns may reflect changes in clinical demand, prescriber preferences, access, product availability, procurement cycles, supply interruptions, or regulatory processes; however, the ecological design does not allow these mechanisms to be distinguished.
The 2024 rebound deserves particular caution. Although it was numerically large and mainly explained by IR dispensing, the available dataset does not include monthly dispensing, stock availability, product shortages, importation data, reimbursement information, prescriber behavior, patient diagnoses, or treatment initiation records. Therefore, the 2024 increase should be interpreted as an observed administrative dispensing signal rather than as evidence of a confirmed change in ADHD prevalence, treatment need, prescribing behavior, or medication consumption.
3.5. Sensitivity Analysis and Impact of ES-030
The sensitivity analysis confirmed that ES-030 was quantitatively influential. Including this code as IR 10 mg boxes increased cumulative dispensing from 13.8 to 25.4 million boxes and shifted cumulative DDD exposure from XR predominance to IR predominance. However, its effect was concentrated mainly in 2019–2021, when ES-030 accounted for more than 60% of total recorded dispensing in the sensitivity scenario. This pattern was discordant with the more gradual trajectory observed in the primary analysis and with the highly unstable dispensed-to-prescribed ratios for this code.
These findings support excluding ES-030 from the primary analysis while using the sensitivity scenario as an upper-bound estimate. Importantly, the overall conclusion of increased methylphenidate dispensing from 2017 to 2024 remained directionally consistent, although the magnitude, timing, and formulation-level distribution were sensitive to ES-030 handling.
From a data-quality perspective, ES-030 illustrates the importance of auditing administrative codes before estimating utilization trends. Including an internally inconsistent code without sensitivity analysis would have substantially changed both the magnitude and interpretation of the findings. Conversely, excluding it without quantifying its influence would have reduced transparency. The dual approach used here allows the primary analysis to remain conservative while documenting the potential effect of this anomalous code.
3.6. Presentation-Specific Dispensing Patterns
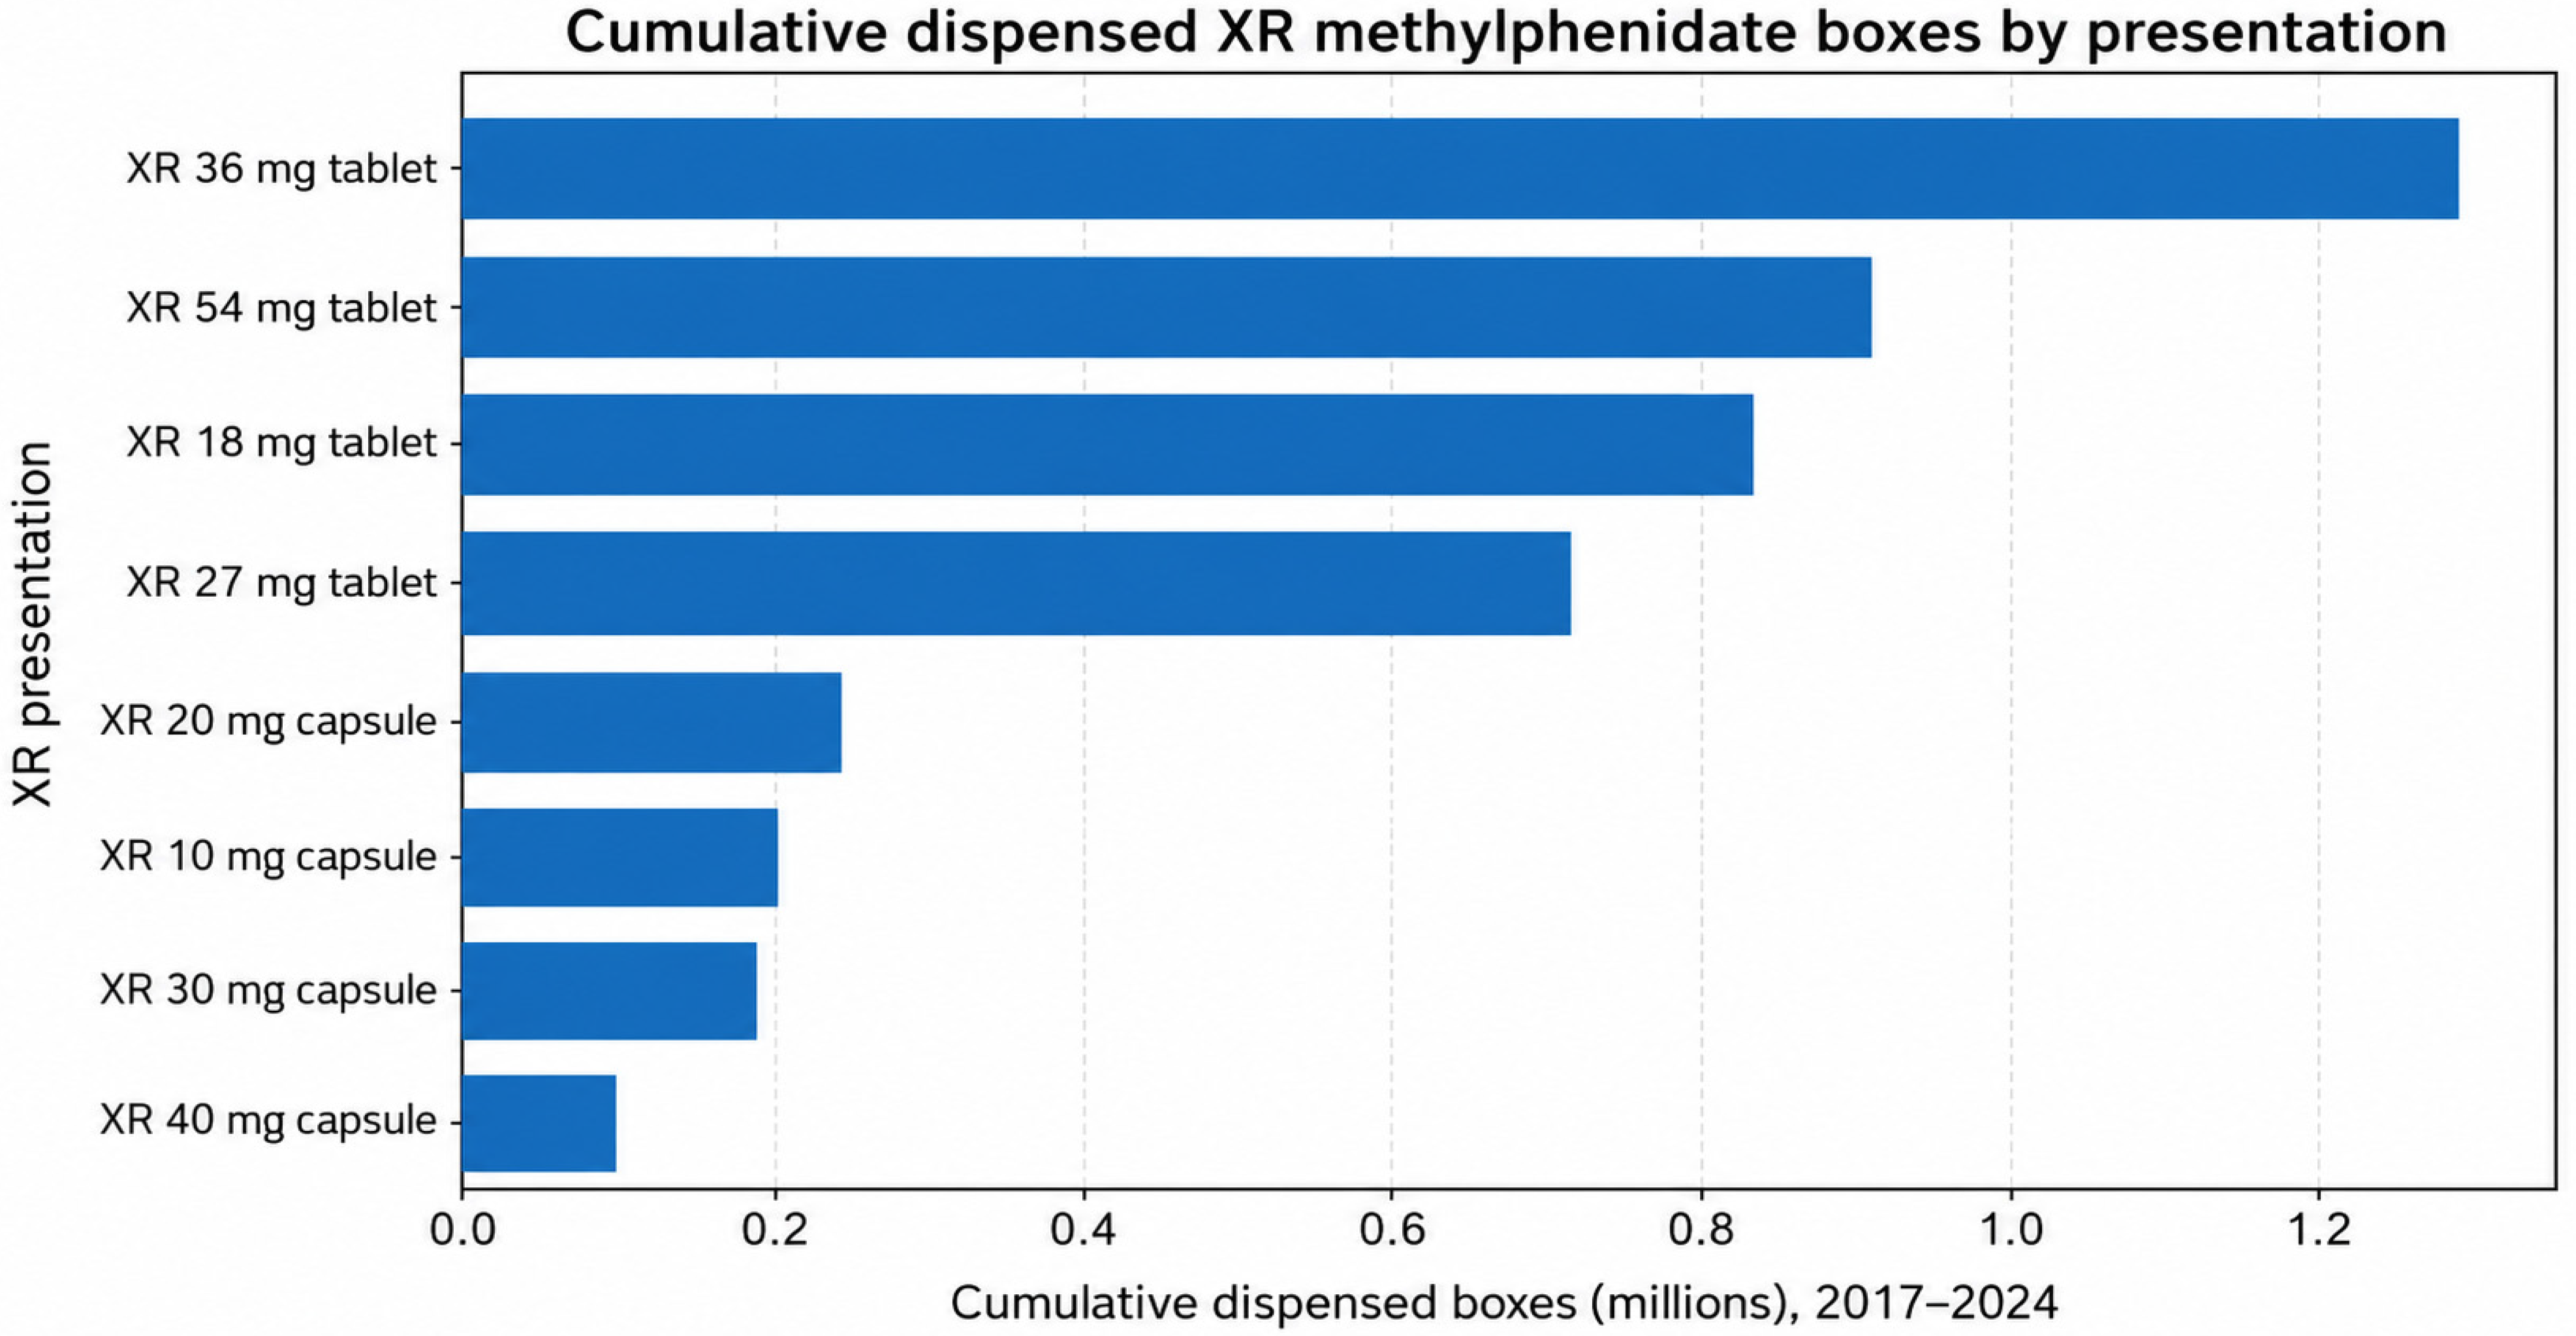
The presentation-level analysis adds operational value by showing that private-sector dispensing was concentrated in a limited number of products. IR 10 mg tablets accounted for 67.68% of all dispensed methylphenidate boxes, indicating strong dependence on a single presentation for aggregate private-sector volume.
Within XR formulations, dispensing was concentrated mainly in tablet presentations. XR 36 mg, 54 mg, 18 mg, and 27 mg tablets together accounted for 84.03% of all dispensed XR methylphenidate, whereas XR capsule presentations contributed a smaller share. Such concentration is relevant for supply planning and interpretation of changes in private-sector dispensing volume.
However, presentation-level findings should be interpreted mainly as operational and market-availability information rather than as direct evidence of clinical preference or patient-level treatment patterns. Without prescription-level or patient-level data, it is not possible to determine whether these presentation patterns reflect prescriber preference, patient characteristics, pricing, reimbursement, availability, or supply conditions.
3.7. Population-Standardized Interpretation
The population-standardized analysis strengthens the interpretation of the private-sector trend. Although Costa Rica’s population increased modestly during the study period, methylphenidate dispensing increased substantially after adjustment for population size: from 201.2 to 540.9 boxes per 1000 inhabitants per year and from 3301.2 to 9522.6 DDDs per 1000 inhabitants per year. Therefore, the observed growth cannot be attributed solely to population growth.
Expressed as DDDs per 1000 inhabitants per day, methylphenidate dispensing increased from 9.04 in 2017 to 26.09 in 2024. This metric facilitates longitudinal comparison but should not be interpreted as treatment prevalence because the numerator was not stratified by patient age and the dataset lacked patient-level information. Pediatric, adolescent, and adult-specific rates would require age-stratified dispensing data.
This distinction is especially important for ADHD pharmacotherapy because treatment is commonly concentrated in pediatric and adolescent populations, while the denominator used here was the total national population. Therefore, the population-standardized estimates are useful for ecological surveillance and international comparability but should not be interpreted as age-specific utilization rates or treated prevalence.
3.8. Pharmacovigilance and Controlled-Medication Surveillance Implications
Although this study did not evaluate adverse drug reactions, misuse, diversion, or patient-level safety outcomes, its findings may inform controlled-medication surveillance. For methylphenidate, monitoring formulation- and presentation-specific dispensing may be more informative than monitoring total volume alone, particularly given the marked growth in dispensing, dependence on IR 10 mg tablets, and increasing XR use. Linking dispensing data with adverse-event reports, patient-level denominators, prescriber data, and clinical outcomes would be necessary to address safety and pharmacovigilance questions directly [
10,
20].
For policymakers and regulators, the findings support the value of routine monitoring systems that can distinguish between formulations, strengths, and presentations. Such systems may help identify abrupt changes in dispensing volume, dependence on specific products, or shifts between IR and XR formulations. However, surveillance based only on aggregate dispensing data should be complemented with patient-level, prescription-level, stock-availability, and safety data before drawing conclusions about appropriateness, access, misuse, diversion, or clinical outcomes.
3.9. Strengths and Limitations
This study has several strengths. It provides an eight-year private-sector overview of methylphenidate dispensing in Costa Rica, stratified by formulation and standardized presentation. It also combines box-based administrative volume with DDD-based dose-standardized exposure and explicitly evaluates the impact of ES-030 through sensitivity analysis, reducing the risk of silently incorporating an influential but internally inconsistent administrative code. In addition, the revised analysis includes an exploratory log-linear trend model, which provides statistical support for the description of temporal dispensing patterns while remaining consistent with the descriptive ecological design.
The main limitations arise from the aggregate ecological design. The dataset did not include patient identifiers, diagnoses, age, sex, prescriber specialty, geographic region, treatment duration, adherence, stock availability, costs, or adverse-event reports. Therefore, the findings should be interpreted as private-sector dispensing trends rather than estimates of ADHD prevalence, treatment rates, individual exposure, medication consumption, misuse, diversion, or safety outcomes.
Another limitation is that the administrative outcome represented reported dispensed boxes in annual aggregated controlled-medicine reports. Because the authors received only aggregate product-year extracts, it was not possible to independently verify whether these records represented only completed pharmacy dispensing to patients or whether they may have included administrative corrections, reconciliations, or stock-related adjustments. Therefore, the findings should be interpreted as reported private-sector dispensing trends rather than verified patient-level pharmacy dispensing events.
The exploratory trend analysis was based on only eight annual observations and should therefore be interpreted as descriptive trend support rather than as robust time-series inference. More granular monthly or quarterly data would be needed to evaluate seasonality, short-term disruptions, autocorrelation, or the specific timing of changes in dispensing patterns.
The exclusion of ES-030 remains an important limitation. Although this code corresponded to boxes of IR methylphenidate 10 mg tablets, its annual dispensed-to-prescribed ratios were highly inconsistent, particularly during 2019–2021. The sensitivity analysis showed that including ES-030 substantially changes the magnitude and temporal pattern of dispensing. Accordingly, the primary analysis should be interpreted as conservative, while the sensitivity analysis provides an upper-bound scenario.
The DDD-based analysis also involves assumptions. The WHO DDD of 30 mg/day is a technical reference unit and may not reflect actual prescribed doses, especially in pediatric populations. DDDs were derived from box counts, dosage-unit assumptions, and labeled strengths, and should therefore be interpreted as aggregate dose-standardized dispensing rather than patient-level exposure. Finally, although total-population denominators were incorporated, age-, sex-, and region-specific rates could not be estimated. Pediatric and adolescent rates were not calculated because the numerator was not stratified by age. Future studies linking dispensing records to patient-level or stratified data would allow more precise evaluation of utilization patterns.
Finally, the study could not assess the influence of ADHD awareness campaigns, regulatory changes, reimbursement policies, product prices, market availability, supply interruptions, or prescriber behavior because these variables were not available in the administrative dataset. These unmeasured factors may have contributed to the observed dispensing trends and should be incorporated in future research.
3.10. Implications for Future Research
Future studies should incorporate patient-level data, age and sex stratification, geographic distribution, prescription records, monthly time resolution, stock-availability indicators, medication costs, and adverse-event reports. These additions would allow more complete assessment of methylphenidate utilization, safety, access, and formulation-specific use in Costa Rica.
Future work should also evaluate potential seasonality in methylphenidate dispensing, particularly in relation to academic calendars and examination periods, as described in other settings. Monthly or quarterly data would allow assessment of whether dispensing peaks occur before school or university evaluation periods and whether such patterns differ between IR and XR formulations.
4. Materials and Methods
4.1. Study Design and Data Source
This retrospective ecological drug-utilization study analyzed private-sector administrative records of dispensed methylphenidate in Costa Rica from 1 January 2017, through 31 December 2024. The study was designed as an aggregate dispensing analysis rather than a patient-level pharmacoepidemiological study [
21].
The data analyzed in this study were obtained from official annual controlled-medicine administrative reports produced by the Ministry of Health of Costa Rica. These reports are generated as part of routine regulatory surveillance and consolidate aggregated information on prescriptions and reported dispensations of controlled medicines. The dataset was provided to the authors through the Costa Rican Health Chamber (Cámara Costarricense de la Salud) and was used exclusively for research and statistical analysis purposes. Use of the aggregated dataset for research and statistical analysis was authorized by the relevant data custodian before analysis. The authors received only aggregate product-year extracts and did not receive access to the underlying individual prescription records, patient identifiers, prescriber identifiers, or pharmacy-level dispensing transactions.
The source dataset was obtained from the national administrative registry for controlled medicines in Costa Rica, maintained by the Ministry of Health of Costa Rica. This registry is used for administrative monitoring and regulatory surveillance of controlled-substance prescribing and dispensing. The annual extracts provided for this study contained product-level records, including medication code, recorded product name, pharmaceutical presentation, prescribed quantity, and recorded dispensed quantity. The data were available as yearly controlled-medicine administrative worksheets covering calendar years 2017 through 2024.
The authors received annual product-level aggregated extracts; no patient-level or prescription-level records were available to the authors for this analysis. The dataset available for analysis did not include patient identifiers, individual prescriptions, diagnoses, age, sex, prescriber information, treatment duration, dispensing dates, pharmacy identifiers, reimbursement information, stock availability, market availability, or clinical outcomes. No identifiable human-subject data were available to the authors. Therefore, the analysis was restricted to aggregate reported private-sector dispensing trends by product, formulation, presentation, and year.
4.2. Coverage and Completeness of the Dataset
The dataset was considered national in geographic scope because it included annual controlled-medicine administrative records from private-sector dispensing entities in Costa Rica that reported methylphenidate-containing products during the study period. The analysis included all methylphenidate products identified in the dispensing section of the available private-sector controlled-substance worksheets from 2017 to 2024, including immediate-release and extended-release formulations recorded under standardized product names and medication codes.
The dataset captured reported private-sector dispensing records for controlled medicines at the product-year level. However, it did not include public-sector dispensing data, and completeness could not be independently audited by the authors. Therefore, the results should be interpreted as trends in reported private-sector methylphenidate dispensing in Costa Rica rather than as a direct measure of total national methylphenidate consumption. The dataset did not capture public-sector dispensing, unreported dispensing, informal or non-regulated use, stock availability, products purchased but not dispensed, patient-level treatment exposure, adherence, or medication actually consumed.
4.3. Administrative Codes and Product-Level Identification
Administrative codes were product-level identifiers used in the Ministry of Health controlled-medicine database to distinguish recorded methylphenidate-containing products by product code, recorded product name, strength, pharmaceutical form, and formulation. These codes were used for product identification, standardization, and aggregation. They were not patient, prescriber, prescription, pharmacy, or dispensing-transaction identifiers.
All methylphenidate-containing product codes identified in the private-sector dispensing section of the annual worksheets were reviewed. Products were included when the recorded product name, strength, and pharmaceutical presentation corresponded to methylphenidate. ES-030 was an administrative product code in the Ministry of Health dataset corresponding to immediate-release methylphenidate 10 mg tablets. Although ES-030 corresponded to a methylphenidate-containing product, it was excluded from the primary analysis because its annual dispensed-to-prescribed ratios showed substantial internal inconsistency. Its quantitative influence was therefore evaluated separately through sensitivity analysis.
4.4. Eligibility Criteria and Data Extraction
Eligible records were those corresponding to methylphenidate-containing products recorded in the dispensing section of each annual worksheet. Product identification was based on medication names containing methylphenidate or known commercial methylphenidate products available in the dataset.
For each eligible record, the following variables were extracted: calendar year, medication code, recorded product name, dispensed quantity, dose strength, dosage form, brand or generic designation, and formulation class. Records not corresponding to methylphenidate were excluded. After extraction and cleaning, the analytical dataset comprised year-by-product records of dispensed methylphenidate from 2017 to 2024.
4.5. Product Standardization and Formulation Classification
Product names were standardized according to brand or generic designation, dose strength, and pharmaceutical form. Standardization was performed to reduce duplication caused by spelling differences, naming variation, or inconsistent product descriptions across years.
Products were classified as immediate-release (IR) or extended-release (XR) according to the recorded product label, brand, dose strength, and dosage form. Non-retarded 10 mg tablet or compressed-tablet presentations were classified as IR. Products explicitly labelled as extended-release or “Retard,” as well as presentations corresponding to long-acting methylphenidate products, were classified as XR. XR presentations included 18 mg, 27 mg, 36 mg, and 54 mg tablets, and 10 mg, 20 mg, 30 mg, and 40 mg capsule presentations when recorded as extended-release or retard formulations.
Standardized presentations were generated by combining formulation class, dose strength, and dosage form, for example: IR 10 mg tablet, XR 36 mg tablet, and XR 20 mg capsule.
4.6. Outcomes
The primary outcome was annual reported dispensed methylphenidate volume, expressed as recorded dispensed boxes. This outcome represented the administrative quantity recorded in the annual controlled-medicine reports and should be interpreted as reported dispensed boxes rather than verified patient-level pharmacy dispensing events. A complementary analysis expressed reported dispensed volume in DDDs, using the World Health Organization (WHO) Collaborating Centre for Drug Statistics Methodology reference value of 30 mg/day for oral methylphenidate. All outcomes were calculated overall and separately for IR and XR formulations.
From box-based reported dispensed volume, we derived annual formulation-specific volume and share, XR-to-IR ratio, year-over-year absolute and relative change, cumulative volume by formulation and presentation, and compound annual growth rate. We also estimated annual percent change using exploratory log-linear regression models for total, IR, and XR reported dispensed boxes.
Formulation-specific shares used total annual reported methylphenidate dispensing as the denominator. The XR-to-IR ratio was calculated by dividing annual XR boxes by annual IR boxes. Year-over-year percentage change used the previous year as the denominator, and compound annual growth rate used the 2017 and 2024 values.
For the DDD-based analysis, box-level counts were first converted into dosage units by multiplying the number of recorded dispensed boxes by the total number of tablets or capsules contained in each corresponding box. The number of dosage units per box was assigned according to the administrative product description available in the Ministry of Health dataset. In the analytical dataset, methylphenidate products were treated as containing 30 dosage units per box, and this assumption was applied consistently across products. Total milligrams dispensed were then calculated by multiplying the estimated number of dosage units by the labeled strength of each tablet or capsule. DDDs were obtained by dividing total milligrams by the WHO DDD of 30 mg/day for oral methylphenidate. DDDs were interpreted as aggregate dose-standardized dispensing estimates, not as prescribed pediatric doses, completed patient-level dispensing, medication consumption, or patient-level exposure.
4.7. Definition of the Recorded Dispensing Quantity
In the source administrative dataset, the recorded dispensing quantity corresponded to reported dispensed medication boxes recorded in annual controlled-medicine administrative reports, rather than to individual tablets, capsules, prescriptions, patients, or dispensing transactions. Therefore, the primary analyses describe the annual number of reported dispensed boxes of methylphenidate by formulation and standardized presentation. These counts should not be interpreted as numbers of patients, prescriptions, treatment episodes, tablets or capsules consumed, or individual doses administered. Because the authors received annual aggregated product-level extracts, it was not possible to independently verify whether the reported dispensed boxes represented only completed pharmacy dispensing to patients or whether the reporting process could also include administrative corrections, reconciliations, or stock-related adjustments. For this reason, the outcome is referred to throughout the manuscript as reported dispensed boxes.
For dose-standardized analyses, box counts were converted into dosage units according to the number of tablets or capsules per box, then into total milligrams using labeled strength, and finally into DDDs using the WHO reference value of 30 mg/day for oral methylphenidate. Because the dataset did not include patient-level dosing, age, diagnosis, adherence, or treatment-duration information, DDD-based estimates should be interpreted only as aggregate drug-utilization metrics.
4.8. Data Analysis
Descriptive analyses were used to summarize private-sector methylphenidate dispensing trends. Annual volumes were presented as absolute counts and percentages. Cumulative volumes were summarized across the full study period and stratified by formulation and standardized presentation.
Temporal variation was described using annual trend plots, year-over-year absolute-change plots, and presentation-level bar charts. To provide statistical support for temporal dispensing trends, we performed an exploratory log-linear regression analysis using calendar year as a continuous independent variable and the natural logarithm of annual dispensed boxes as the dependent variable. Separate models were fitted for total methylphenidate boxes, IR boxes, and XR boxes. Annual percent change was calculated as [exp(β) − 1] × 100, with 95% confidence intervals and p-values derived from the regression slope. This analysis was interpreted as descriptive trend support rather than causal inference, given the aggregate ecological design and the limited number of annual observations.
All analyses were performed using Python version 3.13.5. Data cleaning and aggregation were conducted with pandas version 2.2.3, and figures were generated using Matplotlib version 3.10.8. Regression analyses were performed using standard linear modeling procedures.
4.9. Sensitivity Analysis for ES-030
Administrative code ES-030 corresponded to immediate-release methylphenidate 10 mg tablets dispensed as boxes containing 30 tablets. ES-030 was an administrative product code in the Ministry of Health dataset and was not a patient, prescriber, prescription, pharmacy, or dispensing-transaction identifier. This code was excluded from the primary analysis because its annual dispensed-to-prescribed ratios showed substantial internal inconsistency, ranging from 0.5 to 586.4 among calculable years, with particularly large discrepancies during 2019–2021.
To assess the robustness of the primary findings to the exclusion of ES-030, we conducted a sensitivity analysis in which ES-030 was included as immediate-release methylphenidate 10 mg boxes containing 30 tablets per box. In this sensitivity scenario, ES-030 was added to the annual immediate-release methylphenidate volume. DDDs for ES-030 were calculated using the same method applied to the primary DDD analysis: recorded boxes × 30 tablets per box × 10 mg per tablet, divided by the WHO DDD reference value of 30 mg/day for oral methylphenidate.
Sensitivity results were compared with the primary analysis in terms of annual and cumulative dispensed boxes, DDDs, growth indicators, and population-standardized rates. Sensitivity analyses were descriptive and were used to quantify the potential influence of ES-030 on the magnitude, timing, and formulation-level distribution of methylphenidate dispensing estimates.
4.10. Ethical Considerations
This study used secondary administrative data aggregated at the product-year level. The investigators analyzed only aggregate product-year administrative data and never received individual-level or identifiable human data. The dataset did not contain patient identifiers, individual prescriptions, diagnoses, age, sex, prescriber information, pharmacy identifiers, dispensing-transaction identifiers, or other personal health information. Therefore, the analysis did not involve identifiable human-subject data. For this reason, formal ethics committee review was considered not applicable. Use of the aggregated dataset for research and statistical analysis was authorized by the relevant data custodian. All results are presented at the aggregate level for drug-utilization research purposes.




 ,
,