


Abstract
Background: The purpose of this preliminary study was to evaluate the use of the Zipf–Mandelbrot (ZM) law to mathematically model the percentage occurrence of adverse drug reactions (ADRs), as a function of rank, reported to the United States Food and Drug Administration Adverse Event Monitoring System (US FDA AEMS). Methods: Six commonly used but pharmacologically different hospital-based medications were examined. Nonlinear curve fitting of the two ZM coefficients was utilized to model the percentage occurrence of ADRs in a hierarchical or rank order for each drug examined. Results: The reported complications and their associated occurrence rates for all six medications were accurately modeled using the ZM law. Those medications that have a greater percentage of reported ADRs within their first ten ranks were also found to have a greater negative slope. Furthermore, a natural logarithmic transformation of both the reported FDA data and the ZM law-derived predicted values demonstrated a consistent near-linear relationship, which was statistically significant. The ratio of the coefficients of the ZM law, , was also found to be a potentially useful index that allows for describing and comparing the overall shape of the medication-specific distributions. Conclusions: Based upon this preliminary examination, the ZM law appears to be applicable to the mathematical modeling of US FDA-reported ADRs. Additional research to assess and utilize this law for the analysis, economic management, and possible improvement in patient outcomes may be warranted.
1. Introduction
Adverse drug reactions (ADRs) represent a significant source of morbidity and mortality. Therefore, these medication-based complications negatively impact both the cost and quality of healthcare [1,2].
The Zipf–Mandelbrot (ZM) law has been applied to mathematically model a wide range of phenomena, including linguistics [3], insurance risk [4], scientific citations [5], web hits [6], economics [7], and urban population [8]. Furthermore, it is frequently referred to as the Pareto–Zipf distribution [9].
This paper examines the applicability of the ZM law to mathematically model US FDA-reported ADRs for the following six medications: fentanyl, propofol, albumin, succinylcholine, ketamine, and isoflurane. Although these six commonly used medications are pharmacologically dissimilar, their ADRs are collectively represented using this model with medication-specific coefficients. The ZM law is an appropriate choice for modeling these data because ADRs are highly skewed and inherently rank-based. Consequently, a small number of common ADRs account for the majority of reports, while a multitude of less frequent reactions constitute the long tail of the distribution.
For the purposes of this research, the ZM law will be represented as
where represents the percentage occurrence of each FDA adverse event associated with a sequential rank, . Moreover, is a dimensionless natural integer ranging from one to N, where N represents the total number of unique medication-specific ADRs.
Note that the maximum value for always occurs at , which is the most frequently reported adverse reaction, whereas represents the percentage occurrence of the least reported adverse reaction, which occurs at
Furthermore, , , and are all positive real numbers. Also, and . It should be noted that small positive values for , which are less than one, do not generate a sufficient skewness to adequately represent these clinical data.
In addition, coefficients and are both dimensionless and are determined using curve-fitting. When , the ZM law reduces to a basic power-law distribution. Moreover, the inclusion of improves the fit for the initially ranked observations compared to a basic power law. Notably, coefficient is referred to as the Mandelbrot shift parameter.
The following limits are therefore straightforward and are fundamental in understanding the properties of the ZM law:
and
Specifically, these limits reinforce the behavior of the “long tail” of the ZM law, where less common and rare ADRs occur. In addition, the behavior of the ZM law, within its initial ranks, is extremely important given that the most common and clinically important ADRs occur within this region.
By definition, the sum of the total occurrences of ADRs expressed in percent form is
However, the reader should be cognizant that the original US FDA data is supplied or downloaded in decimal form:
For this study, the nonlinear ZM law is statistically evaluated by comparing it to the medication-specific reported data:
Therefore, the reported adverse events for each medication’s ADRs, , will be compared to the predicted adverse events by utilizing the ZM law and by curve-fitting coefficients and .
Additionally, the ZM law can be differentiated with respect to rank:
The above interrelationship has dimensionless units of and readily explains the slope of at each rank. Note that is consistently negative.
Inspection of the above derivative also demonstrates that for a given value of increasing values of and/or yields an overall diminution in the magnitude of the slope of
Therefore,
and
Furthermore, for given values of both and an increasing value of will also generate an overall diminution in the magnitude of the slope of :
To compare different medications and their distributions of ADRs, it is also helpful to quantify a medication-specific average slope within a specific range of ranks. Note that: and and :
This is equivalent to,
Note that the area under a curve is approximately proportional to the summation of the points along a curve. Therefore, the definite integral of the ZM law, is an analogous function to the summation of the points along the curve:
Equivalently,
Thus, illustrates how coefficients and interact with the summation process. The above equation also has the following clinical constraints: , and Inspection of demonstrates that, for a given value of decreasing values of will lead to a greater value of and therefore a greater summation over the specified range of to . The value of and the range-based summation will also increase with decreasing values of for a given value of .
In addition to , the summation of sequential points along a specific ZM distribution, , provides useful information when comparing different medications with different distributions of ADRs. Note again that and
An equivalent expression is:
Examination of Figure 1 demonstrates that the medication-specific values for tend to coalesce at approximately . Therefore, the use of both the sum and average derivative, based upon the first ten ranks, is particularly beneficial when comparing the various medications’ different ADR distributions (See: Section 2). Furthermore, the majority of clinically significant ADRs occur within this initial region. The ten most prevalent ADRs and their corresponding ranks for each of the six medications examined are provided in Appendix A.
A natural logarithmic transformation has also been utilized for additional statistical analysis:
which is equal to
Inspection of the above equations demonstrates that the natural logarithm function operates on the unitless decimal form of both the reported data and the predicted quantities. This transformation also results in an approximate linearization of the predicted vs. the reported values.
Thus, with increasing rank, ; therefore, Consequently, the natural logarithm of a reported ADR and the natural logarithm of its rank will become approximately proportional as increases:
Moreover, the ZM law can also be represented using an exponential equation. This helps to explain its fundamental “exponential-like” mathematical properties:
2. Results
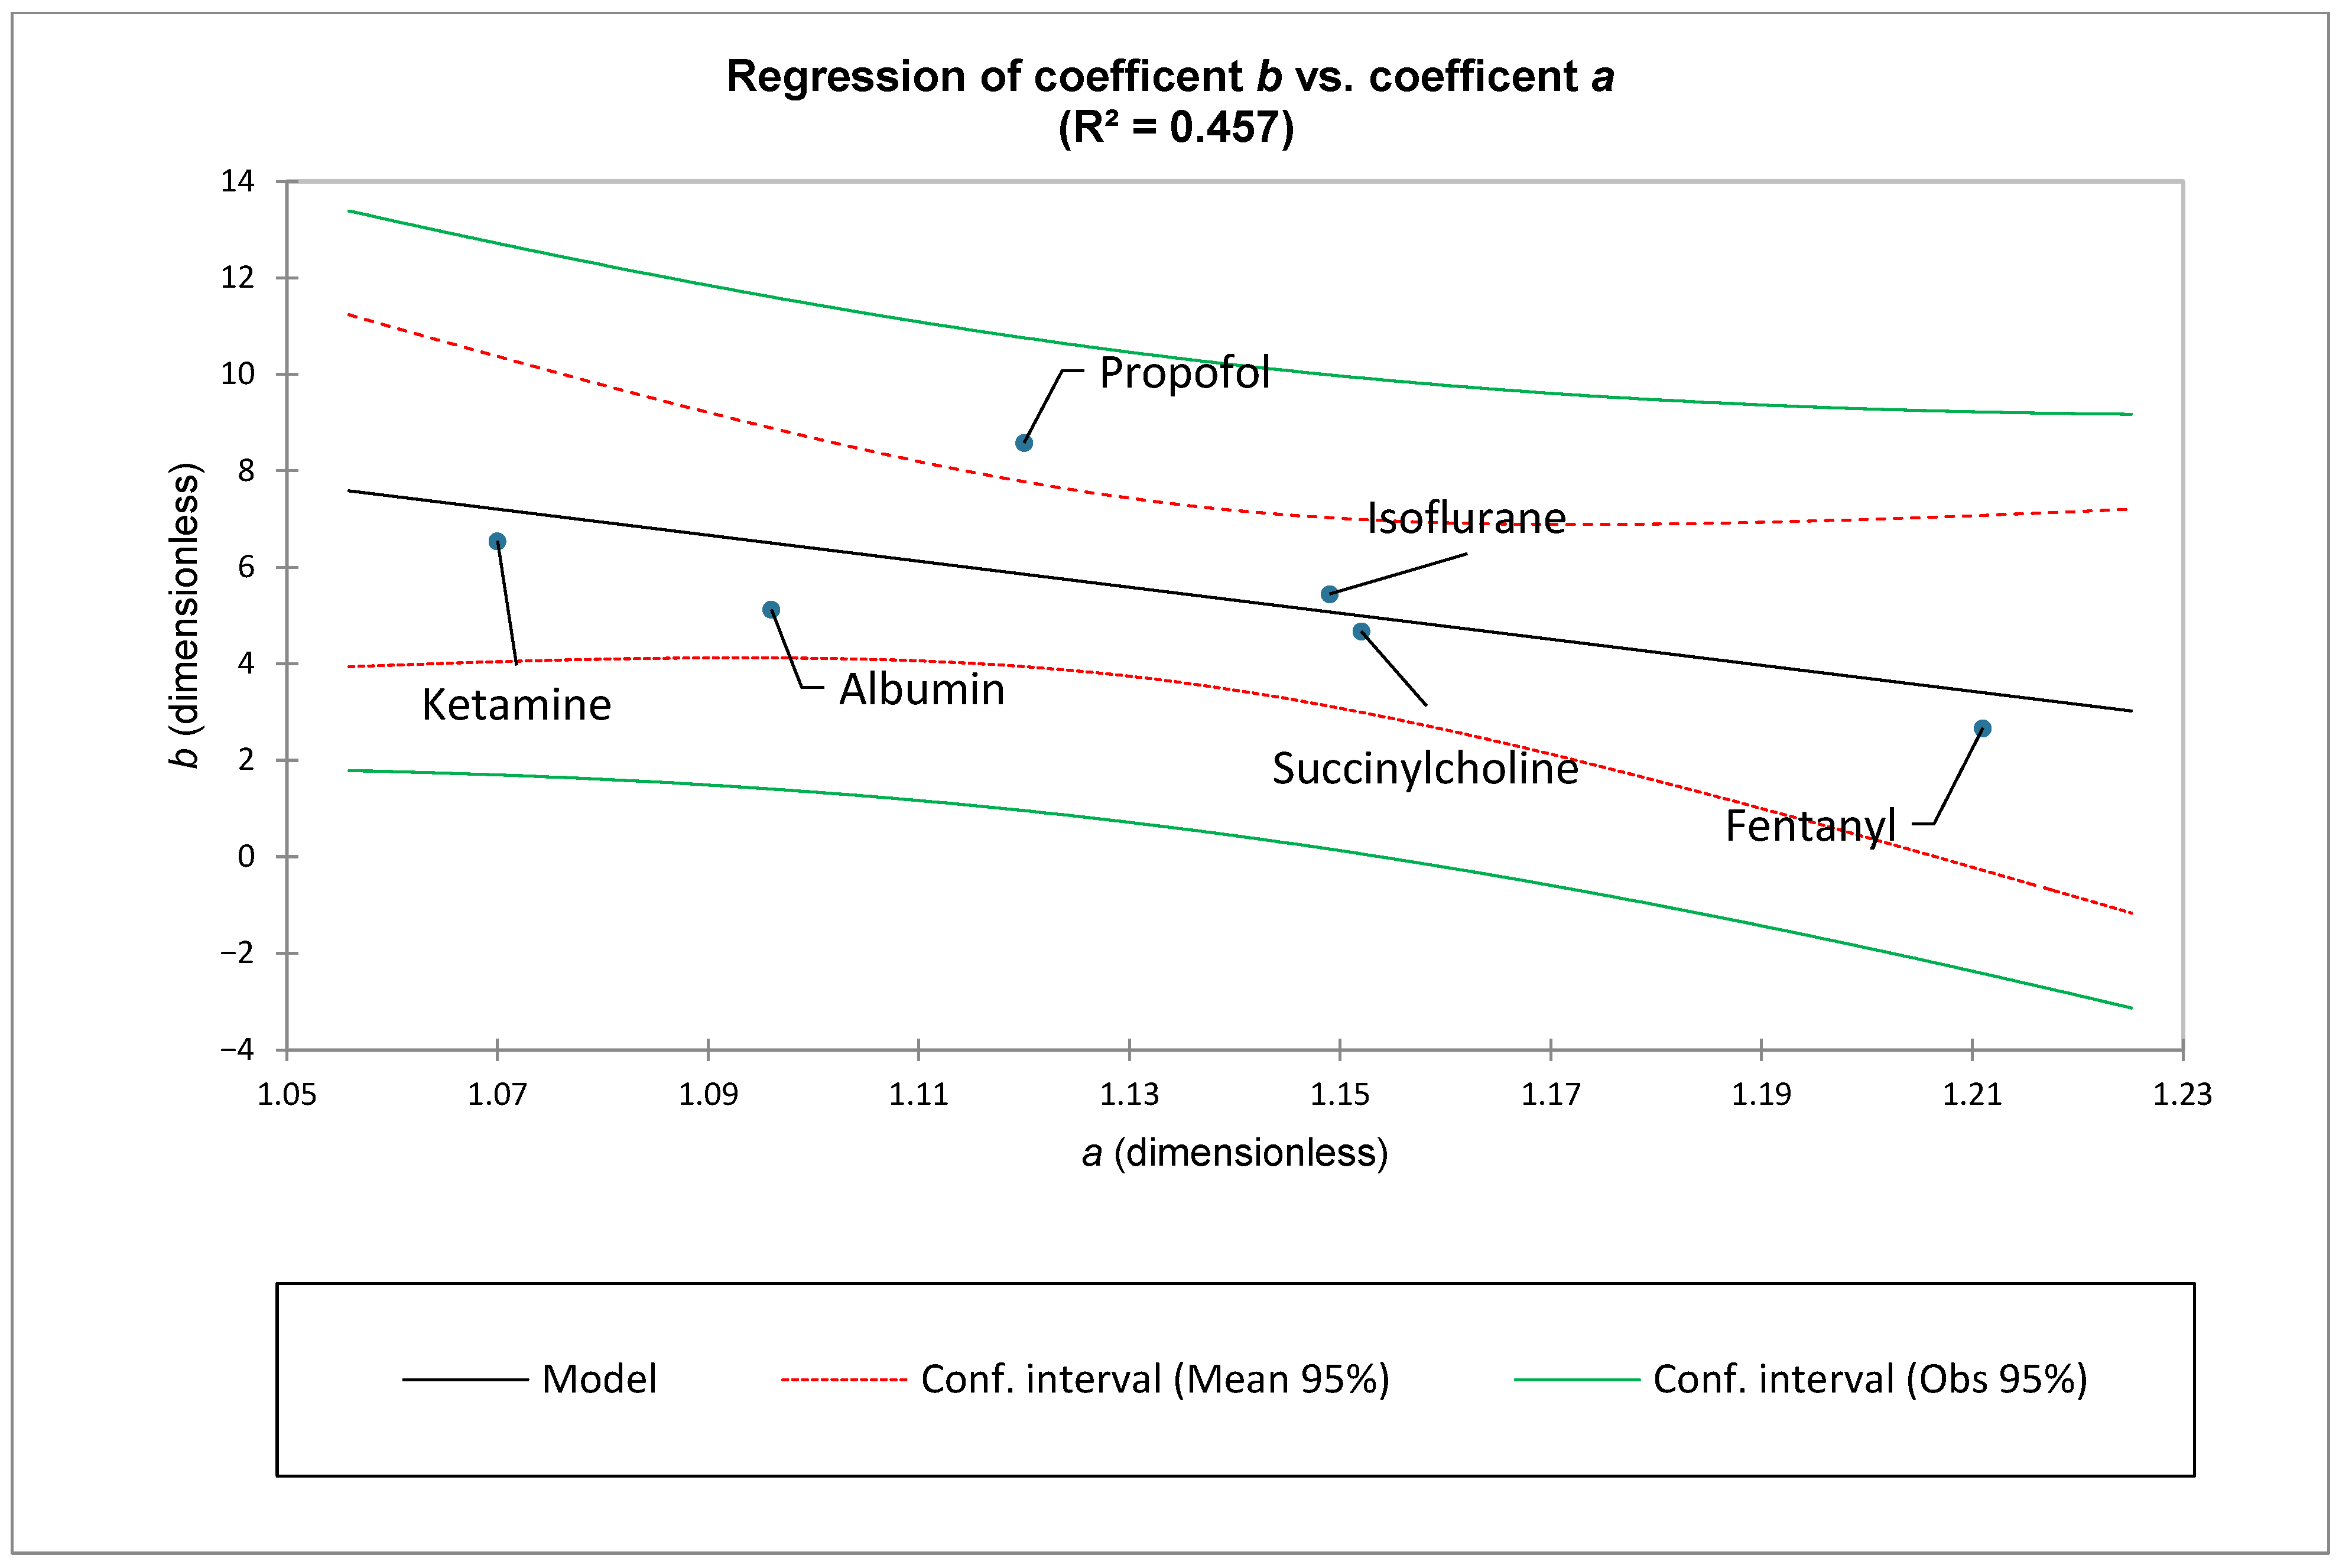
Figure 1 demonstrates the predicted adverse reactions for all six medications utilizing the ZM law. Table 1 and Figure 2 show the medication-specific values for both and . Figure 2 also documents a slight negative correlation between coefficients and .
Table 1.
Results of nonlinear and natural logarithmic curve fitting. * p < 0.0001.
Figure 1.
A comparison of the ZM law for each of the six medications examined. These graphs were generated using their medication-specific predicted values based on curve-fitting coefficients and .
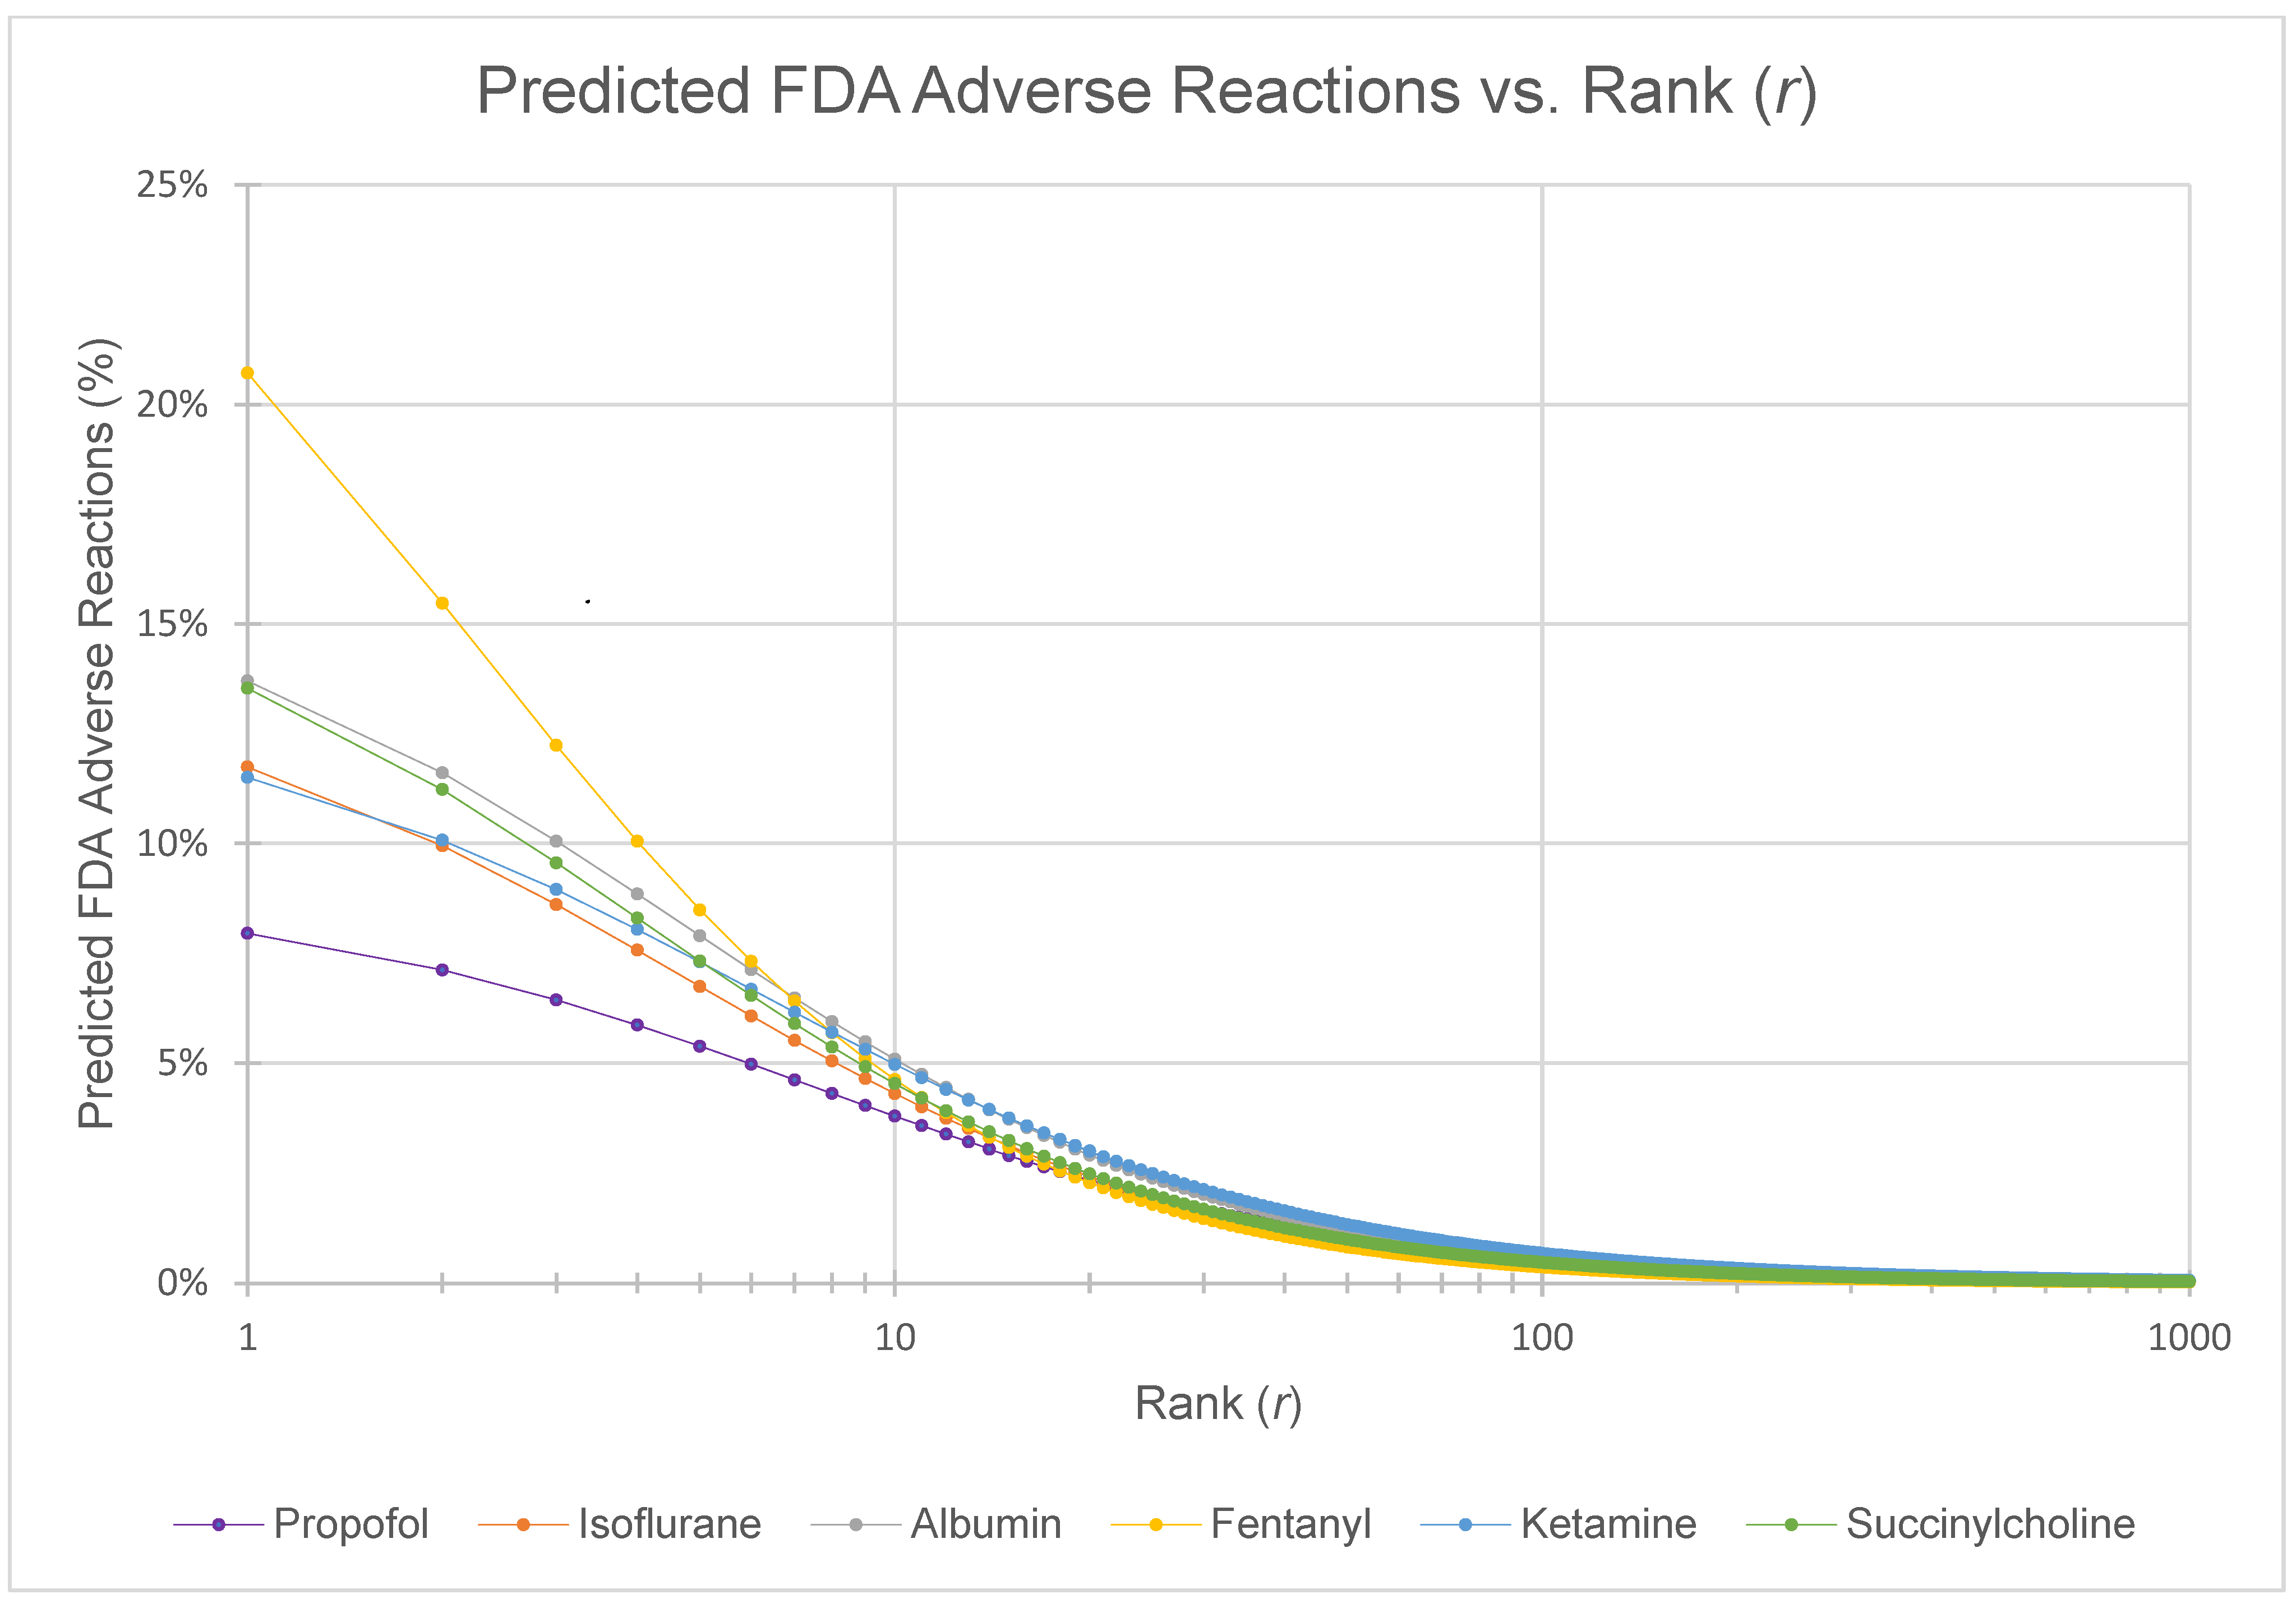
Figure 2.
Coefficients and are illustrated for each medication. Note that some negative correlation is evident.
Furthermore, Table 1 and Appendix B illustrate the associated root mean square error as a function of percentage, RMSE (%), for each medication. Note that Appendix C shows the derivation of RMSE (%) based on RMSE (decimal format).
In addition, a natural logarithmic transformation was also calculated for each value of and its associated predicted value. This generated medication-specific approximate linear models and associated coefficients of determination, R2 (see Table 1 and Appendix B). This transformation process also yielded correlations that were statistically significant for each medication.
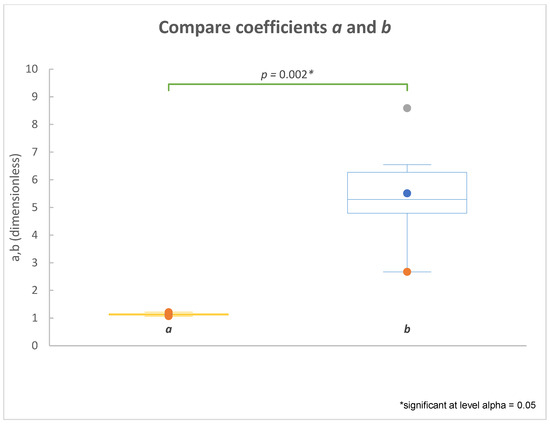
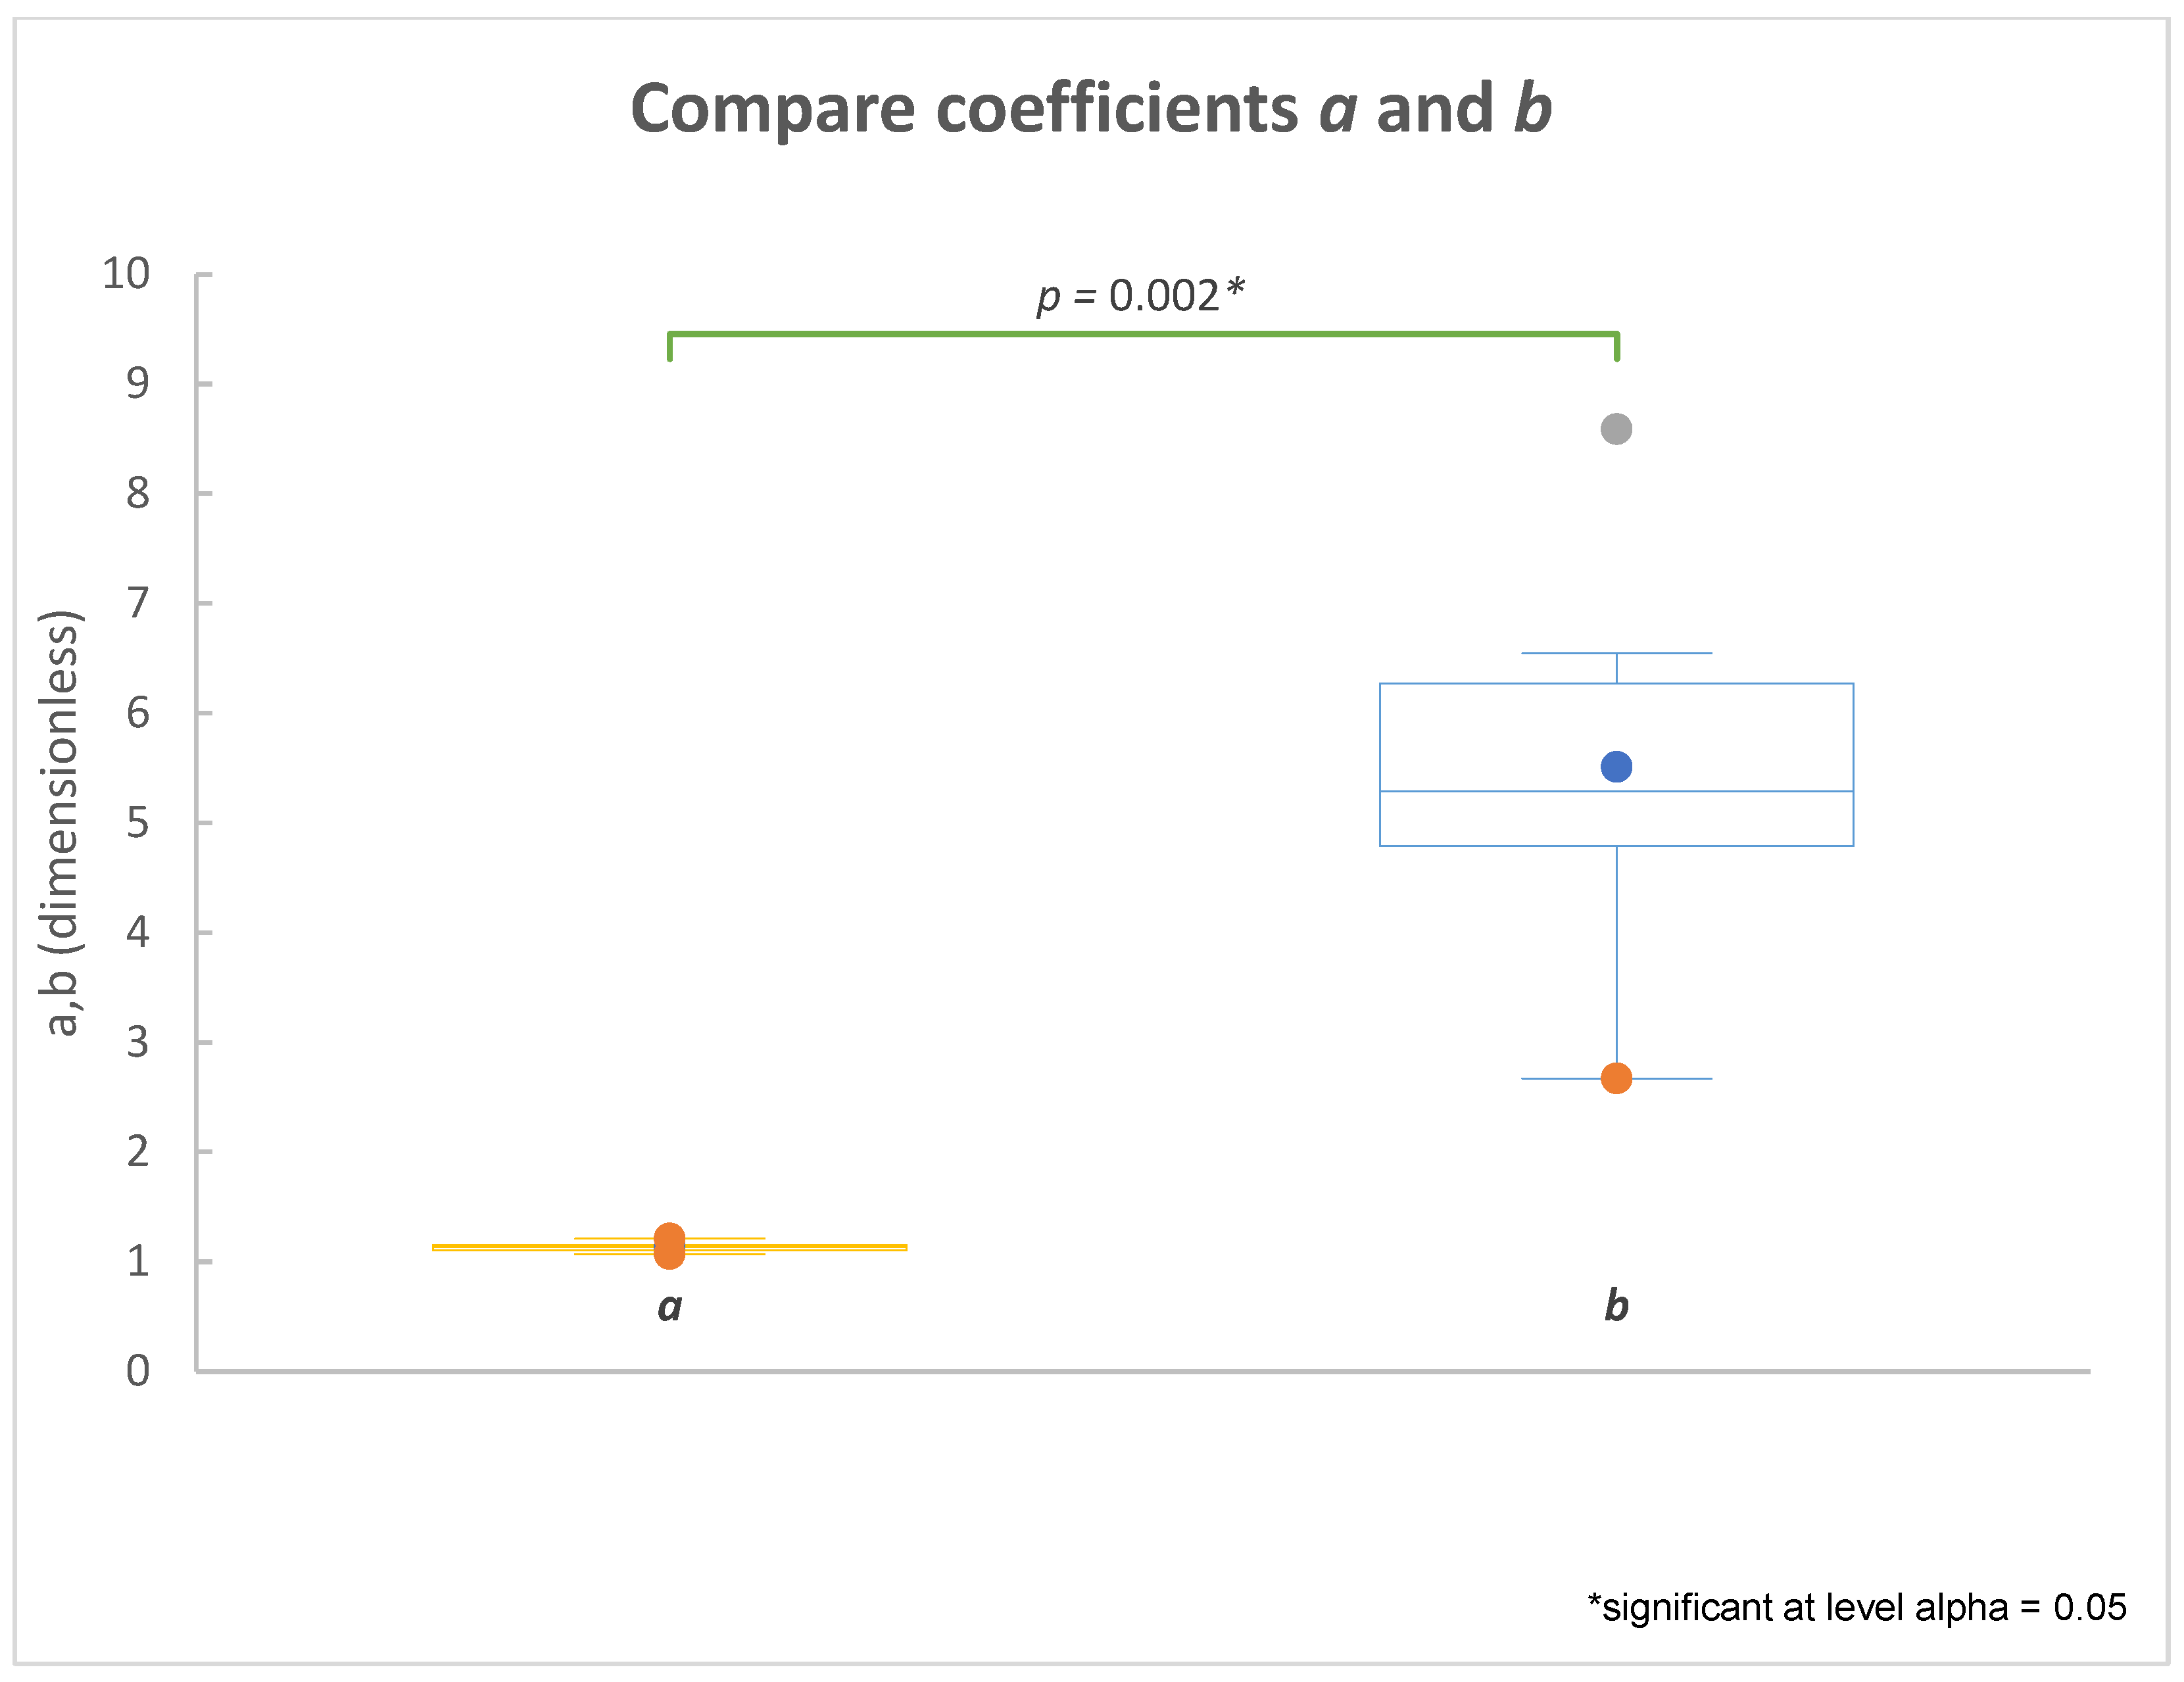
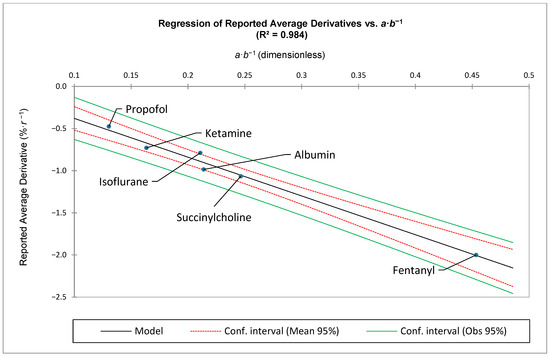
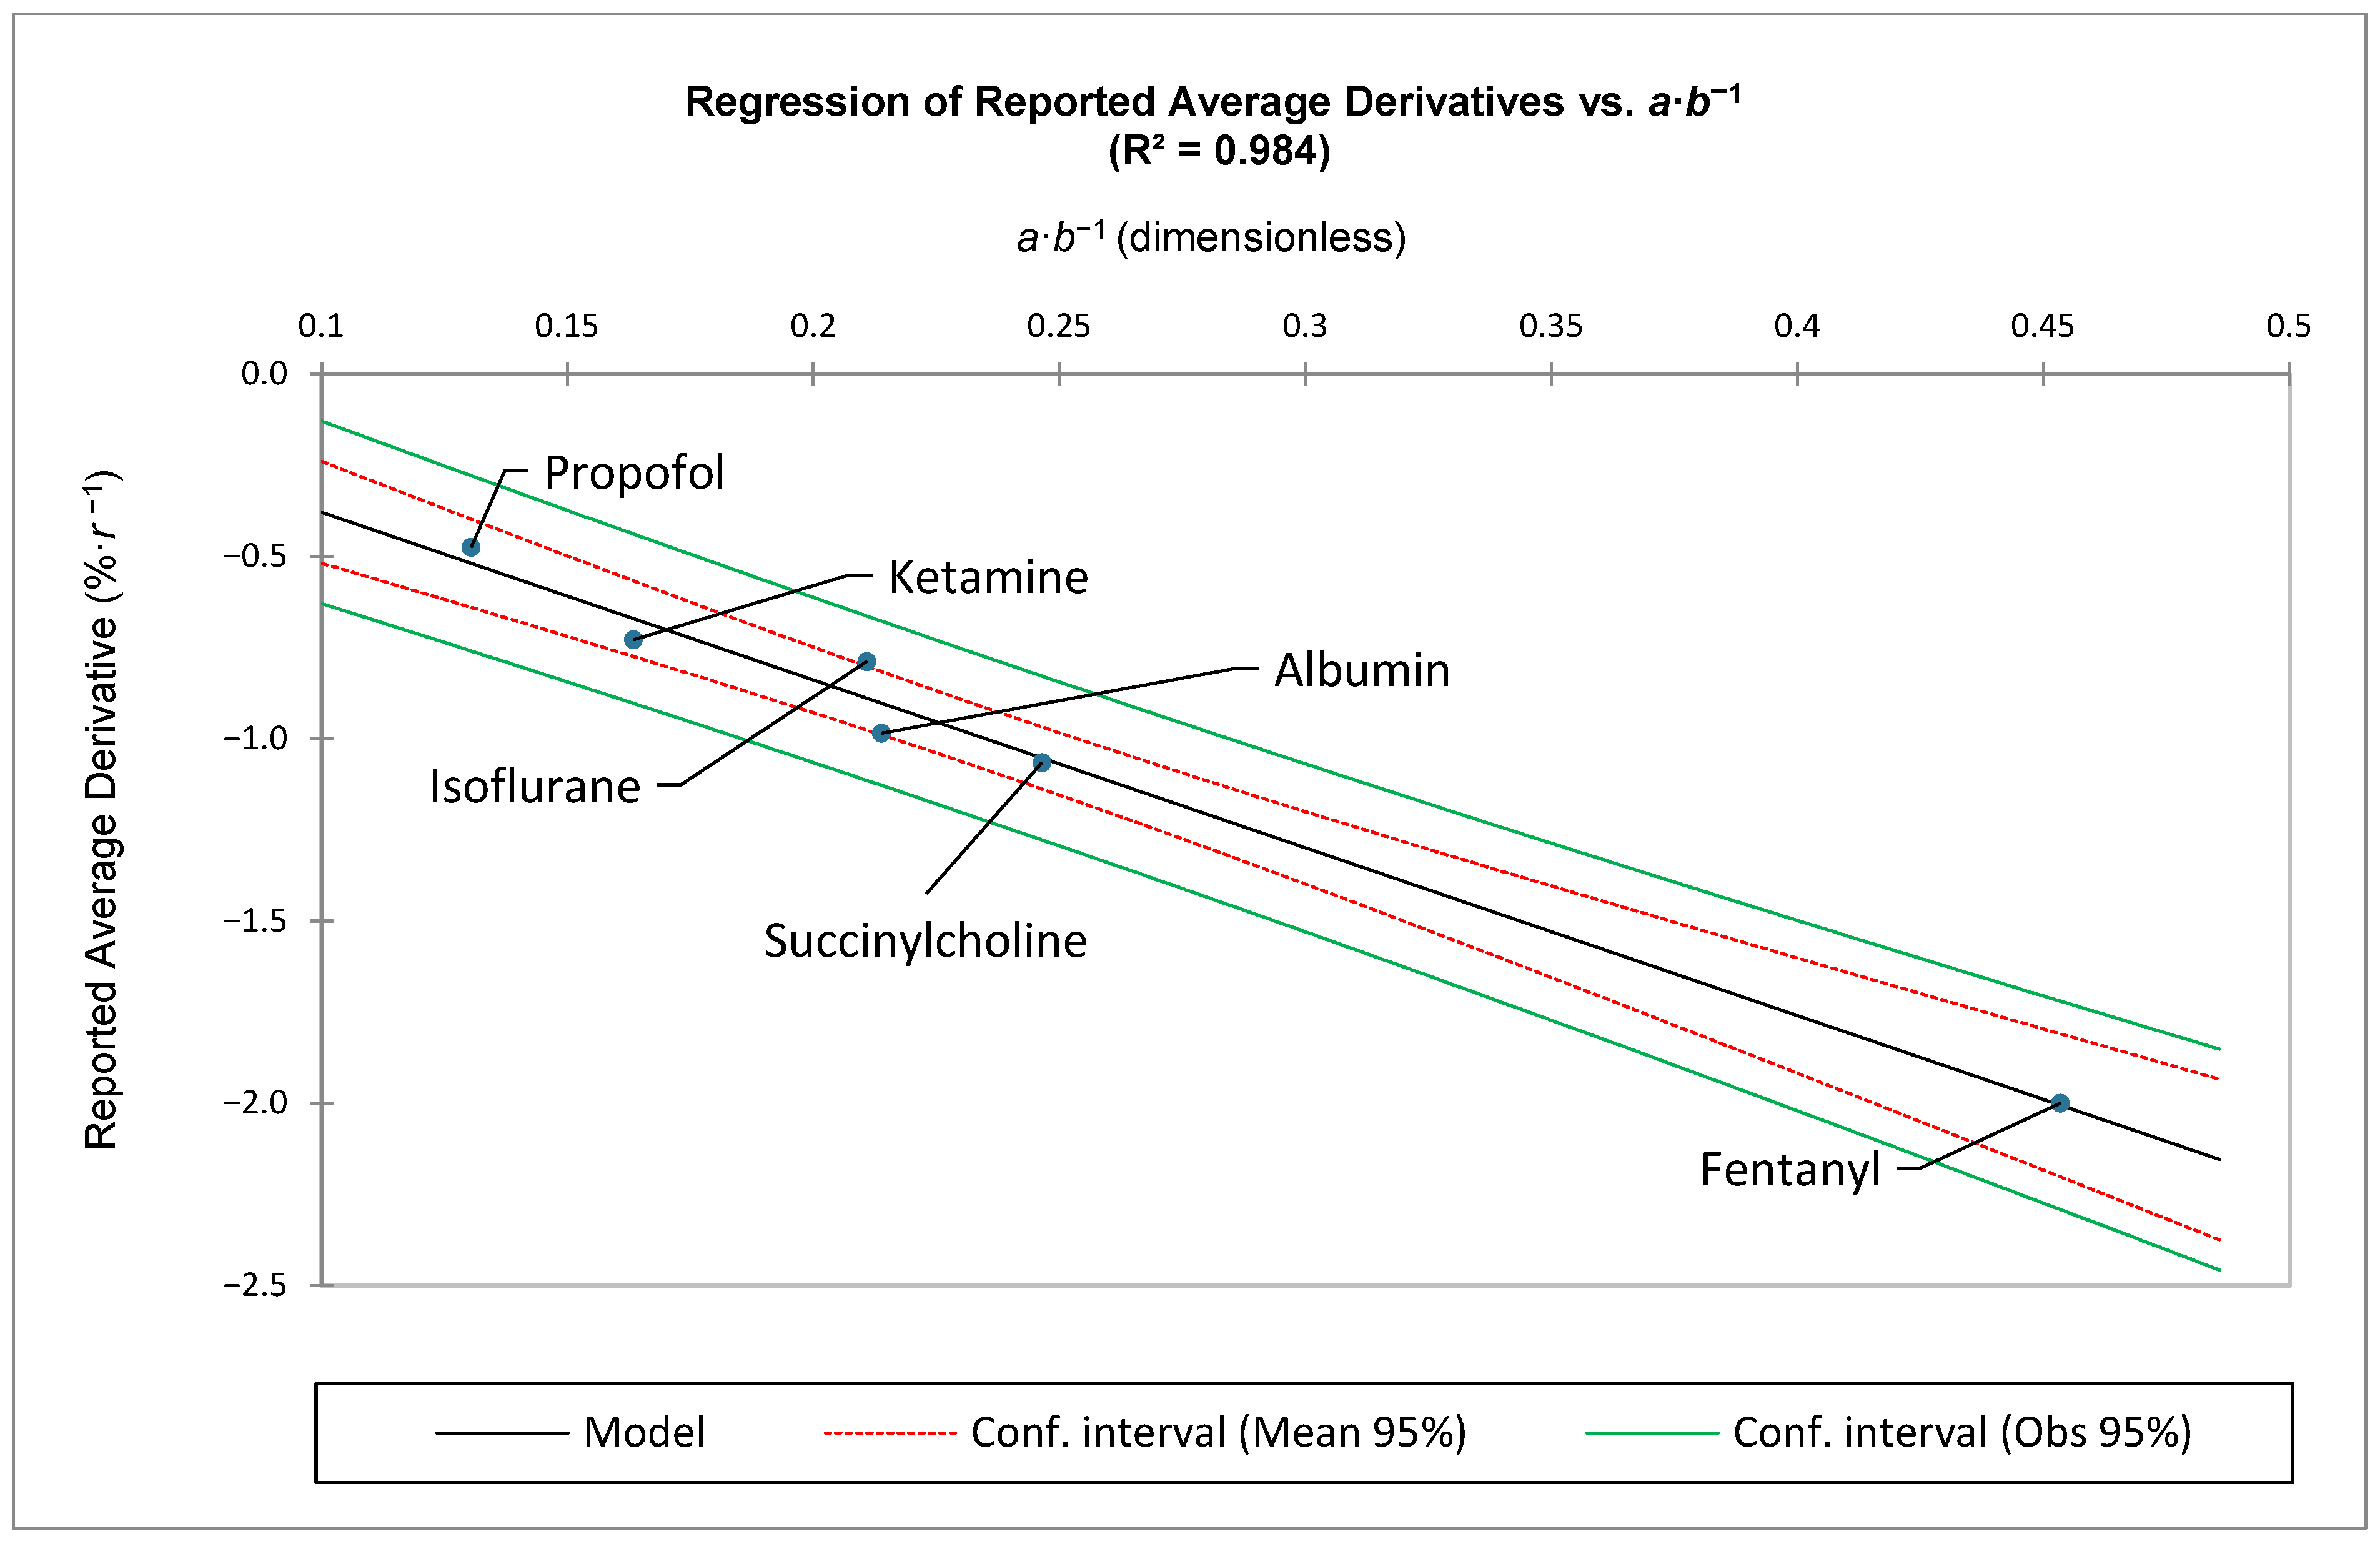
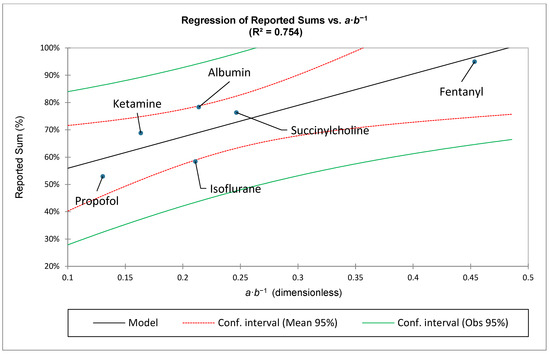
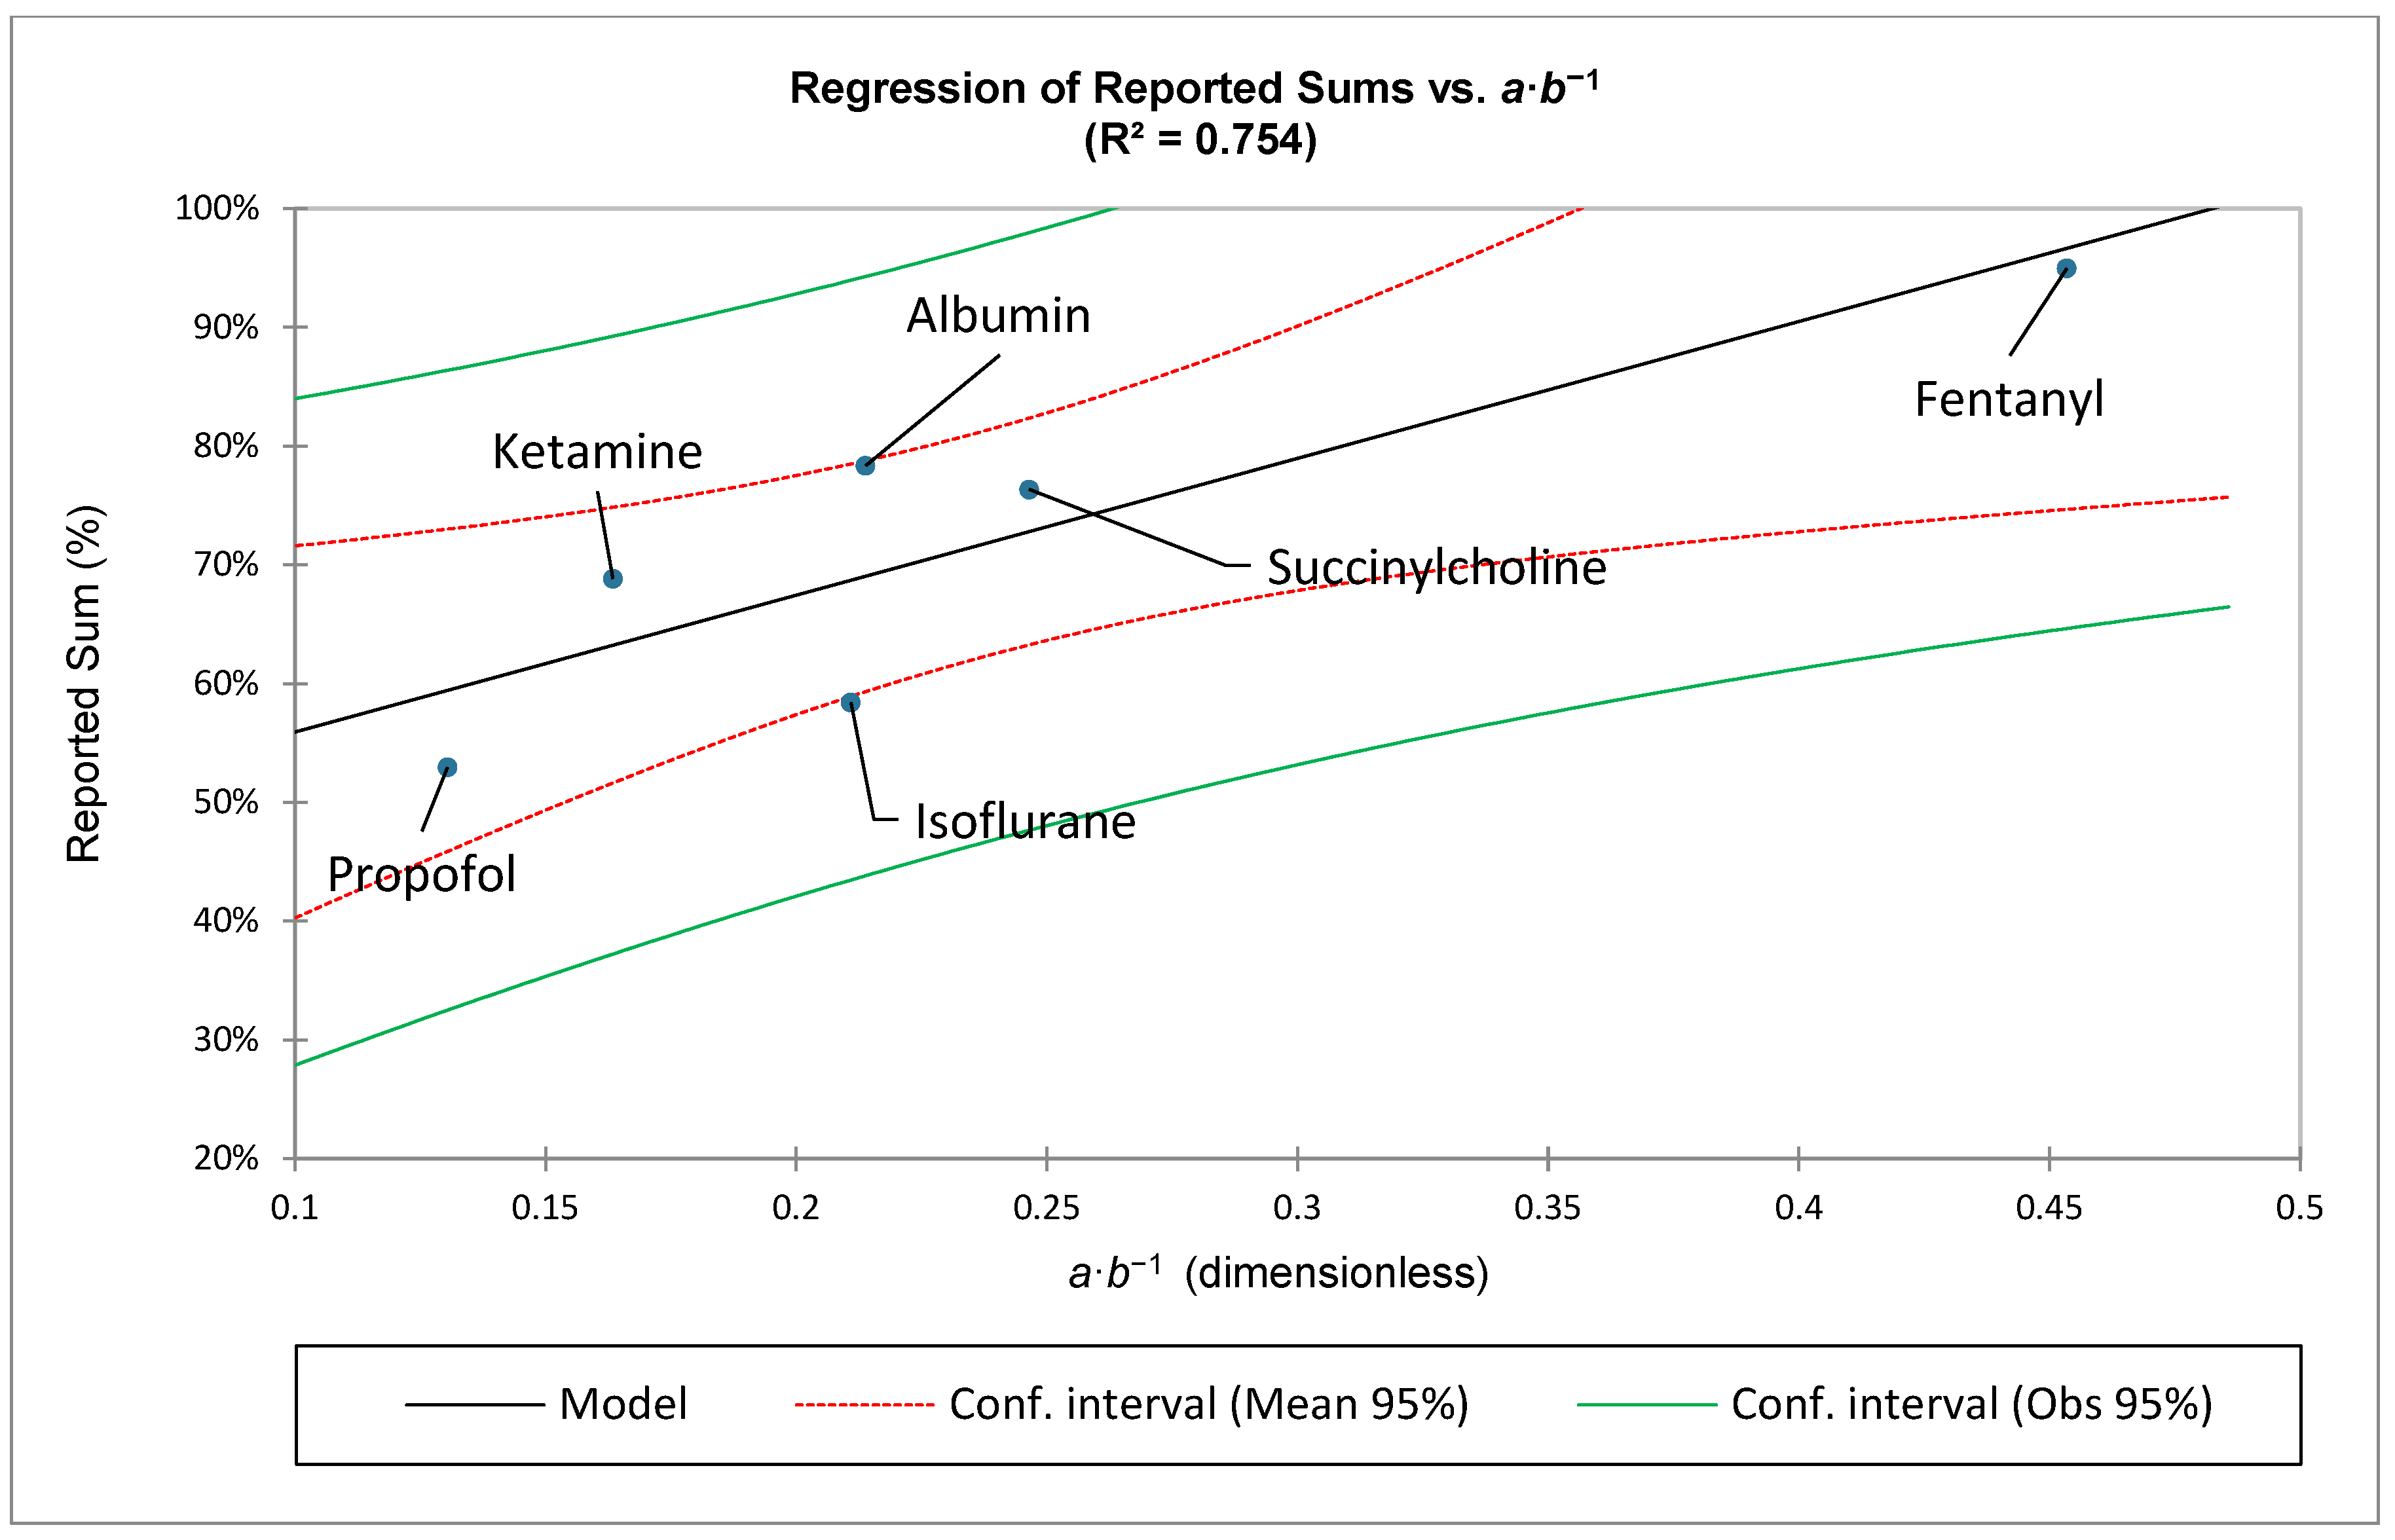
Table 1 and Figure 3 also document the dimensionless ratio: . This ratio was found to negatively correlate with the reported average derivative and positively correlate with the sum of the ADRs. The average derivative and sum of ADRs for each medication were calculated using only the ADRs associated with the top ten ranks (Table 2 and Figure 4 and Figure 5).
Figure 3.
A statistical comparison of coefficients and .
Table 2.
Reported and predicted sum and average derivatives. Note that these are based upon the first ten ranks.
Figure 4.
The ratio of negatively correlates with the reported average derivative for each medication.
Figure 5.
The ratio of correlates with the reported sum for each medication.
Inspection of Table 1 and Figure 3 demonstrates that coefficient tends to have a near-uniform approximate value of slightly greater than one, whereas coefficient has a range of approximately 2.67 to 8.59.
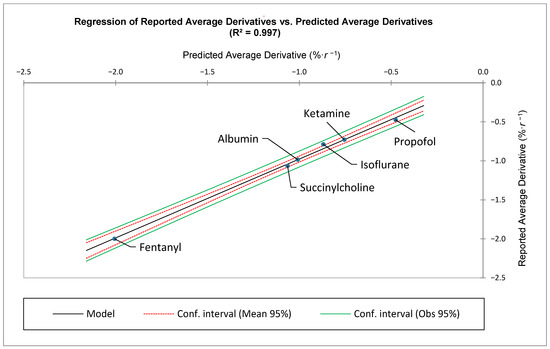
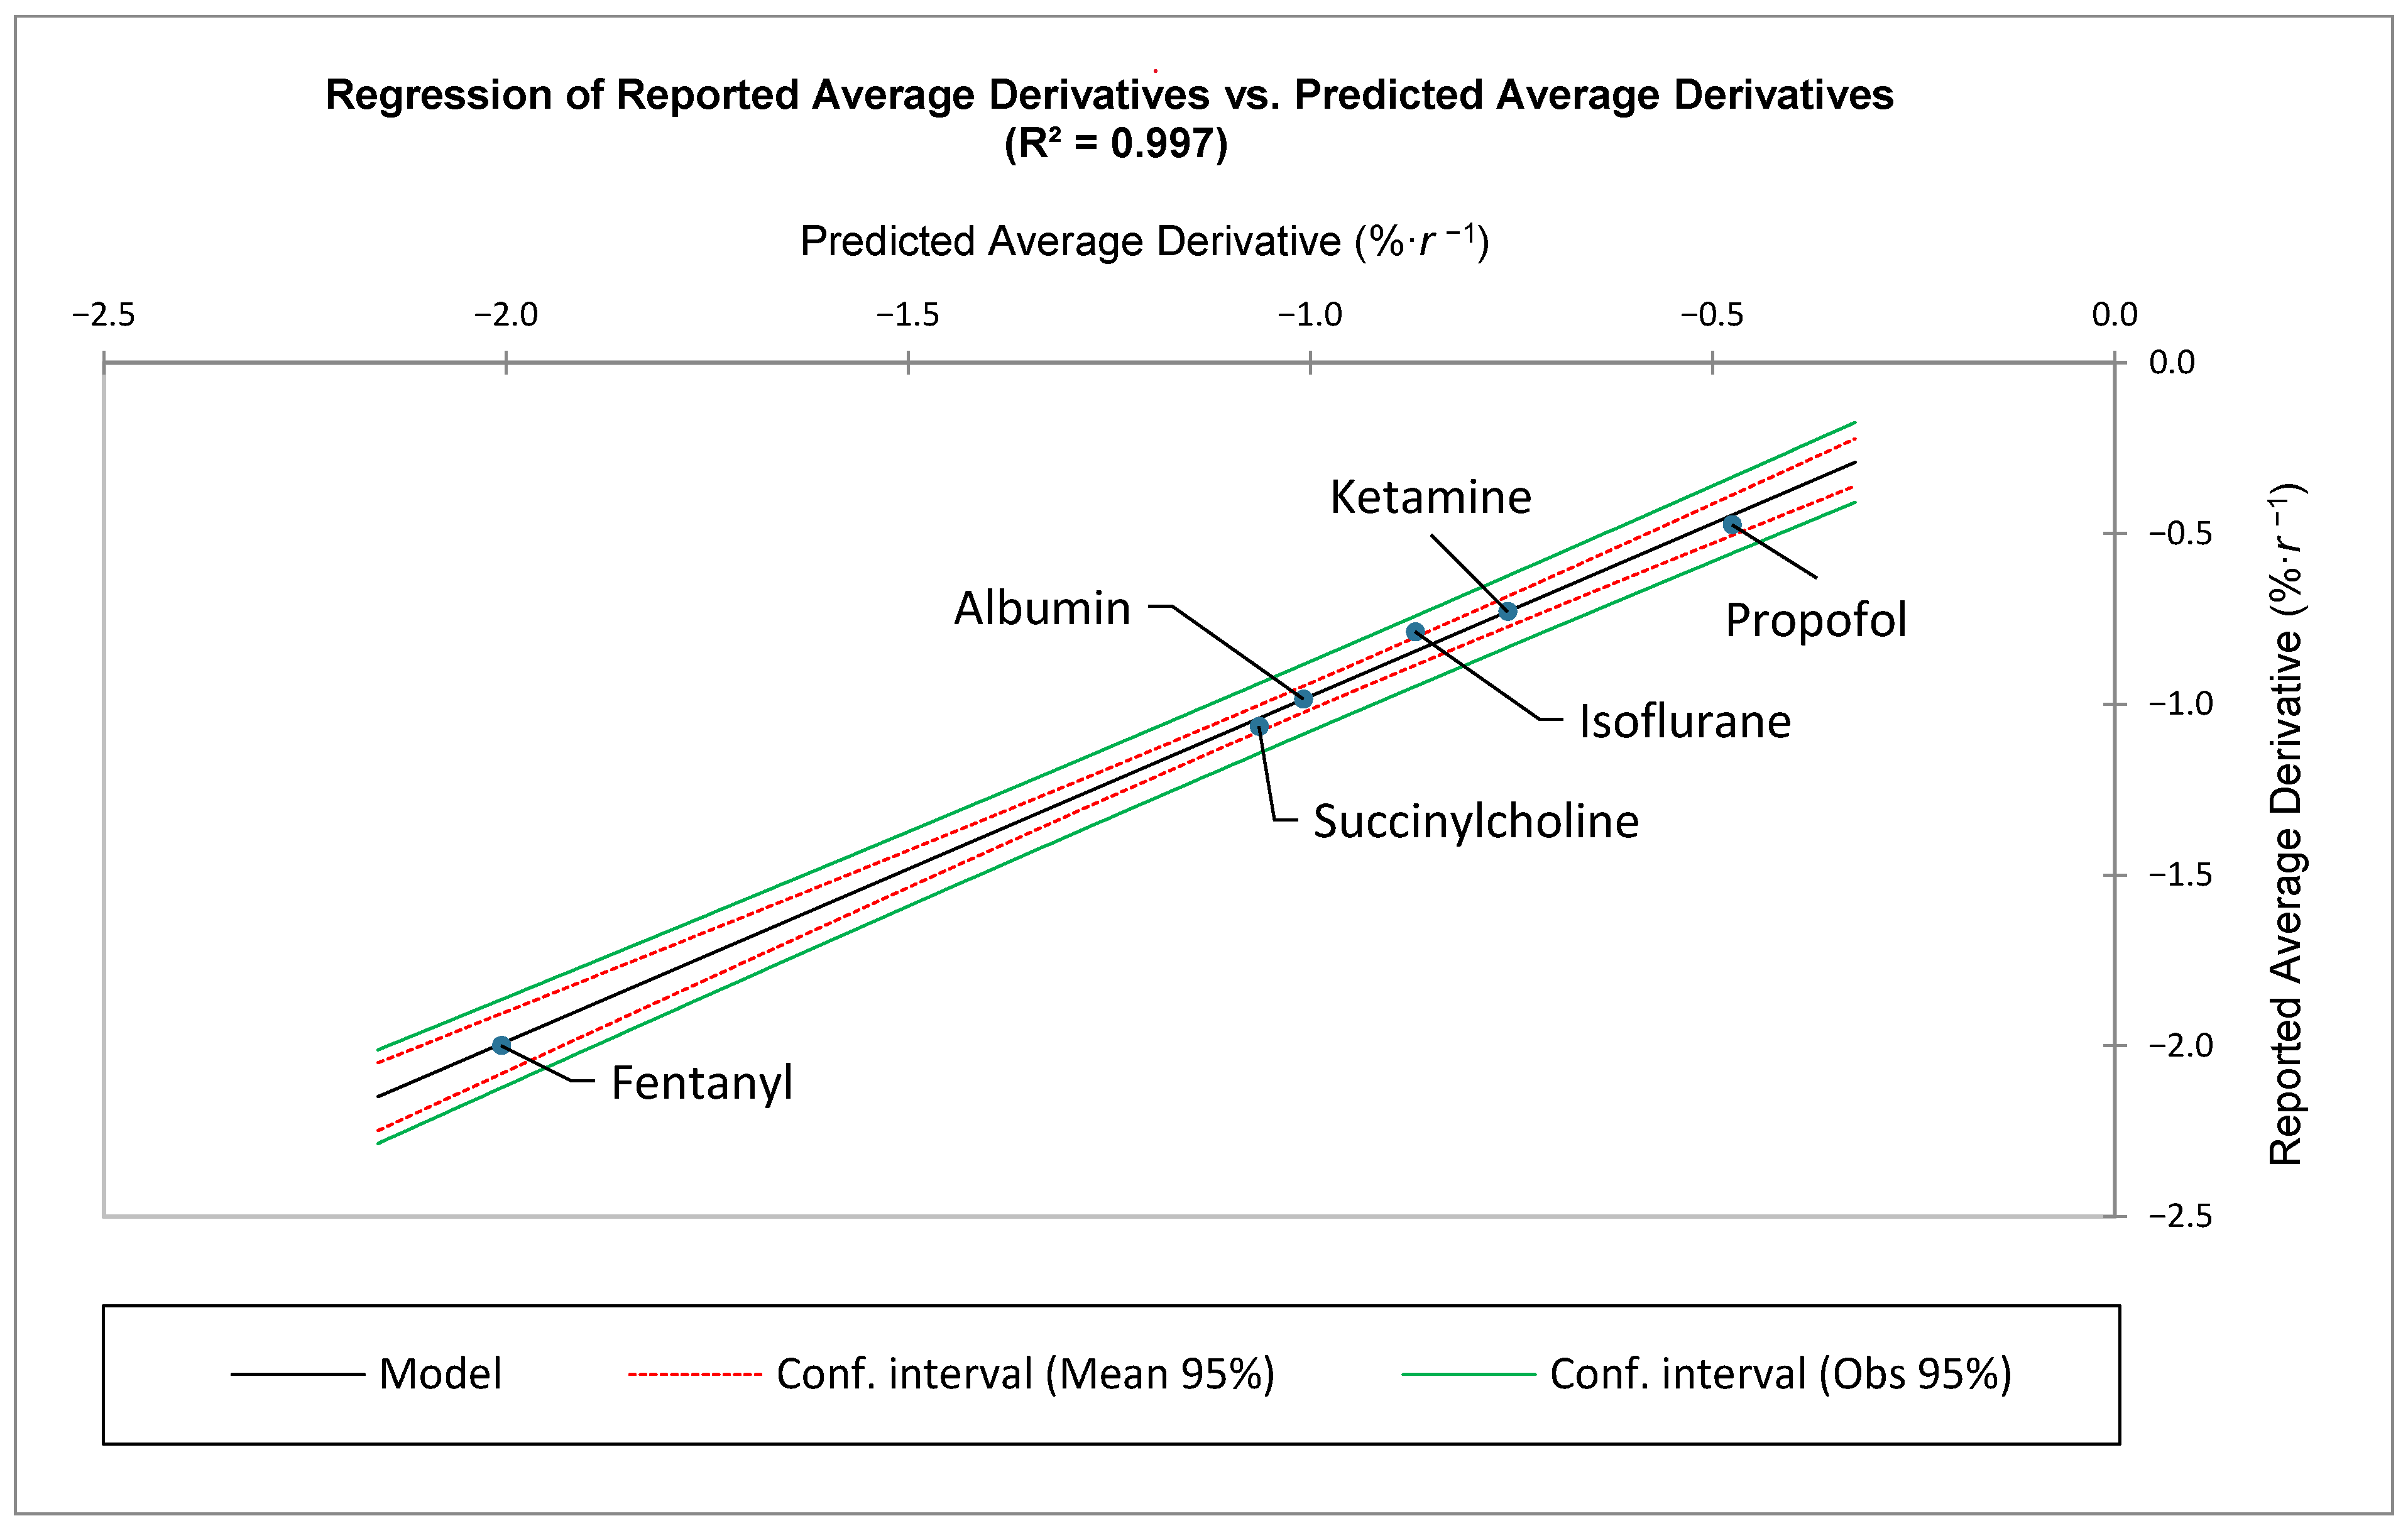
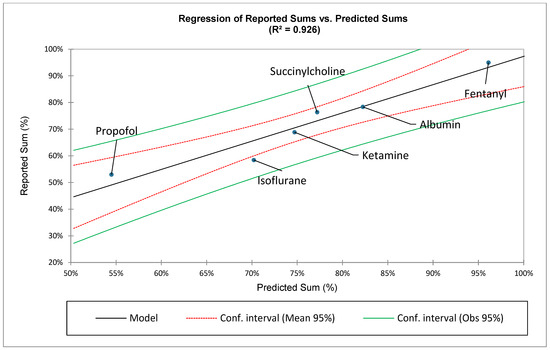
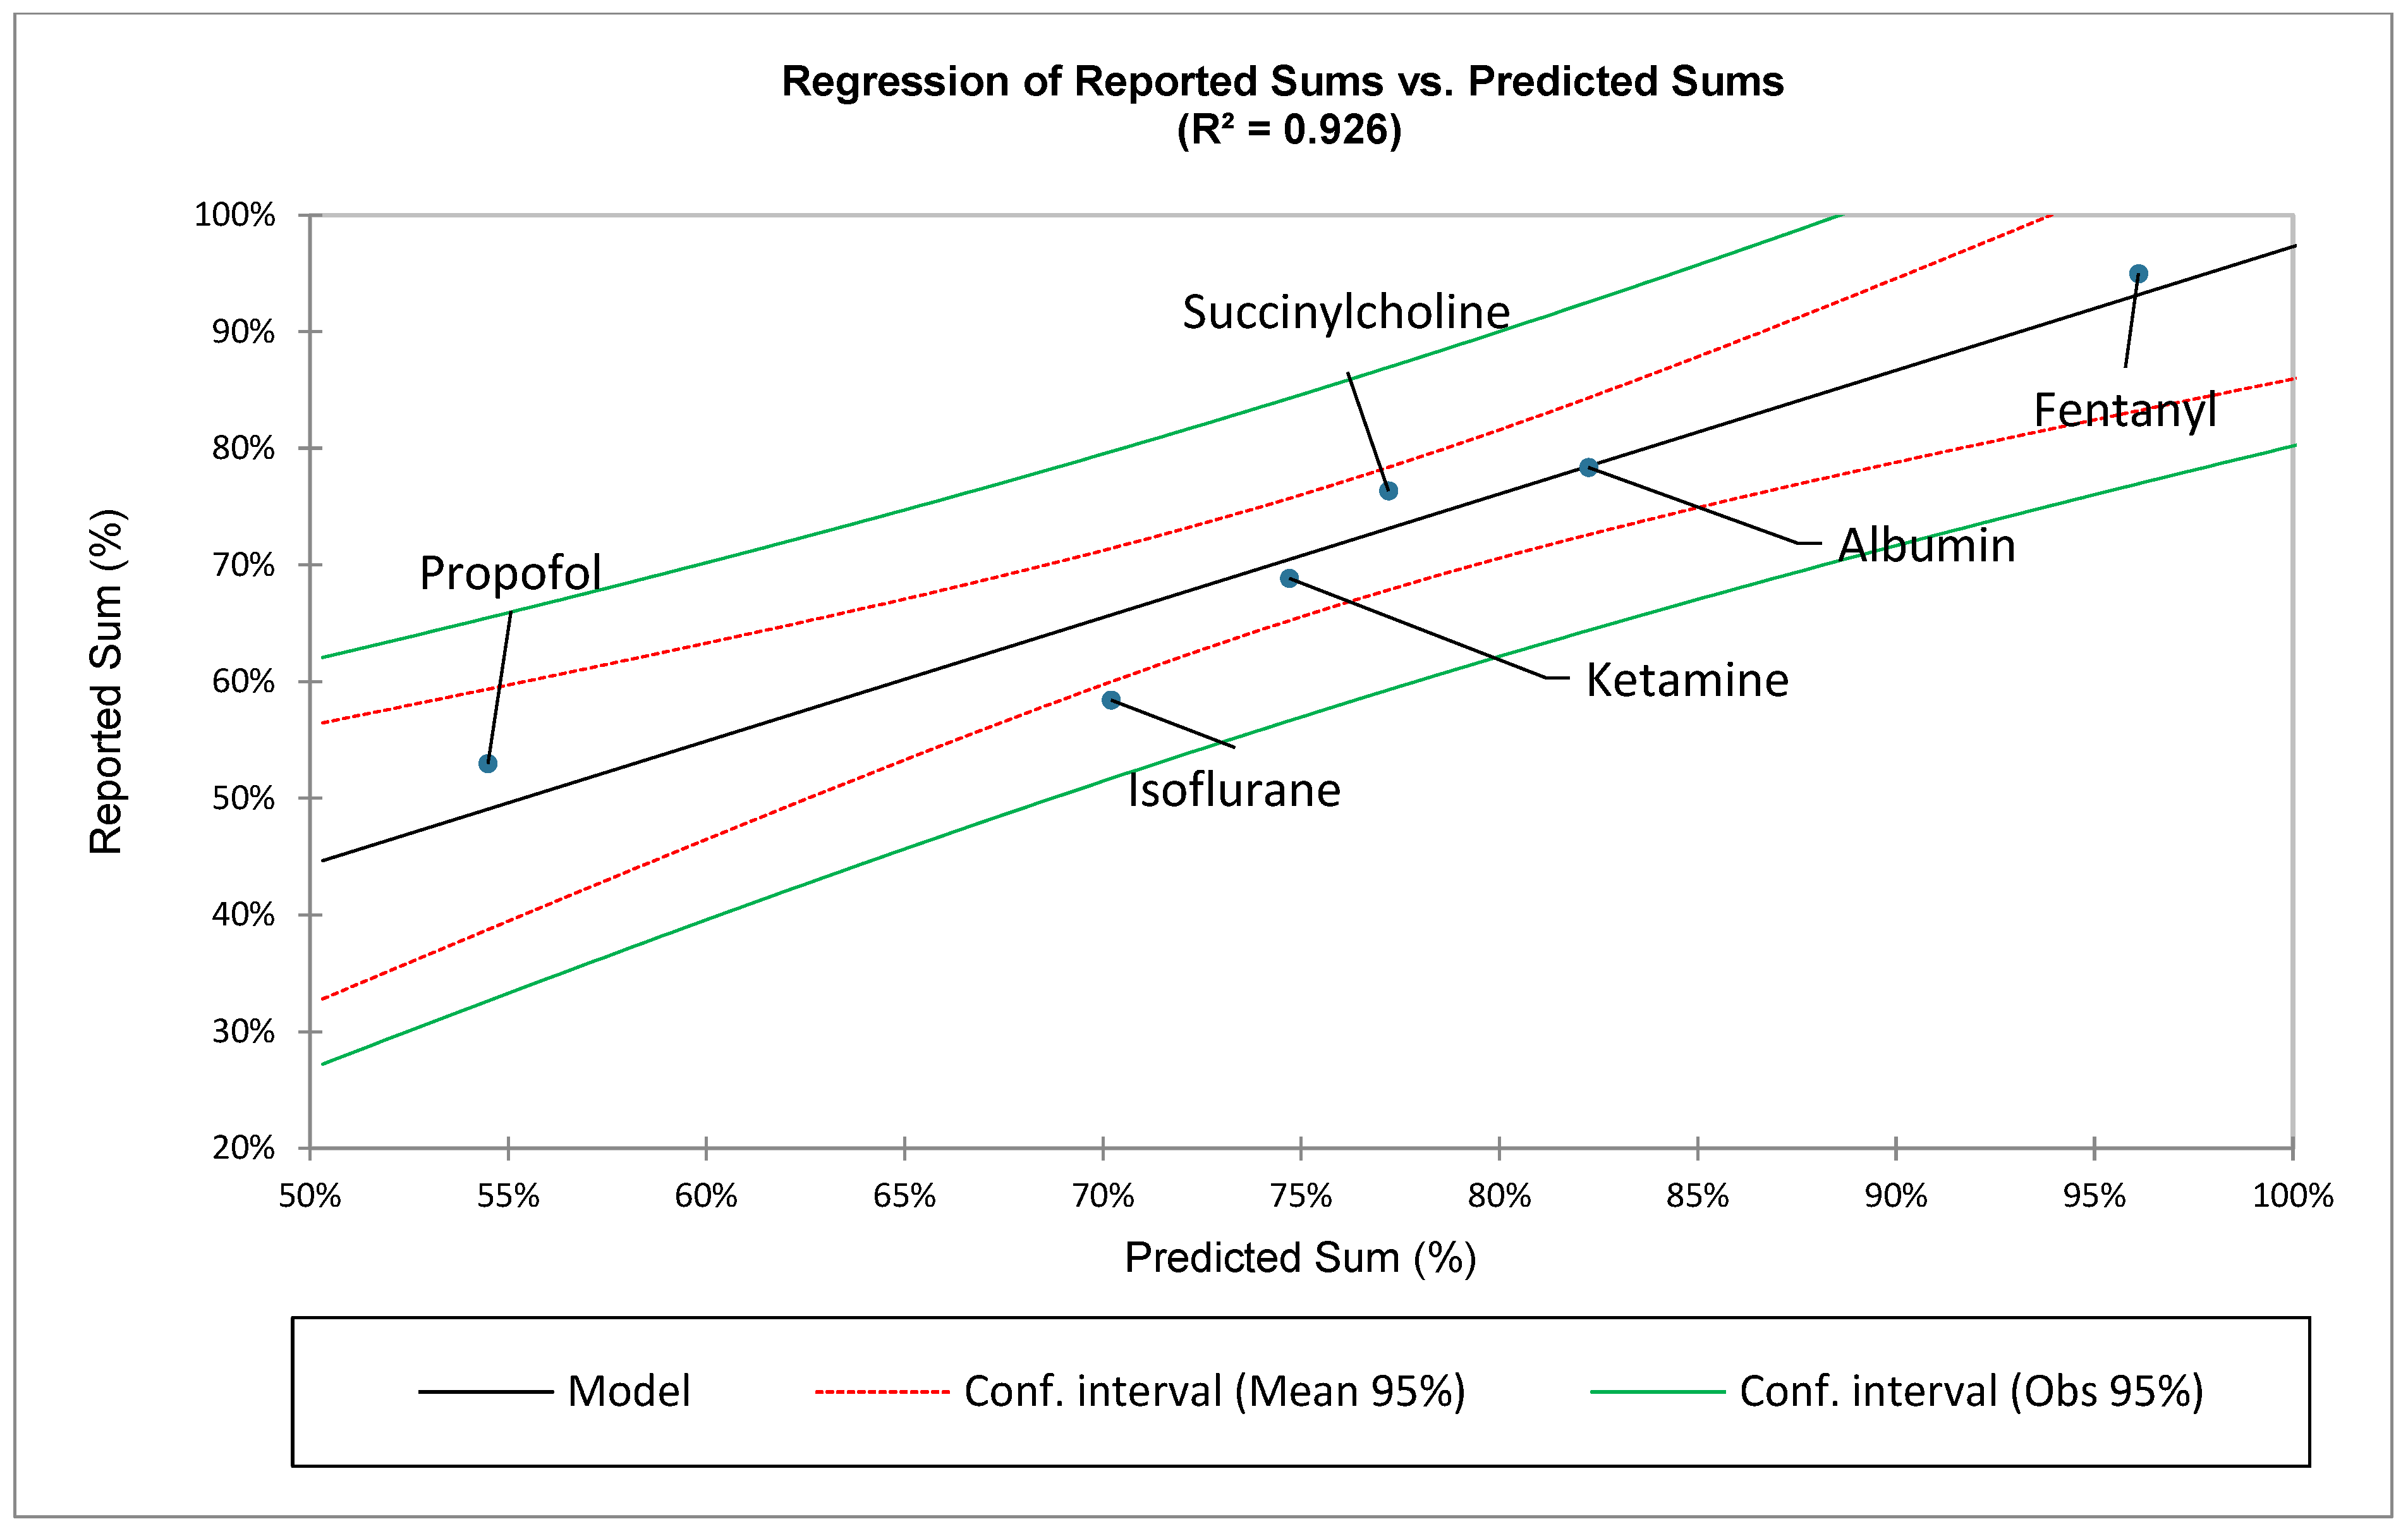
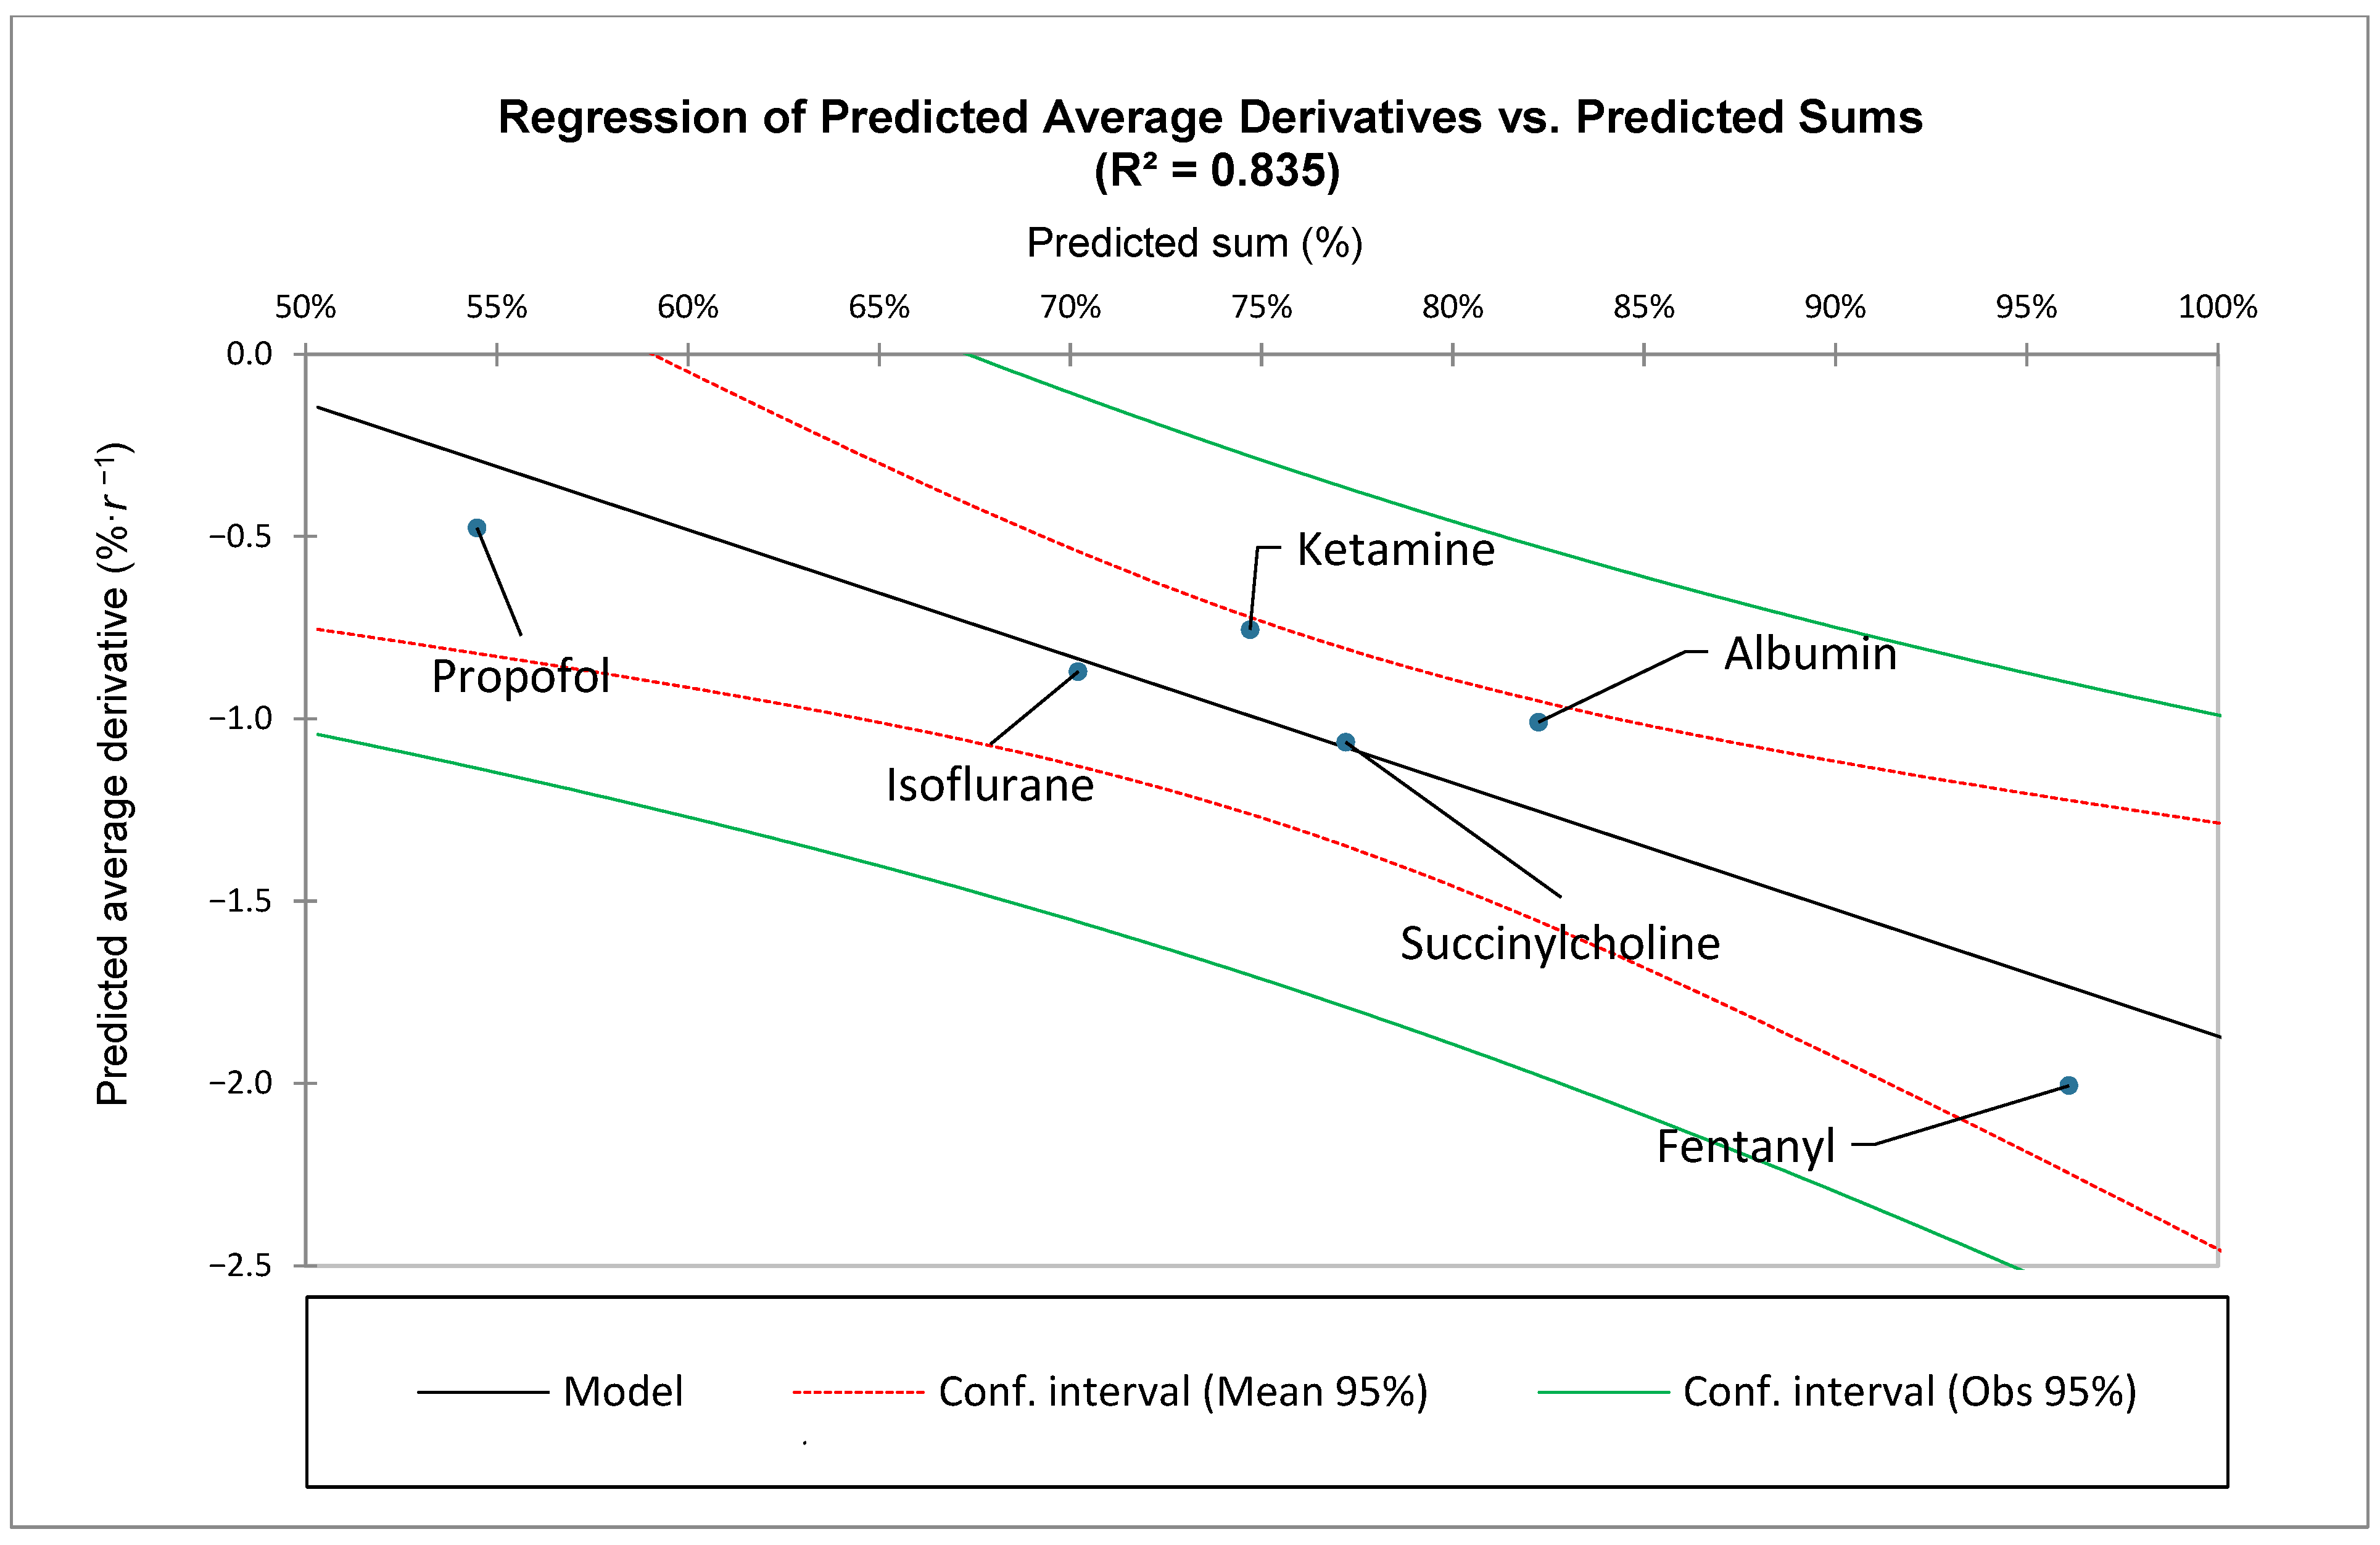
In addition, Figure 6 and Figure 7 document the correlation between reported and predicted average derivatives and sums over the first ten ranks. Figure 8 shows that greater negative slopes correlate with greater sums.
Figure 6.
Each reported average derivative correlates with its predicted average derivative.
Figure 7.
Correlation of reported and predicted sums.
Figure 8.
Predicted average derivatives correlate with predicted sums.
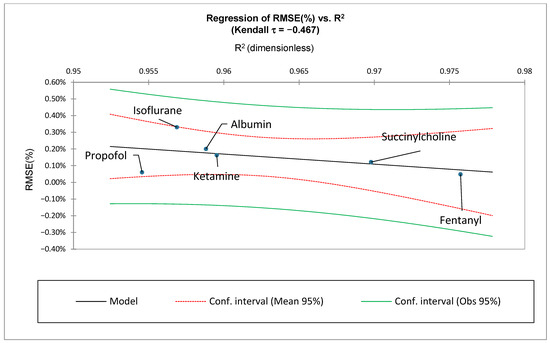
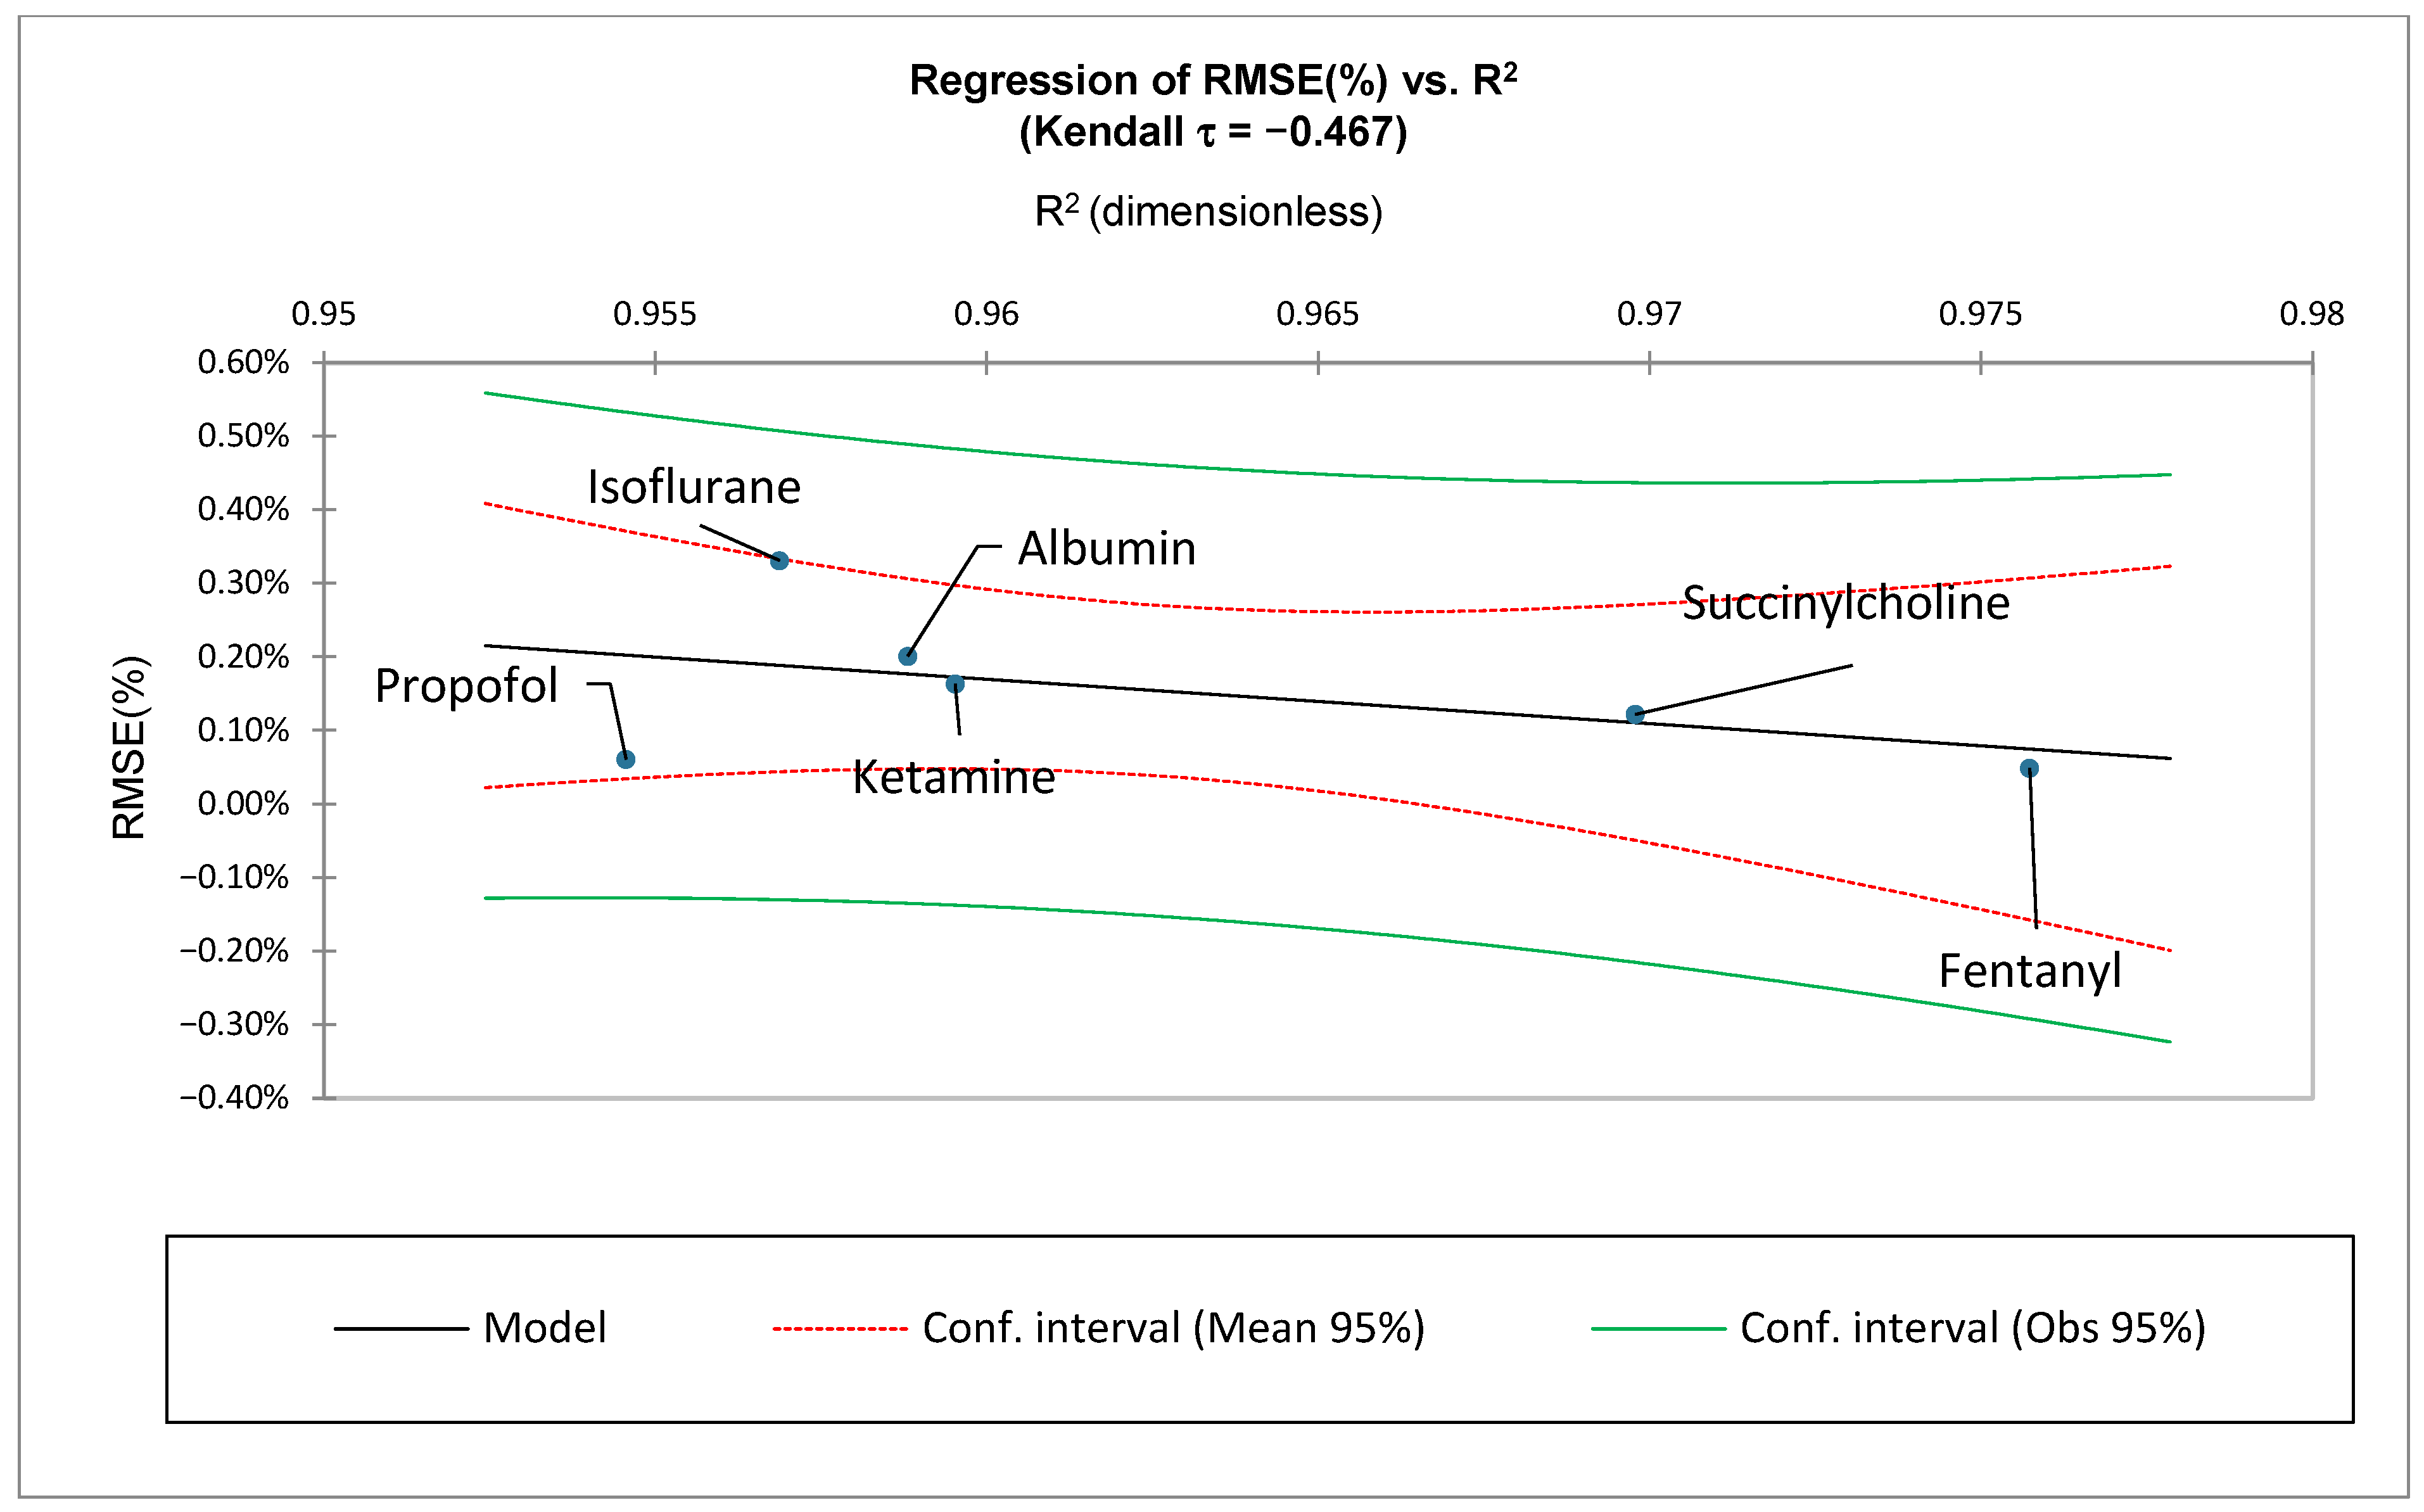
Lastly, Figure 9 compares RMSE (%) to R2. Note that RMSE (%) is determined using the nonlinear ZM model (Equations (1) and (8)), whereas R2 is obtained using the natural logarithmic model (Equations (19) and (20)).
Figure 9.
Correlation of medication-specific root mean square error using percentage, RMSE (%), and its respective coefficient of determination, R2. Note that RMSE (%) is calculated using the nonlinear ZM model, whereas R2 is calculated using the natural logarithmic model.
3. Discussion
This paper is a preliminary demonstration of the applicability of the ZM law to mathematically model US FDA ADRs. This may provide a reasonable “first step” for comparing overall clinical complication rates associated with various medications.
As demonstrated, medications that have a distribution of their ADRs with a less steep or shallower average slope, as well as a reduced sum, may exhibit a more favorable adverse event profile than those with steeper slopes and greater sums. Note that these values are determined over the initial range of each medication’s first ten ranks.
Thus, a flatter ADR distribution may indicate a more favorable adverse event profile, characterized by a more even distribution of medication-related complications. Further research would be necessary to investigate the potential clinical utility of this application of the ZM law.
Moreover, it should be noted that the dimensionless ratio was also found to correlate with both the average derivative and the sum of adverse events associated with the first ten ranks. Specifically, negatively correlated with the average slope but positively correlated with the sum. As stated, both correlations are based upon the adverse events associated with the first ten ranks of the ADRs of each medication.
Therefore, a lower value of results in a flatter or more even distribution of ADRs. Thus, this ratio may function as a useful index of comparison when evaluating ADRs from different medications. Lastly, inspection of Table 1 and Figure 3 demonstrates that changes in are mainly due to changes in .
Although other rank-based models, such as the discrete generalized beta distribution [10], may also be applicable to model ADR data, the ZM law offers a particularly useful combination of parsimony, interpretability, and flexibility. This is especially relevant for modeling the highly skewed initial ranks in which the most frequent and clinically important adverse drug reactions occur.
Most importantly, ADRs are a leading cause of both morbidity and mortality among hospitalized patients. It has been estimated that approximately 10.9% of all inpatients will experience an ADR, with 2.1% experiencing a serious event and 0.19% having a fatal event [11]. In addition, inpatients who were older, female, and who took more medications had a greater risk of having an ADR. Moreover, a greater length of stay was also associated with an increased likelihood of experiencing an ADR among inpatients [12].
ADRs that occur outside of a hospital and lead to hospitalizations have also been examined. Specifically, the overall incidence of ADRs in the primary care setting is estimated as 8.32 percent, with many of these being considered preventable [13].
While the ZM law appears to be readily applicable to modeling FDA-reported ADRs as a function of rank, it should be noted that the quantification of the economic effects of ADRs is a more difficult process, which is often incomplete or inaccurate. However, there have been numerous efforts to perform this type of analysis as well as recommendations for more efficacious investigations [14].
In the early 1990s, a team from LDS Hospital evaluated three years of data at their institution and concluded that an ADR increased length of stay by an average of 1.91 days at an increase in cost for care by an average of $2262 [15].
In the same decade, a team led by Bates et al. produced similar results, concluding that an ADR increased length of stay by 2.2 days and increased cost of care by $3244 [16].
It is important to note that there is likely a great discrepancy between institutions, patient populations, and geographic locations regarding ADR-related economic costs. Specifically, ADRs were found to extend the length of stay by an average of 14.1 days in a pediatric patient population in Japan in 2021. This was also associated with an increase in expenditures of $8258 [17]. However, another team led by Fernandez et al., in a pharmacy setting, estimated a cost of $218 per likely ADR [18].
With the advent of electronic healthcare records, clinicians are frequently made aware of potential ADRs. However, these alerts are commonly overridden. Slight et al. evaluated the cost of ADRs related to inappropriate medication-related alert overrides in a United States inpatient setting. Using data from Brigham and Women’s Hospital, they utilized a regression model to estimate that 5.5 million medication alerts may be inappropriately overridden annually in the United States. This estimate could therefore potentially yield 196,600 ADRs, likely costing between $871 million and $1.8 billion total [19].
4. Materials and Methods
The raw data for this study were downloaded directly from the US FDA website [20]. Mathematical and statistical analyses were done using Microsoft Excel, XLSTAT, and PTC Mathcad Prime 10.0. The initial data were obtained and uploaded anonymously by the US FDA. Therefore, Institutional Review Board (IRB) approval was deemed unnecessary.
For each medication, all FDA adverse events and associated ranks were entered into a spreadsheet (MS Excel). Medication-specific values for coefficients and were determined using nonlinear curve fitting implemented with the Levenberg—Marquardt algorithm (XLStat). Note that the raw data were initially acquired in decimal form and subsequently multiplied by 100 to obtain an equivalent percentage.
Six pharmacologically distinct generic medications were assessed in conjunction with their reported ADRs: propofol, albumin, isoflurane, fentanyl, succinylcholine, and ketamine. These agents represent medications that are commonly utilized in hospital-based anesthesia practice. Nonetheless, ADRs associated with the illicit use of propofol, fentanyl, and ketamine are also collectively recorded in the AEMS. Consequently, the database does not permit explicit distinction between ADRs arising from legitimate medical use and those resulting from illicit use. Moreover, drug overdoses are classified as ADRs and are therefore included in the AEMS dataset [21].
Appendix A documents the ten most prevalent adverse effects and their corresponding ranks associated with each of the six medications. Note that each ADR is expressed as a percentage for a given rank.
5. Conclusions
This paper has preliminarily demonstrated that the ZM law is applicable to the mathematical modeling of US FDA ADRs. This was supported using six commonly utilized hospital-based medications and applying nonlinear curve fitting and a natural logarithmic transformation to each medication-specific distribution. Furthermore, these agents are pharmacologically different.
Because this pilot study examined a limited sample size, future investigations are required to scale these findings across a larger dataset featuring even more diverse pharmacological profiles.
Additionally, the ratio of the two ZM law coefficients may serve as a useful index to summarize both the flatness and the sum of each distribution based on the ADRs associated with the first ten ranks. Thus, medications with a lower ratio may exhibit a more favorable adverse event profile owing to a more even dispersal of its ADRs.
Ultimately, the clinical application of the ZM law offers a promising framework for possibly minimizing ADRs in hospital settings and potentially reducing patient morbidity, mortality, and associated healthcare expenditures. Given the widespread integration of electronic health records, future research and deployment of this model could significantly enhance data-driven medication-based decision-making.
Author Contributions
Conceptualization, G.A. and S.D.; methodology, S.D.; software, G.A.; validation, G.A., S.D. and G.T.; formal analysis, S.D.; investigation, S.D.; resources, D.S.; data curation, G.A. and S.D.; writing—original draft preparation, G.A. and G.T.; writing—review and editing, G.A.; visualization, S.D.; supervision, G.A.; project administration, D.S. All authors have read and agreed to the published version of the manuscript.
Funding
This research received no external funding.
Institutional Review Board Statement
Not applicable. All data were obtained and uploaded anonymously by the US FDA. Therefore, Institutional Review Board (IRB) approval was deemed unnecessary.
Informed Consent Statement
Not applicable. All data were obtained and uploaded anonymously by the US FDA. Therefore, Informed Consent (IC) approval was deemed unnecessary.
Data Availability Statement
The original contributions presented in this study are included in the article. Further inquiries can be directed to the corresponding author.
Conflicts of Interest
The authors declare no conflict of interest.
Appendix A
Table A1.
Reported ADRs: ranks 1 through 10.
Appendix B
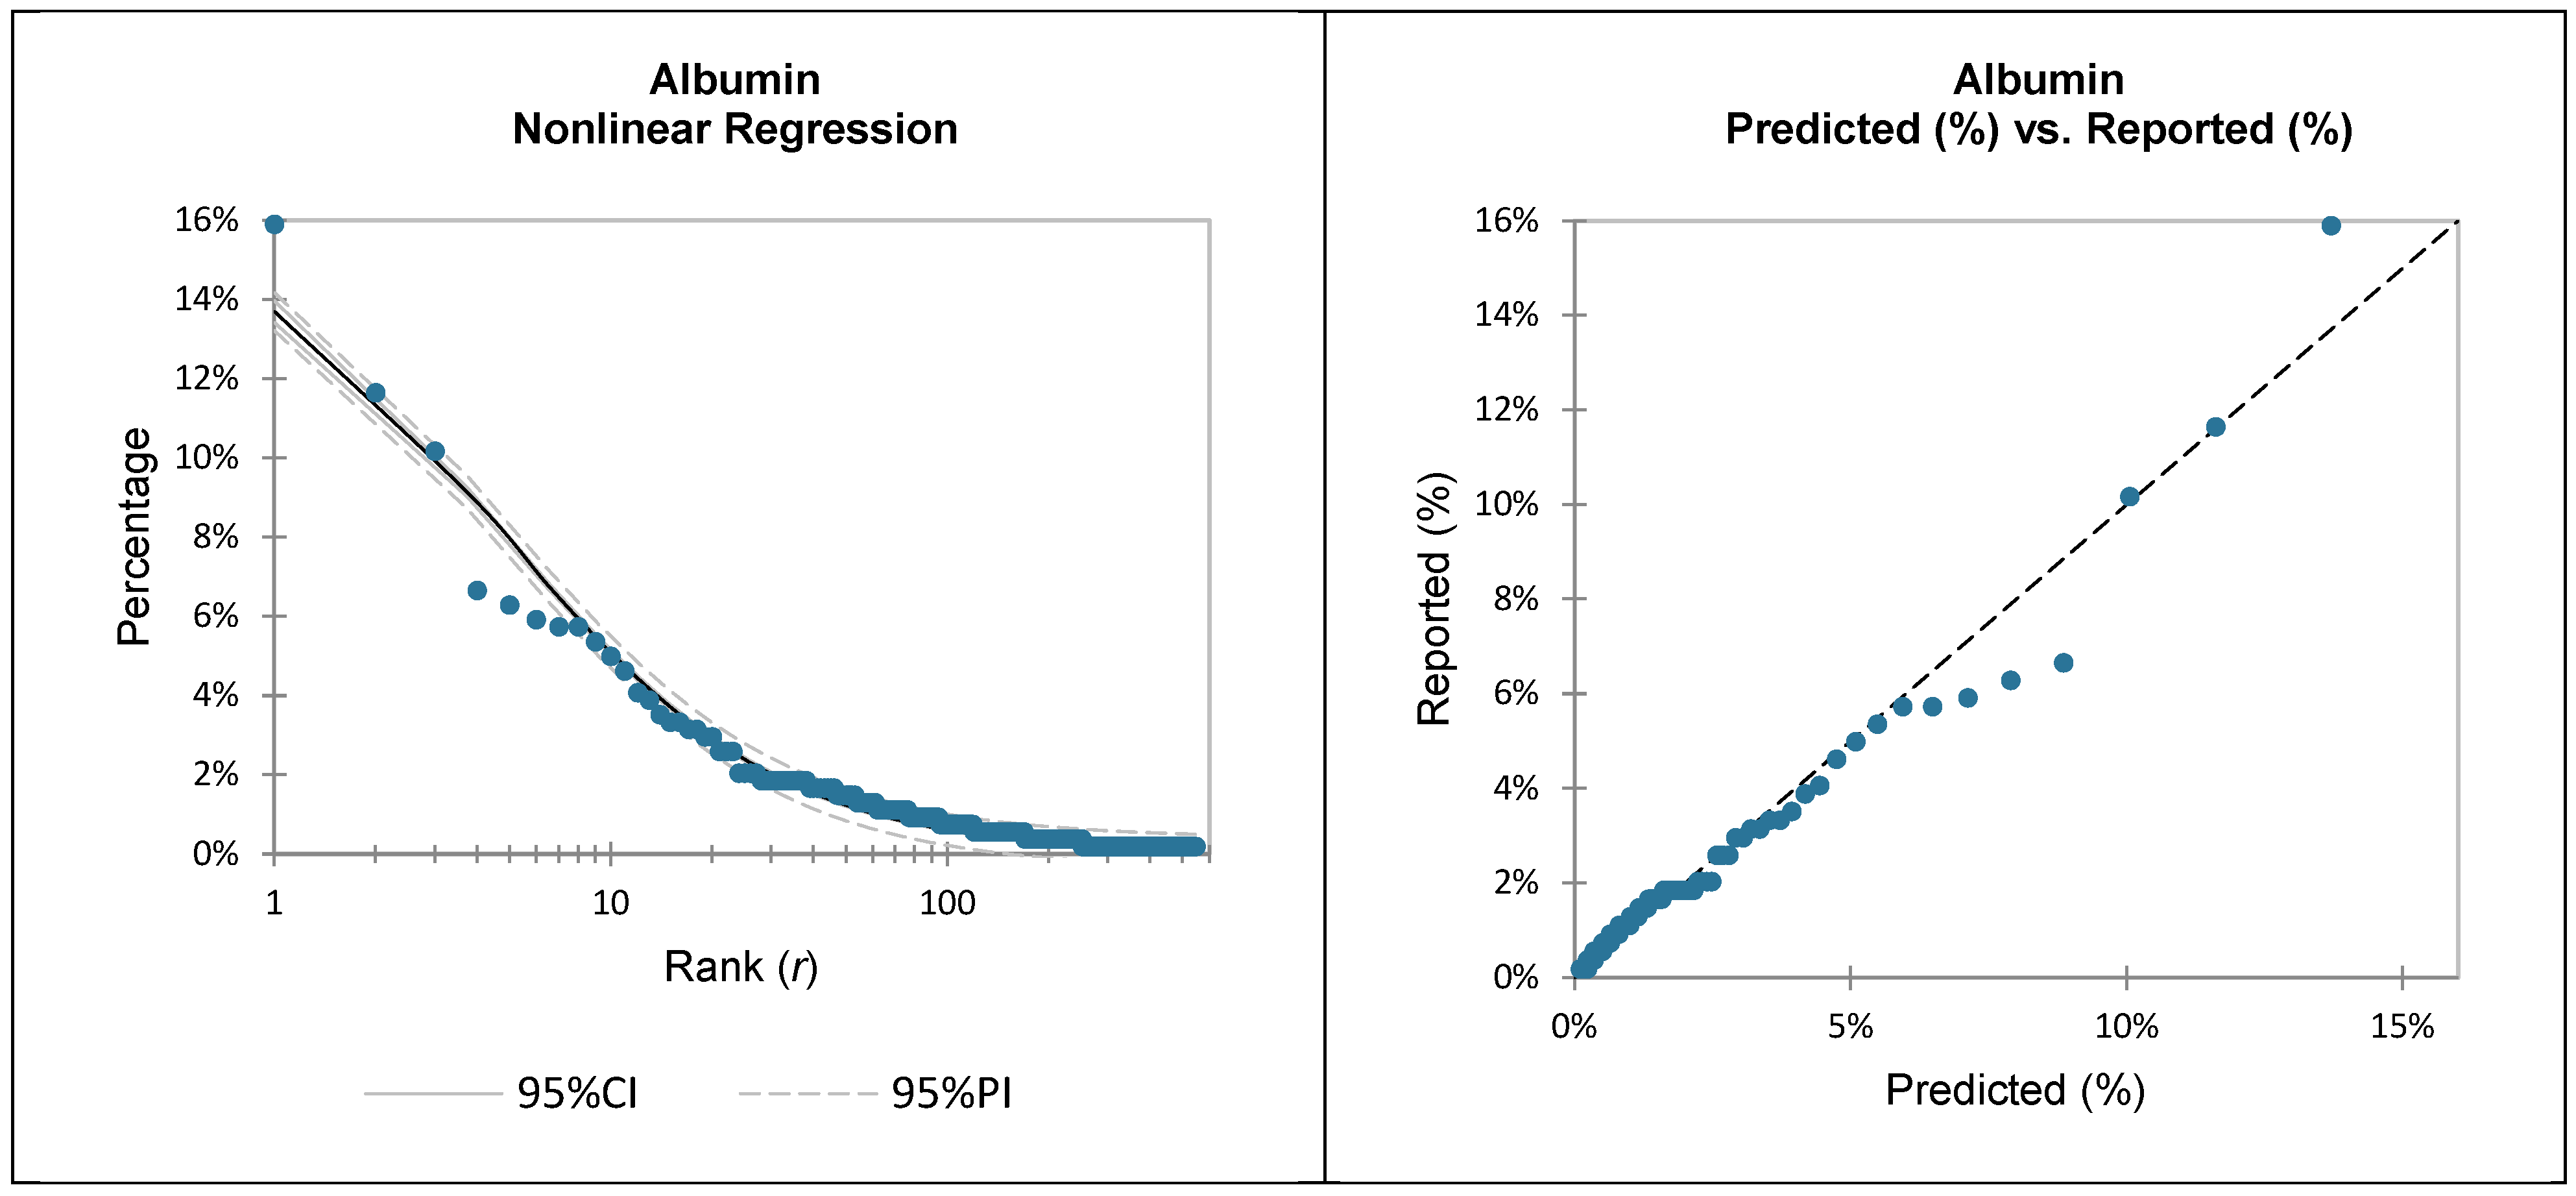
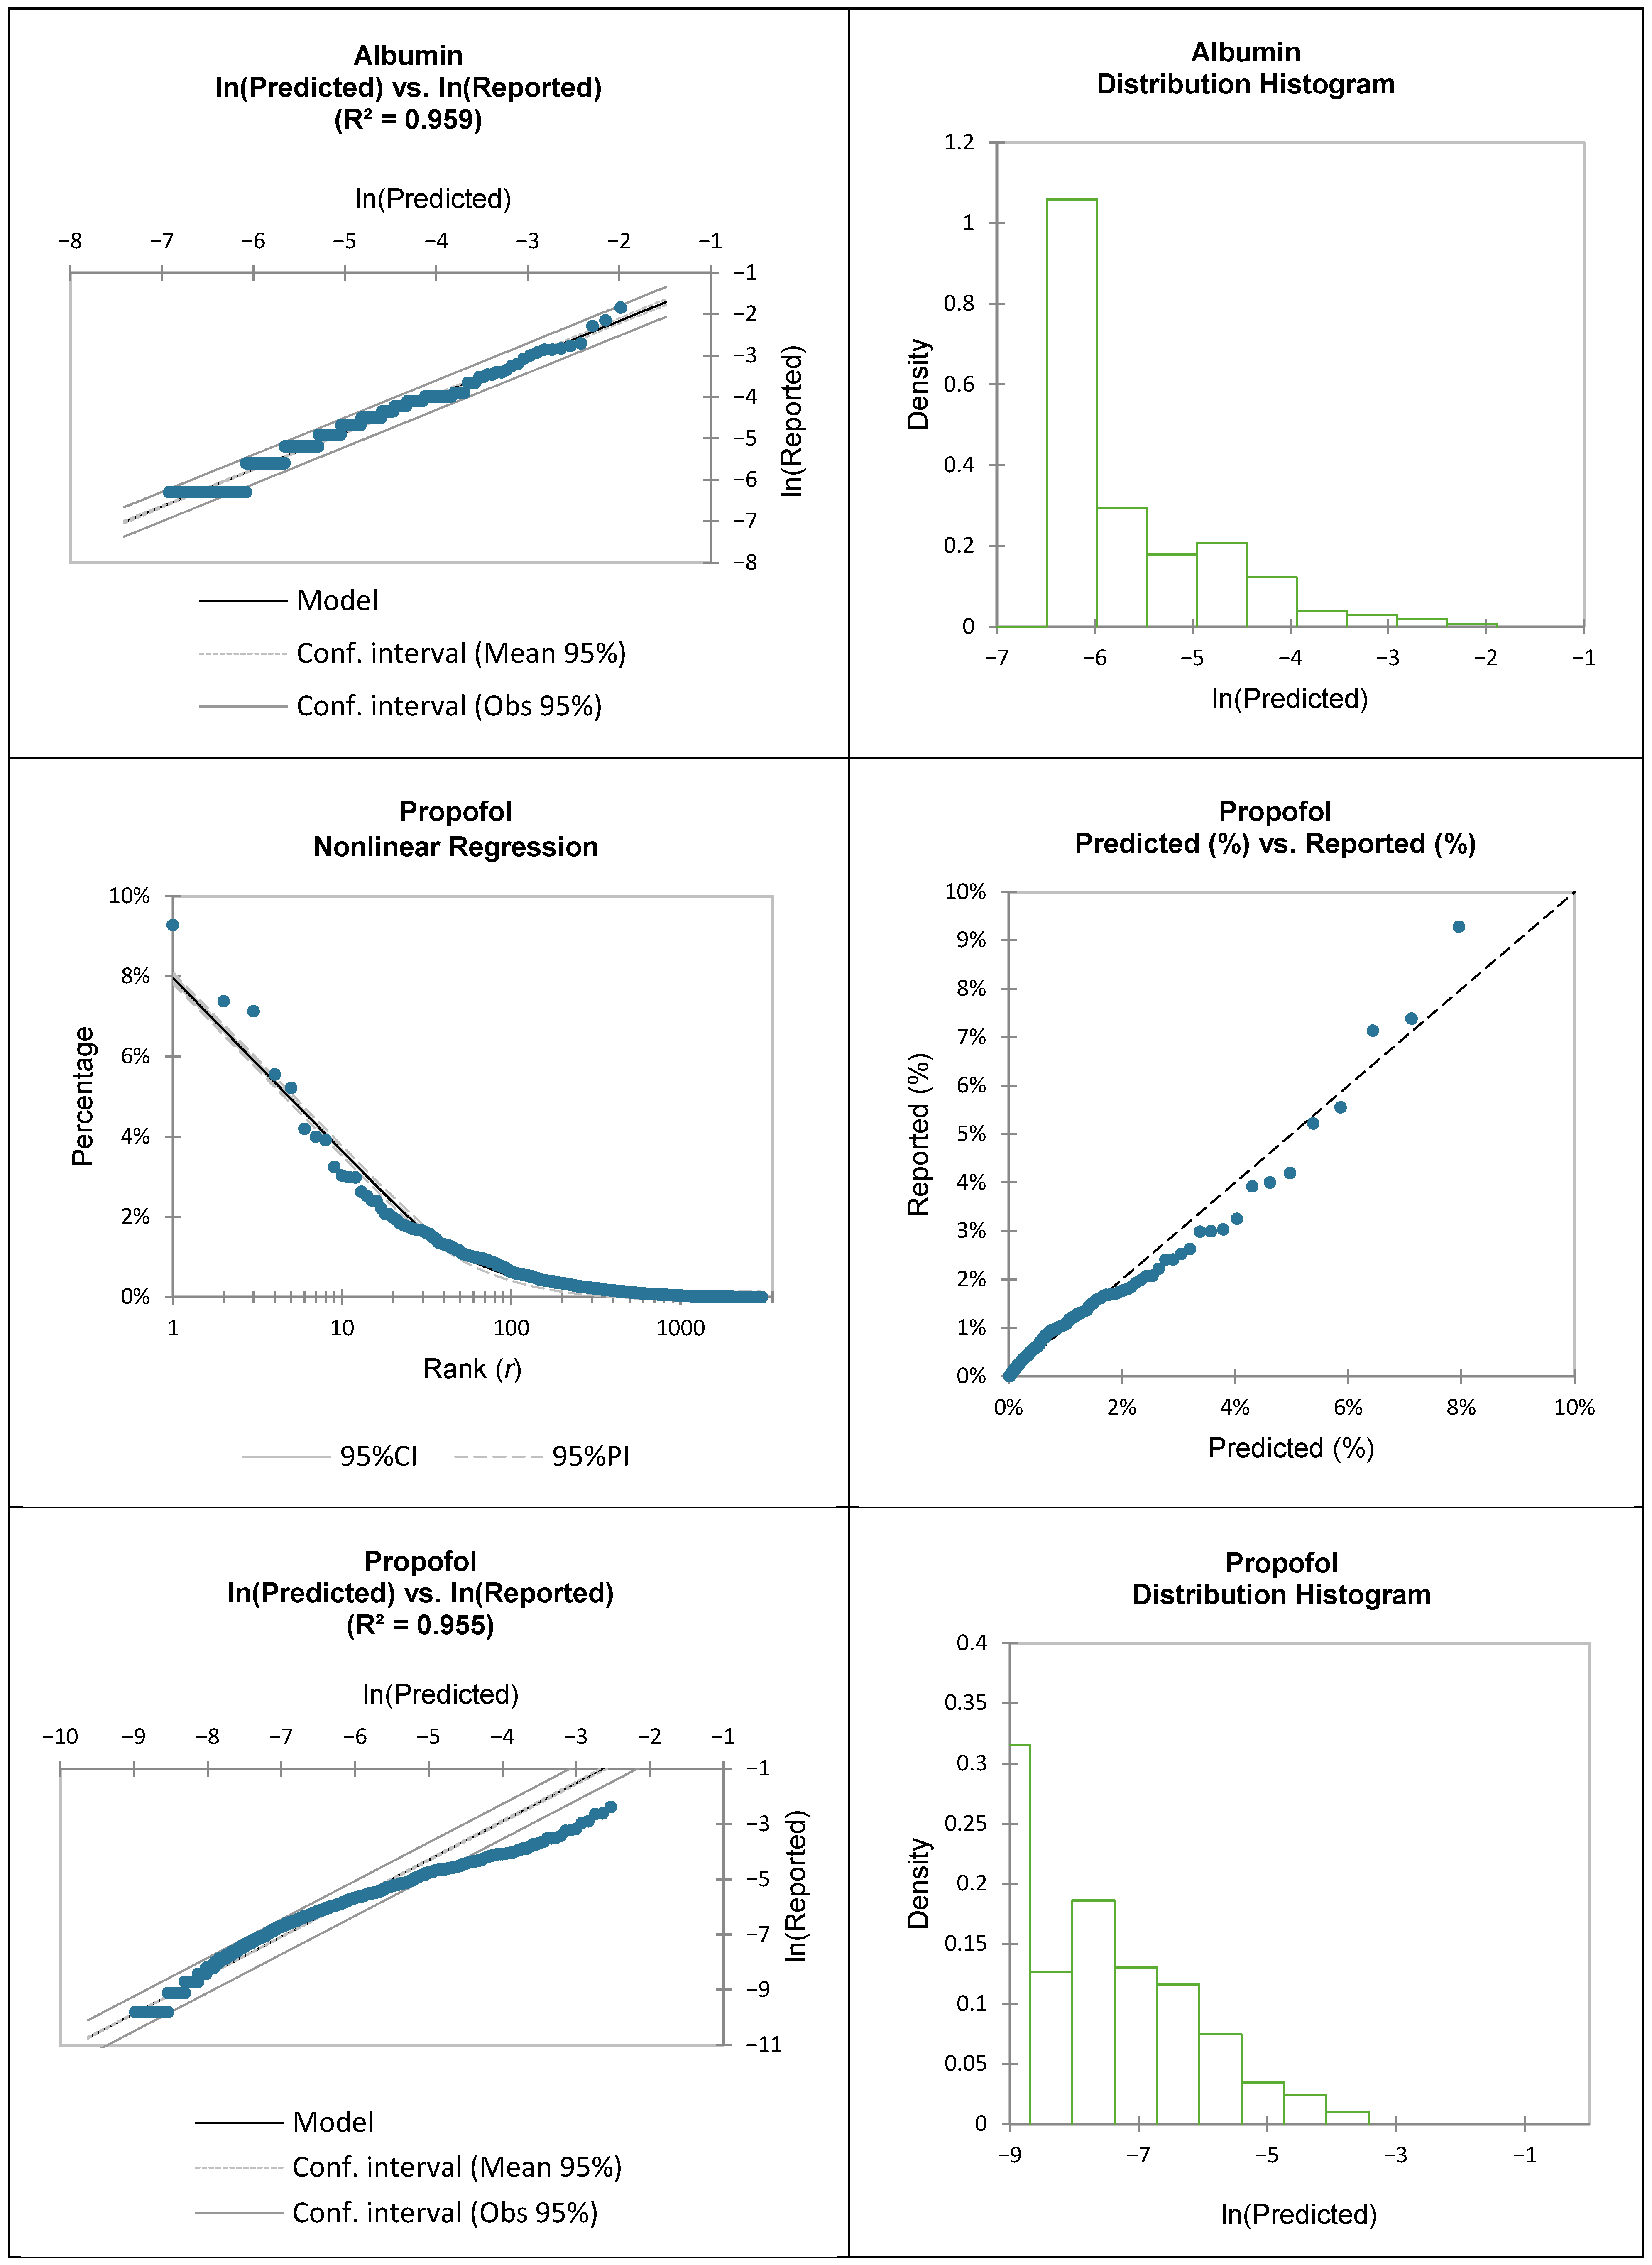
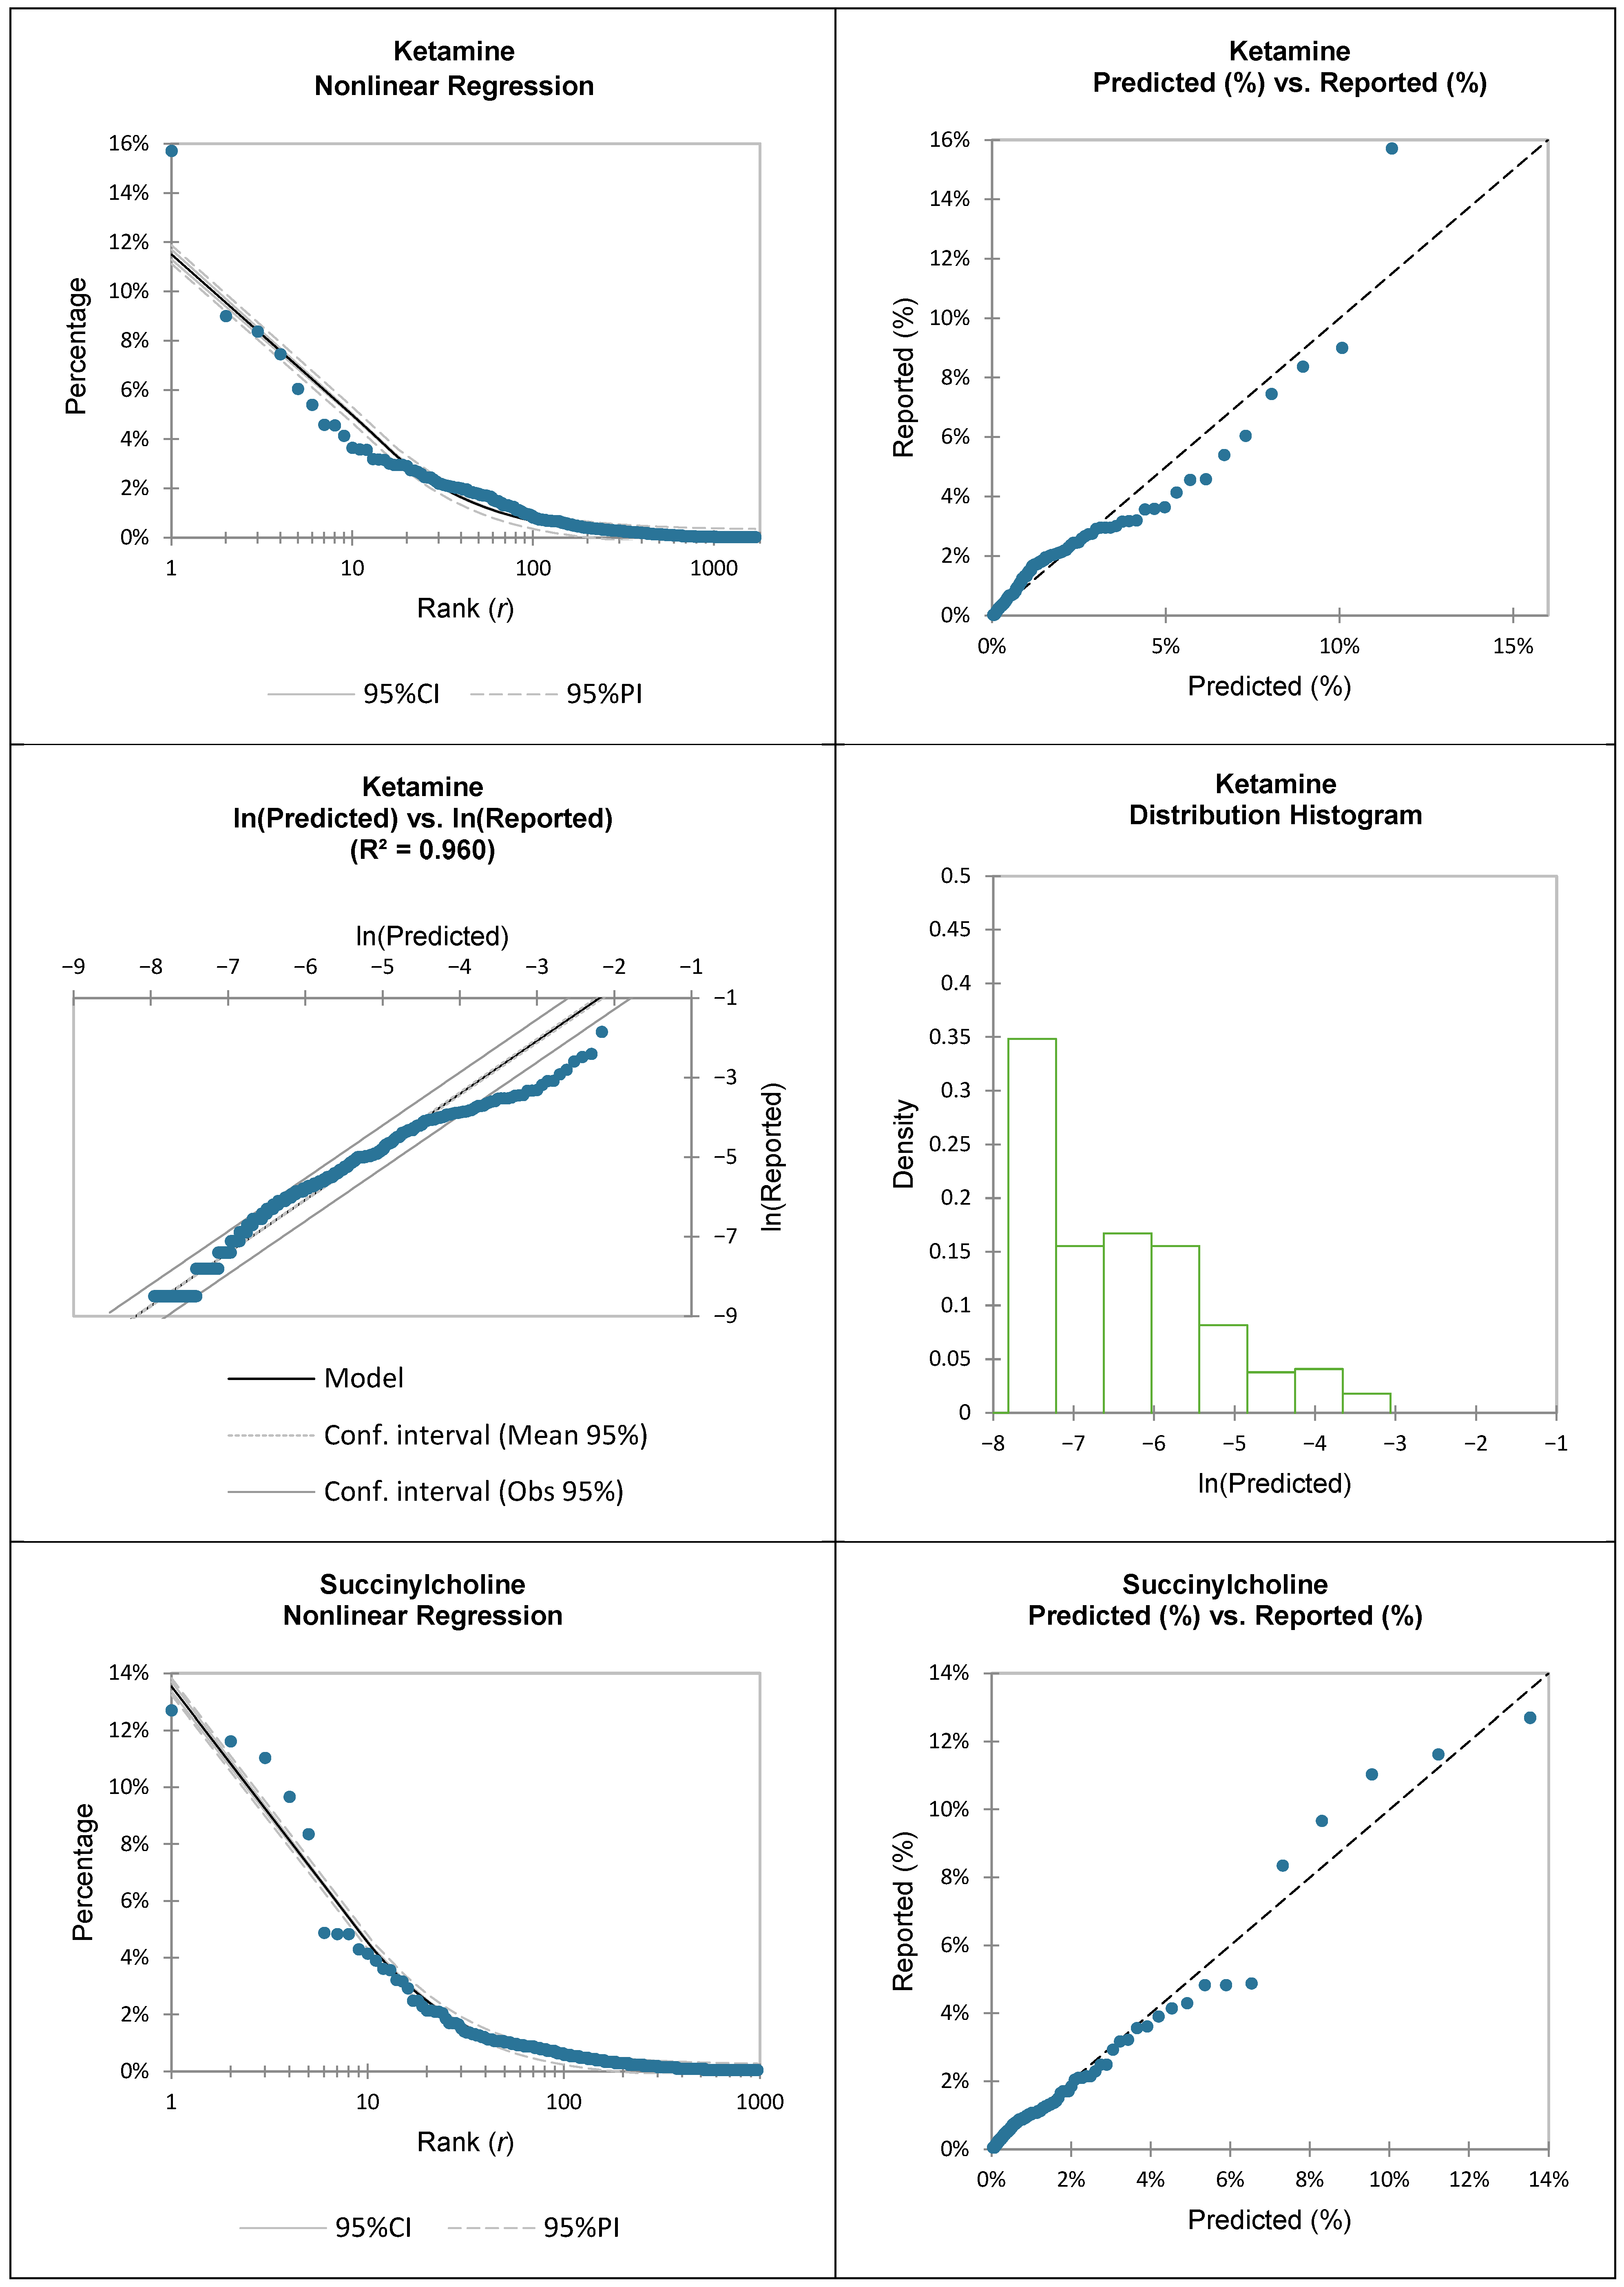
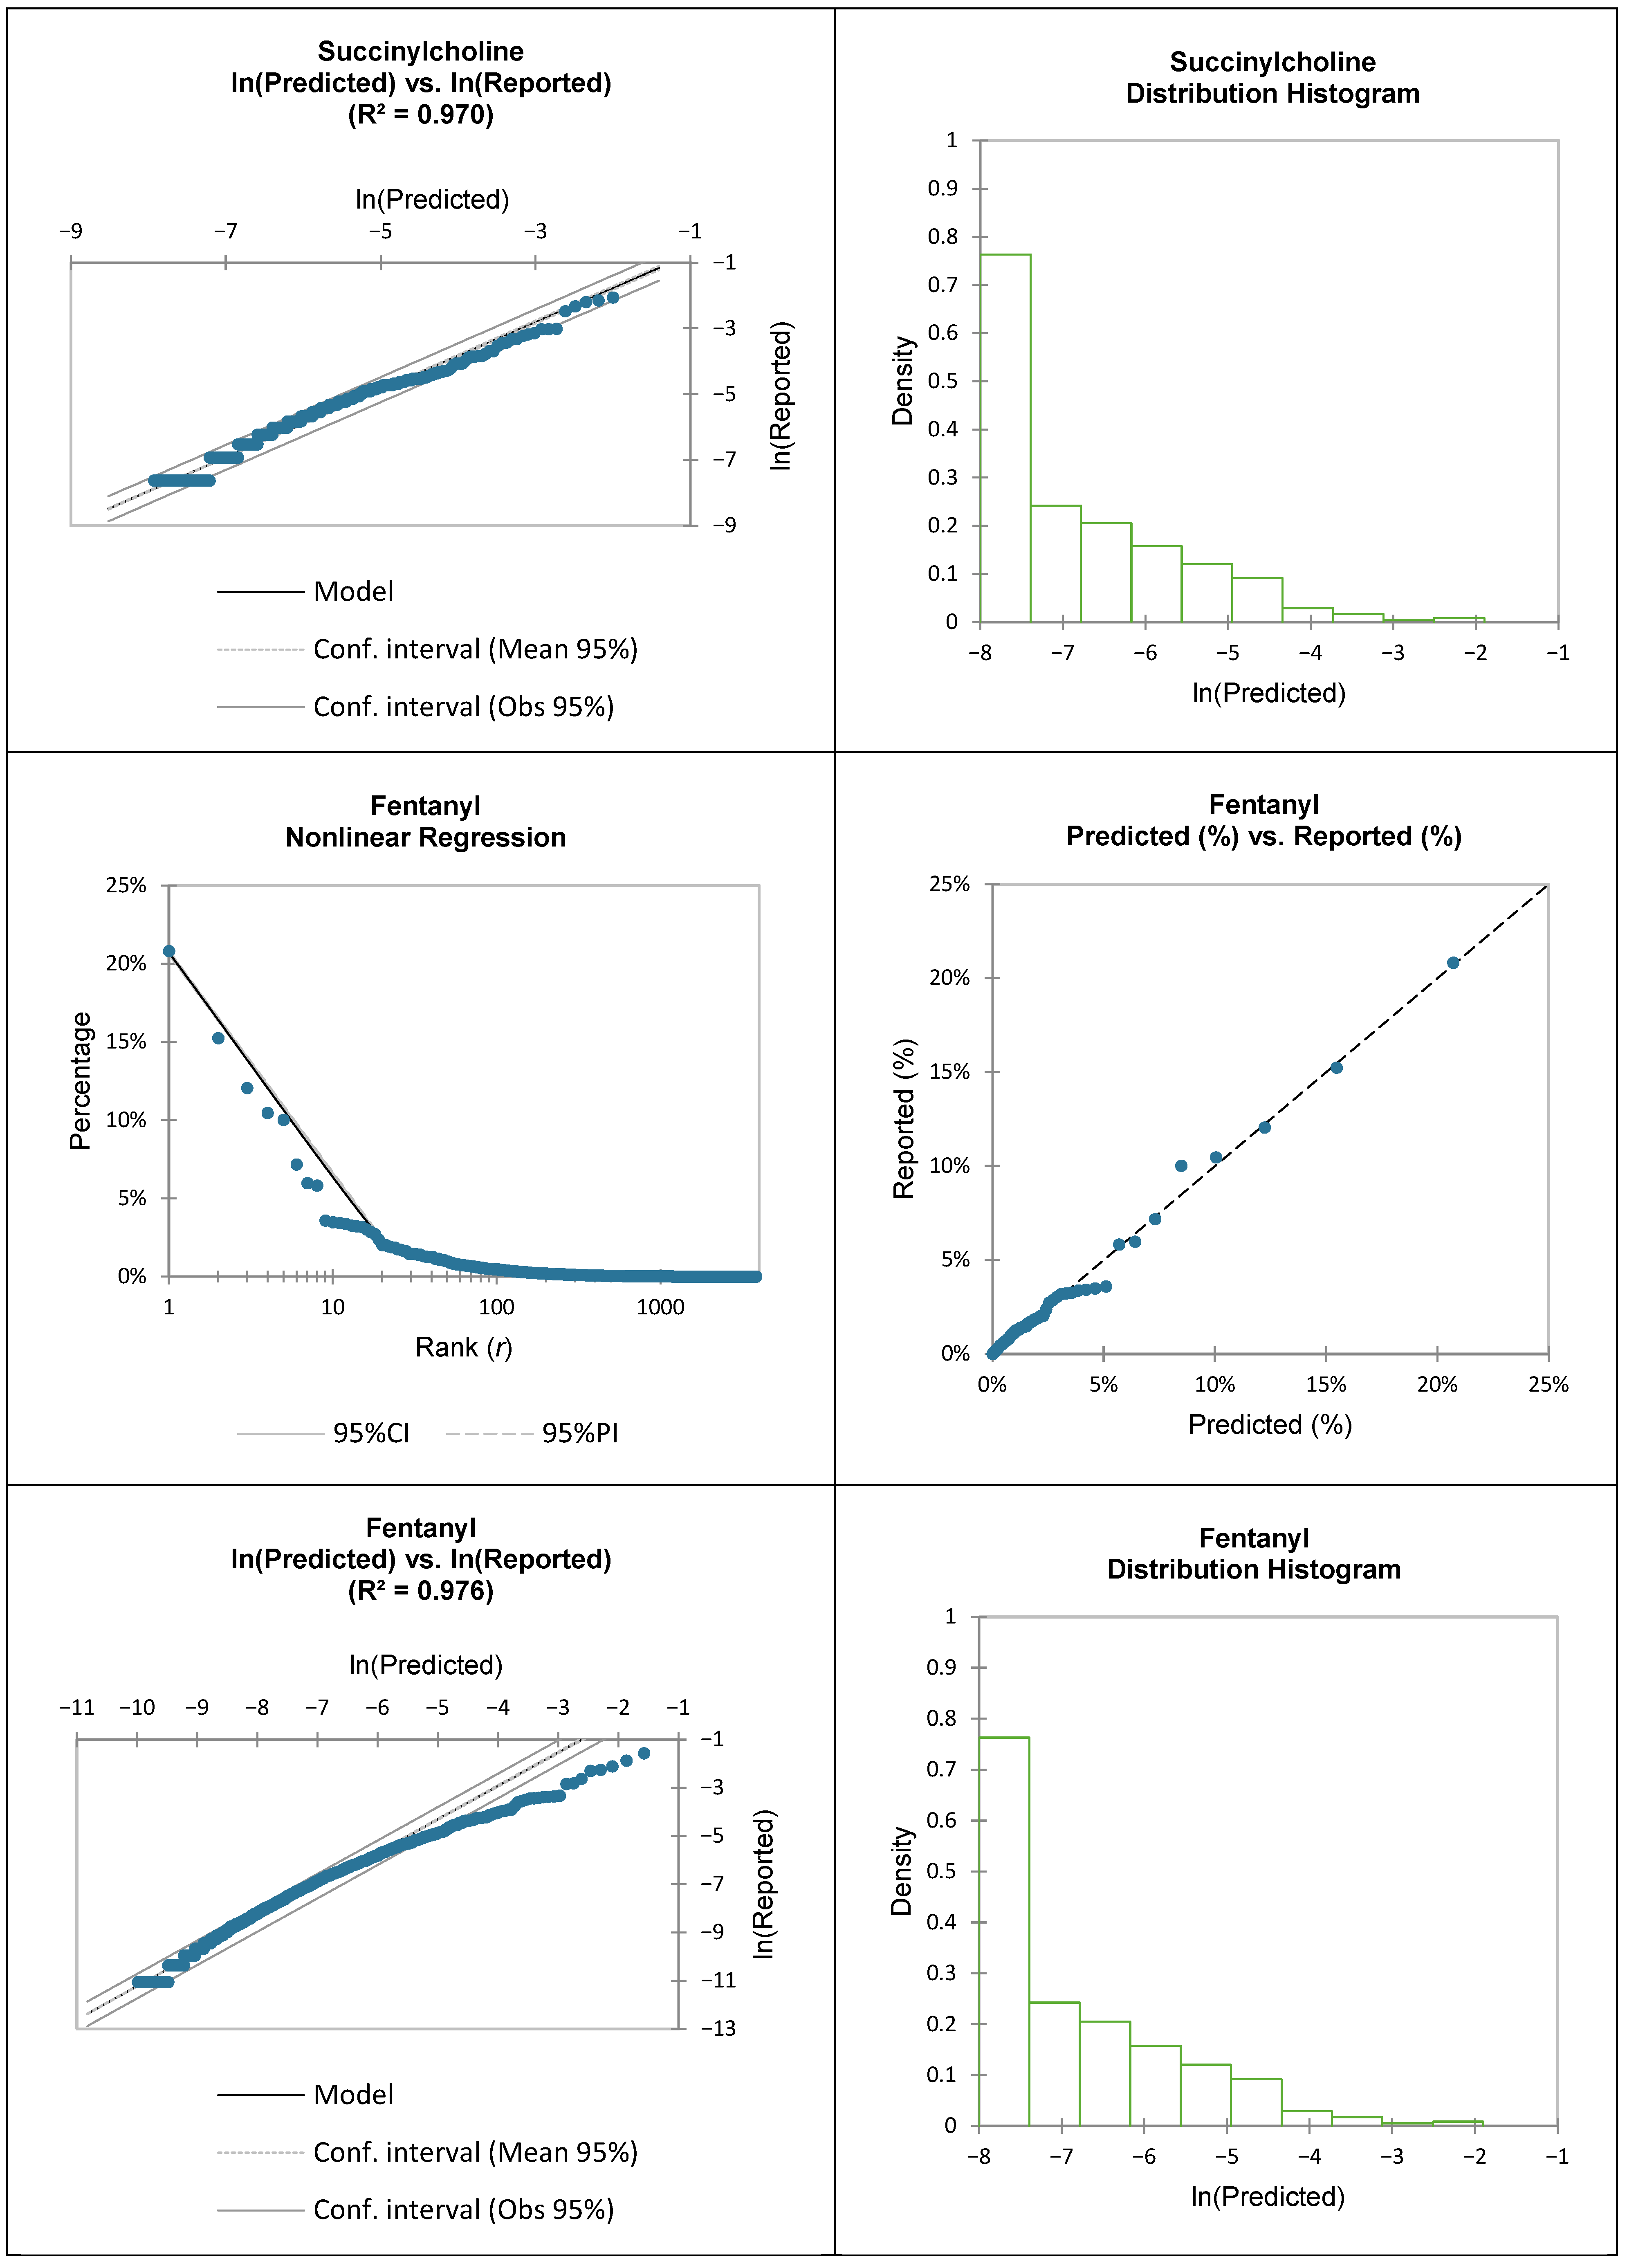
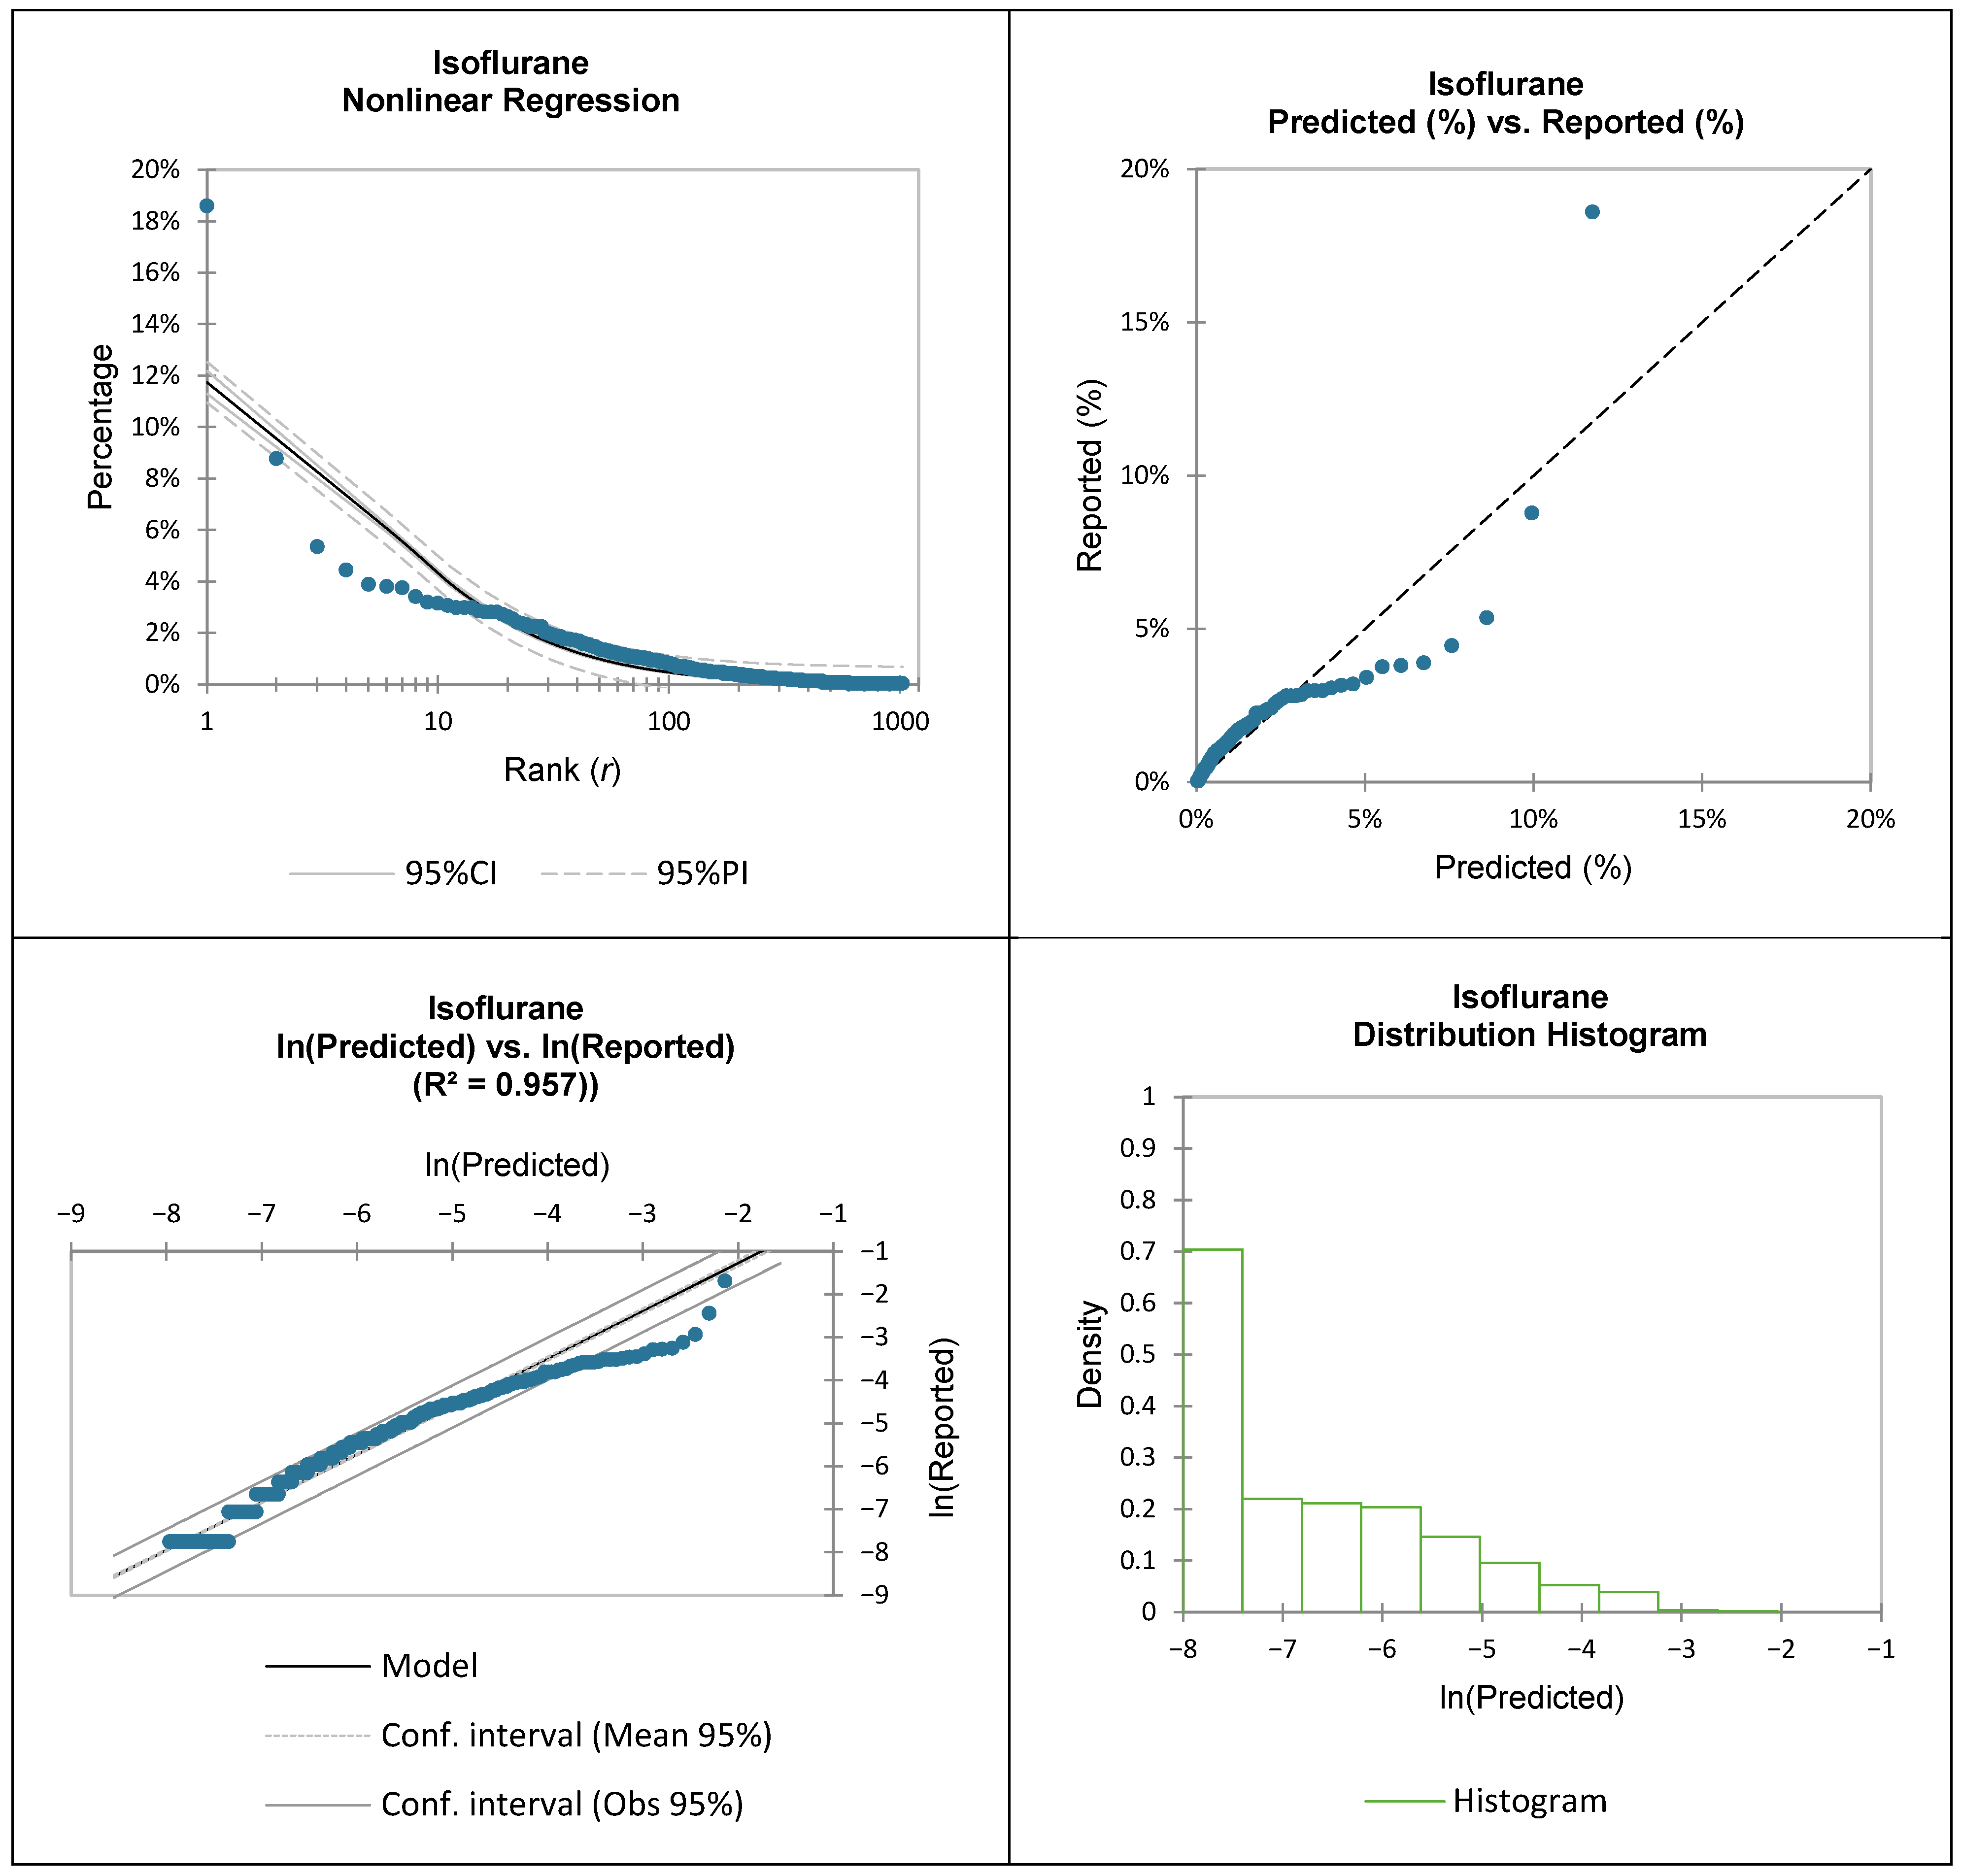
Figure A1.
Graphical summaries of US FDA ADRs utilizing nonlinear regression and natural logarithmic (ln) transformations.
Appendix C
The Derivation of RSME (%) Using RSME (Decimal Form)
Mean square error, MSE (decimal form), is defined as
where and are the dimensionless rank-specific reported and predicted ADRs in decimal form, respectively.
In an analogous manner, MSE (%) is defined using the reported and predicted values expressed as a function of percentages:
Expanding the numerator of the above equation yields
Therefore,
Note that MSE (%) has units of “percent squared.” Whereas root mean square error, RMSE (decimal form), is determined by calculating the square root of the dimensionless MSE (decimal form):
RMSE (%) is subsequently defined in an analogous manner:
Thus,
Note that RMSE (%) has units of percentage.
References
- Miguel, A.; Azevedo, L.F.; Araújo, M.; Pereira, A.C. Frequency of adverse drug reactions in hospitalized patients: A systematic review and meta-analysis. Pharmacoepidemiol. Drug Saf. 2012, 21, 1139–1154. [Google Scholar] [CrossRef] [Scilit] [PubMed]
- Bouvy, J.C.; De Bruin, M.L.; Koopmanschap, M.A. Epidemiology of adverse drug reactions in Europe: A review of recent observational studies. Drug Saf. 2015, 38, 437–453. [Google Scholar] [CrossRef] [Scilit] [PubMed]
- Piantadosi, S.T. Zipf’s word frequency law in natural language: A critical review and future directions. Psychon. Bull. Rev. 2014, 21, 1112–1130. [Google Scholar] [CrossRef] [Scilit] [PubMed]
- Dalton, D.B.; Dweck, R.; Elinon, M.; Davidson, J. Modeling Insurance Frequency with the Zipf-Mandelbrot Distribution. In CAS E-Forum; Casualty Actuarial Society: Arlington, VA, USA, 2022. [Google Scholar]
- Silagadze, Z.K. Citations and the Zipf-Mandelbrot’s law. arXiv 1999, arXiv:physics/9901035. [Google Scholar]
- Adamic, L.A.; Huberman, B.A. Zipf’s law and the Internet. Glottometrics 2002, 3, 143–150. [Google Scholar]
- Gabaix, X. Power laws in economics and finance. Annu. Rev. Econ. 2009, 1, 255–294. [Google Scholar] [CrossRef] [Scilit]
- Hackmann, A.; Klarl, T. The evolution of Zipf’s Law for US cities. Pap. Reg. Sci. 2020, 99, 841–852. [Google Scholar] [CrossRef] [Scilit]
- Newman, M.E. Power laws, Pareto distributions and Zipf’s law. Contemp. Phys. 2005, 46, 323–351. [Google Scholar] [CrossRef] [Scilit]
- Martínez-Mekler, G.; Martínez, R.A.; del Río, M.B.; Mansilla, R.; Miramontes, P.; Cocho, G. Universality of rank-ordering distributions in the arts and sciences. PLoS ONE 2009, 4, e4791. [Google Scholar] [CrossRef] [Scilit] [PubMed]
- Lazarou, J.; Pomeranz, B.H.; Corey, P.N. Incidence of adverse drug reactions in hospitalized patients: A meta-analysis of prospective studies. JAMA 1998, 279, 1200–1205. [Google Scholar] [CrossRef] [Scilit] [PubMed]
- Davies, E.C.; Green, C.F.; Taylor, S.; Williamson, P.R.; Mottram, D.R.; Pirmohamed, M. Adverse drug reactions in hospital in-patients: A prospective analysis of 3695 patient-episodes. PLoS ONE 2009, 4, e4439. [Google Scholar] [CrossRef] [Scilit] [PubMed]
- Insani, W.N.; Whittlesea, C.; Alwafi, H.; Man, K.K.; Chapman, S.; Wei, L. Prevalence of adverse drug reactions in the primary care setting: A systematic review and meta-analysis. PLoS ONE 2021, 16, e0252161. [Google Scholar] [CrossRef] [Scilit] [PubMed]
- Ghabri, S.; Dawoud, D.; Drummond, M. Methods for including adverse events in economic evaluations: Suggestions for improvement. Value Health 2024, 27, 936–942. [Google Scholar] [CrossRef] [Scilit] [PubMed]
- Classen, D.C.; Pestotnik, S.L.; Evans, R.S.; Lloyd, J.F.; Burke, J.P. Adverse drug events in hospitalized patients: Excess length of stay, extra costs, and attributable mortality. JAMA 1997, 277, 301–306. [Google Scholar] [CrossRef] [Scilit] [PubMed]
- Bates, D.W.; Spell, N.; Cullen, D.J.; Burdick, E.; Laird, N.; Petersen, L.A.; Small, S.D.; Sweitzer, B.J.; Leape, L.L. The costs of adverse drug events in hospitalized patients. JAMA 1997, 277, 307–311. [Google Scholar] [CrossRef] [Scilit] [PubMed]
- Iwasaki, H.; Sakuma, M.; Ida, H.; Morimoto, T. The burden of preventable adverse drug events on hospital stay and healthcare costs in Japanese pediatric inpatients: The JADE study. Clin. Med. Insights Pediatr. 2021, 15, 1179556521995833. [Google Scholar] [CrossRef] [Scilit] [PubMed]
- Fernández, E.V.; Warriner, C.L.; David, T.; Gordon, E.; Twigg, G.; Carroll, N.V. Potential cost savings by prevention of adverse drug events with a novel medication review program. J. Am. Pharm. Assoc. 2020, 60, 462–469. [Google Scholar] [CrossRef] [Scilit]
- Slight, S.P.; Seger, D.L.; Franz, C.; Wong, A.; Bates, D.W. The national cost of adverse drug events resulting from inappropriate medication-related alert overrides in the United States. J. Am. Med. Inform. Assoc. 2018, 25, 1183–1188. [Google Scholar] [CrossRef] [Scilit] [PubMed]
- Available online: https://www.fda.gov/drugs/fda-adverse-event-monitoring-system-aems/fda-adverse-event-monitoring-system-aems-public-dashboard (accessed on 30 July 2025).
- Ni, J.; Tang, X.; Chen, L. Medication overdose data analysis: A review of medication error reports in the FDA adverse event reporting system (FAERS). BMC Pharmacol. Toxicol. 2023, 24, 41. [Google Scholar] [CrossRef] [Scilit] [PubMed]

Disclaimer/Publisher’s Note: The statements, opinions and data contained in all publications are solely those of the individual author(s) and contributor(s) and not of MDPI and/or the editor(s). MDPI and/or the editor(s) disclaim responsibility for any injury to people or property resulting from any ideas, methods, instructions or products referred to in the content. |
© 2026 by the authors. Licensee MDPI, Basel, Switzerland. This article is an open access article distributed under the terms and conditions of the Creative Commons Attribution (CC BY) license.