1. Introduction
Lung cancer has been an important topic in medicine for a long time and is still one of the biggest challenges for medical doctors and scientists worldwide [
1,
2,
3].
In Europe, a total of 4,042,263 new cases were diagnosed in 2020 and 1,942,552 deaths were attributed to lung cancer. It is the second most common cancer in men and the third most common cancer in women. It also ranks first as the cause of cancer deaths for men and ranks second for women. For both sexes and all ages, the mortality rate is 54.2, which is by far the highest mortality rate of all cancers in European countries [
2].
Treatment outcome is significantly better in the early stages of the disease [
4]. However, three-quarters of lung cancer diseases are only diagnosed after they reached a point beyond curative treatment [
5].
Chest X-ray has been the method of choice to investigate lung cancer in patients, but due to its limited sensitivity, it could not be used for screening. In previous studies using X-rays as a screening method, lung cancer was diagnosed more often, but mortality was not affected [
6]. In the randomized PLCO (Prostate, Lung, Colorectal, and Ovarian) screening trial, lung cancer screening involved four annual chest radiographs for up to four years. There was no evidence of a shift in stage at diagnosis, nor of significantly lower lung cancer mortality [
7].
In 2011, the National Lung Screening Trial (NLST) was the first to show a significant 20% reduction in lung cancer mortality through annual computed tomography (CT) screening of high-risk patients compared to chest radiography resulting in earlier detection of cancer lesions [
8].
In 2012, the Lung Cancer Screening Panel of the National Comprehensive Cancer Network in the USA was the first to officially recommend annual LDCT screening for high-risk individuals, and in 2013, the American Cancer society published lung cancer guidelines including LDCT screening [
9].
In 2017, a European interdisciplinary consensus statement named CT the best method available to date for lung cancer screening and recommended planning the implementation of lung cancer screening in high-risk individuals throughout Europe at certified multidisciplinary medical centers [
9].
When The Nederlands-Leuvens Longkanker Screening Onderzoek (NELSON) results were published in 2020, they reported a 26% reduction in lung cancer mortality in men and a 36% reduction in mortality in women after a 10-year follow-up. The screening was found to result in a systematic shift and earlier diagnosis at a lower stage [
10,
11].
To date, however, there is no established low-dose CT screening for lung cancer in many European countries. Critical points are a high rate of over-diagnosis, a bad risk–benefit ratio concerning radiation exposure of asymptomatic individuals in the screening situation, and missing guidelines and standardized protocols for the different CT scanners available [
11,
12,
13].
Due to the constant and fast technological advances in the field of radiology, the possibilities for screening are also constantly improving. As screening is implemented in more countries, radiologists will need data to rely on when optimizing their setup for screening. There have been few approaches to optimizing CT protocols so far.
In 2020, a study evaluated nodule visibility using different effective mAs levels. They concluded that a high detection rate can be achieved at low mAs if the other detection parameters are set as best as possible [
14].
We raised the general question about which settings contribute best to improving screening. In this study, we investigated dedicated ultra-low dose CT (ULDCT) protocols using a third-generation dual-source CT with ultra-high pitch and different post-processing settings to evaluate their impact on the observer sensitivity for the detection of pulmonary nodules at different reader experience levels using an anthropomorphic phantom.
2. Materials and Methods
2.1. Phantom and Setup
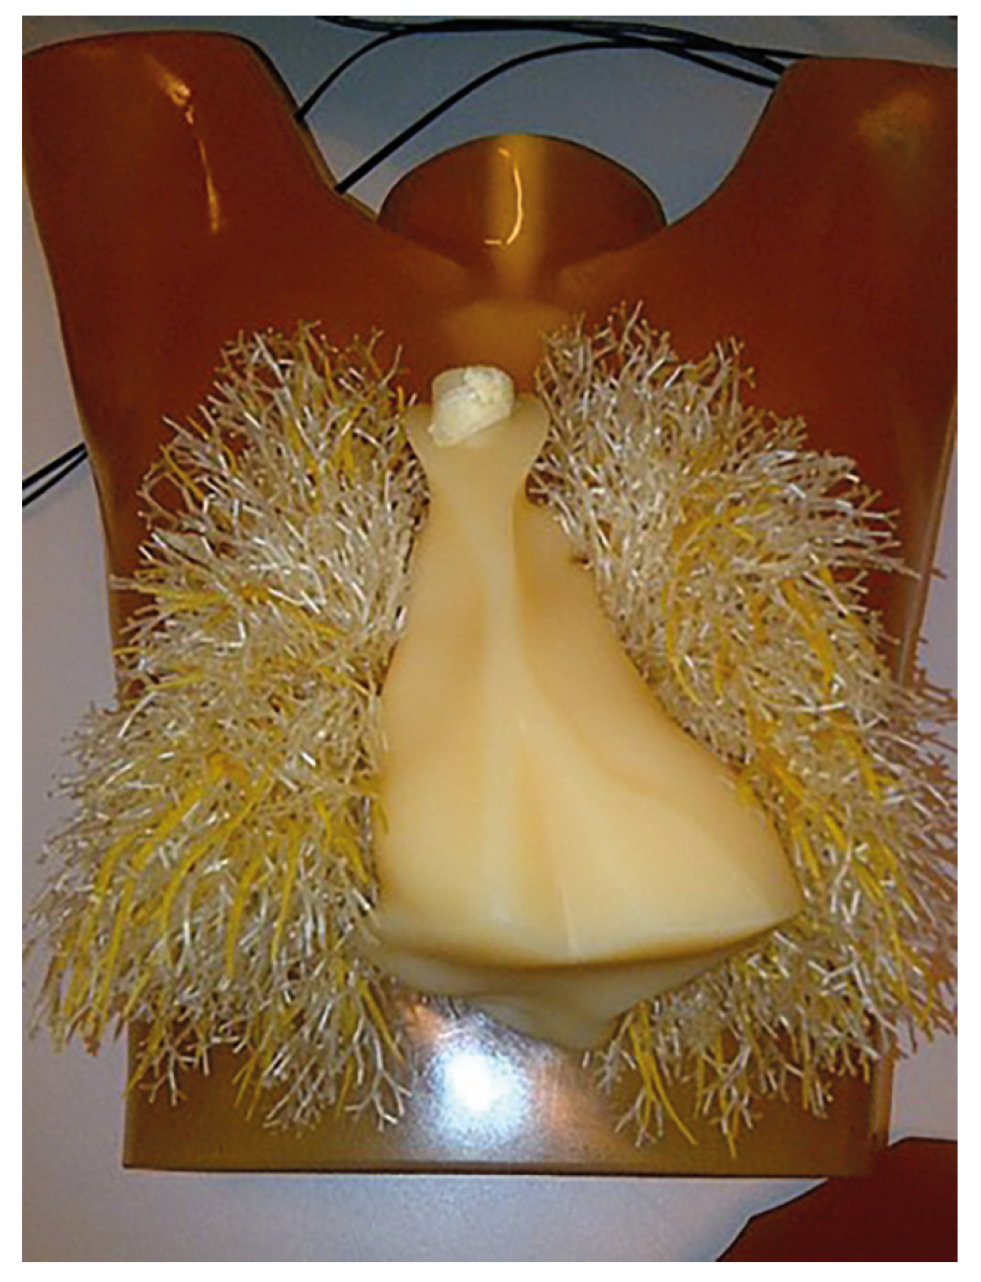
The anthropomorphic chest phantom used in this study was life-sized and equipped with an artificial thoracic wall, heart, mediastinum, diaphragm, and lung with pulmonary vessels (
Figure 1). The soft tissue was made of polyurethane resin, and for bone structures, epoxy resin was used.
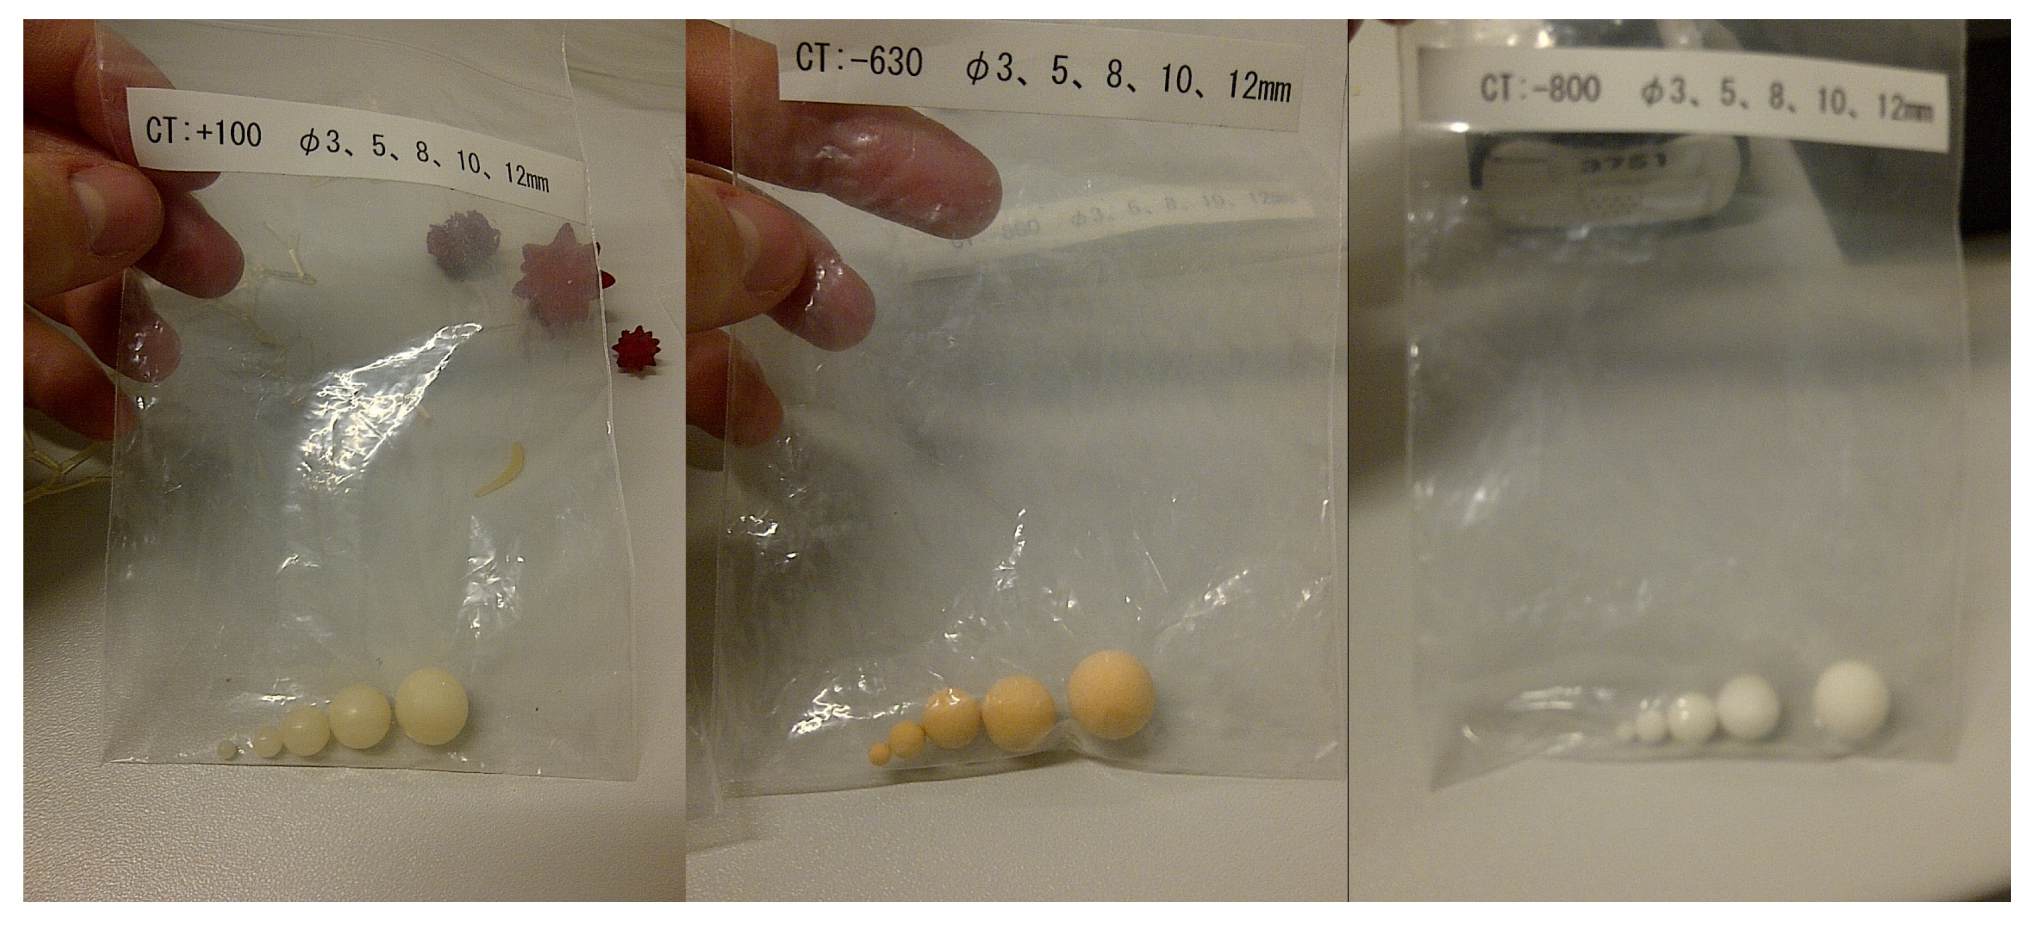
Artificial spherical nodules with a density of 100 Hounsfield units (HU) were made of polyurethane resin to represent the more common but also often benign solid pulmonary nodules. To represent the rare, but often malignant, subsolid nodes, nodules with densities of −630 HU and −800 HU were made of polyurethane foam resin. There were five different diameters: 3, 5, 8, 10, and 12 mm (
Figure 2).
A third researcher who was not involved in the readout randomly distributed the nodules in both lobes of the lung so that their position would remain unknown to the readers. The artificial nodules adhered to the artificial bronchovascular structures inside the phantom. This was repeated 13 times to generate 13 different settings.
2.2. Data Acquisition and Post-Processing
The phantom was scanned with different ultra-low-dose protocol combinations using a third-generation dual-source CT scanner system (2 × 192 slices; Somatom Force, Siemens Healthineers, Forchheim, Germany). The protocol parameters were a tube voltage of 100 kVp with a tin filter (100 kVp/Sn), four different tube current levels of 30 mAs, 60 mAs, 90 mAs, and 120 mAs, a rotation time of 0.25 s, detector collimation of 192 × 0.6 mm, and a matrix size of 512 × 512.
Each of the setups created was scanned with a non-high pitch of 1.2 and an ultra-high pitch of 3.2. The slice thickness was constantly kept at 1.5 mm, along with an increment of 1.0 mm throughout all study post-processing.
Filtered back-projection reconstruction (FBP) and advanced model-based iterative reconstruction (ADMIRE) at the strength levels of 1, 3, and 5 were applied. All scans were reconstructed once with a lung kernel Bl57 (“sharp”) and once with a medium-soft kernel Br36 (“soft”) for the study read-out (
Table 1). Due to the use of an artificial chest phantom, IRB approval was not required for this study.
2.3. Data Analysis
The reconstructed images were archived in the hospital’s research Picture Archiving and Communication System (PACS). For image analysis, dedicated software was used (Osirix DICOM viewer Version v.11.0 64-bit, Pixmeo, Geneva, Switzerland). The maximum intensity projection (MIP) was set to 10.
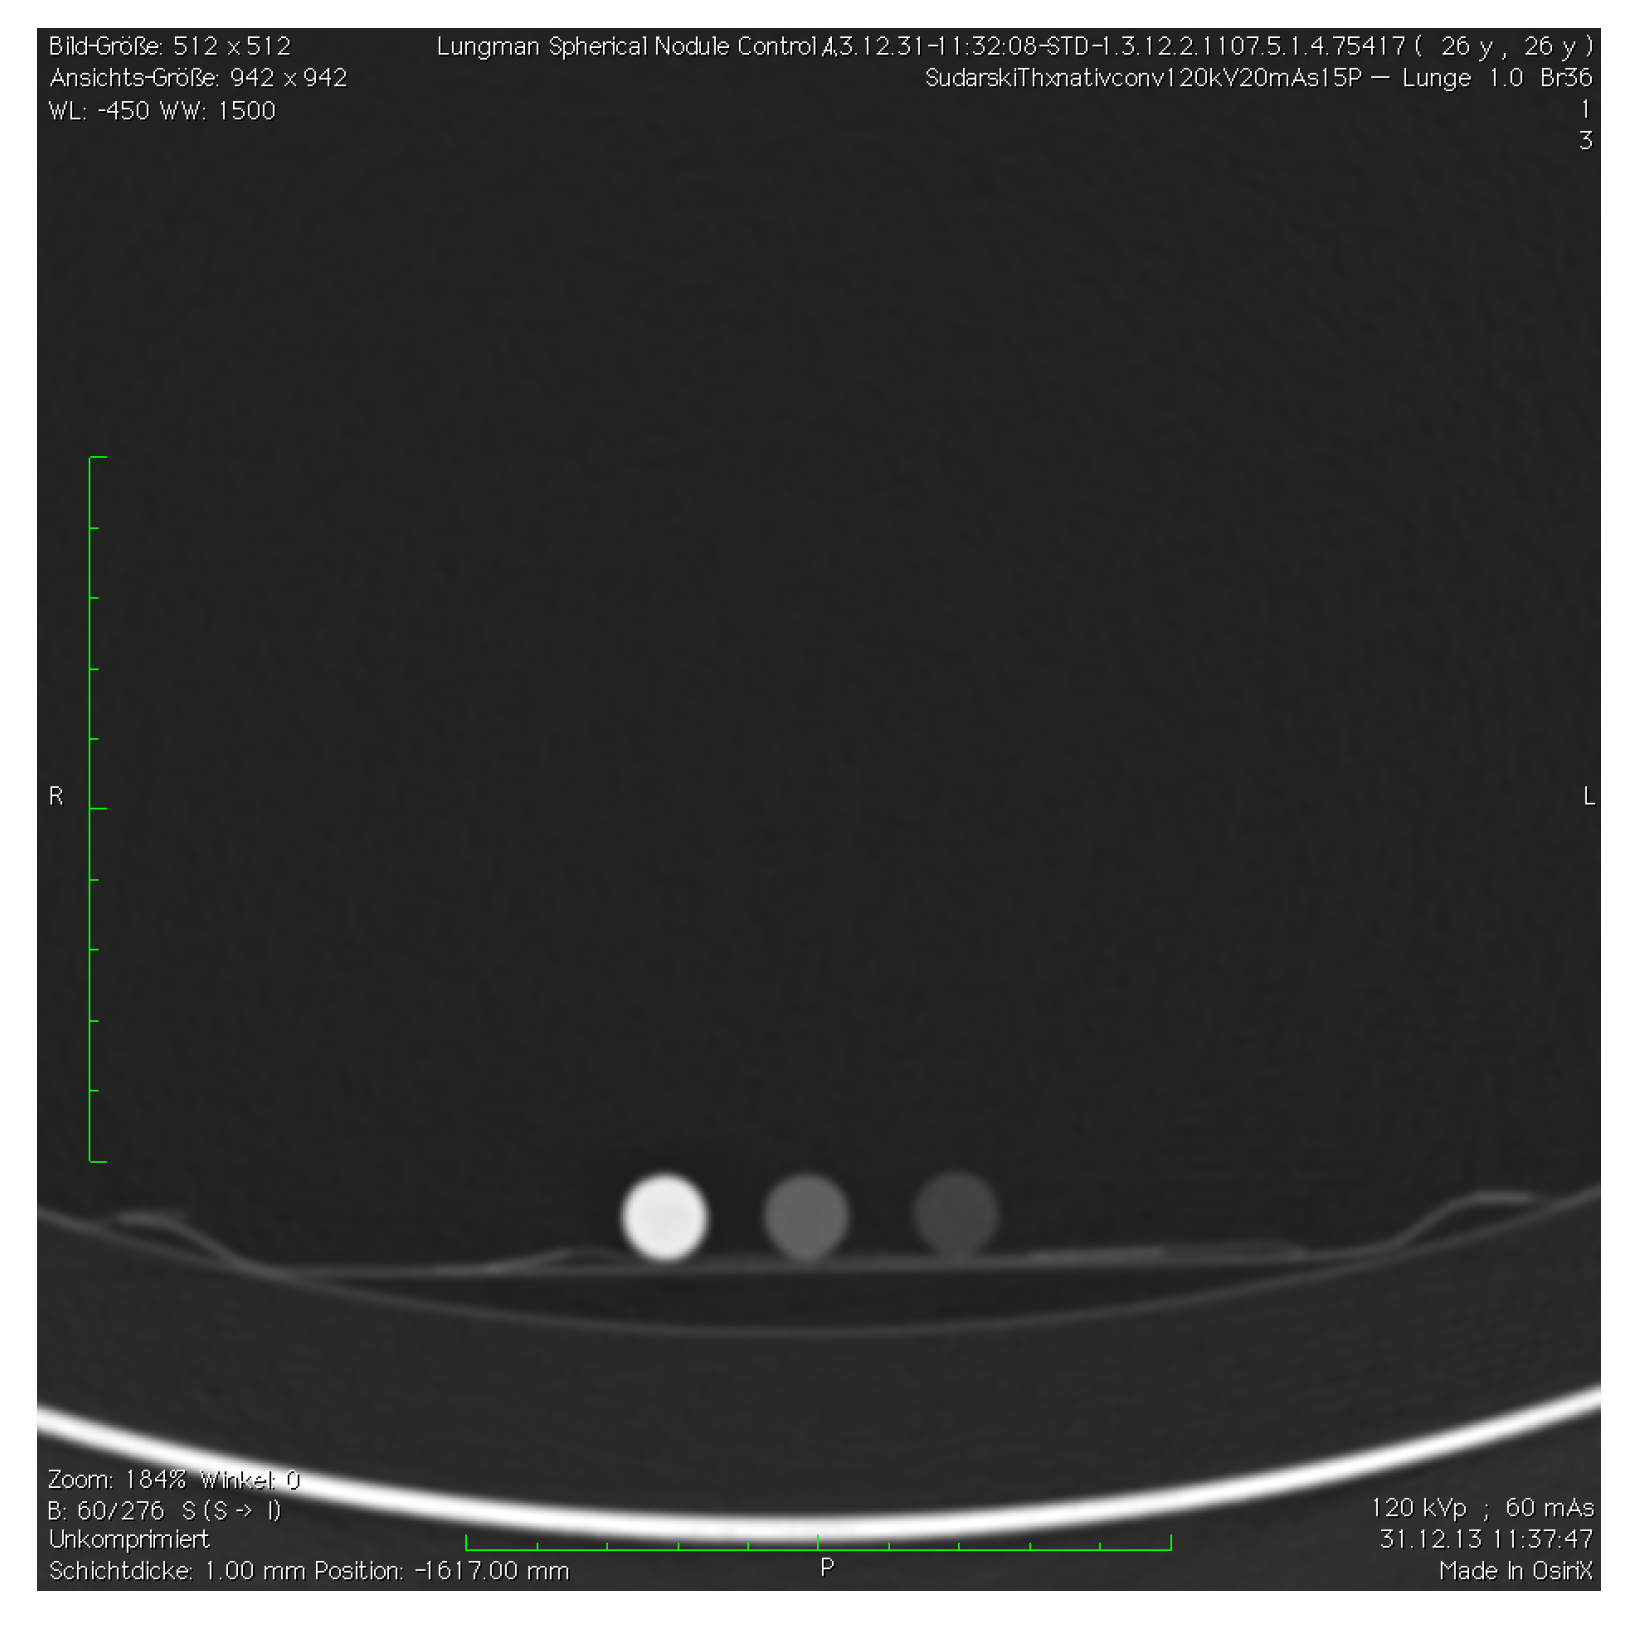
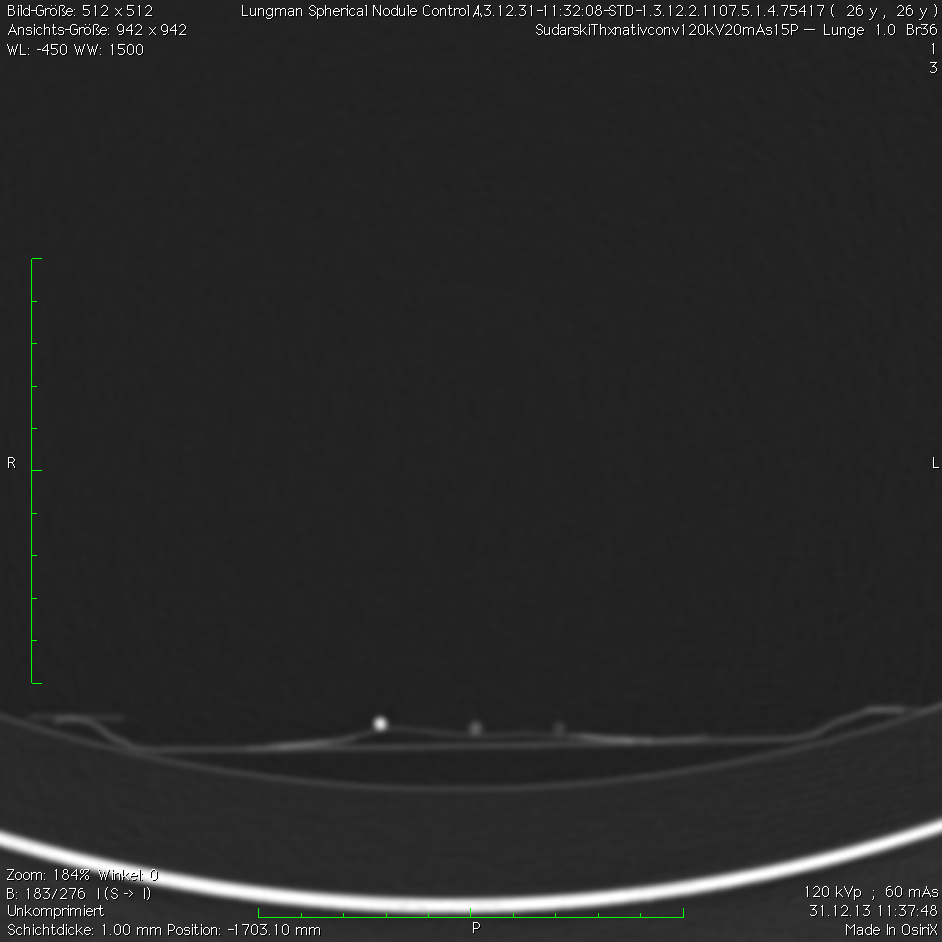
A total of 221 datasets were evaluated by two readers. One was an experienced radiologist with over 15 years of experience in thoracic CT imaging. The other one was an inexperienced reader—with no relevant experience in chest CT evaluation so far—who received basic training before the evaluation. Both readers were blinded to the number, location, and size of nodules within each of the nodule settings. To check the visibility of the nodules a control scan outside the chest phantom was performed for all protocols (
Figure 3 and
Figure 4). Records were kept on the number of nodules found in every setup and their measured density.
2.4. Statistical Analysis
The statistical analysis and the creation of graphs were performed by a professional statistician from the Department of Medical Statistics, Biomathematics, and Information Processing of the University Medical Centre Mannheim. The dedicated software used was SAS v9.4. 64-bit, SAS, Cary, NC, USA.
Observer detection sensitivity was calculated per setup as a percentage of true positives out of all findings. The Kruskal–Wallis test and the Mann–Whitney U-test for unconnected samples were performed.
Results are presented as the mean ± standard deviation. False positives (FPs) are presented as an absolute number and relative percentage.
3. Results
3.1. Observer Sensitivity
The highest observer sensitivity for both readers irrespective of nodule density was found in the non-high pitch protocols ADMIRE 5 sharp-120 mAs and ADMIRE 5 sharp–90 mAs with an observer sensitivity of 76.7% each (
Table 2). The lowest observer sensitivity of 54.7% was achieved with protocol FBP sharp-30 mAs using an ultra-high pitch. The readers achieved a mean overall observer sensitivity of 68.5% ± 20.6 (
p = 0.02).
For nodule densities of 100 HU, the highest observer sensitivity was measured for ADMIRE 3 sharp-30 mAs with 90% at the non-high pitch. The lowest sensitivity was 68% and was achieved in the protocols ADMIRE 5 soft-120 mAs and FBP sharp-30 mAs with ultra-high pitch and ADMIRE 3 soft and ADMIRE 5 soft at 90 mAs with non-high pitch.
For nodule densities of −630 HU, the best results in detection were achieved with ADMIRE 5 sharp-120 mAs with an 80% observer sensitivity at the non-high pitch. The highest results were obtained with ADMIRE 1 sharp-120 mAs at the ultra-high pitch and FBP sharp at 60 mAs and 30 mAs at non-high pitch (58%).
For nodule densities of −800 HU, ADMIRE 5 sharp-120 mAs showed a sensitivity of 72% at the non-high pitch. Only 34% was achieved with ADMIRE 1 sharp-30 mAs and ADMIRE 3 sharp-30 mAs at the ultra-high pitch and FBP sharp-30 mAs at the non-high pitch.
3.2. Pitch
Non-high pitch protocols showed significantly better results for the nodule densities of 100 HU and overall compared to ultra-high pitch protocols. The experienced reader achieved a mean observer sensitivity of 77.8% ± 35.8 with non-high pitch vs. 59.4% ± 40.2 with ultra-high pitch at 100 HU (p < 0.01). For all nodule densities, he reached 70.0% ± 20.4 with non-high pitch and 62.1% ± 22.5 with ultra-high pitch (p < 0.01).
The highest observer sensitivity for both readers combined was achieved with the non-high pitch for nodule densities of 100 HU with 80.4% ± 34.5 (p < 0.01). The lowest was achieved for nodule densities of −800 HU at non-high pitch (58.5% ± 36.3).
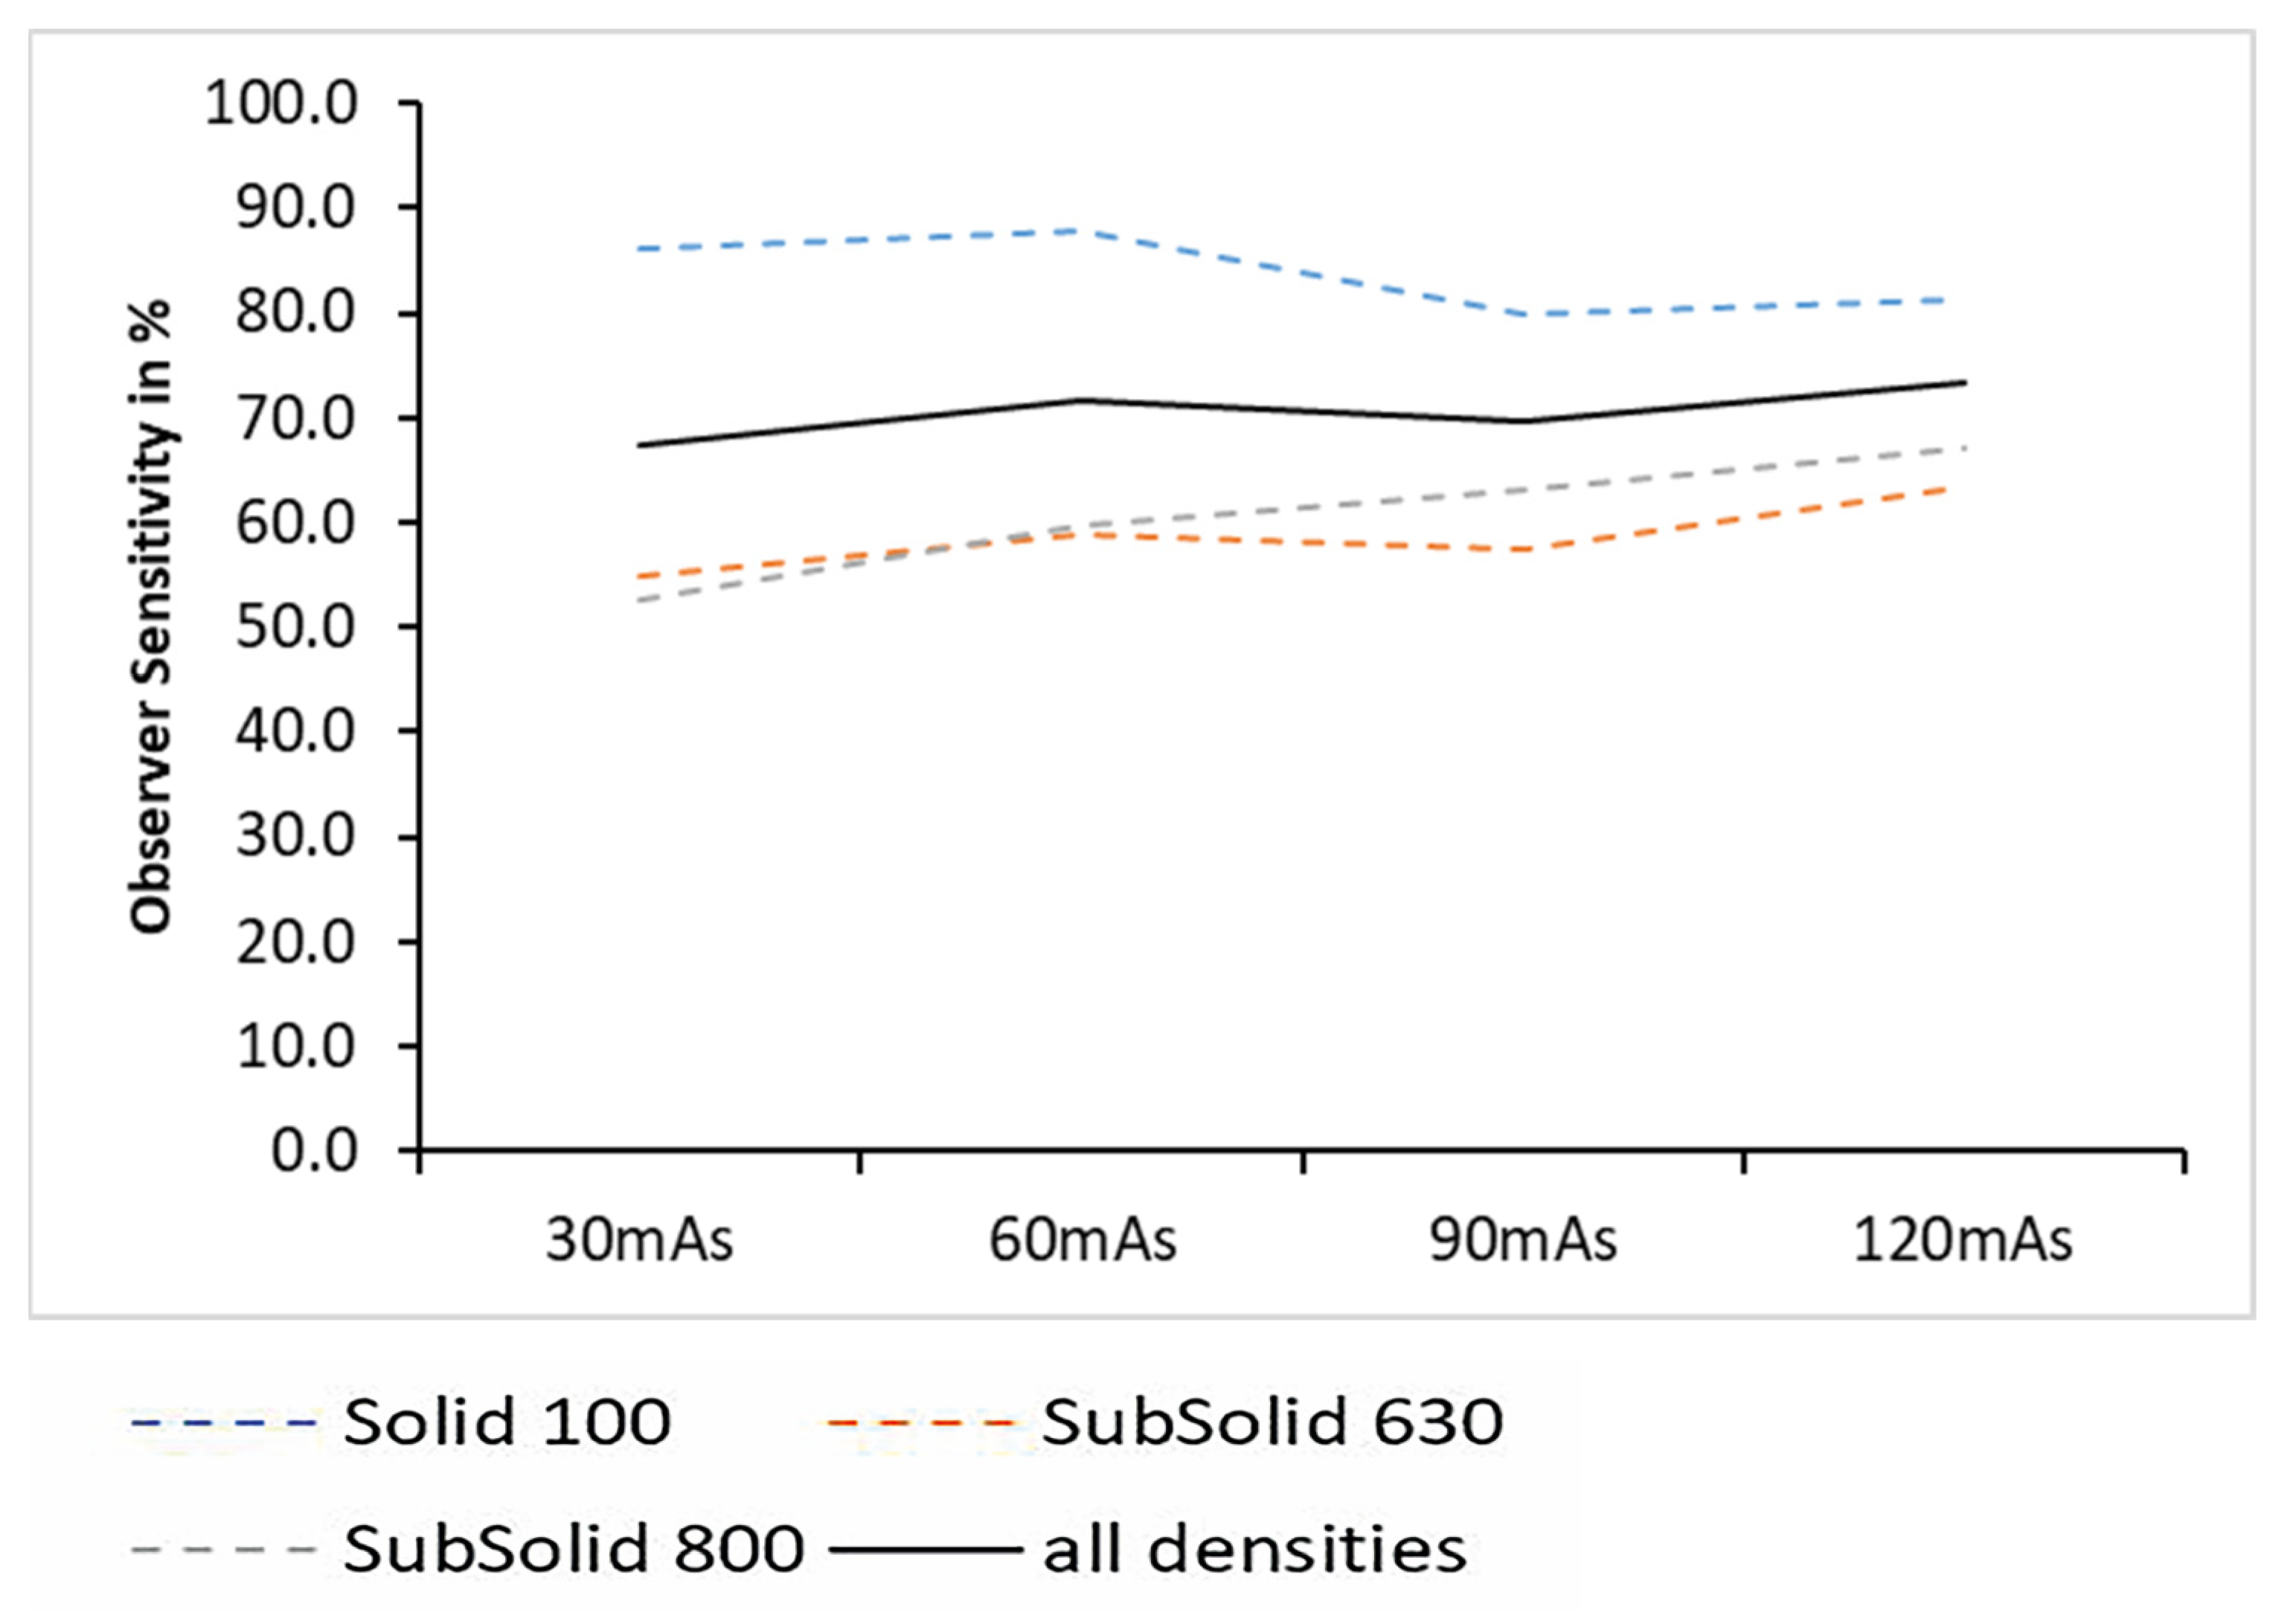
3.3. Tube Current Level
From 30 mAs–120 mAs, the observer sensitivity increased steadily. The lowest observer sensitivity was obtained at 30 mAs (64.6% ± 21.2).
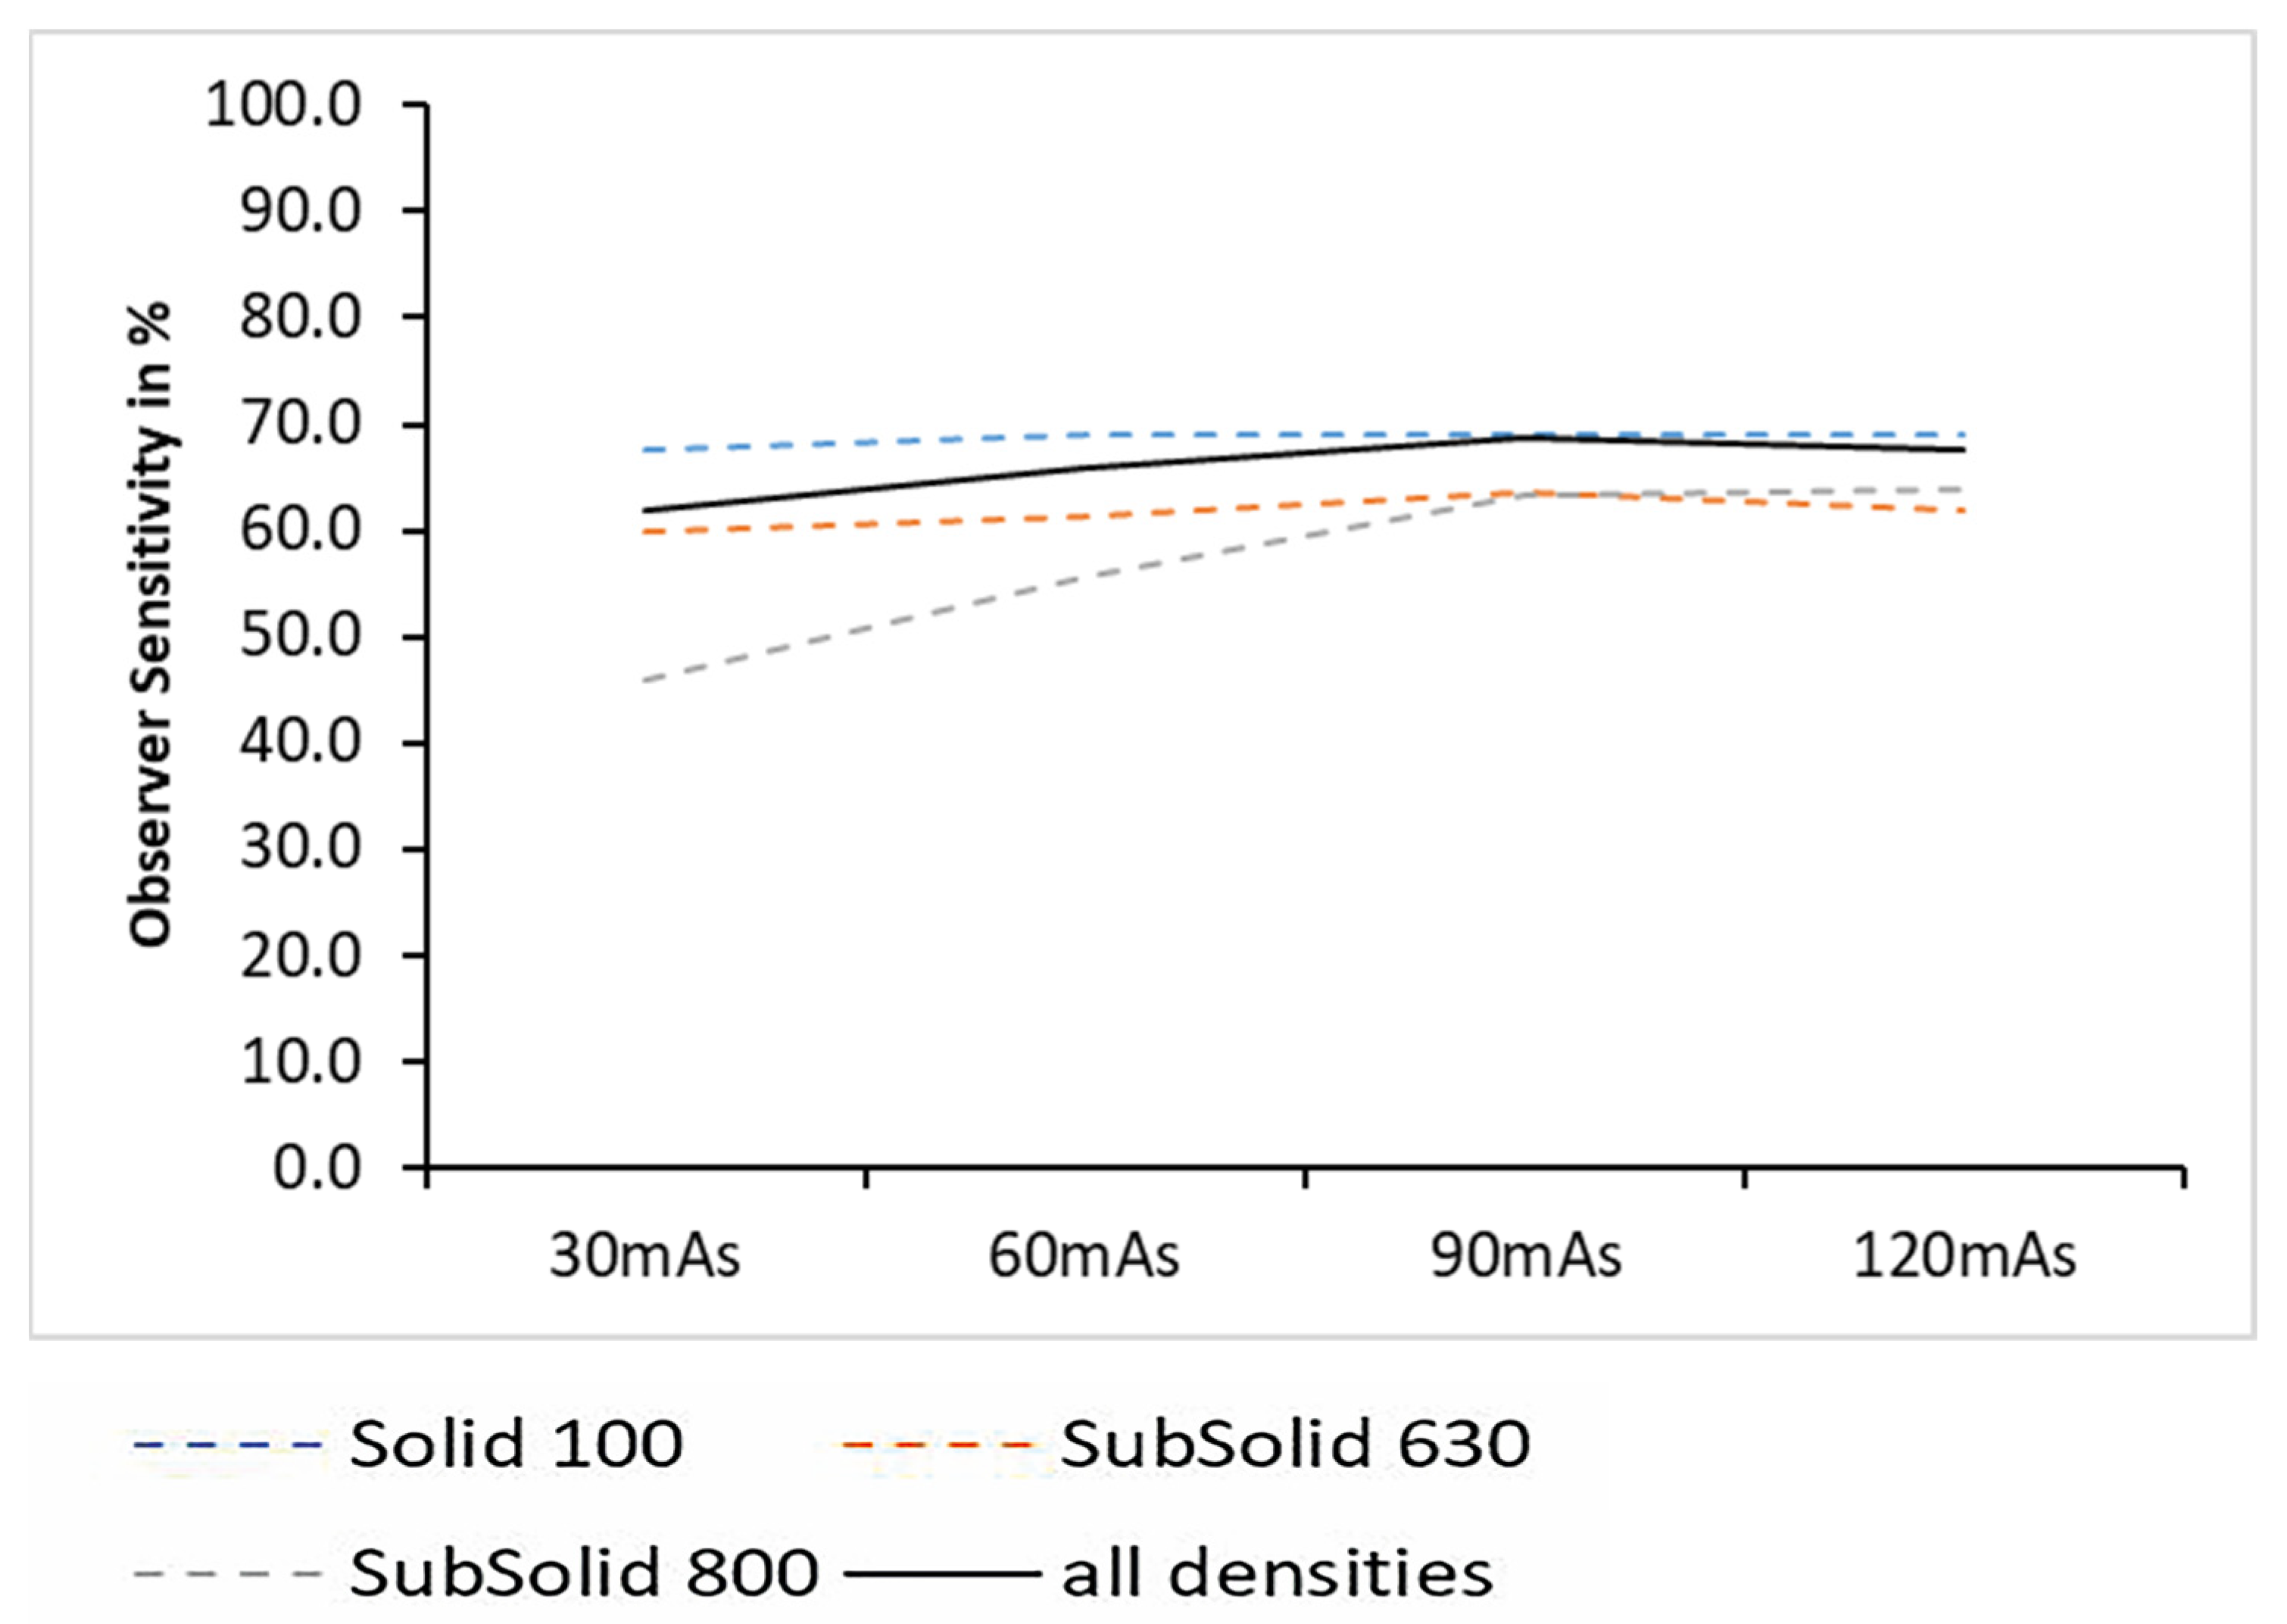
The inexperienced reader obtained the highest accuracy over all densities at the highest tube current setting at 120 mAs (73.5% ± 17.6;
p = 0.03) (
Figure 5), while the experienced reader achieved the highest observer sensitivity with 68.8% ± 20.5 at 90 mAs and 67.9% ± 25.4 at 120 mAs (
p = 0.07) (
Figure 6).
For nodule densities of −800 HU, both readers combined achieved the best observer sensitivity at 120 mAs (65.6% ± 35.29) and the lowest results at 30 mAs (49.2% ± 35.9).
The dose decreased from a DLP of 14.31 at 120 mAs to 11.00 at 90 mAs and 7.15 at 60 mAs to 3.69 at 30 mAs. The conversion factor from DLP to mSv was 0.015.
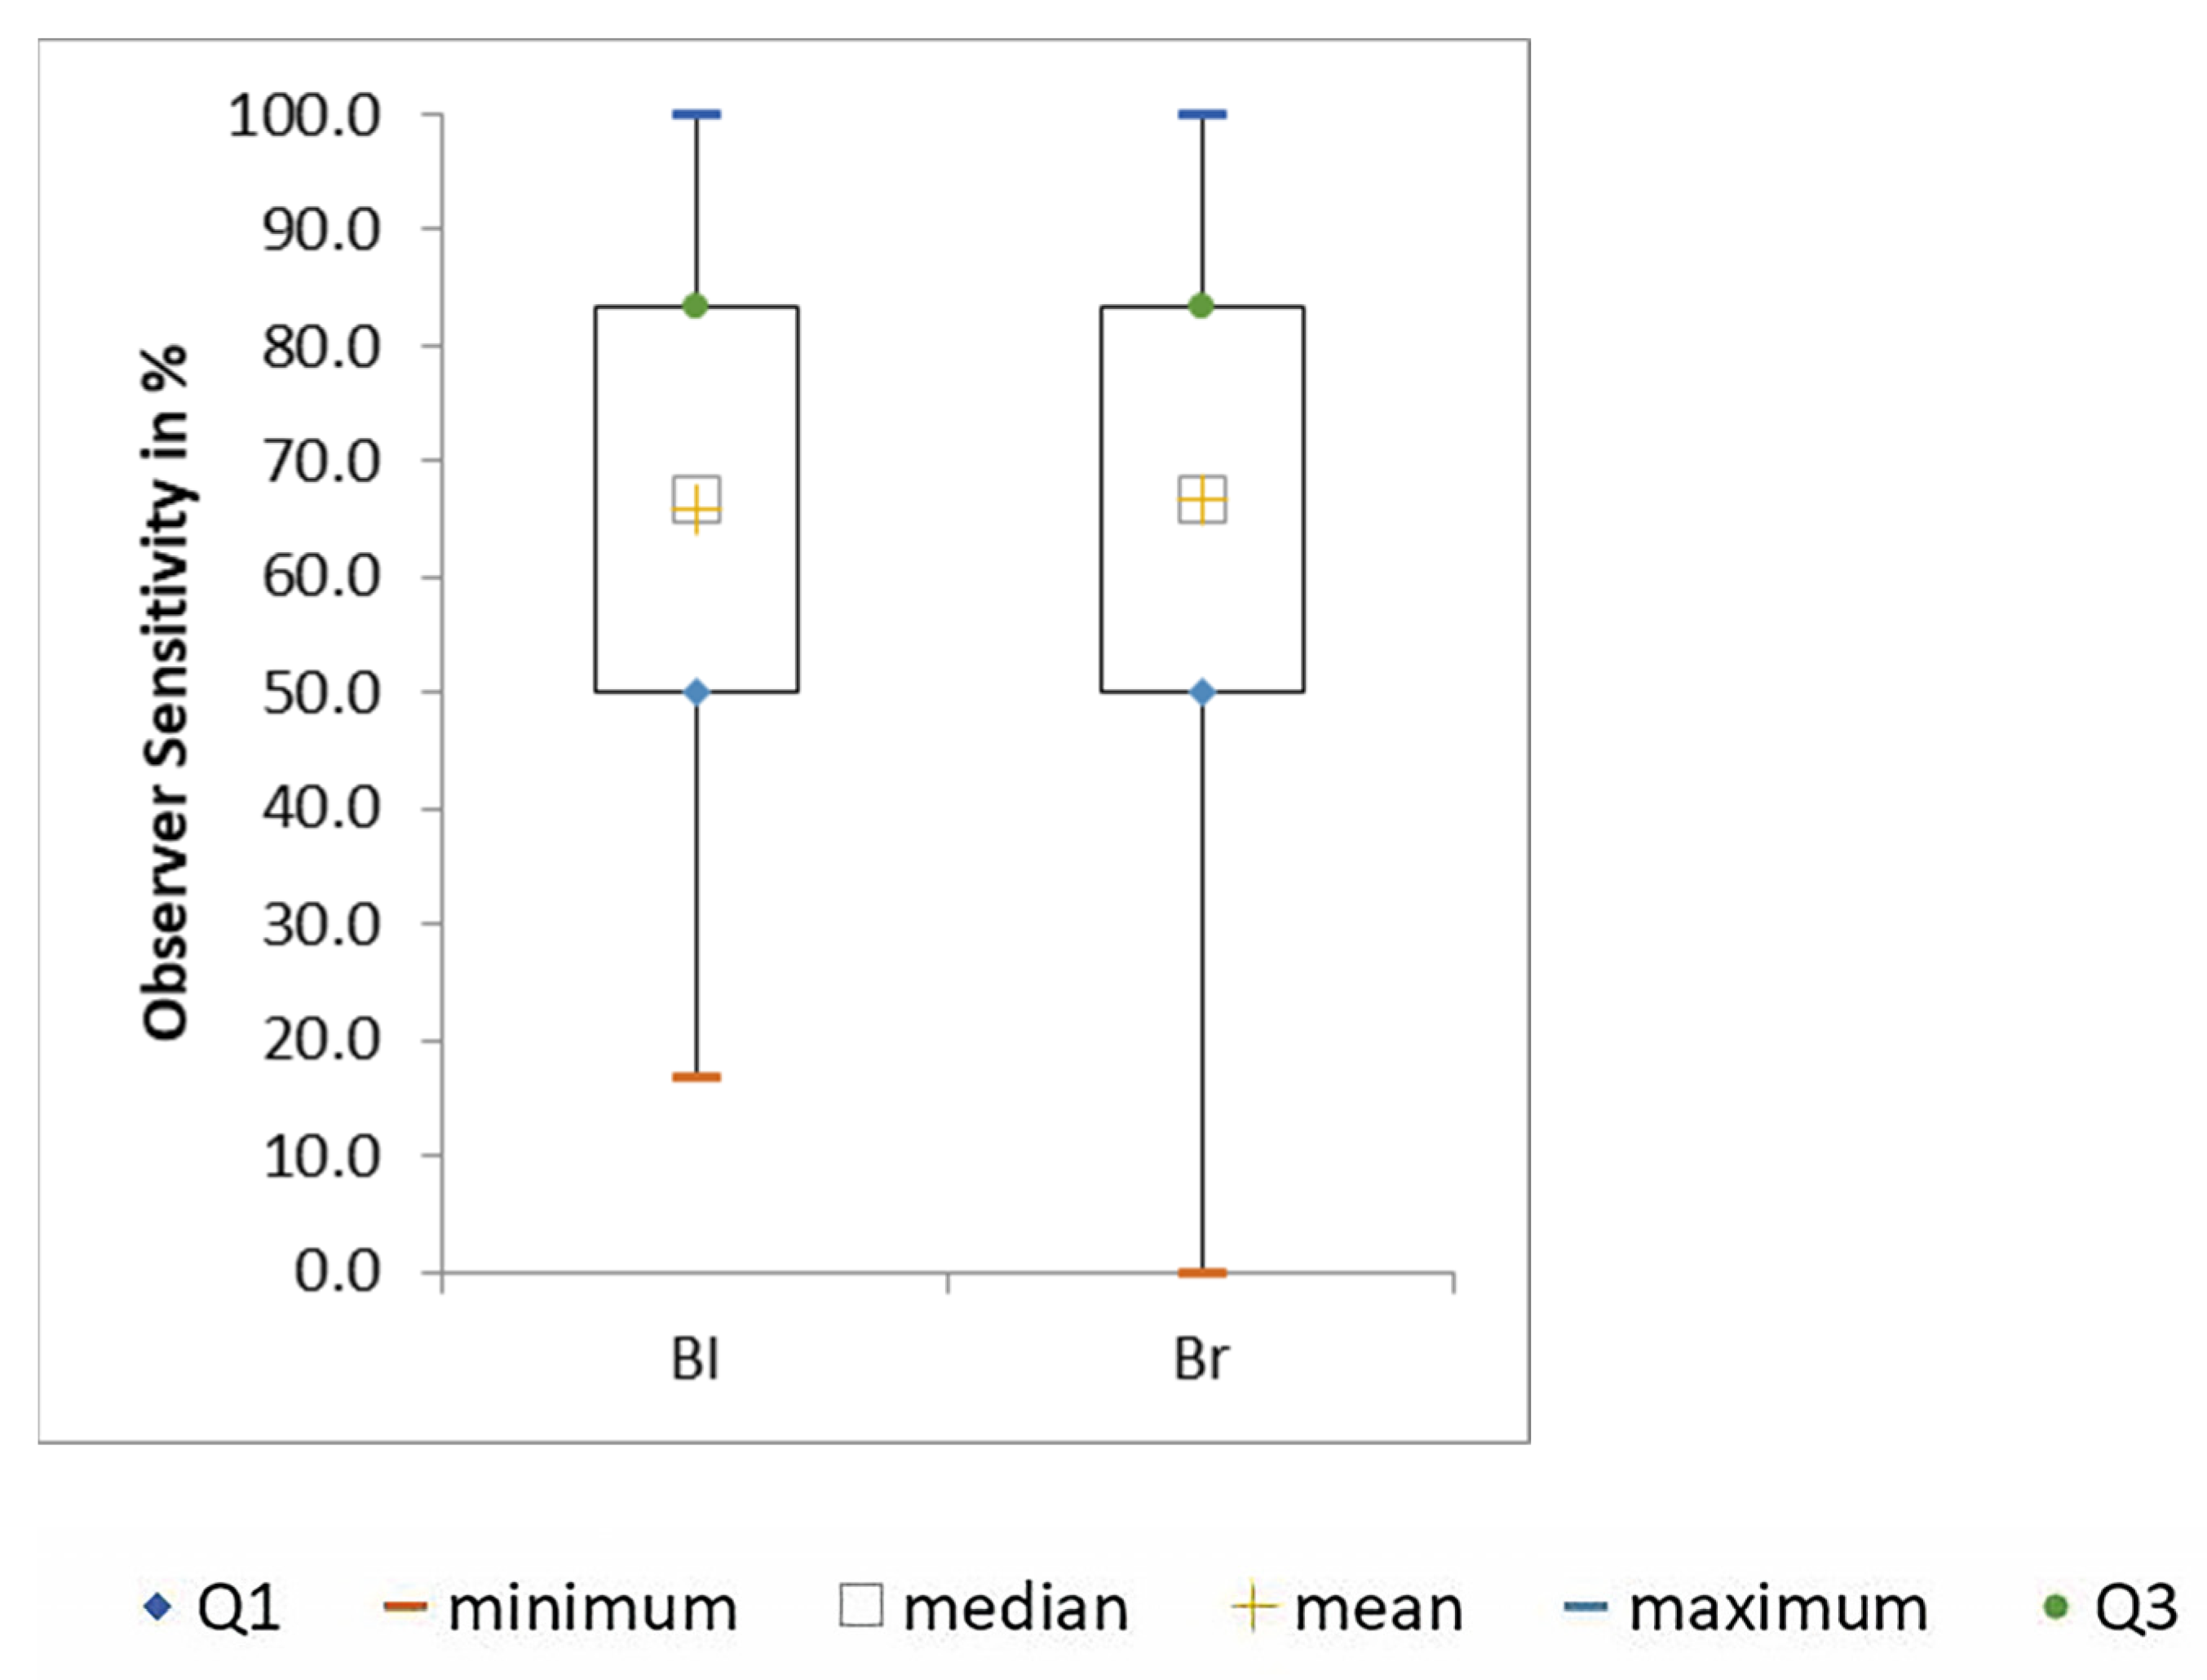
3.4. Kernel
There was a tendency for the highest observer sensitivity to occur for all images combined with the soft kernel for both readers together (68.8% ± 20.8,
p = 0.60) as well as for each alone (71.0% ± 18.9,
p = 0.80 and 66.6% ± 22.3,
p = 0.64). However, these results were not significant. Nevertheless, the results of both kernels were close to each other (
Figure 7 and
Figure 8).
There was an improvement in observer sensitivity with increasing nodule density for both kernels and both readers. The highest observer sensitivity was achieved with the sharp lung kernel at −800 HU (58.5% ± 36.5).
3.5. False Positives
The protocol with the most FPs was ADMIRE 3 soft-120 mAs at non-high pitch (4 of 40 FP; 10%). For nodule densities of 100 HU, there were only 6 FPs (15%), for −630 HU, there were 15 FPs (38%), and the most false positives occurred at −800 HU (19 FPs, equal to 48%).
Considering the mAs level, the most FPs occurred for a mAs setting of 120 (15; 38%).
Furthermore, 24 FPs (60%) occurred with the sharp kernel and 16 (40%) with the soft kernel.
4. Discussion
There have not been many trials using third-generation dual-source CT for lung examinations. A study from 2019 compared a dual-source CT of this generation with a 16-row Light-speed CT in the examination of pediatric oncology patients. They unsurprisingly achieved significantly lower tube voltage and tube current with better image quality with the dual-source scanner. Moreover, a reduction of motion artefacts was apparent [
15].
In 2020, another group investigated the sensitivity of multidetector CT for the detection of interstitial lung disease. They measured a high sensitivity of 91.4% [
16].
In our study, dual-source CT images reconstructed with ADMIRE 5 were found to give better results than lower ADMIRE settings or FBP.
While ADMIRE 5 sharp-30 mAs at non-high pitch reached an observer sensitivity of 71.4%, a tube current of 60 mAs was needed to reach the same value as ADMIRE 3 sharp at the non-high pitch. ADMIRE 1 sharp required 120 mAs to achieve 71.3%, and FBP sharp only reached 69.4%, even at 120 mAs (
Table 2). This shows how iterative reconstruction algorithms can reduce the dose while obtaining high observer sensitivity rates using the manual readout.
Several trials support this evidence. The previously mentioned study from 2019 proved similar to another iterative reconstruction mode, adaptive statistical iterative reconstruction (ASIR-V, GE Healthcare, Chicago, IL, USA), which was also able to improve image quality in ULDCT compared to FBP in a lung phantom [
17].
As early as 2011, another study showed a dose reduction of 40% for second-generation dual-source CT while applying iterative reconstruction in images space (IRIS, Siemens Healthineers, Erlangen, Germany) to result in the same noise as FBP at a 100% dose in a phantom [
18].
While the efficacy of iterative reconstruction is not unheard of, it is of interest for the clinical routine to know what level of reconstruction might achieve the best results. In 2015, a study compared FBP to ADMIRE 3 and 5 while reducing the radiation dose in a similar setting using a chest phantom and artificial lung nodules on a third-generation dual-source CT. They noted significantly lower image noise and fewer false positives of nodules using ADMIRE 5 [
19].
In line with that, our findings showed ADMIRE 5 as the best choice for all reconstruction modes for the detection of lung nodules.
Furthermore, ultra-high pitch and non-high pitch were compared. For the inexperienced reader, there was no significant difference (p = 0.06). The experienced reader showed a significantly higher observer sensitivity for non-high pitch protocols in the U-Test for the densities of 100 HU (p < 0.01) and overall (p < 0.01). This result indicates that radiological practices that only have standard equipment can also offer screening with their equipment as many scanners only provide pitch levels up to 1.5. The experience of the reader seems to be of greater importance here than the advantage of the pitch.
From our point of view, there is no apparent explanation for these results. However, a research group evaluated the influence of high pitch on the accuracy of volumetry for solid pulmonary nodules using a second-generation CT in a similar setup in 2015 [
20]. They also concluded that the accuracy was comparable to those of conventional pitch but also found high-pitch protocols to be less accurate for the volumetry of smaller nodules. This might be dependent on the use of an artificial phantom thorax with no breathing. In reality, ultra-high pitch is primarily a method to reduce radiation dose and motion artefacts. Especially in screening, the patient should be exposed to as little harmful radiation as possible so that the benefit outweighs the risk of the examination. Therefore, ultra-high pitch, which is expected to be of great benefit under real conditions, might not provide an advantage here. In 2018, another group of researchers demonstrated on a second-generation dual-source CT that ultra-high pitch improves image quality and lowers radiation exposure at the same time when used for coronary angiography [
21]. With this, image quality was mainly determined by motion artefacts.
Keeping this in mind, the setting should still be useful for lung screening in a clinical routine, when the patient is breathing, and radiation dose needs to be considered.
Results show that a higher tube current equals a higher observer sensitivity. In 2010, a study showed a diagnostically relevant decrease in quality below 60 mAs in a dose simulation study of lung parenchyma at a high-resolution kernel [
22]. This lines up with the findings of our study. Especially with low-density nodules, choosing the right tube current can improve the reader’s detection rate. With high-density nodules, only the inexperienced reader had a significant benefit.
The number of false-positive nodules was at its maximum across all densities at the mAs setting of 120 (15; 38%), while 90 mAs showed the lowest number (4; 10%) and 60 mAs showed 6 FPs (15%). This could be an indication that 90 mAs would be the best compromise between observer sensitivity and false positives. The cause of this difference should be evaluated in more detail in further studies.
Another outstanding result is that the kernels do not make that much of a difference. The soft kernel is normally applied to soft tissue and is often excluded from studies on the lung. Although the best observer sensitivity for both readers combined was achieved with a sharp kernel at 100 HU (76.6% ± 36.6), there has been a tendency toward better detectability with the soft kernel across all nodule densities combined, as well as for the subsolid nodules (p = 0.60).
Additionally, the sharp kernel showed more false positives across all densities than the soft kernel (24; 60% vs. 16; 40%). In total, it not only shows more false positives but also insignificantly worse results than the soft kernel. Considering this, the habit of including only the sharp kernel in studies and its status as the standard lung kernel might need to be reconsidered, especially given the number of FPs occurring.
With decreasing nodule density, the number of FPs increased. As mentioned before, at 100 HU, only 15% of all FPs occurred, while at −630 HU, it was already 38%. Almost half of the false positives occurred at −800 HU (48%). This illustrates the often-mentioned issue of overdiagnosis. The NELSON trial showed an overdiagnosis rate of 19.7% in real patients within ten years and 8.9% after eleven years, claiming that a longer screening interval can reduce false positives [
10]. This was not possible to include in our phantom study. However, it can be seen clearly that the overdiagnosis rate is much lower for solid nodules and increases with diminishing density.
Limitations
The use of a phantom causes some limitations. First, it does not breathe. Second, it shows factory-caused irregularities, which might feign nodules. Furthermore, the nodules inevitably adhere to the structures of the phantom and cannot be located freely in the parenchyma. This makes measurement more difficult for the readers and might have increased the number of false positives.
Another limiting factor was the use of spherical nodules only. There is no information on whether these correlations also apply to spiculated or lobulated nodules.
There was no semi-automated software involved in the assessment. A complementary phantom study focusing on the possible advantages of using computer-aided detection (CAD) can be found by the same institution with an identical chest phantom setting and similar scan parameters [
23].
Furthermore, it cannot be ruled out that the inexperienced reader benefits even from a small training effect. To minimize this influence, a two-week briefing and practice time was allowed to become accustomed to the data analysis course.
Thirteen different setups were scanned for each protocol. Both assessors were completely blinded to the number and location of nodules. Moreover, they had no information if the enumeration of setups was changed in between. This ought to avoid a recognition effect. The tube voltage and current levels, kernels, and reconstruction settings were mixed so that they would not become familiar with one setting.
As can be seen, a high standard deviation was determined. To increase the sharpness of the results, the number of assessors and readings should be expanded further in future studies.


