Article

Performance of Radiologists in Characterizing and Diagnosing Hepatic Lesions Using Dynamic Contrast-Enhanced CT With and Without Artificial Intelligence


1
Department of Artificial Intelligence in Diagnostic Radiology, University of Osaka Graduate School of Medicine, Suita 565-0871, Osaka, Japan
2
Department of Radiology, University of Osaka Graduate School of Medicine, Suita 565-0871, Osaka, Japan
3
Department of Future Diagnostic Radiology, University of Osaka Graduate School of Medicine, Suita 565-0871, Osaka, Japan
4
Department of Radiology, Kobe University Graduate School of Medicine, Kobe City 650-0017, Hyogo, Japan
5
Department of Medical Physics and Engineering, Division of Healthcare, University of Osaka Graduate School of Medicine, Suita 565-0871, Osaka, Japan
6
Department of Radiology, Shiga University of Medical Science, Otsu 520-2192, Shiga, Japan
7
Institute for Radiation Science, University of Osaka, Suita 565-0871, Osaka, Japan
*
Author to whom correspondence should be addressed.
Appl. Biosci. 2025, 4(4), 56; https://doi.org/10.3390/applbiosci4040056
Submission received: 29 October 2025 / Revised: 15 November 2025 / Accepted: 27 November 2025 / Published: 3 December 2025
(This article belongs to the Special Issue Neural Networks and Deep Learning for Biosciences)

Abstract

Background: To investigate the performance of radiologists in characterizing and diagnosing hepatic lesions with and without the assistance of deep learning-based artificial intelligence (AI). Methods: This retrospective study included 83 nodules/masses from 69 patients who underwent dynamic contrast-enhanced CT of the liver. Image assessments were conducted by 20 radiologists. grouped according to their level of experience (10 senior and 10 junior). Each radiologist determined the probability of eight characteristics based on enhancement patterns and the diagnosis with and without AI attached to the SYNAPSE SAI viewer (FUJIFILM Corporation, Minato-ku, Japan). The reference standard for comparison was established as follows: final diagnoses were based on pathology for 39 lesions and expert imaging consensus for the remainder, while image characteristics for all lesions were determined by expert imaging consensus. Areas under the receiver operating characteristic curves (AUCs) were analyzed using the multireader multicase method. Results: Using AI significantly improved the overall AUCs for both the characterization and the diagnosis of liver lesions. Improvement was suggested for specific items, including the characterization of enhancement, nonperipheral washout, and delayed enhancement, and the diagnosis of hepatocellular carcinoma. The utilization of AI system also suggested potential improvements in the AUCs for image characterization in both the senior and junior groups. Conclusions: Using AI improved the radiologists’ performance in characterizing and diagnosing hepatic lesions. In terms of their capacity to assess imaging characteristics, improvements were observed regardless of their level of experience.

1. Introduction

Liver cancer occurs worldwide and has a poor prognosis. According to GLOBOCAN 2022 data, liver cancer was the sixth most diagnosed type of cancer and the third leading cause of cancer death in 2022 [1]. Hepatocellular carcinoma (HCC) accounts for up to 90% of primary liver cancers and has a five-year survival rate of <20%. The prognosis is even poorer when HCC is diagnosed at an advanced stage [2,3,4,5]. Therefore, detailed characterization and early diagnosis of liver lesions are important for appropriate patient management and optimal treatment selection [6,7,8,9].
Radiologists contribute to the early diagnosis of HCC and malignant tumors by evaluating images of hepatic lesions and providing accurate information, which is combined with pathological evidence. Dynamic contrast-enhanced CT is one of the most widely used methods for imaging hepatic lesions because of its noninvasive nature [10,11,12,13], and radiologists evaluate enhancement patterns of lesions using standardized imaging guidelines, such as the LI-RADS 2018 [14,15,16,17,18].
Recent research and developments in the use of artificial intelligence (AI) in radiology indicate that radiologists who use AI will be able to more precisely evaluate images of liver lesions than those who do not, and this is expected to improve the clinical care and prognosis of patients [19,20,21,22,23]. Recently, deep learning was applied to develop a system that automatically evaluates the imaging characteristics of hepatic lesions [24,25]. The AI system reportedly simultaneously analyzes multi-phase image data and recognizes imaging features important for diagnosis with high accuracy. Using such AI systems is expected to improve the daily workflow of radiologists and reduce the occurrence of medical errors. There is still insufficient research on how AI systems affect a radiologist’s performance when interpreting images of liver lesions. Thus, there is an urgent need to determine the effects that utilizing AI has on the performance of radiologists so that its clinical benefits and applicability can be verified.
In this study, we investigated how the use of an AI system affected the performance of radiologists in characterizing and diagnosing hepatic lesions. The primary aim was to compare the performance of radiologists with and without AI assistance. The secondary objective was to examine differences in the effectiveness of using an AI system based on the experience level of radiologists.

2. Materials and Methods

2.1. Study Population and CT Examinations

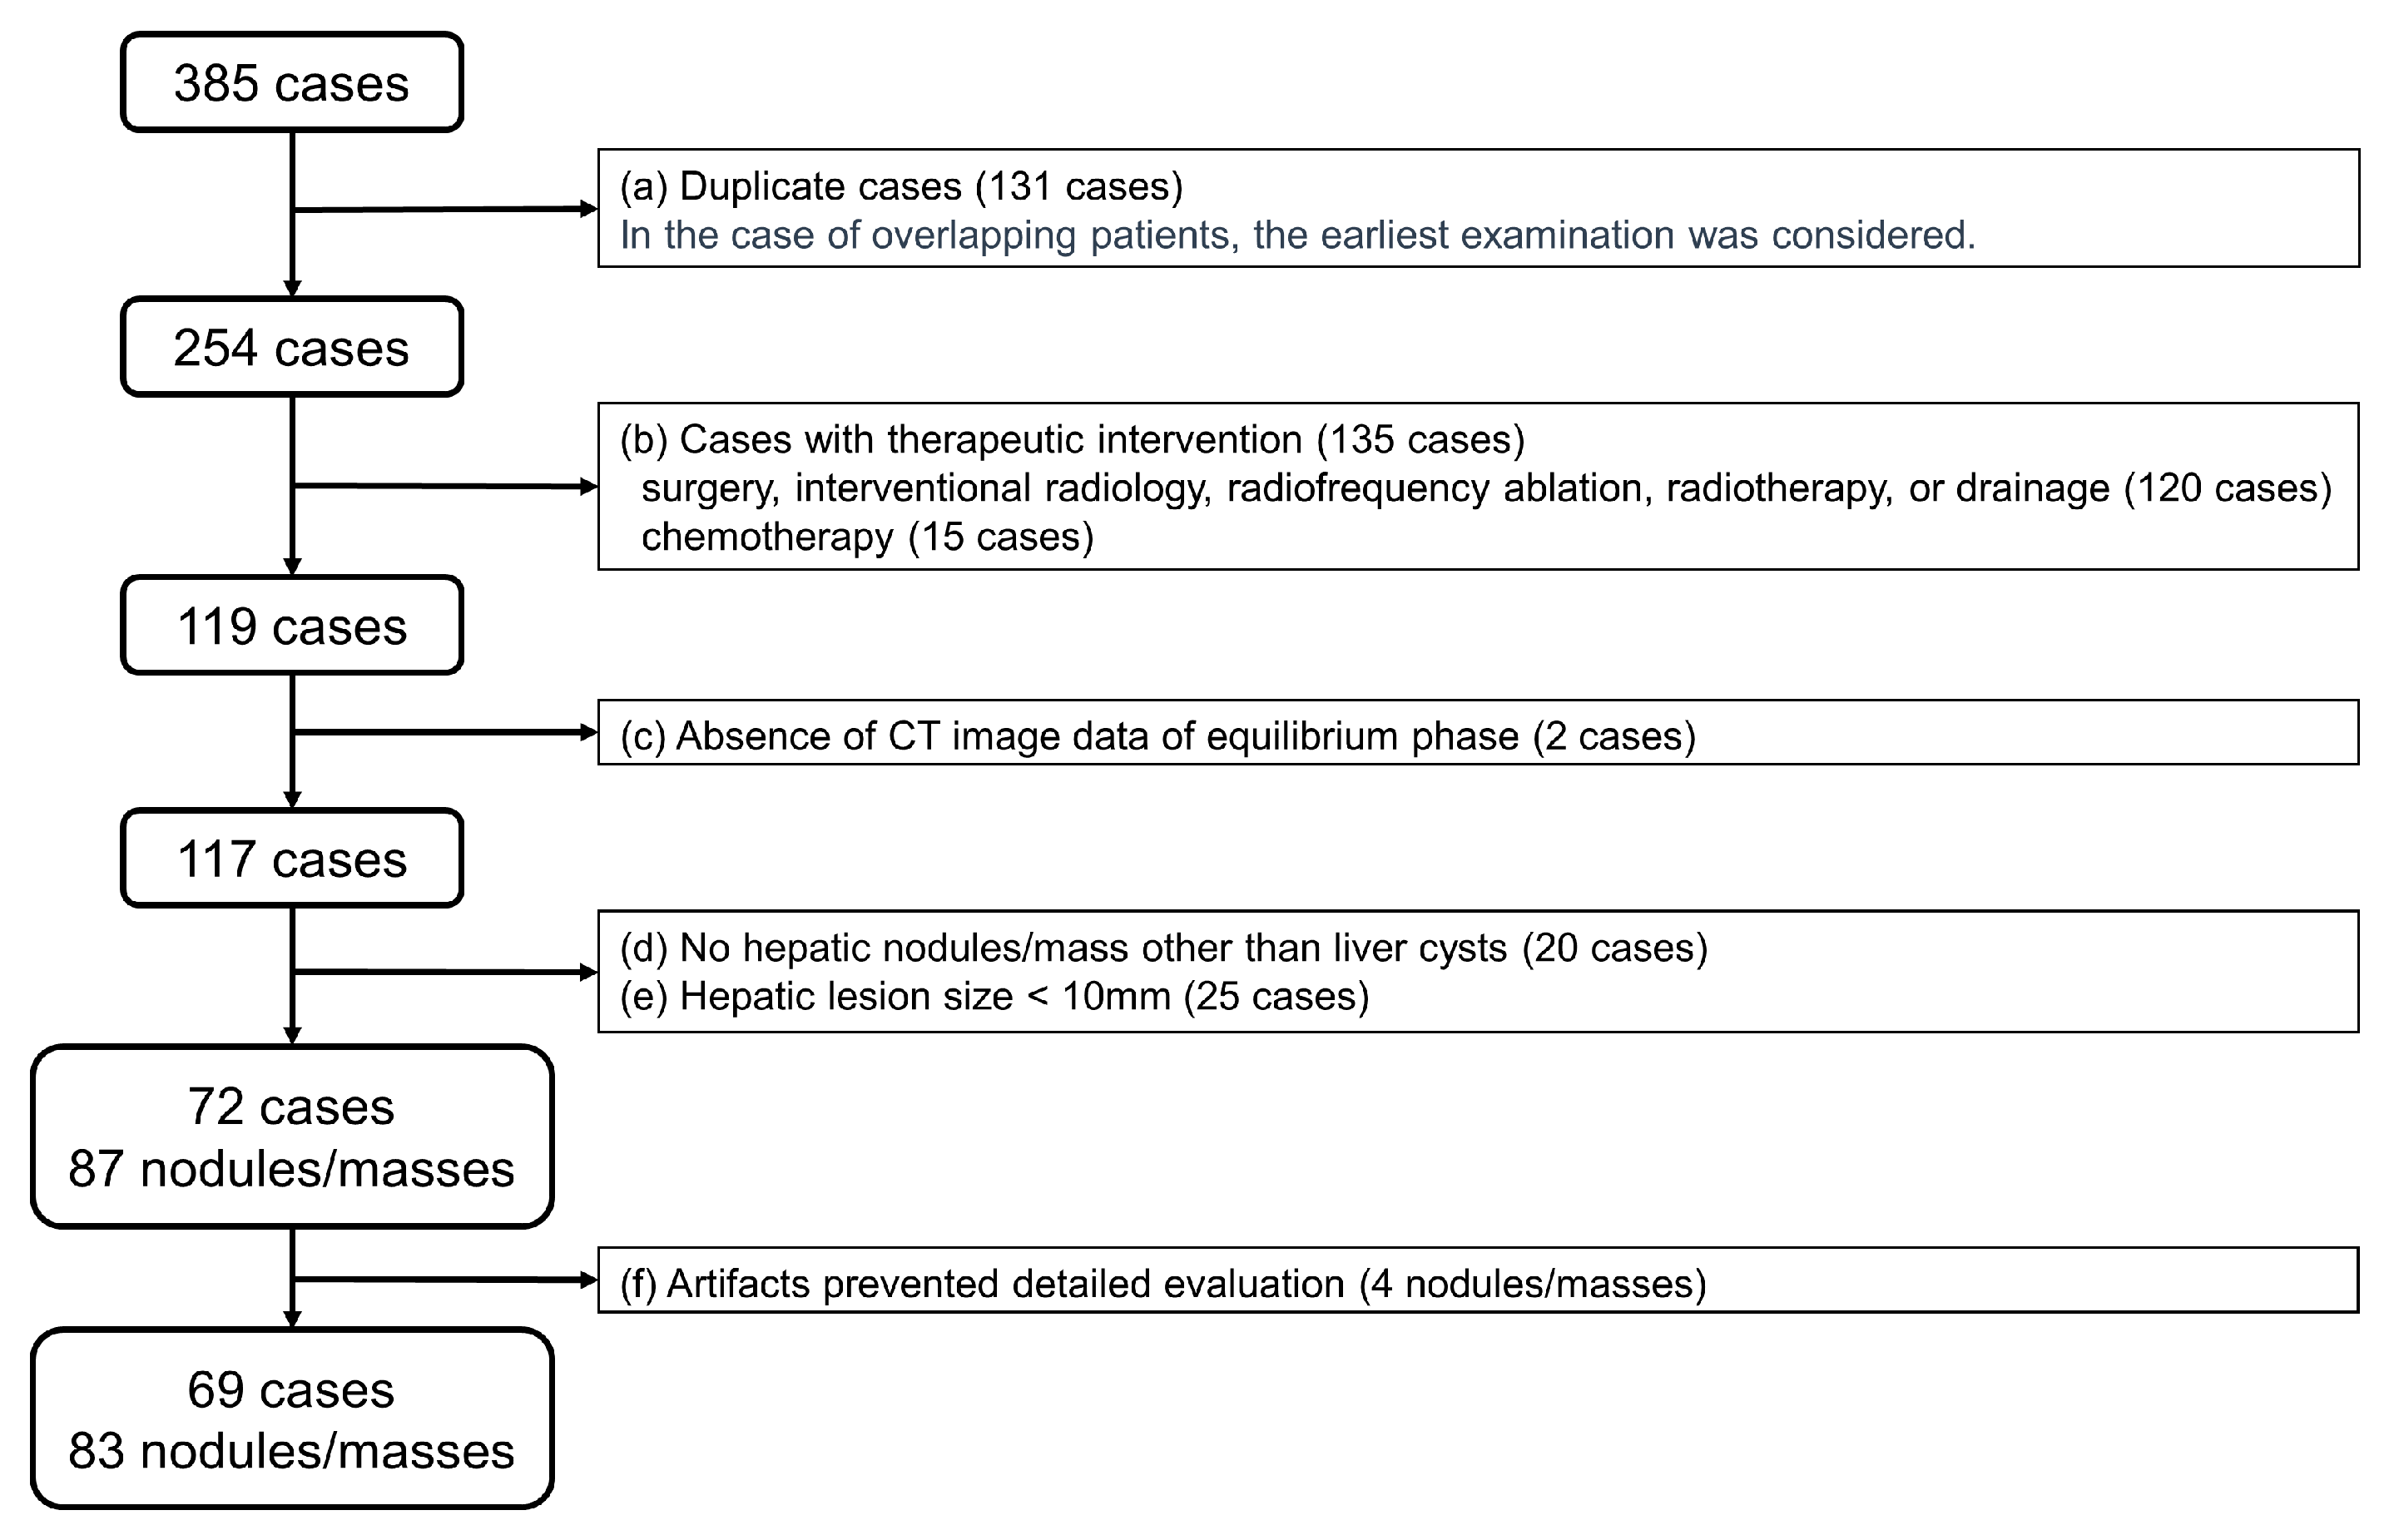
The flowchart for the patient enrollment process is shown in Figure 1. There were 385 patients who underwent dynamic contrast-enhanced CT of the liver at the University of Osaka Hospital between July 2020 and May 2021. CT image data from the arterial, portal, and equilibrium phases were acquired using either a 64-channel (Discovery CT 750 HD; GE Healthcare, Chicago, IL, USA), a 256-channel (Revolution CT; GE Healthcare), or a 320-channel (Aquilion ONE, Aquilion Precision; Canon Medical Systems, Otawara, Japan) CT scanner. Images were reconstructed using the following iterative reconstruction algorithms: Adaptive Statistical Iterative Reconstruction (ASiR) for Discovery CT 750 HD, Adaptive Statistical Iterative Reconstruction-V (ASiR-V) for Revolution CT, and Adaptive Iterative Dose Reduction Using 3-dimensional Processing (AIDR 3D) for Aquilion Precision and Aquilion ONE GENESIS edition. From the set of identified lesions (up to two of the largest lesions per patient), a subset of 83 nodules/masses in 69 patients that met the following inclusion criteria was selected: (a) lesion(s) identified during the earliest examination in cases of patients who underwent multiple examinations; (b) no therapeutic intervention for the lesion(s) before the examination; (c) complete CT data from all phases available; (d) lesion(s) not considered indicative of liver cysts; (e) lesion size ≥ 10 mm; (f) no significant imaging artifacts.

2.2. AI System and Feature Definition for Hepatic Lesion Evaluation

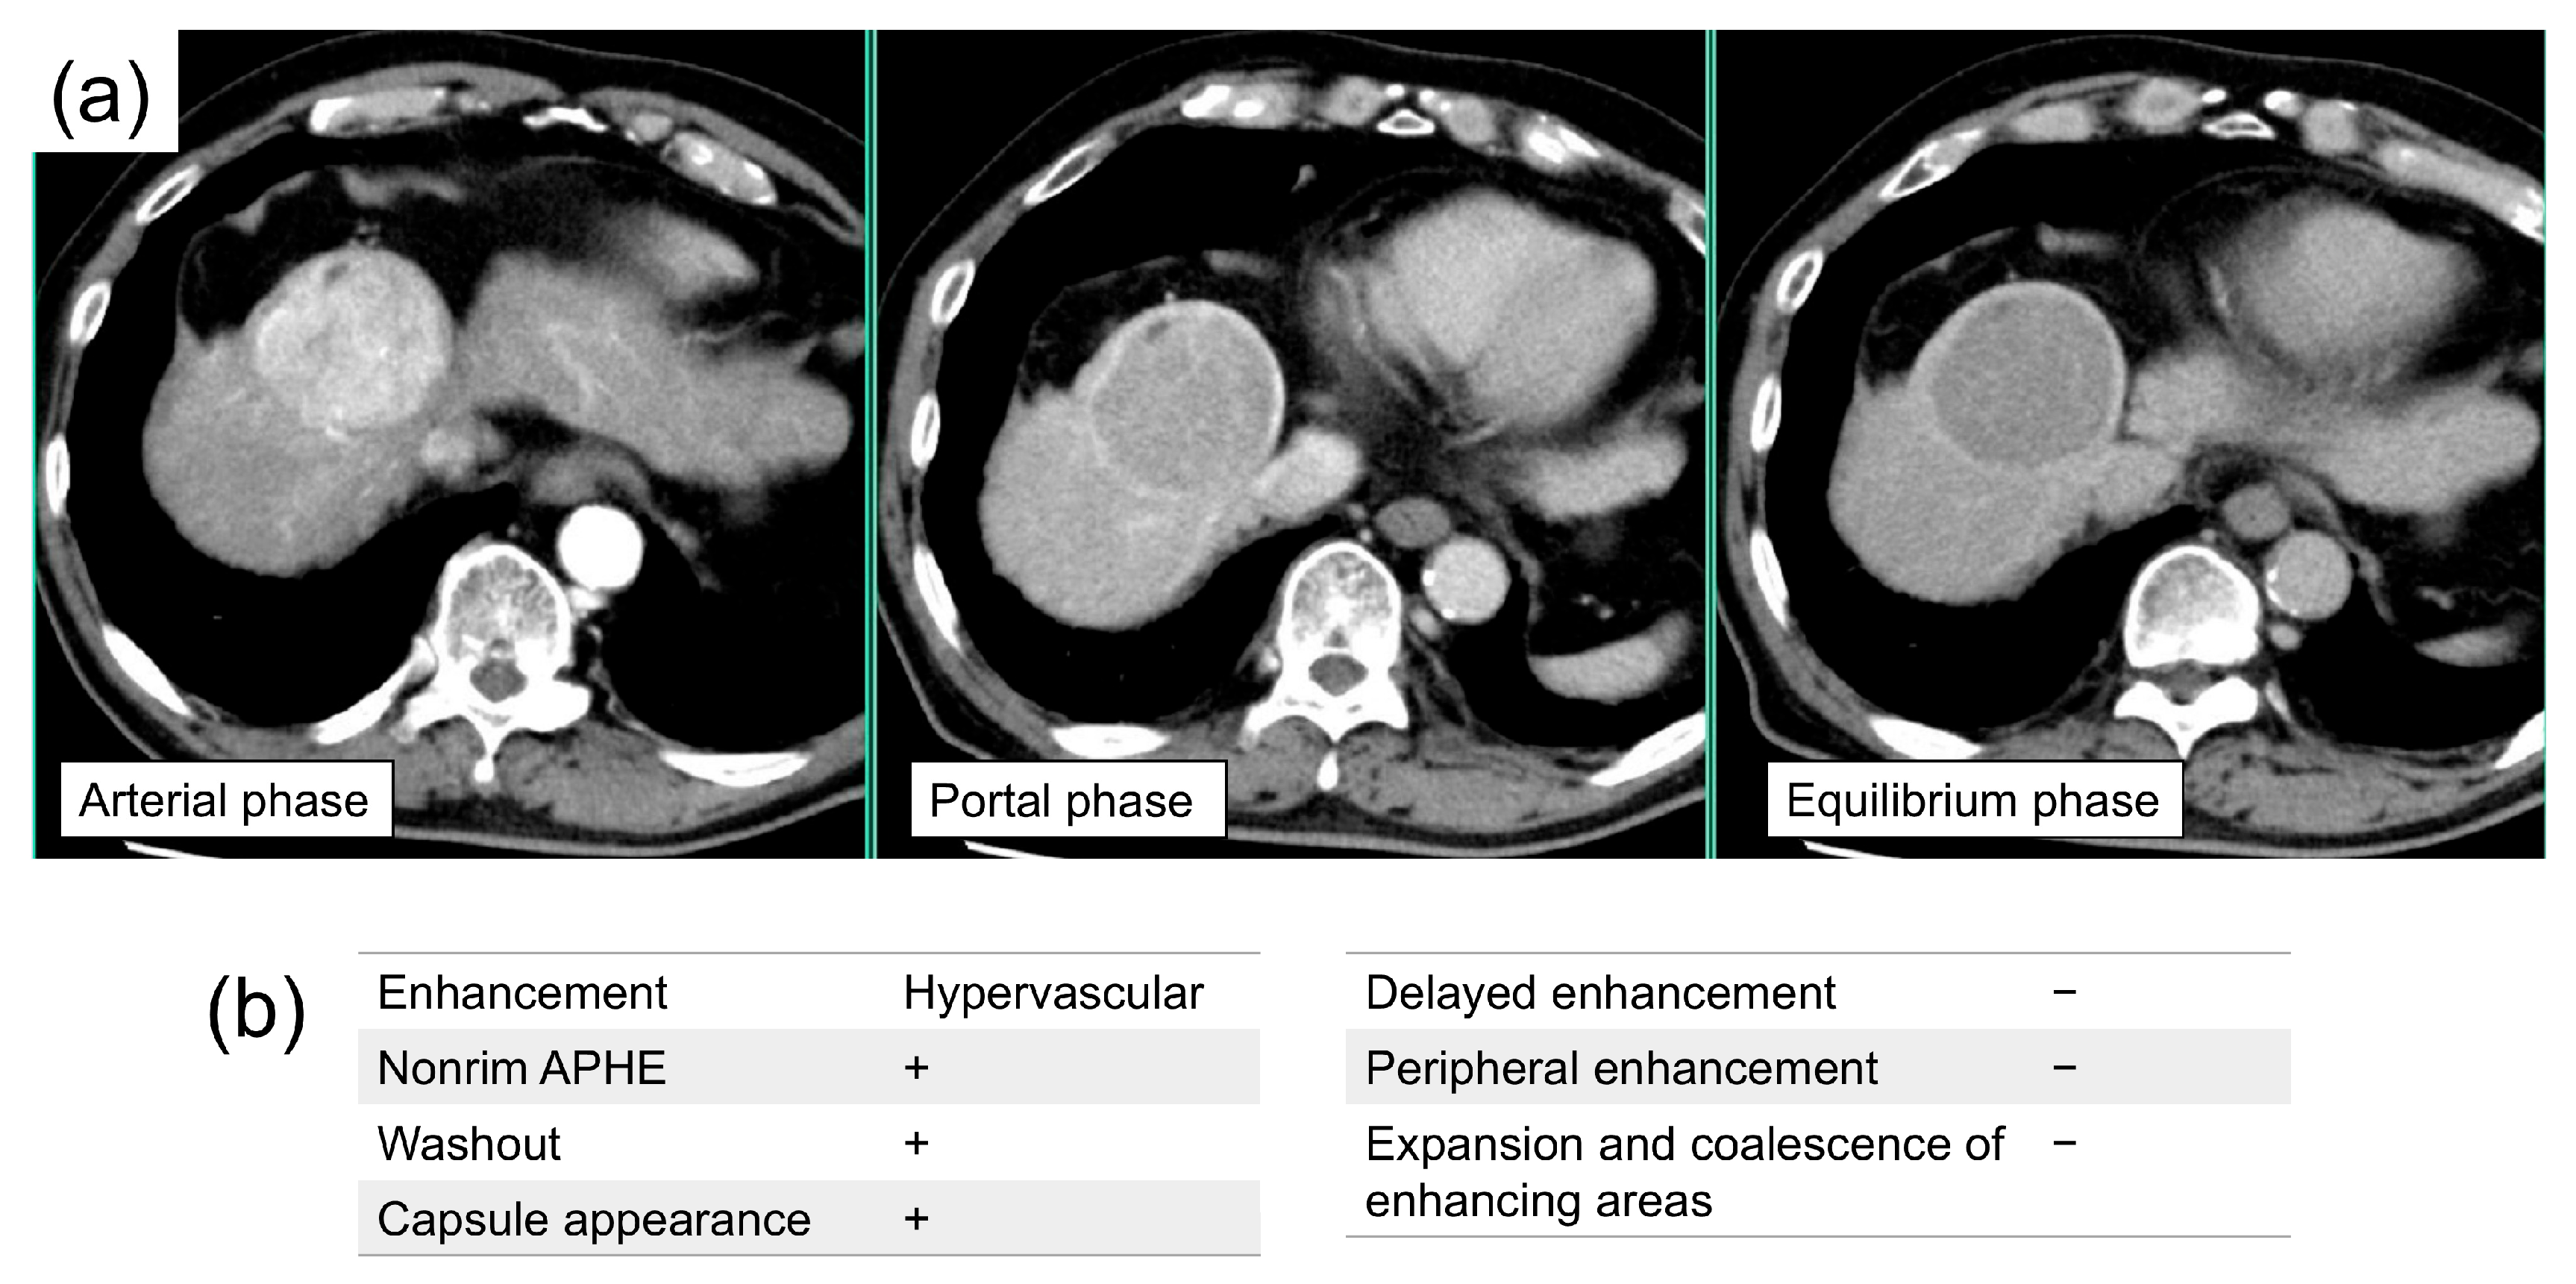
We employed a deep learning-based system for evaluating hepatic lesions attached to a SYNAPSE SAI viewer (FUJIFILM Corporation, Minato-ku, Japan), corresponding to the “Averaging model” in the original paper [24]. This system was trained on a dataset consisting of 3318 tumors with labeled characteristics. The core architecture utilizes Convolutional Neural Networks (CNNs) and is specifically designed to handle a variable number of input images from two- or three-phase Dynamic contrast-enhanced CT. We ensured data independence by confirming that the AI system’s training data were derived from a historical cohort preceding the enrollment period of our study population, with no overlap in patient identity between the two datasets. When any liver lesion was selected in the dynamic contrast-enhanced CT images, the system was activated to analyze three-dimensional data of the lesion across all phases, which produced characteristic analyses (Figure 2). The system was set to output eight characteristics; enhancement (hypervascular or hypovascular), margin (circumscribed or noncircumscribed), enhancing capsule appearance (+ or −), nonrim arterial phase hyperenhancement (APHE) (+ or −), nonperipheral washout (+ or −), expansion and coalescence of enhancing areas (+ or −), delayed enhancement (+ or −), and peripheral enhancement (+ or −), where “+” indicates present and “−” indicates absent. The operational definitions of these features were established based on the LI-RADS 2018 criteria [14]. A detailed, point-by-point summary of these operational definitions is provided in Supplementary Table S1.

2.3. Generation of the Reference Standard

The dynamic contrast-enhanced CT images of the 83 lesions were transferred to a picture archiving and communication system. The slices used for the image assessments were limited to a level that encompassed the entire liver; slices both cranial and caudal to the liver were excluded. Bounding boxes were pre-annotated for the target lesions. The order of the lesions to be evaluated was randomized. The observers were blinded to the patients’ clinical backgrounds. Adjustments to the window level and width were permitted using the SAI viewer. Color monitors with a 3-megapixel resolution and a screen size of 21.2 inches were used for image assessments.
The characteristics and diagnostic reference standard for each lesion were determined by two board-certified abdominal radiologists: one with 20 years of diagnostic experience and one with 15 years of diagnostic experience. These abdominal imaging experts independently conducted their evaluations without AI assistance. Disagreements were resolved by a consensus agreement. The lesions were categorized into four diagnostic groups, following the classification system of Yasaka et al.: Category A contained classic HCCs, Category B contained malignant liver tumors other than classic and early HCCs, Category C contained indeterminate lesions (including early HCCs and dysplastic nodules), and Category D contained benign lesions (including hemangiomas and perfusion alteration) [26]. In this study, 39 lesions were diagnosed pathologically using surgical or biopsy specimens. The diagnostic reference standard for these lesions was determined based on pathological evidence, with lesions lacking histopathological confirmation categorized according to expert imaging readings. Specifically, the histopathology reports provided detailed information essential for categorization, including the specific type of lesion (e.g., cholangiocellular carcinoma, liver metastasis) and, crucially for HCCs, the differentiation grade (e.g., moderately and poorly differentiated). Category A included pathologically confirmed moderately and poorly differentiated HCC. Category B included pathologically confirmed cholangiocellular carcinoma, liver metastasis, and neuroendocrine carcinoma. All other pathologically confirmed entities were defined as the reference standard for Category C. For Category D, the reference standard was defined by a conclusive imaging evaluation by an expert, primarily including benign lesions such as hemangiomas.

2.4. Image Assessments Conducted with and Without the Use of AI

To investigate the impact of using the AI system on image evaluation, radiological evaluations were conducted by 20 radiologists. They were placed into two groups (n = 10 per group) according to their level of experience. Those in the senior group had >5 years of experience, and those in the junior group had ≤5 years of experience. To standardize the reading criteria, the participants were presented with image examples taken from the LI-RADS CT/MRI manual [14] and received training on the definition of each characteristic feature before the reading experiment.
The readers evaluated the eight characteristics on a continuous scale from 0 to 1 based on their confidence level, following the approach described by Wataya et al. [27]. Scores of >0.5 were interpreted as positive, scores of <0.5 were interpreted as negative, and scores of 0.5 were interpreted as indeterminate. After assessing the characteristics of a lesion, the readers placed it within one of the four aforementioned diagnostic categories.
The image review process comprised two sessions: one without AI, followed by one with AI. The design is based on Wataya et al. [27], who evaluated lung-nodule AI, with the assumption that the AI system is used as a second reader computer-assisted diagnosis. All participating radiologists received dedicated training on how to properly interpret the AI results and the output interface prior to the reading sessions. In the first session, the readers evaluated the images without the AI system. In the second session, they reviewed the images again, this time with the AI assistance. The AI output was presented to the readers as a binary assessment (e.g., present/absent) for each image characteristic. To minimize intra-observer (inter-session) variability, the readers could refer to their initial assessment in the second session. To minimize the potential for carry-over effects and recall bias between sessions, the two reading sessions were separated by a washout period of approximately three months.

2.5. Statistical Analysis

The performance of the readers in characterizing and diagnosing the lesions was assessed using receiver operating characteristic (ROC) curve analysis. The primary outcome was to compare the readers’ average area under the ROC curve (AUC) in image assessments with and without the AI assistance. The primary null hypothesis is that “The average Area Under the ROC Curve (AUC) for characterizing and diagnosing hepatic lesions among all radiologists does not significantly differ between assessments without AI assistance and with AI assistance.” Two primary endpoints were defined: one summarizing all characteristics and one summarizing all diagnoses. The Obuchowski–Rockette method was employed to analyze the multireader multicase data. The ROC analysis and AUC calculations were performed using the continuous probability scores (ranging from 0 to 1). The ROC curves were plotted and the AUCs, sensitivities, specificities and 95% confidence intervals (CIs) calculated using the MRMCaov library 0.3.0 (https://github.com/brian-j-smith/MRMCaov (accessed on 1 June 2025)) and R 4.1.2 (https://www.r-project.org (accessed on 1 June 2025)). Statistical significance was indicated by p values < 0.05 [28]. Multiplicity correction was applied to these two primary endpoints using the Bonferroni method, setting the significance level at α = 0.05/2 = 0.025. All individual item analyses other than these primary endpoints are treated as exploratory analyses. In addition, the calculation of specific binary classification metrics, including accuracy, sensitivity, specificity, and F1 score, was performed for each imaging feature. The classification threshold for determining these characteristics was uniformly set at 0.5. This threshold was solely applied for the calculation of these binary classification metrics and for descriptive purposes.
Inter-observer agreement for each characteristic was analyzed using the kappa statistic and intraclass correlation coefficient (ICC). The kappa statistic was employed to assess the agreement among reference standard annotators because of the discrete nature of their output values (0 or 1). The ICC was used to calculate the agreement among the readers in the senior group and the junior group because their outputs ranged from 0 to 1. The inter-rater agreements and their 95% CIs and p values were computed by the bootstrap method using Python 3.8.5 (https://www.python.org (accessed on 1 April 2025)) and Pingouin 0.5.2 (https://pingouin-stats.org (accessed on 1 April 2025)) [29,30]. In this study, values of 0.00–0.20 indicated slight agreement, values of 0.21–0.40 indicated fair agreement, values of 0.41–0.60 indicated moderate agreement, values of 0.61–0.80 indicated substantial agreement, and values of 0.81–1.00 indicated almost perfect agreement, following the guidelines of Landis and Koch [31].
To retrospectively confirm the statistical robustness of our design, a post hoc power analysis was performed. The anticipated effect size was set ⊿AUC = 0.05 based on clinical relevance and typical effect sizes observed in a similar study [27]. Calculations were based on the Obuchowski–Rockette method to estimate the standard errors of the difference in AUC. The Hillis power formula was subsequently used to calculate the statistical power (α = 0.05, two-sided).

3. Results

3.1. Clinical Characteristics, Reference Standard Distribution, and AI System Performance

As shown in Table 1, among the 69 patients included in this study, 47 were male, and the mean age was 63 years ± 16 (SD). Underlying liver conditions in the cohort included hepatic steatosis (n = 13, 18.8%), cirrhosis (n = 8, 11.6%), Hepatitis B Virus infection (n = 7, 10.1%), and Hepatitis C Virus infection (n = 3, 4.3%). The characteristics of the 83 hepatic nodules/masses examined in this study are presented in Table 1. The average lesion size was 39.9 mm ± 28.1. The pathological diagnoses of the lesions were predominantly classified as HCC and cholangiocellular carcinoma (CCC). There were also cases of liver metastases, neuroendocrine carcinoma, focal nodular hyperplasia, hepatocellular adenoma, and epithelioid hemangioendothelioma. Three lesions presented no histopathological evidence of malignancy.
Table 2 shows the reference standard for the characteristics and diagnoses of the lesions. Features strongly associated with HCC, such as enhancing capsule appearance, nonrim APHE, and nonperipheral washout, were observed in 18, 38, and 23 lesions, respectively. Expansion and coalescence of enhancing areas, delayed enhancement, and peripheral enhancement, which are related to hemangioma, liver metastases, and CCC, were identified in 24, 29, and 39 lesions, respectively. In terms of the distribution of the diagnoses, 25 lesions were classified as Category A, 26 as Category B, 15 as Category C, and 17 as Category D.

3.2. Performance of Radiologists in Characterizing and Diagnosing Hepatic Lesions with and Without AI

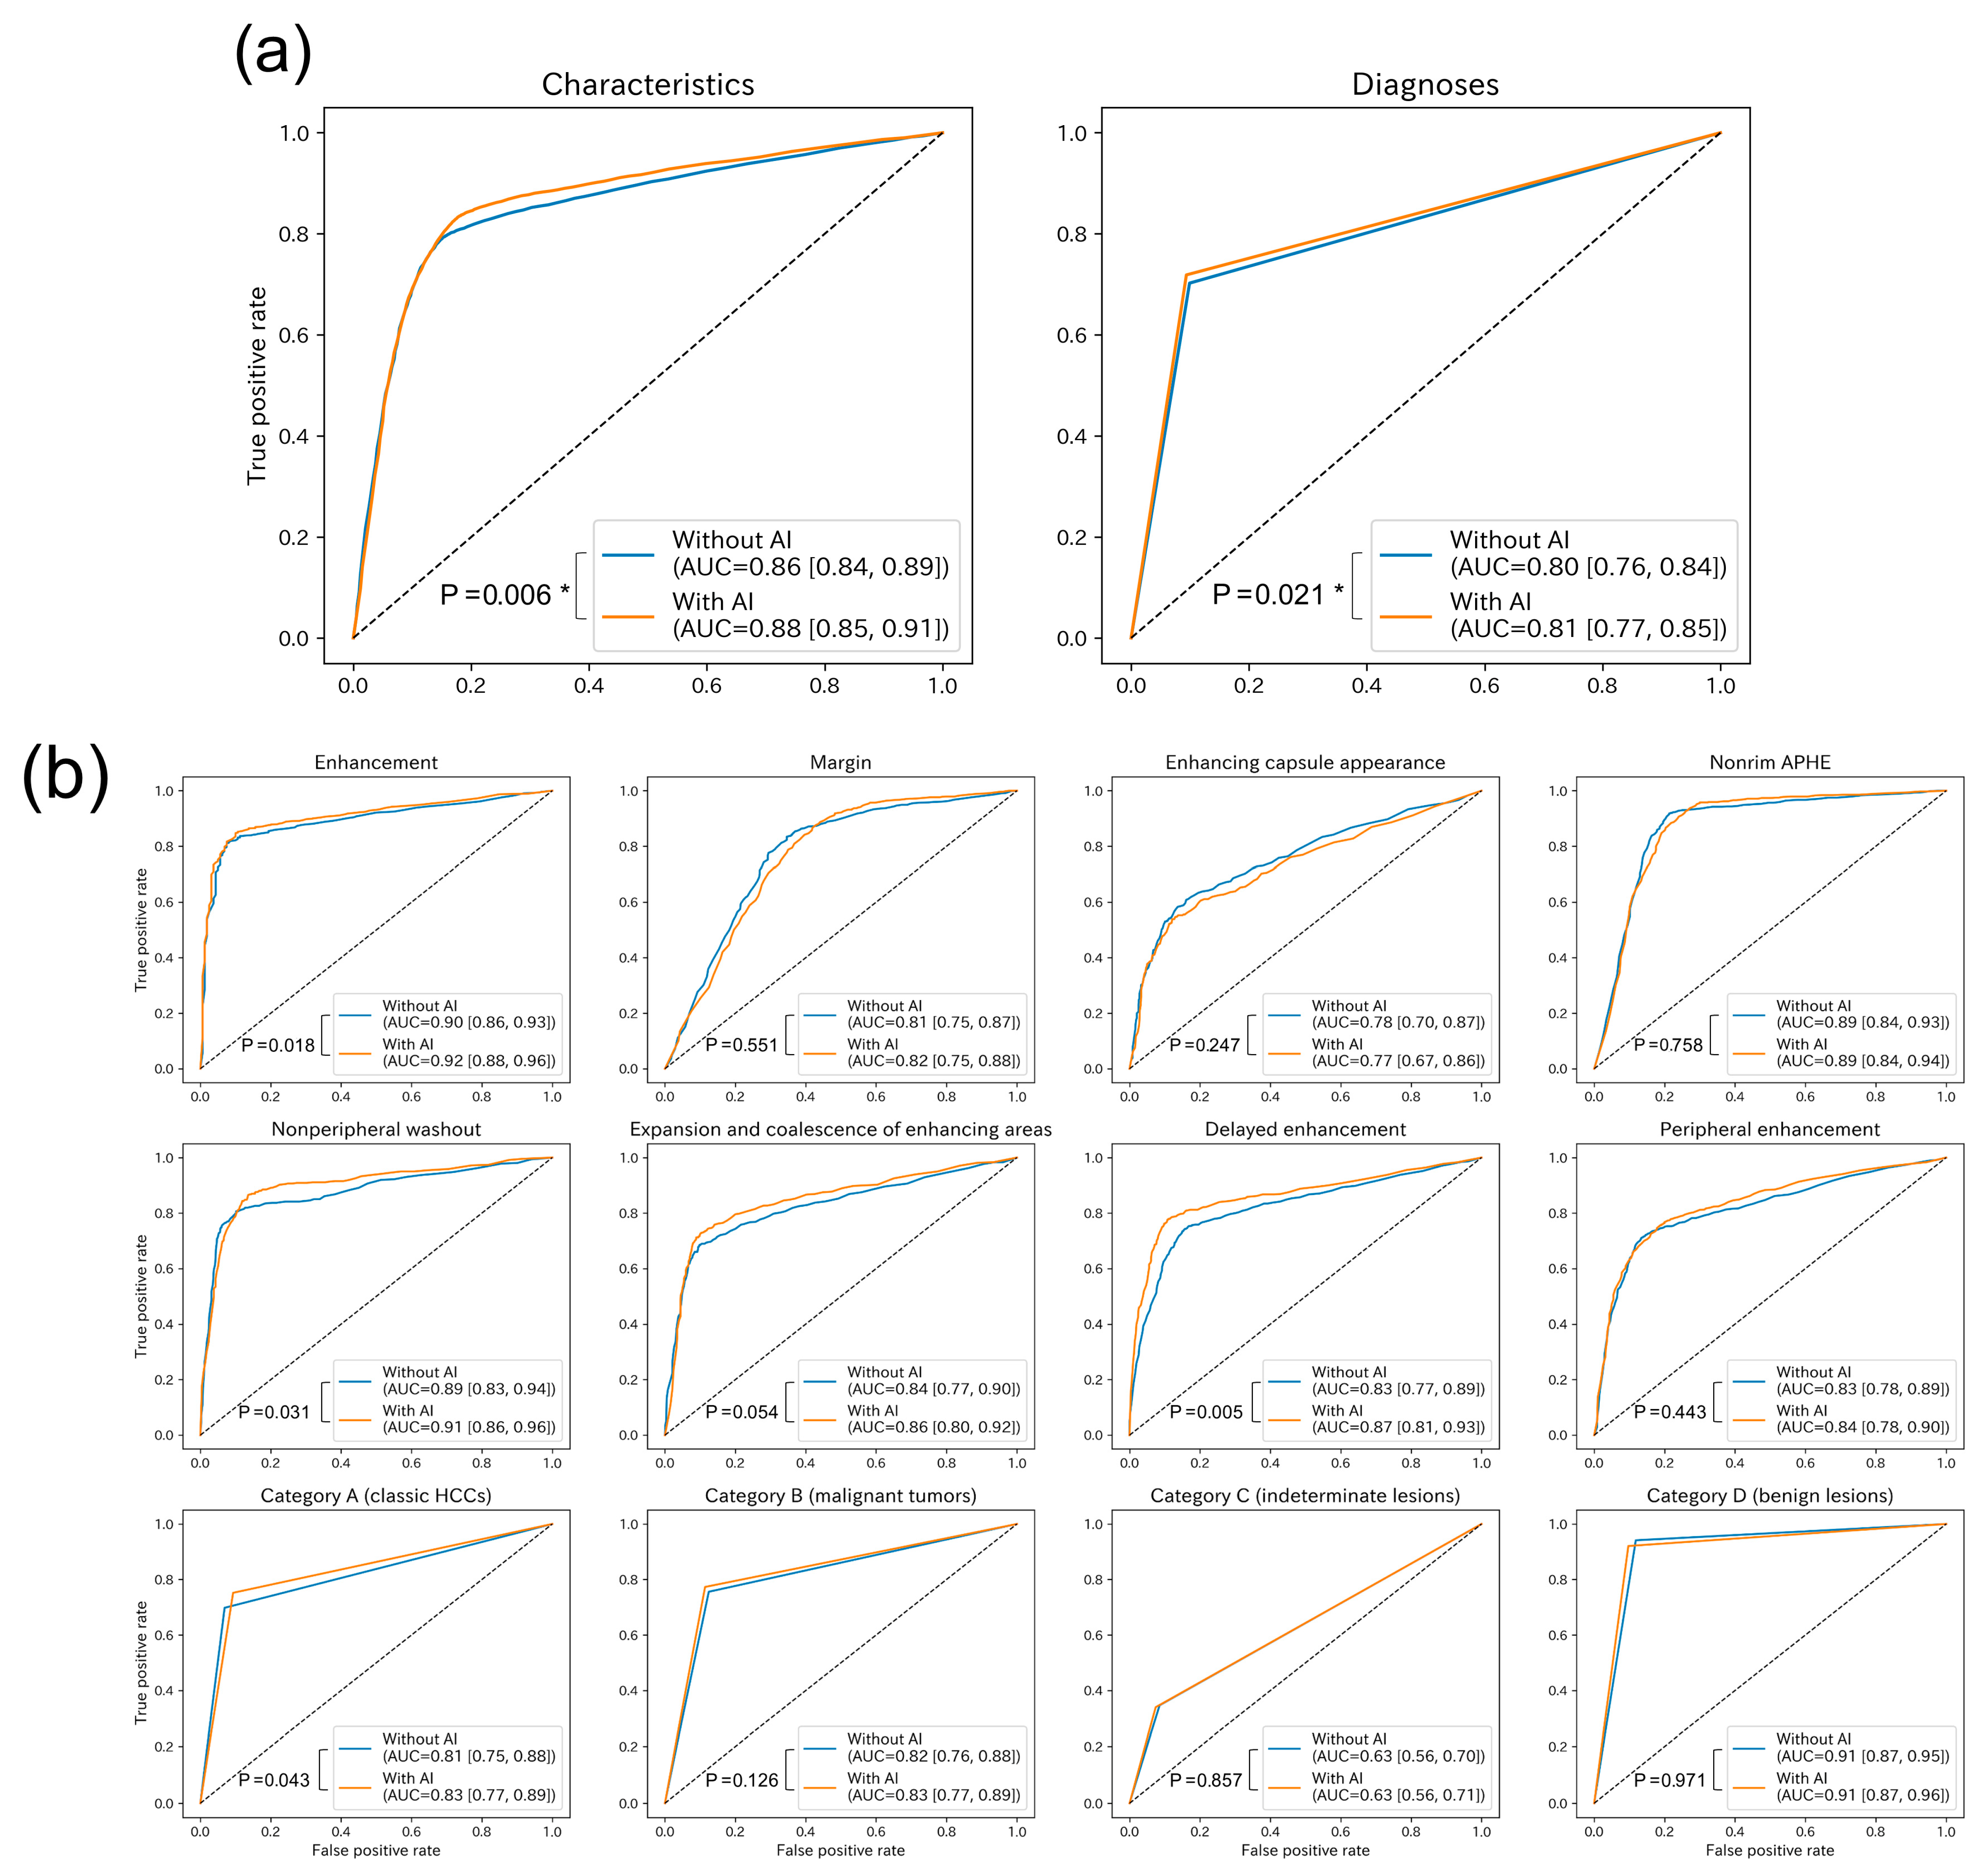
Figure 3 shows the ROC curves and AUCs that were obtained when the readers evaluated the characteristics of the 83 nodules/masses and attributed diagnoses. The analysis of the two primary endpoints showed that, when the readers used the AI system, statistically significant improvements were observed in the overall AUCs for both the characterization (0.86 [95% CI 0.84, 0.89] without AI vs. 0.88 [0.85, 0.91] with AI; p = 0.006) and the diagnosis (0.80 [0.76, 0.84] without AI vs. 0.81 [0.77, 0.85] with AI; p = 0.021) of liver lesions. Numerical improvements were suggested in the evaluation of specific features; enhancement (0.90 [0.86, 0.93] without AI vs. 0.92 [0.88, 0.96] with AI; p = 0.018), nonperipheral washout (0.89 [0.83, 0.94] without AI vs. 0.91 [0.86, 0.96] with AI; p = 0.031), and delayed enhancement (0.83 [0.77, 0.89] without AI vs. 0.87 [0.81, 0.93] with AI; p = 0.005). In addition, the use of the AI system was associated with a trend toward improved diagnostic performance of the readers in terms of their capacity to classify Category A (classic HCCs) lesions (AUC 0.81 [0.75, 0.88] without AI vs. 0.83 [0.77, 0.89] with AI; p = 0.043). This improvement potentially translated to enhanced sensitivity (when specificity was fixed at 0.75: 0.76 [0.67, 0.85] without AI vs. 0.80 [0.71, 0.89] with AI). In addition to the ROC analysis, performance for evaluation of each imaging feature was assessed using binary classification metrics. Consistent with the visual differences observed in the ROC curves for delayed enhancement (Figure 3), the use of AI assistance resulted in a notable increase in both accuracy (0.80 without AI vs. 0.85 with AI) and specificity (0.70 without AI vs. 0.79 with AI) for evaluating this feature. Detailed results for all imaging characteristics are presented in Supplementary Table S2.
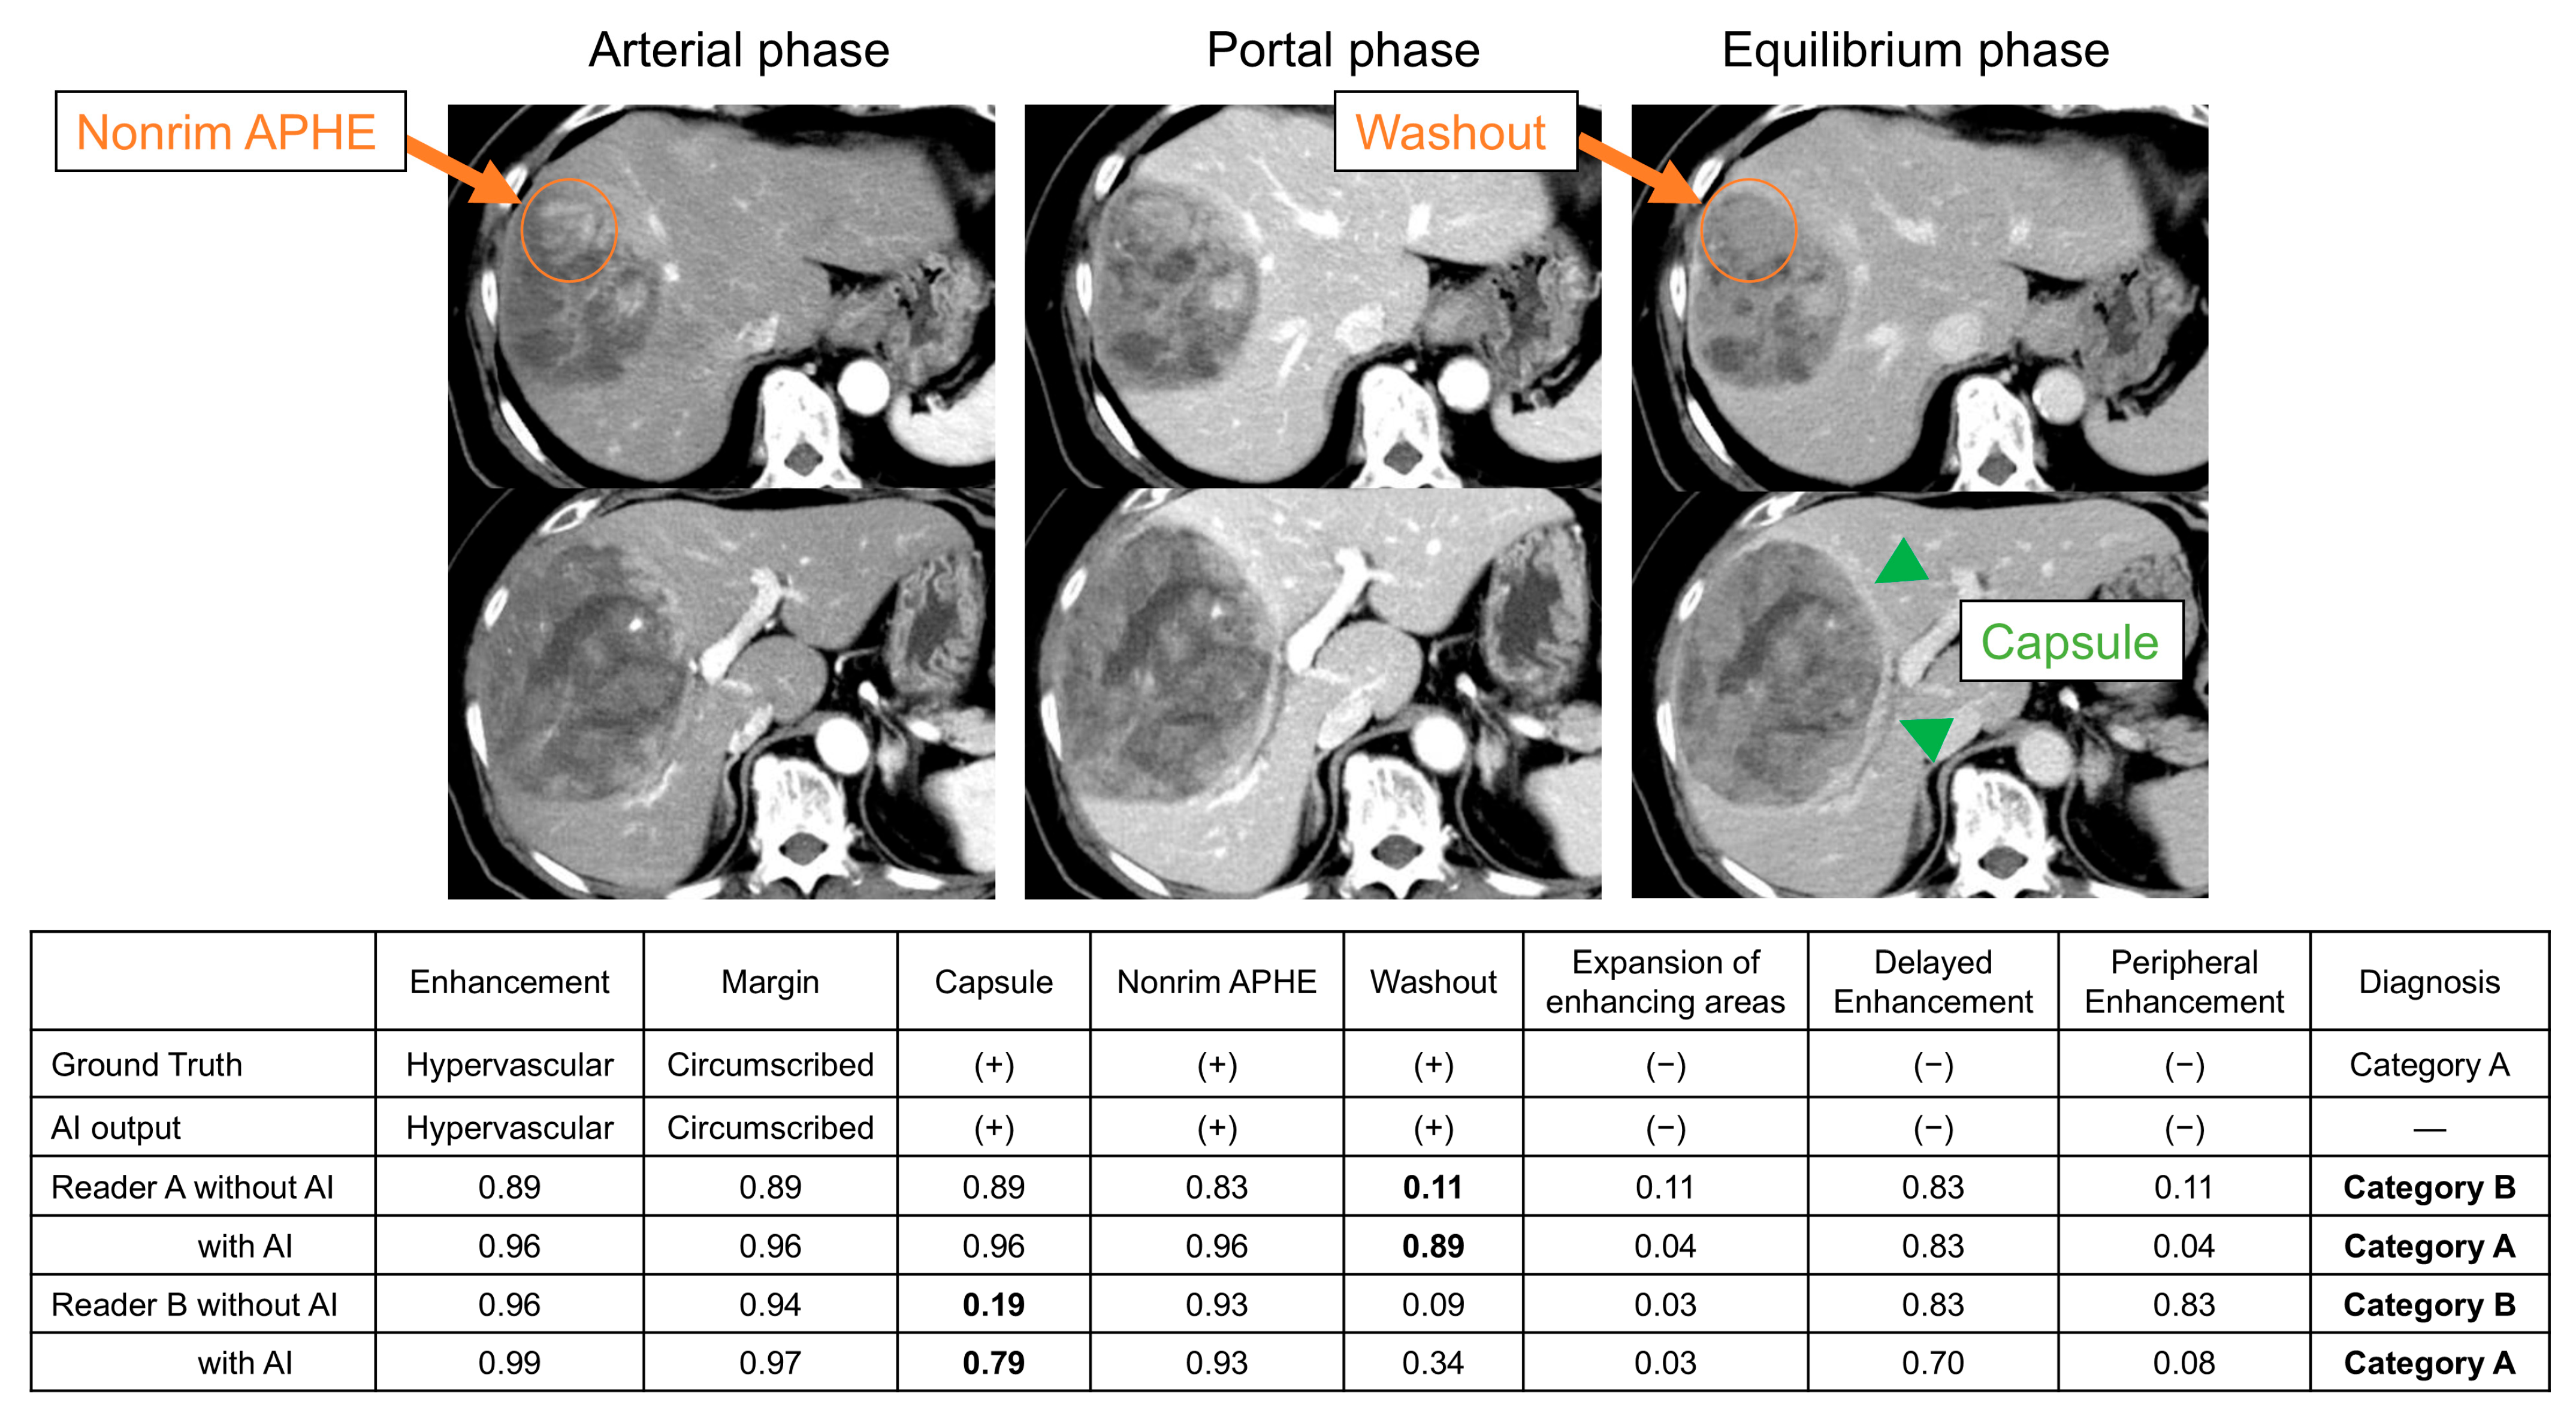
Figure 4 shows an example of a case in which the diagnostic performance of two readers was improved using the AI system. The reference standard for the diagnosis of this lesion was defined as Category A based on histopathological evidence from surgical specimens. The AI system correctly described all the lesion’s imaging features the same as the reference standard. In the first reading session (without the AI), reader A (who had 5 years of experience) determined that there was an absence of nonperipheral washout (probability = 0.11) and classified the lesion as Category B. In the second reading session (with the AI), reader A changed their interpretation, determining that washout was present (probability = 0.89) and thus revised the diagnosis to Category A. Similarly, reader B (who had 5 years of experience) initially determined that there was an absence of enhancing capsule appearance (probability = 0.19) and diagnosed the lesion as Category B. In the following reading session (with the AI), reader B stated that enhancing capsule appearance was present (probability = 0.79) and revised the diagnosis to Category A accordingly.

3.3. Comparison of Radiologists with Different Levels of Experience

Table 3 shows the AUCs for the junior and senior groups of radiologists for their performances in characterizing the 83 nodules/masses. In the junior group, a numerical trend toward improvement in the AUC was suggested for the evaluation of delayed enhancement (0.82 [0.75, 0.89] without AI vs. 0.86 [0.79, 0.93] with AI; p = 0.043). In the senior group, numerical trends toward improvement in the AUCs were suggested for the evaluation of enhancement (0.91 [0.86, 0.96] without AI vs. 0.93 [0.90, 0.97] with AI; p = 0.043), expansion and coalescence of enhancing areas (0.82 [0.75, 0.89] without AI vs. 0.86 [0.79, 0.93] with AI; p = 0.014), and delayed enhancement (0.84 [0.77, 0.92] without AI vs. 0.88 [0.81, 0.95] with AI; p = 0.019).

3.4. Inter-Observer Agreement for the Characterization of Hepatic Lesions with and Without AI

Table 4 shows the kappa statistics of the board-certified abdominal radiologists (reference standard annotators) and the ICCs of the senior and junior radiologists for the characterization of the 83 nodules/masses. The inter-observer agreement among the reference standard annotators was moderate for enhancement (0.47 [0.27, 0.65]), margin (0.51 [0.37, 0.65]), nonperipheral washout (0.55 [0.41, 0.69]), and delayed enhancement (0.60 [0.48, 0.73]). Almost perfect agreement was indicated for nonrim APHE (0.81 [0.71, 0.91]). There was potential improvement in all the ICCs for all the lesion features when the AI system was utilized, except for margin in the junior group. In the senior group, the ICC potentially improved from fair to moderate agreement for margin (0.39 [0.31, 0.47] without AI vs. 0.45 [0.35, 0.53] with AI) and enhancing capsule appearance (0.54 [0.43, 0.63] without AI vs. 0.58 [0.48, 0.66] with AI), and from moderate to substantial agreement for delayed enhancement (0.53 [0.46, 0.60] without AI vs. 0.64 [0.56, 0.70] with AI) and peripheral enhancement (0.58 [0.51, 0.64] without AI vs. 0.63 [0.56, 0.69] with AI). In the junior group, the ICCs potentially improved from fair to moderate agreement for enhancing capsule appearance (0.39 [0.29, 0.47] without AI vs. 0.47 [0.37, 0.54] with AI), and from moderate to substantial agreement in nonrim APHE (0.58 [0.52, 0.64] without AI vs. 0.61 [0.54, 0.67] with AI) and delayed enhancement (0.48 [0.41, 0.54] without AI vs. 0.62 [0.42, 0.55] with AI).

3.5. Post Hoc Power Analysis Results

The post hoc power analysis estimated the standard errors for the difference in AUC to be 0.00478 for image characteristics and 0.00447 for imaging diagnosis. Using the target effect size ⊿AUC = 0.05, the calculated statistical power for both qualitative features and imaging diagnosis was nearly 1.00. This finding retrospectively validates that our study design (83 cases and 20 readers) provided exceptionally robust statistical power to detect a clinically meaningful difference in AUC of 0.05.

4. Discussion

In this study, we evaluated the effect of using an AI system on the performance of radiologists in characterizing and diagnosing hepatic lesions. The use of the AI system improved the AUCs for the characterization as well as for the diagnosis. The use of the AI system potentially improved the AUCs for the characterization of enhancement, nonperipheral washout, and delayed enhancement, as well as for the diagnosis of HCC. Because the multiplicity adjustment was applied only to the two comprehensive primary endpoints, results concerning individual features and diagnosis should be interpreted as exploratory findings. In addition, it was also suggested that the use of the AI system improved the AUCs for the assessment of imaging features in groups of both senior and junior radiologists, as well as the associated ICCs.
The characteristics that were better detected when the radiologists utilized the AI system (i.e., enhancement, nonperipheral washout, and delayed enhancement) are related to the contrast enhancement of hepatic lesions. These features are evaluated relative to the enhancement of the background liver parenchyma, and assessing these features may require radiologists to make subjective judgments. For example, in cirrhotic livers, the contrast enhancement of the background can be heterogeneous, and the baseline CT number changes depending on where the region of interest is placed. In fact, these features tended to have relatively low inter-observer agreement scores, even among the experienced experts who determined the reference standard (Table 4). The assessment of these characteristics was likely affected by the output of the AI system.
Detailed analysis of imaging characteristics leads to accurate imaging diagnosis and provides evidence for clinical decision-making about invasive examinations and treatments and other critical issues. In fact, LI-RADS-based characterization of hepatic lesions during dynamic contrast-enhanced examinations has been reported to result in the correct diagnosis of classic HCC [14,17,32,33,34]. Our results showed that using an AI system led to an improvement in the characterization of hepatic lesions and the potential for a subsequent increase in the performance of diagnosing classic HCC. As shown in Figure 4, the AI output of “nonperipheral washout (+)” and “enhancing capsule appearance (+)” indicated that a lesion was HCC-like, and this provided the radiologists with increased confidence in their imaging diagnosis of classic HCC.
The strict categorization adopted in our analysis, distinguishing classic HCCs (Category A) from early HCCs (included in Category C), is supported by clinical considerations. These two entities often differ significantly in imaging features, biological behavior, malignancy grade, and, crucially, clinical decision-making, particularly concerning therapeutic strategies. Classic HCCs typically demonstrate hallmark features (nonrim APHE and nonperipheral washout) that fulfill international criteria (e.g., LI-RADS) for non-invasive definitive diagnosis. Given their tendency toward higher malignancy and faster progression, their confirmation often necessitates prompt therapeutic intervention. Conversely, early HCCs are often challenging to distinguish radiologically from indeterminate lesions, such as dysplastic nodules, frequently requiring biopsy for definitive diagnosis. This ambiguity dictates a more cautious approach to management, including surveillance or delayed therapeutic planning. The observed improvement in diagnostic performance for classic HCC with AI integration, as suggested by our results, is therefore clinically significant. By enhancing the certainty of classic HCC diagnosis, imaging evaluation with AI assistance is anticipated to contribute to more rapid clinical decision-making and potentially improve patient outcomes.
Several studies have been conducted to investigate the influence of AI on the performance of radiologists based on their level of experience. It has been reported that using AI systems improves the ability of less experienced radiologists to characterize and diagnose pulmonary nodules but not that of more experienced radiologists to a significant extent [26,35,36]. In contrast, it has been reported that utilizing AI systems improves the ability of radiologists to assess hepatic lesions regardless of their years of experience. Ying et al. demonstrated that for both senior and junior radiologists, using an AI system increased the accuracy of classifying focal liver lesions as benign or malignant using contrast-enhanced CT scans [37]. Given that it can be difficult to evaluate slight differences in enhancement between a hepatic lesion and background hepatic parenchyma, the use of AI will help many radiologists with a wide range of experience levels in terms of assessing contrast enhancement patterns, which is important in the diagnosis of hepatic lesions (as opposed to assessing morphological characteristics in the diagnosis of pulmonary nodules).
AI-assisted image evaluation results in not only improved performance by radiologists but also greater inter-reader agreement [27]. The interpretation of image characteristics of hepatic lesions is often subject to inter-observer variability, and diagnostic difficulties abound in hepatology [38]. To reduce such difficulties, initiatives have been devised, such as the development of imaging guidelines (e.g., the LI-RADS); however, further improvement of the level of inter-reader agreement is required to ensure accurate diagnoses and appropriate clinical decisions are made, and to improve patient prognosis [39]. In this study, it was suggested that using an AI system can boost the inter-reader agreement associated with image interpretation. We propose that the AI system can impact on the workflow in two keyways: First, in terms of efficiency: By improving the performance of junior radiologists in subjective feature assessment, the system helps minimize the experience gap. Second, regarding quality: By improving the performance of radiologists for evaluation of the overall characterization and diagnosis, the system enables radiologists to provide more consistent, standardized, reliable, and beneficial imaging information for clinical practice. These workflow improvements are crucial for facilitating the standardized assessment of malignancy risk and management urgency for liver lesions among diagnostic radiologists regardless of levels of experience, and across different clinical departments and institutions. This standardization is expected to contribute to correct clinical decision-making and improve patient management consistency.
There were some limitations in our study. First, we used data from a single institution. Hence, there is a risk that the disease epidemiology noted in this study may be specific to the hospital where the study was conducted. Therefore, in the future, we plan to utilize multi-center data. Second, not all the lesions included in our reference standard data had associated with histopathological evidence. In this study, the reference standard for the lesions without a pathological diagnosis was determined based on imaging diagnosis to avoid the exclusion of many benign lesions and to ensure the disease epidemiology in the study reflected that in daily clinical practice as closely as possible. Future research should include larger study populations so that included cases can be evaluated solely based on pathological evidence. Third, our analysis has potential selection bias related to lesion size, as we restricted our inclusion to the two largest lesions per patient. This should be considered when generalizing our findings, particularly regarding smaller hepatic lesions. Finally, the use of different CT scanners and varying iterative reconstruction algorithms (ASiR, ASiR-V, and AIDR 3D) is a technical limitation that may have introduced subtle visual variability in image quality, potentially affecting the subjective assessment of subtle imaging features.

5. Conclusions

Our findings demonstrate the benefits associated with AI-assisted image evaluation for the characterization and diagnosis of hepatic lesions. We have shown that utilizing an AI system is helpful for radiologists, regardless of their level of experience, as it increases their ability to assess imaging features uniformly and accurately. Using an AI system is expected to contribute to improved clinical decision-making, which may ultimately improve patient outcomes.

Supplementary Materials

The following supporting information can be downloaded at: https://www.mdpi.com/article/10.3390/applbiosci4040056/s1, Table S1: The operational definitions of imaging characteristics.; Table S2: The accuracies, sensitivities, specificities and F1 scores obtained when the readers evaluated the characteristics of the 83 lesions with and without AI assistance. The classification threshold for determining characteristics was uniformly set at 0.5.

Author Contributions

Conceptualization, D.N. and S.K.; methodology, D.N., A.N., T.T., Y.S. and S.K.; software, D.N. and Y.S.; validation, D.N., A.N., T.T. and H.O.; formal analysis, D.N.; investigation, D.N. and T.W.; resources, D.N.; data curation, D.N.; writing—original draft preparation, D.N.; writing—review and editing, Y.S., K.K., J.S., M.T., M.Y., M.H. and N.T.; visualization, D.N.; supervision, S.K. and N.T.; project administration, S.K.; funding acquisition, S.K. All authors have read and agreed to the published version of the manuscript.

Funding

This study has received funding by JSPS KAKENHI Grant Number 21H03840.

Institutional Review Board Statement

The study was conducted in accordance with the Declaration of Helsinki and approved by the Institutional Review Board of University of Osaka (protocol code No. 19061-2 and date of approval 19 March 2024).

Informed Consent Statement

Patient consent was waived due to the retrospective nature of the study.

Data Availability Statement

The data presented in this study are available on request from the corresponding author due to privacy and ethical reasons (e.g., patient data confidentiality).

Acknowledgments

The authors are grateful to University of Osaka Reading Team which is composed of the following radiologists. (Listed in alphabetical order) Akinori Hata, Atsuko Arisawa, Azusa Miura, Chisato Matsuo, Hideyuki Fukui, Keigo Yano, Keisuke Ninomiya, Kengo Kiso, Kosuke Nagai, Kosuke Tomotake, Masahiro Fujiwara, Takahisa Sakisuka, Takashi Ota, Takumi Tanigaki, Tomohiro Wataya, Tomo Miyata, Toru Honda, Shohei Matsumoto, Yumiko Miyauchi and Yuriko Yoshida.

Conflicts of Interest

The authors declare no conflicts of interest.

Abbreviations

The following abbreviations are used in this manuscript:
AIArtificial intelligence
AIDR 3DAdaptive iterative dose reduction using 3-dimensional processing
APHEArterial phase hyperenhancement
ASiRAdaptive statistical iterative reconstruction
ASiR-VAdaptive statistical iterative reconstruction-V
AUCArea under the receiver operating characteristic curve
CCCCholangiocellular carcinoma
CIConfidential interval
HCCHepatocellular carcinoma
ICCIntraclass correlation coefficient
ROCReceiver operating characteristic

References

  1. Bray, F.; Laversanne, M.; Sung, H.; Ferlay, J.; Siegel, R.L.; Soerjomataram, I.; Jemal, A. Global cancer statistics 2022: GLOBOCAN estimates of incidence and mortality worldwide for 36 cancers in 185 countries. CA Cancer J. Clin. 2024, 74, 229–263. [Google Scholar] [CrossRef]
  2. Elderkin, J.; Al Hallak, N.; Azmi, A.S.; Aoun, H.; Critchfield, J.; Tobon, M.; Beal, E.W. Hepatocellular Carcinoma: Surveillance, Diagnosis, Evaluation and Management. Cancers 2023, 15, 5118. [Google Scholar] [CrossRef]
  3. Brar, G.; Greten, T.F.; Graubard, B.I.; McNeel, T.S.; Petrick, J.L.; McGlynn, K.A.; Altekruse, S.F. Hepatocellular Carcinoma Survival by Etiology: A SEER-Medicare Database Analysis. Hepatol. Commun. 2020, 4, 1541. [Google Scholar] [CrossRef]
  4. Chidambaranathan-Reghupaty, S.; Fisher, P.B.; Sarkar, D. Hepatocellular carcinoma (HCC): Epidemiology, etiology and molecular classification. Adv. Cancer Res. 2021, 149, 1. [Google Scholar] [CrossRef] [PubMed]
  5. McGlynn, K.A.; Petrick, J.L.; El-Serag, H.B. Epidemiology of Hepatocellular Carcinoma. Hepatology 2021, 73, 4. [Google Scholar] [CrossRef] [PubMed]
  6. Kuwano, A.; Yada, M.; Miyazaki, Y.; Tanaka, K.; Koga, Y.; Ohishi, Y.; Masumoto, A.; Motomura, K. An Imaging Feature Predicts Efficacy of Atezolizumab Plus Bevacizumab in Unresectable Hepatocellular Carcinoma. Cancer Diagn. Progn. 2023, 3, 468. [Google Scholar] [CrossRef]
  7. An, C.; Kim, D.W.; Park, Y.N.; Chung, Y.E.; Rhee, H.; Kim, M.J. Single Hepatocellular Carcinoma: Preoperative MR Imaging to Predict Early Recurrence after Curative Resection. Radiology 2015, 276, 433–443. [Google Scholar] [CrossRef] [PubMed]
  8. Kang, T.W.; Rhim, H.; Lee, J.; Song, K.D.; Lee, M.W.; Kim, Y.S.; Lim, H.K.; Jang, K.M.; Kim, S.H.; Gwak, G.Y.; et al. Magnetic resonance imaging with gadoxetic acid for local tumour progression after radiofrequency ablation in patients with hepatocellular carcinoma. Eur. Radiol. 2016, 26, 3437–3446. [Google Scholar] [CrossRef]
  9. Granata, V.; Fusco, R.; Amato, D.M.; Albino, V.; Patrone, R.; Izzo, F.; Petrillo, A. Beyond the vascular profile: Conventional DWI, IVIM and kurtosis in the assessment of hepatocellular carcinoma. Eur. Rev. Med. Pharmacol. Sci. 2020, 24, 7284–7293. [Google Scholar] [CrossRef]
  10. Nino-Murcia, M.; Olcott, E.W.; Jeffrey, R.B.; Lamm, R.L.; Beaulieu, C.F.; Jain, K.A. Focal liver lesions: Pattern-based classification scheme for enhancement at arterial phase CT. Radiology 2000, 215, 746–751. [Google Scholar] [CrossRef]
  11. Itai, Y.; Ohtomo, K.; Kokubo, T.; Yamauchi, T.; Minami, M.; Yashiro, N.; Araki, T. CT of hepatic masses: Significance of prolonged and delayed enhancement. AJR Am. J. Roentgenol. 1986, 146, 729–733. [Google Scholar] [CrossRef]
  12. Van Leeuwen, M.S.; Noordzij, J.; Feldberg, M.A.M.; Hennipman, A.H.; Doornewaard, H. Focal liver lesions: Characterization with triphasic spiral CT. Radiology 1996, 201, 327–330. [Google Scholar] [CrossRef]
  13. Van Hoe, L.; Baert, A.L.; Gryspeerdt, S.; Vandenbosh, G.; Nevens, F.; Van Steenbergen, W.; Marchal, G. Dual-phase helical CT of the liver: Value of an early-phase acquisition in the differential diagnosis of noncystic focal lesions. AJR Am. J. Roentgenol. 1997, 168, 1185–1192. [Google Scholar] [CrossRef]
  14. American College of Radiology. Liver Reporting & Data System. (n.d.). Available online: https://www.acr.org/Clinical-Resources/Clinical-Tools-and-Reference/Reporting-and-Data-Systems/LI-RADS (accessed on 2 March 2024).
  15. Granata, V.; Fusco, R.; Avallone, A.; Catalano, O.; Filice, F.; Leongito, M.; Palaia, R.; Izzo, F.; Petrillo, A. Major and ancillary magnetic resonance features of LI-RADS to assess HCC: An overview and update. Infect. Agent Cancer 2017, 12, 23. [Google Scholar] [CrossRef] [PubMed]
  16. Elsayes, K.M.; Fowler, K.J.; Chernyak, V.; Elmohr, M.M.; Kielar, A.Z.; Hecht, E.; Bashir, M.R.; Furlan, A.; Sirlin, C.B. User and system pitfalls in liver imaging with LI-RADS. J. Magn. Reson. Imaging 2019, 50, 1673–1686. [Google Scholar] [CrossRef] [PubMed]
  17. Park, J.H.; Chung, Y.E.; Seo, N.; Choi, J.Y.; Park, M.S.; Kim, M.J. Gadoxetic acid-enhanced MRI of hepatocellular carcinoma: Diagnostic performance of category-adjusted LR-5 using modified criteria. PLoS ONE 2020, 15, e0242344. [Google Scholar] [CrossRef] [PubMed]
  18. An, C.; Park, S.; Chung, Y.E.; Kim, D.Y.; Kim, S.S.; Kim, M.J.; Choi, J.Y. Curative resection of single primary hepatic malignancy: Liver imaging reporting and data system category lr-m portends a worse prognosis. Am. J. Roentgenol. 2017, 209, 576–583. [Google Scholar] [CrossRef]
  19. Midya, A.; Chakraborty, J.; Srouji, R.; Narayan, R.R.; Boerner, T.; Zheng, J.; Pak, L.M.; Creasy, J.M.; Escobar, L.A.; Harrington, K.A.; et al. Computerized Diagnosis of Liver Tumors from CT Scans Using a Deep Neural Network Approach. IEEE J. Biomed Health Inf. 2023, 27, 2456–2464. [Google Scholar] [CrossRef]
  20. Nayak, A.; Kayal, E.B.; Arya, M.; Culli, J.; Krishan, S.; Agarwal, S.; Mehndiratta, A. Computer-aided diagnosis of cirrhosis and hepatocellular carcinoma using multi-phase abdomen CT. Int. J. Comput. Assist. Radiol. Surg. 2019, 14, 1341–1352. [Google Scholar] [CrossRef]
  21. Khan, A.A.; Narejo, G.B. Analysis of Abdominal Computed Tomography Images for Automatic Liver Cancer Diagnosis Using Image Processing Algorithm. Curr. Med. Imaging Rev. 2019, 15, 972–982. [Google Scholar] [CrossRef]
  22. Ma, X.; Wei, J.; Gu, D.; Zhu, Y.; Feng, B.; Liang, M.; Wang, S.; Zhao, X.; Tian, J. Preoperative radiomics nomogram for microvascular invasion prediction in hepatocellular carcinoma using contrast-enhanced CT. Eur. Radiol. 2019, 29, 3595–3605. [Google Scholar] [CrossRef]
  23. Gao, R.; Zhao, S.; Aishanjiang, K.; Cai, H.; Wei, T.; Zhang, Y.; Liu, Z.; Zhou, J.; Han, B.; Wang, J.; et al. Deep learning for differential diagnosis of malignant hepatic tumors based on multi-phase contrast-enhanced CT and clinical data. J. Hematol. Oncol. 2021, 14, 154. [Google Scholar] [CrossRef]
  24. Otani, K.; Nishigaki, D.; Hatsutani, T.; Takamoto, T.; Suzuki, Y.; Kido, S.; Tomiyama, N. Automatic characterization of liver tumors from multi-phase CT images. In Medical Imaging 2023: Computer-Aided Diagnosis, Proceedings of SPIE, San Diego, CA, USA, 19–23 Febuary 2023; SPIE: Bellingham, WA, USA; Volume 12465, pp. 411–415. [CrossRef]
  25. Hori, M.; Suzuki, Y.; Sofue, K.; Sato, J.; Nishigaki, D.; Tomiyama, M.; Nakamoto, A.; Murakami, T.; Tomiyama, N. Artificial intelligence in imaging diagnosis of liver tumors: Current status and future prospects. Abdom. Radiol. 2025. [Google Scholar] [CrossRef]
  26. Yasaka, K.; Akai, H.; Abe, O.; Kiryu, S. Deep learning with convolutional neural network for differentiation of liver masses at dynamic contrast-enhanced CT: A preliminary study. Radiology 2018, 286, 887–896. [Google Scholar] [CrossRef] [PubMed]
  27. Wataya, T.; Yanagawa, M.; Tsubamoto, M.; Sato, T.; Nishigaki, D.; Kita, K.; Yamagata, K.; Suzuki, Y.; Hata, A.; Kido, S.; et al. Radiologists with and without deep learning-based computer-aided diagnosis: Comparison of performance and interobserver agreement for characterizing and diagnosing pulmonary nodules/masses. Eur. Radiol. 2023, 33, 348–359. [Google Scholar] [CrossRef] [PubMed]
  28. Smith, B.J.; Hillis, S.L. Multi-Reader multi-case analysis of variance software for diagnostic performance comparison of imaging modalities. In Proceedings of the SPIE Medical Imaging 2020: Image Perception, Observer Performance, and Technology Assessment, Houston, TX, USA, 19–20 February 2020; Volume 11316, p. 18. [Google Scholar] [CrossRef]
  29. Vallat, R. Pingouin: Statistics in Python. J. Open Source Softw. 2018, 3, 1026. [Google Scholar] [CrossRef]
  30. Anvari, A.; Halpern, E.F.; Samir, A.E. Statistics 101 for Radiologists. Radiographics 2015, 35, 1789–1801. [Google Scholar] [CrossRef] [PubMed]
  31. Landis, J.R.; Koch, G.G. The Measurement of Observer Agreement for Categorical Data. Biometrics 1977, 33, 159. [Google Scholar] [CrossRef]
  32. Jiang, H.; Song, B.; Qin, Y.; Konanur, M.; Wu, Y.; McInnes, M.D.F.; Lafata, K.J.; Bashir, M.R. Modifying LI-RADS on Gadoxetate Disodium-Enhanced MRI: A Secondary Analysis of a Prospective Observational Study. J. Magn. Reson. Imaging 2022, 56, 399–412. [Google Scholar] [CrossRef]
  33. Xie, S.; Zhang, Y.; Chen, J.; Jiang, T.; Liu, W.; Rong, D.; Sun, L.; Zhang, L.; He, B.; Wang, J. Can modified LI-RADS increase the sensitivity of LI-RADS v2018 for the diagnosis of 10-19 mm hepatocellular carcinoma on gadoxetic acid-enhanced MRI? Abdom. Radiol. 2022, 47, 596–607. [Google Scholar] [CrossRef]
  34. Chen, J.; Kuang, S.; Zhang, Y.; Tang, W.; Xie, S.; Zhang, L.; Rong, D.; He, B.; Deng, Y.; Xiao, Y.; et al. Increasing the sensitivity of LI-RADS v2018 for diagnosis of small (10–19 mm) HCC on extracellular contrast-enhanced MRI. Abdom. Radiol. 2021, 46, 1530–1542. [Google Scholar] [CrossRef]
  35. Awai, K.; Murao, K.; Ozawa, A.; Nakayama, Y.; Nakaura, T.; Liu, D.; Kawanaka, K.; Funama, Y.; Morishita, S.; Yamashita, Y. Pulmonary nodules: Estimation of malignancy at thin-section helical CT—Effect of computer-aided diagnosis on performance of radiologists. Radiology 2006, 239, 276–284. [Google Scholar] [CrossRef]
  36. Yanagawa, M.; Niioka, H.; Kusumoto, M.; Awai, K.; Tsubamoto, M.; Satoh, Y.; Miyata, T.; Yoshida, Y.; Kikuchi, N.; Hata, A.; et al. Diagnostic performance for pulmonary adenocarcinoma on CT: Comparison of radiologists with and without three-dimensional convolutional neural network. Eur. Radiol. 2021, 31, 1978–1986. [Google Scholar] [CrossRef]
  37. Ying, H.; Liu, X.; Zhang, M.; Ren, Y.; Zhen, S.; Wang, X.; Liu, B.; Hu, P.; Duan, L.; Cai, M.; et al. A multicenter clinical AI system study for detection and diagnosis of focal liver lesions. Nat. Commun. 2024, 15, 1131. [Google Scholar] [CrossRef] [PubMed]
  38. Davenport, M.S.; Khalatbari, S.; Liu, P.S.C.; Maturen, K.E.; Kaza, R.K.; Wasnik, A.P.; Al-Hawary, M.M.; Glazer, D.I.; Stein, E.B.; Patel, J.; et al. Repeatability of Diagnostic Features and Scoring Systems for Hepatocellular Carcinoma by Using MR Imaging. Radiology 2014, 272, 132. [Google Scholar] [CrossRef] [PubMed]
  39. Kang, J.H.; Choi, S.H.; Lee, J.S.; Park, S.H.; Kim, K.W.; Kim, S.Y.; Lee, S.S.; Byun, J.H. Interreader Agreement of Liver Imaging Reporting and Data System on MRI: A Systematic Review and Meta-Analysis. J. Magn. Reson. Imaging 2020, 52, 795–804. [Google Scholar] [CrossRef] [PubMed]
Figure 1. Flowchart of patient enrollment process.
Applbiosci 04 00056 g001
Figure 2. The example of the AI system’s output. When a liver lesion was selected in a dynamic contrast-enhanced CT image (a), the system was activated to analyze the three-dimensional data of the lesion across all phases, producing characteristic analyses (b). For research purposes, the system was set to display eight features, while the production version shows seven features (not “margin”). As the original outputs were in Japanese, the translated English phrases are shown with permission from the vendor. For the lesion illustrated here, the reference standard diagnosis was pathologically proven hepatocellular carcinoma. Crucially, the image characteristics analyzed by the AI system for this lesion were consistent with the reference standard of the radiologists.
Applbiosci 04 00056 g002
Figure 3. The ROC curves and corresponding AUCs obtained when the readers determined the characteristics and attributed diagnoses of the 83 lesions with and without AI assistance. The figure presents: (a) Primary endpoints: Overall results summarized from all individual characteristics and diagnoses. These two comprehensive endpoints were subject to Bonferroni correction (alpha = 0.025). (b) Exploratory analysis: Results for each individual characteristic and diagnosis. These findings are presented for exploratory purposes only, as multiplicity correction was not applied to these specific analyses. Data in square brackets represent 95% confidence intervals. * Denotes statistically significant improvement (p < 0.025) after Bonferroni adjustment.
Applbiosci 04 00056 g003
Figure 4. An example of a case where the diagnostic performance of two readers was improved using the AI system. When the AI system was used, reader A increased the probability of the presence of washout and reader B increased the probability of the presence of enhancing capsule appearance; therefore, both changed their diagnosis of the hepatic mass from Category B (malignant liver tumors other than classic and early HCCs) to Category A (classic HCCs). Note that not all cases in this study showed such a clear improvement with AI assistance, and this figure is intended solely to be illustrative of the potential benefit.
Applbiosci 04 00056 g004
Table 1. Clinical characteristics of the patients and hepatic nodules/masses included in the study. Data in parentheses are percentages. Mean data include ± standard deviation.
Patient Characteristics
Sex
Male47 (68.1)
Female22 (31.9)
Mean age (years)63 ± 16
Cirrhosis8 (11.6)
Hepatitis B Virus7 (10.1)
Hepatitis C Virus3 (4.3)
Hepatic steatosis13 (18.8)
Nodule/mass characteristics
Size (mm)39.9 ± 28.1
Pathological diagnosis
Hepatocellular carcinoma19
Well differentiated type4
Moderately differentiated type13
Poorly differentiated type2
Cholangiocellular carcinoma8
Liver metastasis3
Neuroendocrine carcinoma3
Focal nodular hyperplasia1
Hepatocellular adenoma1
Epithelioid hemangioendothelioma1
No malignancy3
Table 2. Reference standard for the characteristics and diagnoses of the 83 hepatic nodules/masses.
Imaging CharacteristicsNo. of Positive *No. of Negative †
Enhancement758
Margin5726
Enhancing capsule appearance1865
Nonrim arterial phase hyperenhancement3845
Nonperipheral washout2360
Expansion and coalescence of enhancing areas2459
Delayed enhancement2954
Peripheral enhancement3944
Diagnosis With pathological evidence
Category A (classic HCCs)2515
Category B (malignant tumors)2614
Category C (indeterminate lesions)1510
Category D (benign lesions)170
* Hypervascular for enhancement and circumscribed for margin. † Hypovascular for enhancement and noncircumscribed for margin.
Table 3. AUCs for the junior and senior groups of radiologists for their performances in characterizing the 83 nodules/masses. These findings are presented for exploratory purposes only, as multiplicity correction was not applied to these specific analyses. Data in square brackets are 95% confidence intervals.
AUC for the Junior GroupAUC for the Senior Group
Without AIWith AIp ValueWithout AIWith AIp Value
Enhancement0.89 [0.84, 0.93]0.91 [0.85, 0.97]0.1210.91 [0.86, 0.96]0.93 [0.90, 0.97]0.043
Margin0.79 [0.71, 0.87]0.80 [0.71, 0.88]0.7780.83 [0.76, 0.89]0.83 [0.77, 0.90]0.583
Enhancing capsule appearance0.76 [0.65, 0.87]0.74 [0.63, 0.86]0.4610.81 [0.72, 0.89]0.79 [0.69, 0.88]0.233
Nonrim arterial phase hyperenhancement0.87 [0.80, 0.93]0.88 [0.82, 0.94]0.3450.91 [0.86, 0.96]0.90 [0.84, 0.95]0.352
Nonperipheral washout0.88 [0.82, 0.94]0.91 [0.86, 0.95]0.1360.89 [0.83, 0.95]0.91 [0.85, 0.97]0.149
Expansion and coalescence of enhancing areas0.85 [0.78, 0.92]0.86 [0.78, 0.94]0.5470.82 [0.75, 0.89]0.86 [0.79, 0.93]0.014
Delayed enhancement0.82 [0.75, 0.89]0.86 [0.79, 0.93]0.0430.84 [0.77, 0.92]0.88 [0.81, 0.95]0.019
Peripheral enhancement0.79 [0.72, 0.87]0.80 [0.72, 0.88]0.7580.87 [0.82, 0.92]0.88 [0.83, 0.93]0.274
Table 4. Inter-observer agreement: the kappa statistics of the board-certified abdominal radiologists (reference standard annotators) and the ICCs of the senior and junior radiologists for the characteristics of the 83 nodules/masses. The 95% confidence intervals and p values for all reported Kappa statistics and ICCs were calculated using the bootstrap method. Data in square brackets are 95% confidence intervals. All p values were less than 0.001. No multiplicity correction was applied to these p values; they should be interpreted as suggestive only.
Kappa Statistics for
Two Abdominal Radiologists
(Reference Standard Annotators)
ICCs of the 10 Senior RadiologistsICCs of the 10 Junior Radiologists
Without AIWith AIWithout AIWith AI
Enhancement0.47 [0.27, 0.65]0.63 [0.55, 0.70]0.63 [0.55, 0.70]0.60 [0.52, 0.66]0.63 [0.56, 0.70]
Margin0.51 [0.37, 0.65]0.39 [0.31, 0.47]0.45 [0.35, 0.53]0.48 [0.36, 0.56]0.47 [0.35, 0.56]
Enhancing capsule appearance0.73 [0.58, 0.86]0.54 [0.43, 0.63]0.58 [0.48, 0.66]0.39 [0.29, 0.47]0.47 [0.37, 0.54]
Nonrim arterial phase hyperenhancement0.81 [0.71, 0.91]0.70 [0.64, 0.76]0.71 [0.65, 0.77]0.58 [0.52, 0.64]0.61 [0.54, 0.67]
Nonperipheral washout0.55 [0.41, 0.69]0.71 [0.65, 0.77]0.77 [0.71, 0.82]0.63 [0.55, 0.69]0.67 [0.61, 0.72]
Expansion and coalescence of enhancing areas0.72 [0.59, 0.85]0.52 [0.42, 0.61]0.57 [0.47, 0.65]0.54 [0.44, 0.62]0.57 [0.48, 0.65]
Delayed enhancement0.60 [0.48, 0.73]0.53 [0.46, 0.60]0.64 [0.56, 0.70]0.48 [0.41, 0.54]0.62 [0.54, 0.69]
Peripheral enhancement0.63 [0.51, 0.76]0.58 [0.51, 0.64]0.63 [0.56, 0.69]0.42 [0.36, 0.49]0.49 [0.42, 0.55]
Disclaimer/Publisher’s Note: The statements, opinions and data contained in all publications are solely those of the individual author(s) and contributor(s) and not of MDPI and/or the editor(s). MDPI and/or the editor(s) disclaim responsibility for any injury to people or property resulting from any ideas, methods, instructions or products referred to in the content.