Abstract
Background and objectives: Carbohydrates such as fructooligosaccharides (FOSs) are associated with improved gastrointestinal health and the prevention of excess body fat. We evaluated the long-term effects of high amounts of FOS on metabolic parameters, non-alcoholic fatty liver disease (NAFLD) and short-chain fatty acids (SCFAs). Methods: Sixty C57BL/6 mice received the following diets for four months: control (C), normolipid rich in fiber (F), normolipid supplemented with FOS (FOS), high fat (HL), high fat with high fiber (HLF) and high fat with FOS (HLFOS). We analyzed the animal weight; body composition; food intake; fasting blood glucose; serum and liver lipid profiles; liver and intestinal histologies; malondialdehyde (MDA), hepatic retinol and α-tocopherol; and SCFAs in the feces. Results: Supplementation with FOS in a high-fat diet promoted less body weight gain and reduced liver and retroperitoneal adipose tissue weights compared to HL and HF. FOS prevented NASH and decreased alanine aminotransferase and serum cholesterol levels in experimental animal models of obesity and metabolic syndrome (MS). There were statistical differences found in the dosages of the three main SCFAs in feces (acetic, isobutyric and isovaleric acids). Conclusions: Long-term supplementation with high doses of FOS was effective in reducing weight, adiposity, NAFLD and serum cholesterol in C57BL mice with obesity and MS induced by a high-fat diet.
1. Introduction
Non-alcoholic fatty liver disease (NAFLD) is the most common cause of chronic liver disease of the 21s century, with a prevalence rate range between 23% and 32% depending on the geographical region [1,2]. NAFLD is seen in 47.3–63.7% of people with type 2 diabetes and up to 80% of people with obesity, because of its close association with the metabolic syndrome (MS) [3,4], and with lipid accumulation, inflammation, excessive calorie intake, genetic susceptibility and insulin resistance [5]. Despite not being included as one of the criteria for diagnosing MS, NAFLD, the pro-inflammatory state and endothelial dysfunction are known to be associated with the metabolic, physiological and biochemical changes of this syndrome [6,7].
The intestinal microbiota establishes a symbiotic relationship with its host, contributing nutrients and energy by metabolizing dietary components in the large intestine, including cholesterol [8]. Several studies suggest that the intestinal microbiome represents an environmental factor that contributes to the development of NAFLD [9]. The intestinal microbiota may vary according to the stage of NAFLD, and more studies are needed to confirm the influence of specific bacteria on liver diseases [10].
Fructooligosaccharides (FOS) are widely used prebiotics, being a source of energy and an essential nutrient for intestinal bacteria, which carry out their fermentation and promote the colonization and activities of beneficial bacteria, improve the metabolism of the intestinal microbiota, improve host immunity and reduce inflammation [11]. Many probiotics and prebiotics have been linked to maintaining intestinal microbiota homeostasis and reducing the NAFLD-associated dysregulation of hepatic carbohydrate and lipid metabolisms. Therefore, microbiota-based treatments are beneficial for the prevention and treatment of NAFLD; however, more studies are needed to understand the mechanisms used by FOSs [10].
The use of 5% and 25% of FOS was verified in a study by Mao et al. (2018); however, the latter amount is very high if we consider the tolerance limit in humans. The present work investigated the methodological differences when analyzing high doses of FOS supplemented in diets with two types of lipid composition and offered in the long term, which has been minimally described in similar studies in the literature. The dose used in the present study, 15%, is between the doses of 5 and 25% used by Mao et al., which is more tolerable, but still effective. Thus, the effects of a 15% FOS supplementation for four months on metabolic parameters and the production of short-chain fatty acids in the feces of C57BL mice fed with normolipid and hyperlipid diets rich in fiber were evaluated.
2. Materials and Methods
2.1. Animals and Diet
Sixty male C57BL mice weighing 20 g at the beginning of the experiment were obtained from the Central Animal House of the Faculty of Medicine of Ribeirão Preto (FMRP), University of São Paulo (USP), and maintained under controlled conditions of temperature (24 ± 2 °C) and of humidity and on a light (7:00 a.m.–7:00 p.m.)/dark (7:00 p.m.–7:00 a.m.) cycle. Water and food were supplied ad libitum. Animals were handled according to the Brazilian College of Animal Experimentation recommendations, and all procedures were approved by the Ethics Committee of FMRP (protocol no. 10/2016).
The animals underwent a period of adaptation to the environment and diet for 7 days. During this period, experimental diets were gradually introduced. Animals were randomly assigned to six experimental groups of 10 mice each: control (C), normolipid rich in fiber (F), normolipid supplemented with FOS (FOS), high fat (HL), high fat with high fiber (HLF) and high fat with FOS (HLFOS). For FOS supplementation in the diets, the product Orafti® SIPX (2016) from Beneo Animal Nutrition was used, which consists of powdered chicory inulin containing a mixture of oligosaccharides and polysaccharides composed of fructose units. The soybean oil (®Liza) was purchased at the local market. Vitamins, mineral mix, choline, and L-cystine were purchased from Rhoster (Araçoiaba da Serra, Brazil). All diets were based on the AIN-93 and are described in Table 1 [12].

Table 1.
Composition of experimental diets per 100 g.
Food intake and weight were determined per cage (4 animals/cage) over a period of 18 weeks and are reported as the mean food intake and weight in g/day. Weight was measured weekly in the morning, between 8:00 and 9:00. The food intake was measured twice a week, while always leaving a sufficient quantity of food available.
At the end of the experiment, animals were starved for 12 h and then anesthetized with ketamine and xylazine diluted in saline at a proportion of 1:1:2 mL. It was administrated as dose applications of 10 µL/g weight each. Blood was immediately collected via cardiac puncture, left to rest at room temperature for 30 min and centrifuged at 3500 rpm at 4 °C for serum separation afterward. Serum samples were stored at −80 °C for later analysis. The liver and colon were weighed and frozen in aluminum parts for further analysis. The animals’ feces were extracted from the final portion of the intestine after euthanasia and stored in Eppendorf tubes and frozen at −20 °C.
2.2. Histopathological Analysis of the Intestine
Colon fragments were sectioned in an annular cross-section (proximal, middle and distal thirds), and the material was immersed in buffered formalin. The fragments were analyzed together, choosing well-oriented villi, with apparent and continuous basal, medial and apical portions [13]. For this analysis, a conventional light microscope with 20× magnification was used. Subsequently, the images were analyzed using the Image J software (https://imagej.net/ij/) to quantify the intestinal muscle thickness and the total diameter of the intestinal lumen.
2.3. Histopathological Analysis of the Liver
Liver fragments were fixed in 10% buffered formalin for 24 h and embedded in paraffin. Histological preparations containing 4 µm thick sections were stained with hematoxylin and eosin (H&E). Hepatic steatosis was evaluated semi-quantitatively and classified in crosses, according to Oh et al. (1998) [14] with some modifications. The steatosis score is associated with the morphological location of the liver (zones 1, 2 and 3), with crosses being assigned according to the degree of steatosis: without steatosis (0†); 1–25% in zone 3 only (1†); 25–50% only in zone 3 (2†); 50–75% encompassing zones 2 and 3 (3†) and 75–100% involving zones 1, 2 and 3 (4†). In addition, the presence of inflammatory infiltrate (L: mild; M: moderate and I: intense) and Mallory’s bodies (A: absent; FC: a few corpuscles and MC: many corpuscles) were also evaluated. For these analyses, a conventional light microscope with magnifications of 20 and 40 times was used.
2.4. Biochemical and Hepatic Analyses
Protein determinations in the livers and serum samples were performed using a commercial kit using the Biuret method (Labtest Diagnóstica S.A., Lagoa Santa, MG, Brazil). The total cholesterol (TC) and triacylglycerides (TAGs) in the serum, as well as in the livers, were determined using commercial kits from Labtest (Labtest Diagnóstica S.A., Lagoa Santa, MG, Brazil). Aspartate aminotransferase (AST) and alanine aminotransferase (ALT) transaminases were quantitatively determined using a commercial Labtest kit (Labtest Diagnóstica S.A., Lagoa Santa, MG, Brazil) in a serum sample with continuous UV kinetic reaction. For the determination and quantification of total fat in the liver, the method proposed by Bligh and Dyer (1959) [15] was used.
2.5. Analysis of Glycemia
At the end of the experiment, the animals’ glycemia was determined using obtained samples from the animals’ tails and the freestyle lite Abbot®A glucometer.
2.6. Analysis of Lipid Peroxidation and Antioxidant Parameters
2.6.1. Total Antioxidant Capacity (TAC)
The analysis of the TAC was performed based on the methodology described by Erel (2004) [16]. After preparing the two reagents described, an aliquot of 5 μL of the serum was removed in a flat-bottom microplate and added to 200 μL of the first reagent, and the first absorbance was read at a wavelength of 660 nm, using this absorbance as a blank sample. Then, 20 μL of the second reagent was added and incubated for 5 min, and a new reading was taken on the spectrophotometer with the same wavelength. The TAC concentration was calculated by comparing the absorbance to a Trolox standard curve.
2.6.2. Hepatic Malondialdehyde (MDA)
The Gerard-Monnier et al. method [17] with some modifications was used to determine the MDA. In total, 100 mg of tissue was used, which was homogenized in 500 μL of phosphate buffer with pH 7.4 and subsequently centrifuged at 3500 rpm for 10 min. A 100 μL aliquot of the supernatant was removed and 300 μL of 1-methyl-phenylindole solution 10 mmol/L in acetonitrile and methanol (2:1, v/v) and 75 μL of pure HCL (hydrochloric acid) (37%) were added. Afterward, the Eppendorf tubes were vortexed and incubated in a water bath at 45 °C for 40 min. Then, the samples were cooled on ice and centrifuged at 4000 rpm for 10 min. The absorbance was read in the supernatant at a wavelength of 586 nm. The MDA concentration was calculated by comparing it to a curve of hydrolyzed 1,1,3,3-tetramethoxypropane.
2.6.3. Retinol and Vitamin E (α-Tocopherol)
The methodology used was based on Arnaud et al.’s [18] and described by Jordão et al. [19]. A fragment of approximately 200 mg of liver was homogenized with 1 mL of ethanol. Subsequently, 1 mL of heptane was added, vortexed for 1 min, and then centrifuged at 3000 rpm for 10 min. In total, 200 µL of the supernatant was removed and then dried under a nitrogen flow. The dry residue was resuspended with 200 µL of the mobile phase acetonitrile/dichloromethane/methanol in a 7/2/1 ratio. A total of 20 µL was injected into the HPLC. A Shimadzu model LC-20AT chromatograph was used: type C-18 column (250 mm × 4.6 mm, 5 µm); UV-visible detector model SPD-20A; flow rate of 1.0 mL/min. Concentrations were determined using an external standard and results were expressed in µmolar. For the analysis of α-tocopherol, a reading was performed at a wavelength of 292 nm, while for retinol the reading was at 325 nm.
2.7. Determination of Short-Chain Fatty Acids in Feces
The determination of short-chain fatty acids in feces was performed based on the methodology of Zhao, Nyman and Jonsson (2006) [20] with adaptations. In a 5 mL test tube, 0.25 g of feces collected directly from the colons of the animals on the day of euthanasia were weighed. In total, 1.25 mL of ultrapure water was added and homogenized until a uniform homogenate was obtained. The pH of the suspension was adjusted to 2 to 3 by adding the equivalent of 2 drops of HCl. The suspension was left at room temperature for 10 min, stirring occasionally, and was then transferred to a 2 mL Eppendorf and centrifuged at 14,000 rpm for 10 min. The supernatant was filtered using 0.2 µm filters attached to syringes. After filtering, the sample was injected into the gas chromatograph (GC). Fatty acids were determined on a SHIMADZU gas chromatograph, CG-2014, with an AOC-20i auto-injector, AGILENT fused silica column 30 m long, 0.535 mm internal diameter and 0.50 µm film thickness. The carrier gas used was helium, with a flow of 15 mL/min with a run of 17.5 min. The injector and detector temperatures were 250 °C. The standard used was composed of a mix of fatty acids from Supelco (Supelco WSFA—4 Mix, Bellefonte, PA, USA).
2.8. Statistical Analysis
One-way analysis of variance (ANOVA) was applied to the data of the various groups, with the Tukey post-test, using the GraphPad Prism software, version 5.00 for Windows (GraphPad Software, San Diego, CA, USA), with the level of significance set at p < 0.05. Data were reported as the mean ± standard deviation.
3. Results
3.1. Effects of FOS on Body Weight Gain and Energy Intake
There was a higher caloric intake by the animals in the three groups that received a high-fat diet compared to the normolipid control group, and supplementation with fiber or FOS did not promote changes in caloric intake within the groups with similar lipid content. The higher caloric intake of the animals that received a high-fat diet promoted greater weight gain in the HL group compared to the other groups, and supplementation with FOS reduced the weight gain of the animals that consumed a high-fat diet. No statistically significant difference was verified in the caloric intake of the three groups that received a high-fat diet and a control diet (Figure 1).
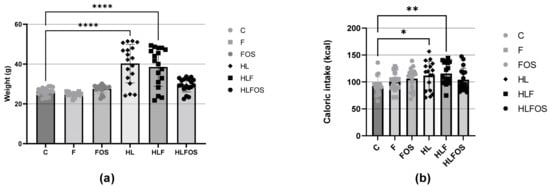
Figure 1.
(a) Weights of the experimental groups expressed as the mean and standard deviation during the four months. (b) Comparison of the average caloric intake expressed as the mean and standard deviation per animal of each experimental group during the four months. C—control group; F—high-fiber normolipid diet group; FOS—normolipid diet with FOS group; HL—high-fat diet group; HLF—fiber-rich, high-fat diet group; HLFOS—high-fat diet group with FOS. FOS—fructooligosaccharide. * indicates significantly different (p = 0.003), ** indicates significantly different (p = 0.006), **** indicates significantly different (p < 0.0001). N = 60. Data are reported as mean ± SD.
3.2. Liver Weight, Epididymal and Retroperitoneal Adipose Tissue Weight
The high-fat diet enriched with FOS provided a lower body weight and reduced retroperitoneal adipose tissue compared to the HL and HLF groups. There was no statistically significant difference in relation to the sum of adipose tissues analyzed between these groups (Figure 2). Although no statistically significant difference was verified between the groups in relation to the liver dosage of total fat or cholesterol (Figure 2), it was verified that the supply of FOS in the high-fat diet promoted lower liver weight (Figure 2) and reduction the degree of hepatic steatosis (Figure 3). The presences of inflammatory infiltrate or Mallory’s bodies were not identified in the histopathological analysis of liver slides.
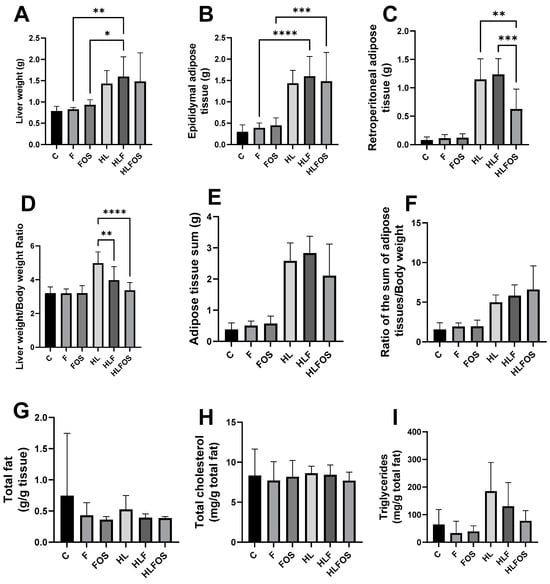
Figure 2.
Comparison of liver and adipose tissue weights of each experimental group and liver lipid profile. C—control group; F—high-fiber normolipid diet group; FOS—normolipid diet with FOS group; HL—high-fat diet group; HLF—fiber-rich, high-fat diet group; HLFOS—high-fat diet with FOS group. FOS—fructooligosaccharide. (A) Liver weight; (B) Epididymal adipose tissue (g); (C) Retroperitoneal adipose tissue (g); (D) Liver weight/body weight ratio; (E) Adipose tissue sum (g); (F) Ratio of the sum of adipose tissues/body weight; (G) Total fat (g/g tissue); (H) Total cholesterol (mg/g total fat); (I) Triglycerides (mg/g total fat). * indicates significantly different (p < 0.02), ** indicates significantly different (p < 0.002), *** indicates significantly different (p < 0.0002), **** indicates significantly different (p < 0.0001). N = 60. Data are reported as mean ± SD.
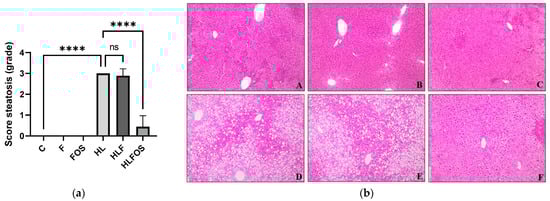
Figure 3.
Analysis of hepatic parameters. Steatosis scores (a). Liver photomicrograph (b). A = Control; B = High-fiber control; C = Control supplemented with fructooligosaccharides; D = Hyperlipidic control; E = Hyperlipidic rich in fiber; F = Hyperlipid supplemented with fructooligosaccharides. Data are reported as mean ± standard deviation for a period of 18 weeks. **** indicates significantly different (p < 0.0001). N = 60.
3.3. Effects of FOS on Triacylglycerol, Cholesterol, VLDL, HDL-C, Glycemia and the Triacylglycerol/HDL/Cholesterol Ratio
Regarding serum levels, there was no statistically significant difference in the AST and triglyceride values, or in the AST/ALT ratio. It was found that the high-fat diet promoted higher fasting glycemia compared to normolipid diets, with no statistical differences observed with fiber or FOS supplementation. The ALT dosage was significantly higher in the HL and HLF groups compared to that in the C and F groups, and the supplementation with FOS in the high-fat diet promoted a reduction in the ALT value so that there was no statistical difference when compared to the animals that received the normolipid diet. Finally, serum cholesterol dosages were also significantly higher in the HL and HLF groups, and the supplementation of the high-fat diet with FOS reduced serum cholesterol so that there was no difference between this and the F group (Figure 4).
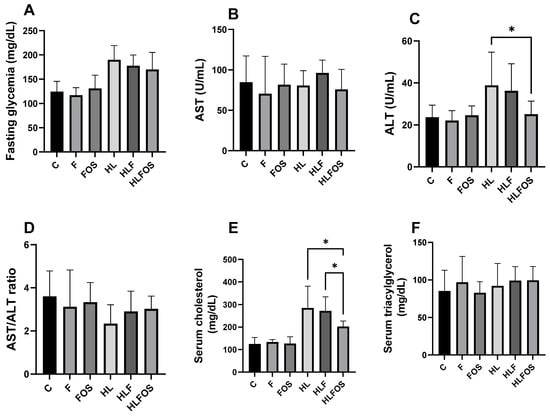
Figure 4.
Comparison of serum levels of fasting glucose, aspartate aminotransferase (AST), alanine aminotransferase (ALT), cholesterol and triglycerides according to the experimental group. C—control group; F—high-fiber normolipid diet group; FOS—normolipid diet with FOS group; HL—high-fat diet group; HLF—fiber-rich, high-fat diet group; HLFOS—high-fat diet with FOS group. FOS—fructooligosaccharide. (A) Fasting glycemia (mg/dL); (B) AST (U/mL); (C) ALT (U/mL); (D) AST/ALT ratio; (E) Serum cholesterol (mg/dL); (F) Serum triacylglycerol (mg/dL). * indicates significantly different (p < 0.0004). N = 60. Data are reported as mean ± SD.
3.4. Effects of FOS on Oxidative Stress Parameters
There was a significant increase in MDA in the HLF group when compared to the other groups that received a normolipid diet. Regarding hepatic antioxidant parameters, no statistically significant difference was observed in retinol dosages, while in α-tocopherol dosages, it was verified that the high-fat diet promoted a reduction in this antioxidant in the liver, and the supply of FOS promoted a tendency to increase this parameter in animals that ate a high-fat diet, but without statistical significance. Finally, supplementation with microcrystalline cellulose and FOS significantly increased hepatic α-tocopherol in the groups that received a normolipid diet, with the highest value observed in the F group compared to the other experimental groups. There was no statistically significant difference in the TAC (Figure 5).
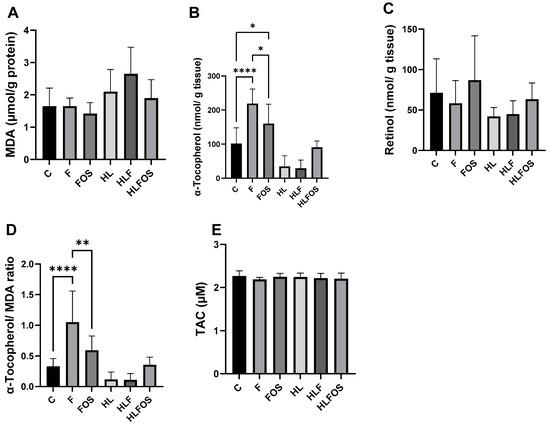
Figure 5.
Liver analyses of malondialdehyde (MDA), retinol, α-tocopherol and total antioxidant capacity (TAC) according to the experimental group. C—control group; F—high-fiber normolipid diet group; FOS—normolipid diet with FOS group; HL—high-fat diet group; HLF—fiber-rich, high-fat diet group; HLFOS—high-fat diet with FOS group. FOS—fructooligosaccharide. (A) MDA (µmol/g protein); (B) α-Tocopherol (nmol/g tissue); (C) Retinol (nmol/ g tissue); (D) α-Tocopherol/ MDA ratio; (E) TAC (µM). * indicates significantly different (p = 0.02), ** indicates significantly different (p < 0.0025), **** indicates significantly different (p < 0.0001). N = 60. Data are reported as mean ± SD.
3.5. Effects on Enteric Muscle Thickness and Intestinal Lumen Diameter
The histological analysis of the colons verified that the largest total diameter of the intestinal lumen occurred in the HL group, followed by the HLF group and then by the HLFOS group, and the smallest diameter value was found in the animals of the C and FOS groups, which did not present statistical differences compared to each other. Intestinal muscle thickness, on the other hand, showed a statistically significant difference between all groups, with the smallest thickness being found in the HL group, followed by the HLF group and then by the F group; FOS supplementation increased the thickness of the intestinal musculature in animals that received a high-fat diet, but reduced it in those that consumed a normolipid diet (Table 2).
Table 2.
Comparison of the total diameters of the intestinal lumen and intestinal muscle thicknesses according to the experimental group N.
3.6. Effects of FOS on Short-Chain Fatty Acids in Feces
The analysis of short-chain fatty acids in feces did not find statistically significant differences in the analyses of propionic, butyric and valeric acids. However, it was found that microcrystalline cellulose supplementation had opposite effects on acetic acid concentration depending on the lipid content of the diet. Regarding isobutyric and isovaleric acids, it was observed that the HLFOS group had significantly lower concentrations compared to group F, and in the case of isobutyric acid, this difference extended to group C (Figure 6).
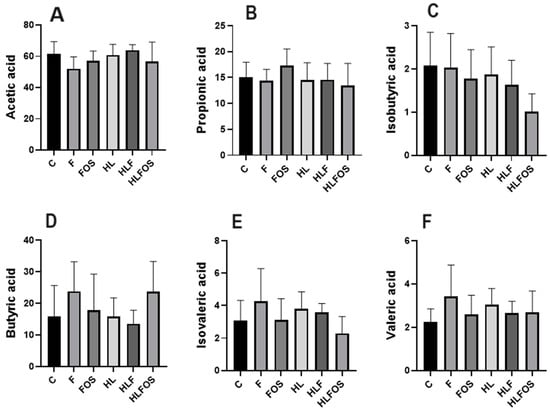
Figure 6.
Comparison of concentrations of short-chain fatty acids analyzed in feces according to the experimental group. C—control group; F—high-fiber normolipid diet group; FOS—normolipid diet with FOS group; HL—high-fat diet group; HLF—fiber-rich, high-fat diet group; HLFOS—high-fat diet with FOS group. FOS—fructooligosaccharide. (A) Acetic acid; (B) Propionic acid; (C) Isobutyric acid; (D) Butyric acid; (E) Isovaleric acid; (F) Valeric acid. N = 60. Data are reported as mean ± SD.
4. Discussion
Although NAFLD, which has no specific medical treatment, is not part of the diagnostic criteria for MS, its presence increases the risk of a cardiovascular event in afflicted individuals [21,22]. Many studies have suggested that NAFLD progression can be inhibited with the use of prebiotics, probiotics and symbiotics [23,24,25], but the mechanisms of the effects of FOS on body composition, metabolic parameters, the production of short-chain fatty acids in feces and NAFLD need further understanding. The present study evaluated the long-term effects of 15% FOS supplementation compared to 15% microcrystalline cellulose in experimental animal models with obesity and metabolic syndrome induced by a high-fat diet, as well as in animals receiving a normolipid diet. The findings indicate that FOSs promoted reductions in body weight, retroperitoneal adipose tissue and serum cholesterol and prevented NAFLD in C57BL mice with obesity and metabolic syndrome induced by a high-fat diet.
Despite the fact that supplementation with FOS did not interfere with the monthly caloric intake regardless of the lipid content of the diet, from the fifth experimental week onward, a lower weight of the animals that received a high-fat diet with FOS (HLFOS) was verified, and at the end of the eighteen weeks, the weight of the HLFOS group was equal to those of the groups that received a normolipid diet, which was not observed with the diet enriched with microcrystalline cellulose. In addition, there was a reduction in the weight of the retroperitoneal adipose tissue in the HLFOS group compared to the other groups that received a high-fat diet. Such results are similar to those of the study by Mao et al. [26], who verified a reduction in body weight in mice receiving a normolipid diet rich in FOS (25%), but the same was not observed in animals that received only 5% of this prebiotic.
The benefits of FOS in reducing weight gain may be due to the production of SCFAs from intestinal bacteria, as Lu et al. (2016) [27] found that the long-term offer of a high-fat diet supplemented with 5% of the main SCFA, alone or mixed, stimulated beige adipogenesis, increasing fat oxidation and energy expenditure mediated by GPR43 and GPR41 activation. In addition, SCFAs are also related to the increased plasma concentration of PYY (Peptide YY), which is an intestinal peptide hormone secreted in the postprandial period and which decreases intestinal motility and exerts anorexigenic effects in eutrophic and obese individuals [28,29]. In the present study, no significant changes were found in the proportions of acetic, butyric or propionic acids in the groups that received a diet enriched with FOS, with the only finding being that the HLFOS group had lower concentrations of isobutyric acid compared to groups C and F, and of isovaleric compared to group F. The divergence of findings regarding the effects of FOS on food intake and body composition can be explained by the different methodologies used, whether in relation to the duration of the experiment, the type of diet or the amount of FOS. Therefore, new studies are needed to evaluate the concentrations of SCFAs in other intestinal segments, in the bloodstream, and in the liver, to establish correlations between the benefits observed with FOS supplementation and the use of SCFAs at both local and peripheral levels.
Animals that received a high-fat diet had higher liver weights, hepatic steatosis and an increased ALT, and long-term FOS supplementation prevented the development of NAFLD and reduced the liver weight and ALT levels, while the same was not observed in animals that received a high-fat diet with high doses of cellulose. These results are consistent with those found by Matsumoto et al. (2017) [30] in C57BL mice with NAFLD induced by a choline-deficient diet, in which the supply of 5% FOS for 3 weeks improved liver parameters with a reduction in ALT levels, as well as in the degree of steatosis, in the presence of inflammation and hepatic ballooning. The prevention of NAFLD was associated with decreased intestinal permeability and SCFA production by intestinal bacteria.
In our study, it was expected that the offer of FOS would improve fasting glycemia and serum triglycerides in the experimental animal models of obesity and MS, but there were no statistically significant differences in these analyses, with a reduction only in serum cholesterol being observed in the HLFOS group compared to the HL and HLF groups. These findings are consistent with those of Mao et al. (2018) [26], whose supply of FOS in a normolipid diet did not interfere with the analyzed serum biochemical parameters, even with the use of high amounts of this prebiotic.
Considering that the oxidative stress promoted by the increase in fatty acids in the liver is an important factor in the pathogenesis of non-alcoholic steatohepatitis resulting from NASH, it is necessary to develop therapeutic targets that can act in this way [31]. The present study did not find alterations in the total antioxidant capacity between the groups, and the supply of FOS did not interfere in the dosages of hepatic MDA and retinol, regardless of the lipid content of the diet. Based on these findings, it cannot be concluded that the supply of 15% FOS, in the long term, improved the antioxidant system in experimental animal models of obesity and MS induced by a high-fat diet.
The histological analysis of the colon showed that the high-fat diet increased the diameter of the intestinal lumen and reduced the enteric muscle thickness, whereas the supplementation with fructooligosaccharides was able to reverse these changes. Although the supply of FOS in the normolipid diet did not change the diameter of the intestinal lumen compared to group C, a reduction in the enteric musculature was observed. Wedel et al. (2006) [32] demonstrated that severe colorectal motility disorders, such as idiopathic megacolon and slow-transit constipation, are associated with the deficient expressions of proteins linked to intestinal smooth muscle contraction. In a review study, it was found that both an increase and a decrease in smooth muscle contractility was present in intestinal inflammation, and the functional deficiency of smooth muscle cells can occur due to changes in the activities of muscarinic receptors and ion channels [33]. Thus, the evidence that fermentable dietary fibers influence the enteric muscle thickness and intestinal lumen diameter suggests that changes in gastrointestinal health do not involve only the modulation of intestinal microbiota and mucosal permeability.
The prebiotic effect of FOSs is responsible for the modulation of the intestinal microbiota and the modifications in SCFAs, and currently, the modulation of the intestinal microbiota appears to be a promising direction for the treatment of NASH [34,35,36]. The production of SCFAs by intestinal bacteria plays an important role in liver health, as on the one hand, it contributes to increased intestinal absorption and, consequently, caloric intake, and on the other hand, it suppresses colon inflammation through the activation of GPR43, protecting the liver against toxic components coming from the portal vein [37,38]. Furthermore, the benefits of FOS in non-alcoholic hepatic steatosis would be related to its prebiotic properties, which can be confirmed with the results of the present study, since NASH induced by the high-fat diet was prevented only by offering FOS, while the supplementation with microcrystalline cellulose, which does not present prebiotic characteristics in monogastric animals, did not have the same effects.
In the present study, the supply of high doses of FOSs showed significant benefits in experimental animal models of obesity and MS induced by a high-fat diet, but the same was not observed in the groups that received a normolipid diet with FOS. Furthermore, no signs of liver toxicity or the worsening of metabolic parameters resulting from the use of high doses of fructooligosaccharides were found, indicating that the amount used in the long term does not seem to trigger possible harm to the health of the animal models in this experiment. The limitations of the study are the absence of a control group in which the intestinal microbiome is compromised, as well as the lack of data demonstrating the diversity of the intestinal microbiome, as presented by Mao et al. (2018), which is a suggestion for new studies in the future. Thus, the present study contributes to the development of new research with FOS, either to explore the mechanisms by which this prebiotic exerts different effects according to the lipid content of the diet, or to invest in experimental protocols that define therapeutic amounts of fructooligosaccharides in the prevention and treatment of obesity, MS and NAFLD.
5. Conclusions
In summary, the long-term supply of 15% FOS promoted reductions in body weight, retroperitoneal adipose tissue and serum cholesterol and prevented NAFLD in C57BL mice with obesity and MS induced by a high-fat diet. The alterations found in the intestinal histology suggest that the benefits of FOS in gastrointestinal health are not restricted to the modulation of the microbiota, reinforcing the importance of new studies that investigate the effects of this prebiotic at the local level, correlating them with peripheral alterations.
Author Contributions
Conceptualization, P.N.B., H.H. and A.A.J.; methodology, P.N.B., H.H., P.P.O., L.M.C.S., B.F.V. and A.A.J.; software, P.N.B. and B.F.V.; validation, P.N.B. and A.A.J.; formal analysis, P.N.B., P.P.O., H.H., B.F.V. and L.M.C.S.; investigation, P.N.B.; resources, A.A.J.; data curation, P.N.B., B.F.V. and A.A.J.; writing—original draft preparation, P.N.B. and B.F.V.; writing—review and editing, B.F.V.; visualization, A.A.J.; supervision, A.A.J., P.P.O. and L.M.C.S.; project administration, P.N.B. and A.A.J.; funding acquisition, P.N.B. and A.A.J. All authors have read and agreed to the published version of the manuscript.
Funding
This research was funded by Coordenação de Aperfeiçoamento de Pessoal de Nível Superior (CAPES), grant number 88882.378968/2019-01 and 88887.878134/2023-00 and by Fundação de Apoio ao Ensino, Pesquisa e Assistência do Hospital das Clínicas da Faculdade de Medicina de Ribeirão Preto da Universidade de São Paulo (FAEPA).
Institutional Review Board Statement
The animal study protocol was approved by the Ethics Committee of Faculty of Medicine of Ribeirão Preto (FMRP), University of São Paulo (USP) (protocol code 10/2016, approved on 28 March 2016).
Data Availability Statement
The data used to support this study are available from the corresponding author upon request.
Acknowledgments
The authors are grateful to the staff of the Central Animal Facility of the Ribeirão Preto Medical School, University of São Paulo (FMRP-USP), for their technical support.
Conflicts of Interest
The authors declare no conflicts of interest.
References
- Younossi, Z.; Anstee, Q.M.; Marietti, M.; Hardy, T.; Henry, L.; Eslam, M.; George, J.; Bugianesi, E. Global burden of NAFLD and NASH: Trends, predictions, risk factors and prevention. Nat. Rev. Gastroenterol. Hepatol. 2018, 15, 11–20. [Google Scholar] [CrossRef]
- Younossi, Z.M.; Koenig, A.B.; Abdelatif, D.; Fazel, Y.; Henry, L.; Wymer, M. Global epidemiology of nonalcoholic fatty liver disease-Meta-analytic assessment of prevalence, incidence, and outcomes. Hepatology 2016, 64, 73–84. [Google Scholar] [CrossRef]
- Polyzos, S.A.; Kountouras, J.; Mantzoros, C.S. Obesity and nonalcoholic fatty liver disease: From pathophysiology to therapeutics. Metabolism 2019, 92, 82–97. [Google Scholar] [CrossRef]
- Younossi, Z.M.; Golabi, P.; de Avila, L.; Paik, J.M.; Srishord, M.; Fukui, N.; Qiu, Y.; Burns, L.; Afendy, A.; Nader, F. The global epidemiology of NAFLD and NASH in patients with type 2 diabetes: A systematic review and meta-analysis. J. Hepatol. 2019, 71, 793–801. [Google Scholar] [CrossRef]
- Arab, J.P.; Karpen, S.J.; Dawson, P.A.; Arrese, M.; Trauner, M. Bile acids and nonalcoholic fatty liver disease: Molecular insights and therapeutic perspectives. Hepatology 2017, 65, 350–362. [Google Scholar] [CrossRef]
- Sociedade Brasileira de Cardiologia. I Diretriz Brasileira de Diagnóstico e Tratamento da Síndrome Metabólica; Arquivos Brasileiros De Cardiologia: São Paulo, Brazil, 2005; Volume 84. [Google Scholar]
- Alberti, K.G.M.M.; Eckel, R.H.; Grundy, S.M.; Zimmet, P.Z.; Cleeman, J.I.; Donato, K.A.; Fruchart, J.-C.; James, W.P.T.; Loria, C.M.; Smith, S.C.; et al. Harmonizing the metabolic syndrome: A joint interim statement of the International Diabetes Federation Task Force on Epidemiology and Prevention; National Heart, Lung, and Blood Institute; American Heart Association; World Heart Federation; International. Circulation 2009, 120, 1640–1645. [Google Scholar] [CrossRef]
- Canfora, E.E.; Meex, R.C.R.; Venema, K.; Blaak, E.E. Gut microbial metabolites in obesity, NAFLD and T2DM. Nat. Rev. Endocrinol. 2019, 15, 261–273. [Google Scholar] [CrossRef]
- Aron-Wisnewsky, J.; Vigliotti, C.; Witjes, J.; Le, P.; Holleboom, A.G.; Verheij, J.; Nieuwdorp, M.; Clément, K. Gut microbiota and human NAFLD: Disentangling microbial signatures from metabolic disorders. Nat. Rev. Gastroenterol. Hepatol. 2020, 17, 279–297. [Google Scholar] [CrossRef] [PubMed]
- Huang, X.; Chen, Q.; Fan, Y.; Yang, R.; Gong, G.; Yan, C.; Song, Y.; Zhang, B.; Xi, S.; Huang, Y.; et al. Fructooligosaccharides attenuate non-alcoholic fatty liver disease by remodeling gut microbiota and association with lipid metabolism. Biomed. Pharmacother. 2023, 159, 114300. [Google Scholar] [CrossRef] [PubMed]
- Guarino, M.; Altomare, A.; Emerenziani, S.; Di Rosa, C.; Ribolsi, M.; Balestrieri, P.; Iovino, P.; Rocchi, G.; Cicala, M. Mechanisms of Action of Prebiotics and Their Effects on Gastro-Intestinal Disorders in Adults. Nutrients 2020, 12, 1037. [Google Scholar] [CrossRef]
- Reeves, P.G.; Nielsen, F.H.; Fahey, G.C. AIN-93 Purified Diets for Laboratory Rodents: Final Report of the American Institute of Nutrition Ad Hoc Writing Committee on the Reformulation of the AIN-76A Rodent Diet. J. Nutr. 1993, 123, 1939–1951. [Google Scholar] [CrossRef]
- Gurmini, J.; Cecílio, W.A.C.; Schuler, S.L.; Olandoski, M.; Noronha, L. de Desnutrição intra-uterina e suas alterações no intestino delgado de ratos Wistar ao nascimento e após a lactação. J. Bras. Patol. Med. Lab. 2005, 41, 271–278. [Google Scholar] [CrossRef]
- Oh, S.I.; Kim, C.-I.; Chun, H.J.; Park, S.C. Chronic Ethanol Consumption Affects Glutathione Status in Rat Liver. J. Nutr. 1998, 128, 758–763. [Google Scholar] [CrossRef] [PubMed]
- Bligh, E.G.; Dyer, W.J. A Rapid method of total lipid extraction and purification. Can. J. Biochem. Physiol. 1959, 37, 911–917. [Google Scholar] [CrossRef]
- Erel, O. A novel automated direct measurement method for total antioxidant capacity using a new generation, more stable ABTS radical cation. Clin. Biochem. 2004, 37, 277–285. [Google Scholar] [CrossRef] [PubMed]
- Gérard-Monnier, D.; Erdelmeier, I.; Régnard, K.; Moze-Henry, N.; Yadan, J.-C.; Chaudière, J. Reactions of 1-Methyl-2-phenylindole with Malondialdehyde and 4-Hydroxyalkenals. Analytical Applications to a Colorimetric Assay of Lipid Peroxidation. Chem. Res. Toxicol. 1998, 11, 1176–1183. [Google Scholar] [CrossRef]
- Arnaud, J.; Fortis, I.; Blachier, S.; Kia, D.; Favier, A. Simultaneous determination of retinol, α-tocopherol and β-carotene in serum by isocratic high-performance liquid chromatography. J. Chromatogr. B Biomed. Sci. Appl. 1991, 572, 103–116. [Google Scholar] [CrossRef]
- Jordão, A.A.; Chiarello, P.G.; Arantes, M.R.; Meirelles, M.S.; Vannucchi, H. Effect of an acute dose of ethanol on lipid peroxidation in rats: Action of vitamin E. Food Chem. Toxicol. 2004, 42, 459–464. [Google Scholar] [CrossRef]
- Zhao, G.; Nyman, M.; Åke Jönsson, J. Rapid determination of short-chain fatty acids in colonic contents and faeces of humans and rats by acidified water-extraction and direct-injection gas chromatography. Biomed. Chromatogr. 2006, 20, 674–682. [Google Scholar] [CrossRef]
- Du, F.; Huang, R.; Lin, D.; Wang, Y.; Yang, X.; Huang, X.; Zheng, B.; Chen, Z.; Huang, Y.; Wang, X.; et al. Resveratrol Improves Liver Steatosis and Insulin Resistance in Non-alcoholic Fatty Liver Disease in Association With the Gut Microbiota. Front. Microbiol. 2021, 12, 611323. [Google Scholar] [CrossRef]
- Luna-Luna, M.; Medina-Urrutia, A.; Vargas-Alarcón, G.; Coss-Rovirosa, F.; Vargas-Barrón, J.; Pérez-Méndez, Ó. Adipose Tissue in Metabolic Syndrome: Onset and Progression of Atherosclerosis. Arch. Med. Res. 2015, 46, 392–407. [Google Scholar] [CrossRef]
- Carpi, R.Z.; Barbalho, S.M.; Sloan, K.P.; Laurindo, L.F.; Gonzaga, H.F.; Grippa, P.C.; Zutin, T.L.M.; Girio, R.J.S.; Repetti, C.S.F.; Detregiachi, C.R.P.; et al. The Effects of Probiotics, Prebiotics and Synbiotics in Non-Alcoholic Fat Liver Disease (NAFLD) and Non-Alcoholic Steatohepatitis (NASH): A Systematic Review. Int. J. Mol. Sci. 2022, 23, 8805. [Google Scholar] [CrossRef]
- Scorletti, E.; Afolabi, P.R.; Miles, E.A.; Smith, D.E.; Almehmadi, A.; Alshathry, A.; Childs, C.E.; Del Fabbro, S.; Bilson, J.; Moyses, H.E.; et al. Synbiotics Alter Fecal Microbiomes, But Not Liver Fat or Fibrosis, in a Randomized Trial of Patients With Nonalcoholic Fatty Liver Disease. Gastroenterology 2020, 158, 1597–1610.e7. [Google Scholar] [CrossRef]
- Hernández-Pérez, S.; Oliart-Ros, R.M.; Casas-Godoy, L.; Sandoval, G.; Guarner-Lans, V.; Castrejón-Téllez, V.; Quevedo-Corona, L.; Peña-Montes, C.; Ramírez-Higuera, A. Beneficial Effects of Fructooligosaccharides Esterified with Lauric Acid in a Metabolic Syndrome Model Induced by a High-Fat and High-Carbohydrate Diet in Wistar Rats. J. Med. Food 2022, 25, 828–835. [Google Scholar] [CrossRef] [PubMed]
- Mao, B.; Gu, J.; Li, D.; Cui, S.; Zhao, J.; Zhang, H.; Chen, W. Effects of Different Doses of Fructooligosaccharides (FOS) on the Composition of Mice Fecal Microbiota, Especially the Bifidobacterium Composition. Nutrients 2018, 10, 1105. [Google Scholar] [CrossRef] [PubMed]
- Lu, Y.; Fan, C.; Li, P.; Lu, Y.; Chang, X.; Qi, K. Short Chain Fatty Acids Prevent High-fat-diet-induced Obesity in Mice by Regulating G Protein-coupled Receptors and Gut Microbiota. Sci. Rep. 2016, 6, 37589. [Google Scholar] [CrossRef] [PubMed]
- Wang, S.-Z.; Yu, Y.-J.; Adeli, K. Role of Gut Microbiota in Neuroendocrine Regulation of Carbohydrate and Lipid Metabolism via the Microbiota-Gut-Brain-Liver Axis. Microorganisms 2020, 8, 527. [Google Scholar] [CrossRef]
- Nishida, A.; Miyamoto, J.; Shimizu, H.; Kimura, I. Gut microbial short-chain fatty acids-mediated olfactory receptor 78 stimulation promotes anorexigenic gut hormone peptide YY secretion in mice. Biochem. Biophys. Res. Commun. 2021, 557, 48–54. [Google Scholar] [CrossRef] [PubMed]
- Matsumoto, K.; Ichimura, M.; Tsuneyama, K.; Moritoki, Y.; Tsunashima, H.; Omagari, K.; Hara, M.; Yasuda, I.; Miyakawa, H.; Kikuchi, K. Fructo-oligosaccharides and intestinal barrier function in a methionine–choline-deficient mouse model of nonalcoholic steatohepatitis. PLoS ONE 2017, 12, e0175406. [Google Scholar] [CrossRef] [PubMed]
- Powell, E.E.; Wong, V.W.-S.; Rinella, M. Non-alcoholic fatty liver disease. Lancet 2021, 397, 2212–2224. [Google Scholar] [CrossRef]
- Wedel, T.; Van Eys, G.J.J.M.; Waltregny, D.; Glenisson, W.; Castronovo, V.; Vanderwinden, J.M. Novel smooth muscle markers reveal abnormalities of the intestinal musculature in severe colorectal motility disorders. Neurogastroenterol. Motil. 2006, 18, 526–538. [Google Scholar] [CrossRef] [PubMed]
- Ohama, T.; Hori, M.; Ozaki, H. Mechanism of abnormal intestinal motility in inflammatory bowel disease: How smooth muscle contraction is reduced? J. Smooth Muscle Res. 2007, 43, 43–54. [Google Scholar] [CrossRef] [PubMed]
- Tilg, H.; Adolph, T.E.; Dudek, M.; Knolle, P. Non-alcoholic fatty liver disease: The interplay between metabolism, microbes and immunity. Nat. Metab. 2021, 3, 1596–1607. [Google Scholar] [CrossRef] [PubMed]
- Jensen, T.; Abdelmalek, M.F.; Sullivan, S.; Nadeau, K.J.; Green, M.; Roncal, C.; Nakagawa, T.; Kuwabara, M.; Sato, Y.; Kang, D.-H.; et al. Fructose and sugar: A major mediator of non-alcoholic fatty liver disease. J. Hepatol. 2018, 68, 1063–1075. [Google Scholar] [CrossRef]
- Ji, Y.; Yin, Y.; Li, Z.; Zhang, W. Gut Microbiota-Derived Components and Metabolites in the Progression of Non-Alcoholic Fatty Liver Disease (NAFLD). Nutrients 2019, 11, 1712. [Google Scholar] [CrossRef]
- Ziętek, M.; Celewicz, Z.; Szczuko, M. Short-Chain Fatty Acids, Maternal Microbiota and Metabolism in Pregnancy. Nutrients 2021, 13, 1244. [Google Scholar] [CrossRef]
- Zhu, L.; Baker, R.D.; Baker, S.S. Gut microbiome and nonalcoholic fatty liver diseases. Pediatr. Res. 2015, 77, 245–251. [Google Scholar] [CrossRef]


Disclaimer/Publisher’s Note: The statements, opinions and data contained in all publications are solely those of the individual author(s) and contributor(s) and not of MDPI and/or the editor(s). MDPI and/or the editor(s) disclaim responsibility for any injury to people or property resulting from any ideas, methods, instructions or products referred to in the content. |
© 2024 by the authors. Licensee MDPI, Basel, Switzerland. This article is an open access article distributed under the terms and conditions of the Creative Commons Attribution (CC BY) license (https://creativecommons.org/licenses/by/4.0/).