Article

Determination of Target Crop Loads for Maximising Fruit Quality and Return Bloom in Several Apple Cultivars

Tasmanian Institute of Agriculture, University of Tasmania, Private Bag 98, Hobart, TAS 7001, Australia
Appl. Biosci. 2023, 2(4), 586-606; https://doi.org/10.3390/applbiosci2040037
Submission received: 17 August 2023 / Revised: 1 October 2023 / Accepted: 19 October 2023 / Published: 1 November 2023
(This article belongs to the Special Issue Feature Papers in Applied Biosciences 2023)

Abstract

:
In apple (Malus domestica), the level and timing of crop load have a major impact on the final fruit size and can also play a role in optimising internal fruit quality. Ideal crop loads vary with cultivar, but very few cultivars have recommended crop load targets that consider the effect of crop load on both return bloom and fruit quality. To address this issue, studies examining a range of crop loads and thinning times were undertaken on several apple cultivars. Return bloom and multiple fruit quality parameters were examined. The results of these studies demonstrate positive effects for early thinning, not only on fruit size but also on firmness and soluble solids content. Early-thinned fruit showed higher sugar levels than late-thinned fruit. Previously undemonstrated positive relationships between fruit sugar content and weight and between fruit firmness and weight in both ‘Fuji’ and ‘Delicious’, as well as between fruit sugar content and fruit firmness in ‘Delicious’, indicate that early thinning is a valuable tool in improving fruit quality. The current target crop load recommendations of 4–6 fruit cm−2 trunk cross-sectional area (TCSA) for ‘Fuji’ and 2–4 fruit cm−2 TCSA for ‘Delicious’ are confirmed by this study. New recommendations are proposed for the other cultivars in this study taking into account the impact of crop load on both fruit quality and return bloom. Both ‘Pink Lady’ and ‘Gala’ can support crop loads of up to eight fruit cm−2 TCSA without impacting return bloom, but fruit quality is compromised; hence, lower targets in the range of 4–6 fruit cm−2 TCSA are recommended. Large fruit size and good return bloom can be maintained in ‘Jonagold’ at crop loads of eight fruit cm−2 TCSA, while crop loads of four fruit cm−2 TCSA are suggested for ‘Braeburn’ to sustain regular bearing and good fruit size.

1. Introduction

In commercial apple production, crop load is managed through the cultural practice of removing (thinning) excess flowers/fruitlets during the flowering and post-bloom periods. While mechanical thinning devices are being developed, chemicals are most often used for thinning; regardless of the thinning method employed, there is normally a need to follow up with hand thinning. This is usually undertaken after the second wave of natural fruit drop that occurs around 8–10 weeks after flowering. Crop load is commonly expressed as the number of fruit per square centimetre of trunk cross-sectional area (fruit cm−2 TCSA) [1]. The effect of crop load on fruit weight and size and on return bloom has been examined in multiple studies [2,3,4,5,6], but there is limited information available on the impact of crop load and time of thinning on other fruit quality attributes, such as fruit shape, skin colour, soluble solids content, and flesh firmness. Fruit soluble solids levels have been reported to be dependent on the leaf/fruit ratio [7]; hence, factors that result in an increase in leaf area and thus increased photosynthesis, such as lower crop loads, will aid in the accumulation of sugars in the fruit. Flesh firmness is determined by the number and size of cells within the cortex, with a large cell size resulting in softer fruit [6] and higher numbers of smaller cells producing firmer fruit [8]. Reducing crop load early in the season before the major period of cell division allows for a greater increase in cell number than later thinning [9].
Most studies relating crop load to fruit quality have involved the use of thinning chemicals as this is the most economical way of reducing crop load. Multiple reports demonstrate that thinning chemicals can also impact fruit quality [10,11,12,13,14,15,16,17], thus clouding the understanding of the impact of reducing crop load on fruit quality. As there are many situations where growers are loath to apply chemicals, particularly on younger trees or high-value cultivars, further examination of the impact of crop load on fruit quality is warranted. In commercial orchards, hand thinning may be undertaken either to complement inadequate chemical (or mechanical) thinning or in preference to the application of chemicals, but it is often not completed until 8–12 weeks after flowering. To investigate the effects of crop load on fruit quality independent of any possible direct influences of chemical thinners, the trials presented in this study examined the effects of the time and level of thinning performed without chemicals on fruit quality for several apple cultivars and, where available, different rootstocks.
The objective of this study was to evaluate the impact of different crop loads and thinning times on both return bloom and fruit quality in several apple cultivars to enable recommendations for ideal crop load targets for each cultivar, on the assumption that different cultivars would respond differently and, thus, the ideal crop load would vary between cultivars.

2. Materials and Methods

Eight trials were undertaken on six different cultivars over a four-year period. All trials were conducted in the Huon Valley, Tasmania (43°07′ S, 147°01′ E) on mature regular bearing trees. Details of cultivar, rootstock, tree age, height, and planting spacings are provided in Table 1.
Trees in all trials were trained to a central axis system. Apart from thinning, all trees were subjected to standard commercial orchard management practices.
In all trials, trees were selected in early spring based on uniformity of size and vigour, trunk girths were measured 10 cm above the graft union, and trunk cross-sectional areas (TCSA) calculated. Blossom clusters were counted on each tree and blossom density (number of blossom clusters cm−2 TCSA) was calculated. Trees were blocked according to blossom density and treatments were allocated at random to single-tree plots within each block.
To confirm that the results were not affected by seasonal conditions, the same design and treatments in trial 1 were repeated the following season in the same orchard block but on different trees (trial 2). Details of full bloom (FB) dates, number of replicates, time of thinning, and crop load level are provided in Table 2.
Crop loads were set by hand thinning and the retention of larger fruit was preferred over small and/or damaged fruit. Where possible, clusters were thinned to a single fruit, but if there was insufficient clusters on the tree to allow this, clusters were thinned to two or three fruit.

2.1. Assessments

2.1.1. Fruit Set Counts

Fruit set counts were completed in each trial in December after natural fruit drop and used to calculate the crop load variable, number of fruit cm−2 TCSA [18].

2.1.2. Fruit Weight and Size

Fruit was harvested by hand at normal commercial harvest time for each cultivar, based on measurements of the maturity indices total soluble solids (TSS) content, starch levels and skin background colour. Fruit from each tree were counted and weighed, and the mean fruit weight was calculated. Fruit was graded on a commercial size grader into increments of 5 mm in diameter ranging from 50 to 95 mm, and the percentage of fruit ≥ 75 mm in diameter was determined for trials 1–5 and 7. As ‘Jonagold’ produce large fruit, the percentage of fruit ≥ 85 mm in diameter was determined for trial 6, while the percentage of fruit ≥ 65 mm in diameter was used for ‘Gala’ in trial 8 as ‘Gala’ are a genetically small apple and the fruit size for this season was small. For laboratory quality assessments, samples of 28 fruit per replicate were collected from the grader by taking seven fruit at random from each of the 60, 65, 70, and 75 mm fruit sizes. These fruit were placed into labelled plastic bags and put into a cold storage room at 0 °C and 90–95% humidity for quality assessments in the laboratory the following day.

2.1.3. Fruit Quality

Fruit was assessed for length (L), diameter (D), TSS, and flesh firmness in all trials. Starch levels and fruit background skin colour were also assessed for ‘Gala’ in trial 8. Fruit shape was determined by measuring the length and diameter of the fruit using a Vernier calliper and calculating L/D ratios. Flesh firmness was measured on pared flesh with a Mecmesin AFG250 force gauge fitted with an Effegi 11 mm penetrometer probe connected to a Mecmesin 2500E motorised stand operating at a speed of 0.65 cm/second. Juice expressed from the apples during the firmness measurements was collected and TSS concentration (°Brix) was assessed with an Atago PR-1 digital refractometer. For the determination of the starch pattern index (SPI), the cut surface of the calyx half of each fruit was dipped in iodine solution (10 g/L iodine and 40 g/L potassium iodide). The area of blue/black colouration was assessed according to the six-point index for the starch-staining pattern as described by Little [19]; the higher the starch index, the lower the percentage of starch present. Fruit background skin colour was measured visually using the scale presented by Frappell and O’Loughlin [20] (Supplementary Table S1).

2.1.4. Return Bloom

Return bloom was determined for all cultivars, except for ‘Fuji’ in trials 1 and 2, by counting blossom clusters on each tree during the spring following treatment and calculating blossom density (number of blossom clusters cm−2 TCSA).

2.2. Data Analysis

Data were subjected to analysis of variance using Genstat release 17.1 (VSN International Ltd., Hemel Hempstead, Hertfordshire, UK). Tests were performed within Genstat to check all data for normality and homogeneity of variance—all data were found to be normally distributed. Linear regressions were undertaken using the Simple Linear Regression option in Genstat.
Data are presented as mean values for each treatment combination. Results described as significant were at a probability level (p) of ≤0.05 and Fisher’s least significant difference (LSD) (p = 0.05), calculated after Steel and Torrie [21], was used for comparison of treatment means.
Regressions were plotted where appropriate to illustrate linear responses to crop load or relationships between measured variables in trials 1, 2, and 3. In all cases, regressions shown are for treatment means and error bars are standard errors of the mean. Graphs were plotted using SigmaPlot 13.0 (Systat Software Inc., Palo Alto, CA, USA).

3. Results

The crop loads obtained in trials 1–3 were relatively close to the target crop loads (Supplementary Table S2). In trial 4, the final crop loads were higher than the target in all but one treatment. The mean crop loads achieved in trials 5–8 were within 0.8 fruit cm−2 TCSA of the target, with the exception of the 6 wAFB treatment in trial 8 where crop loads were higher.

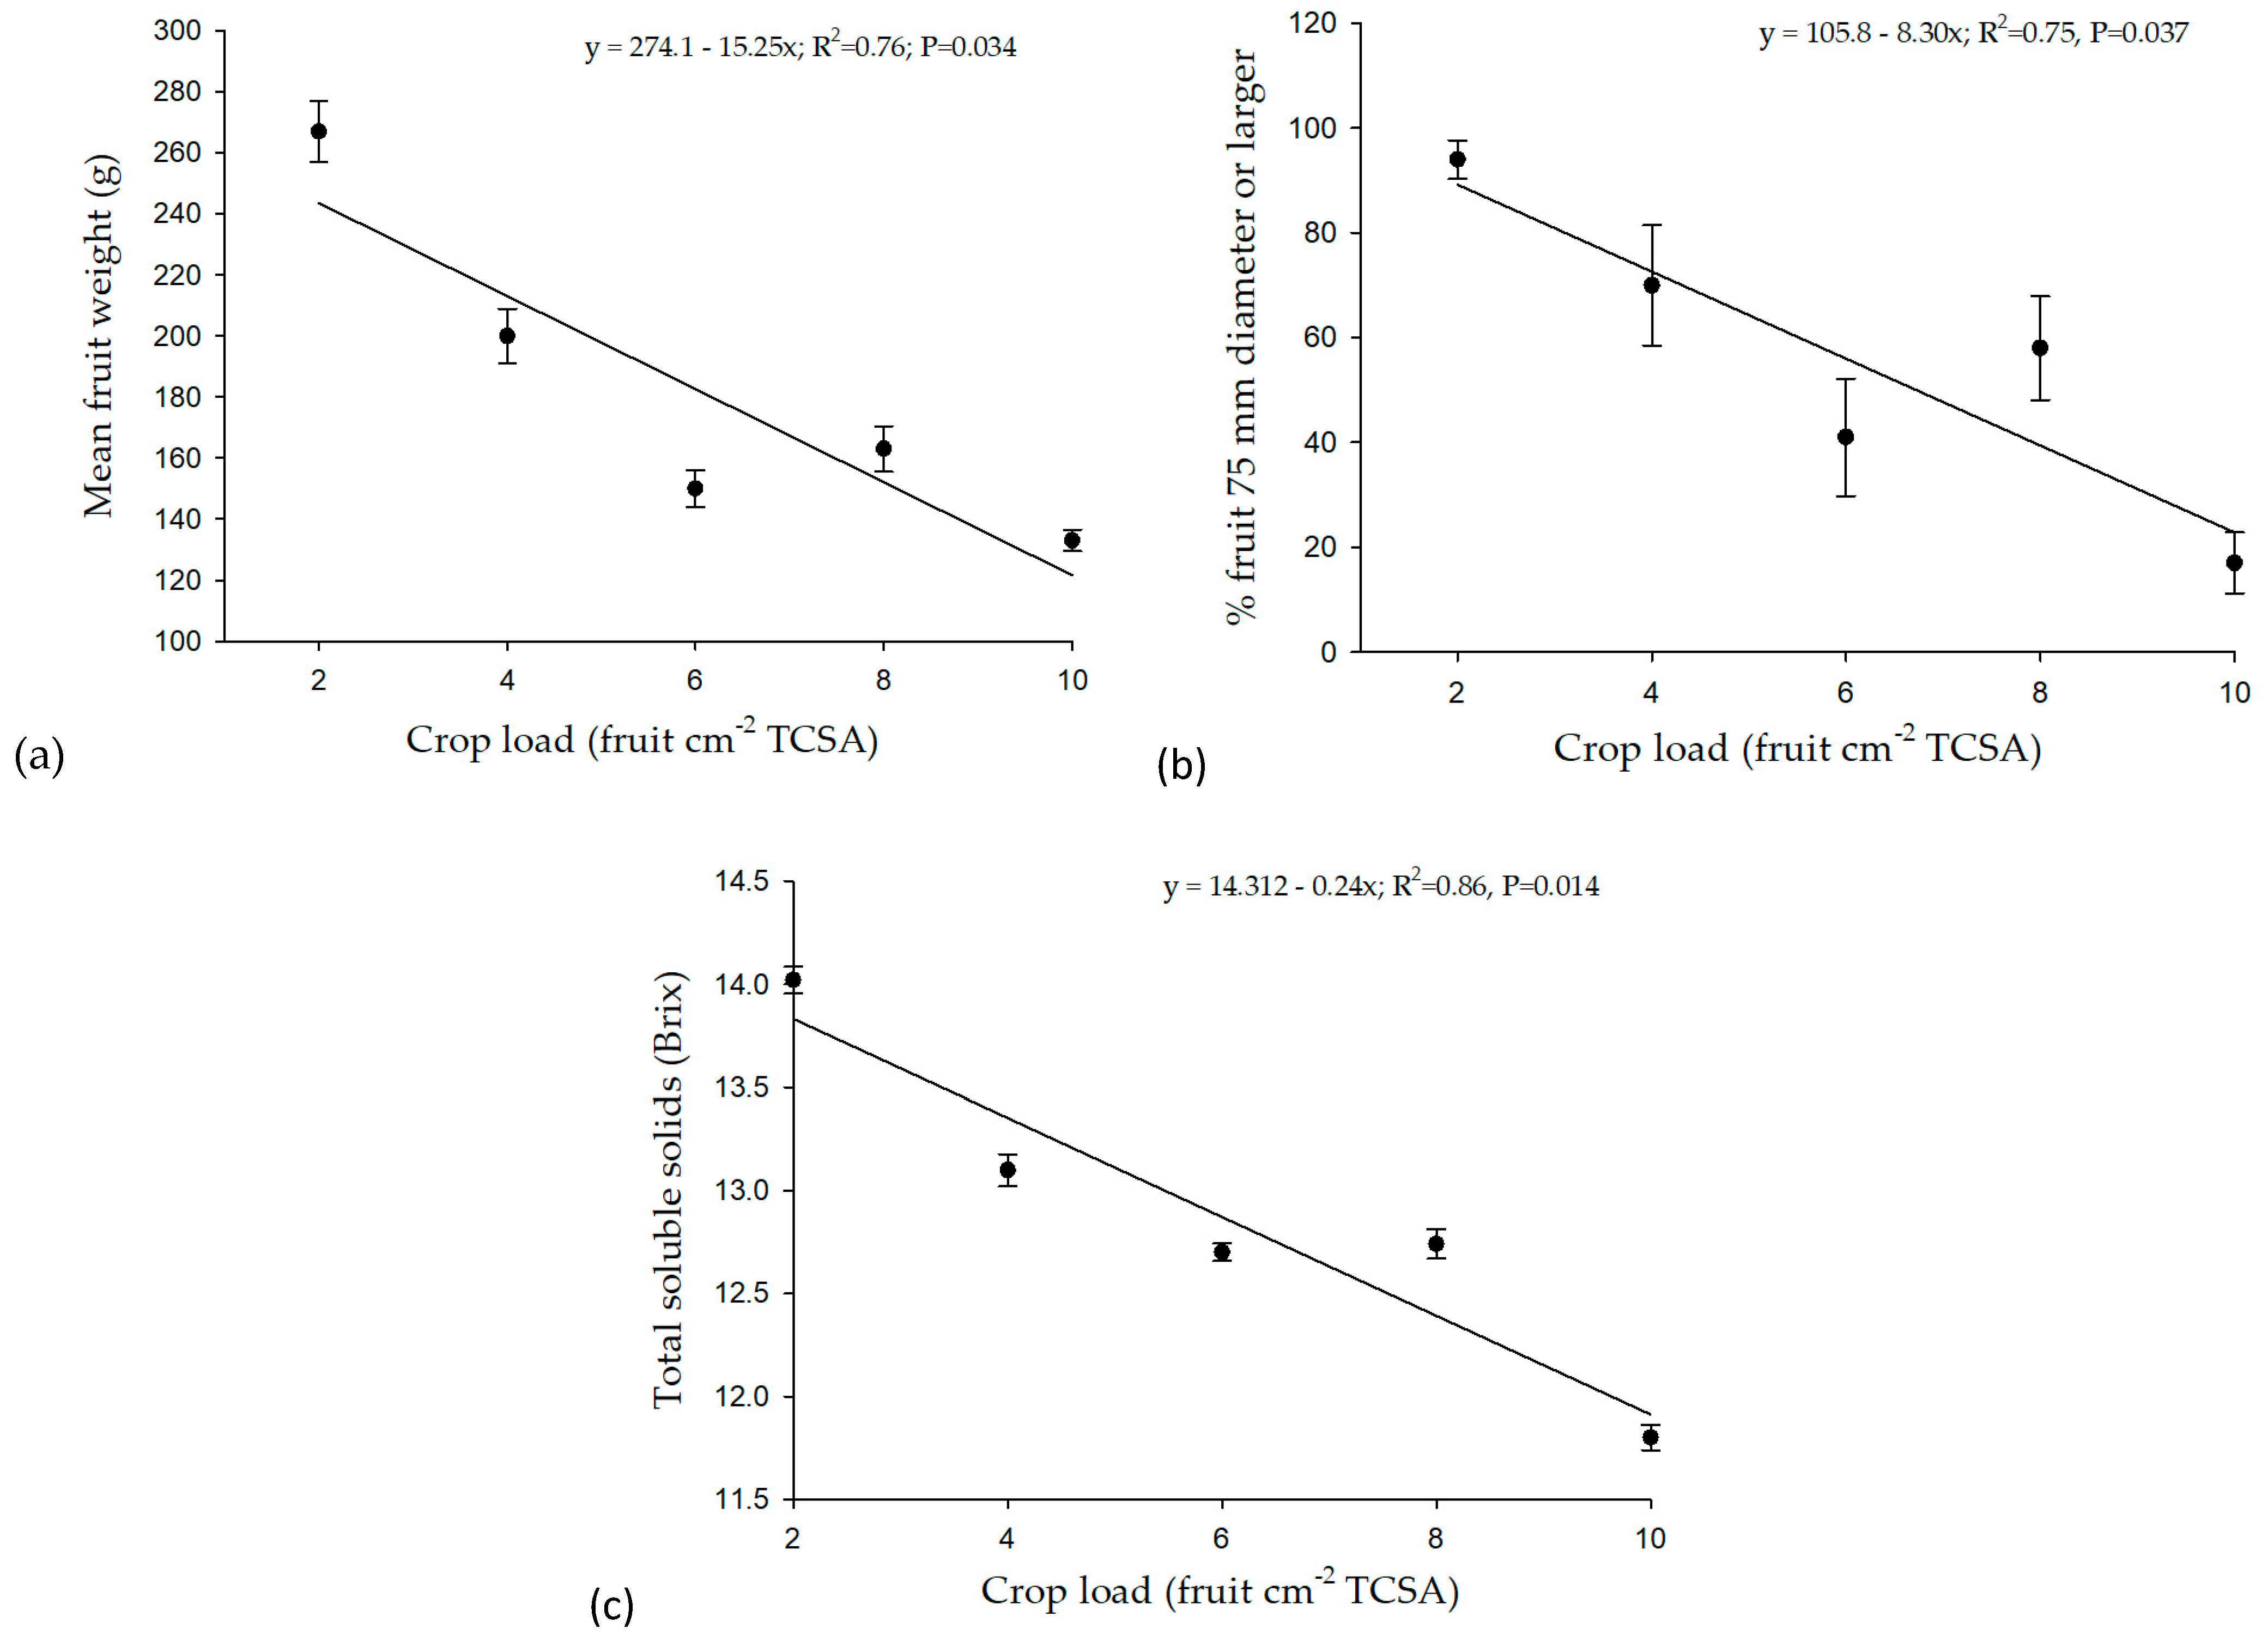
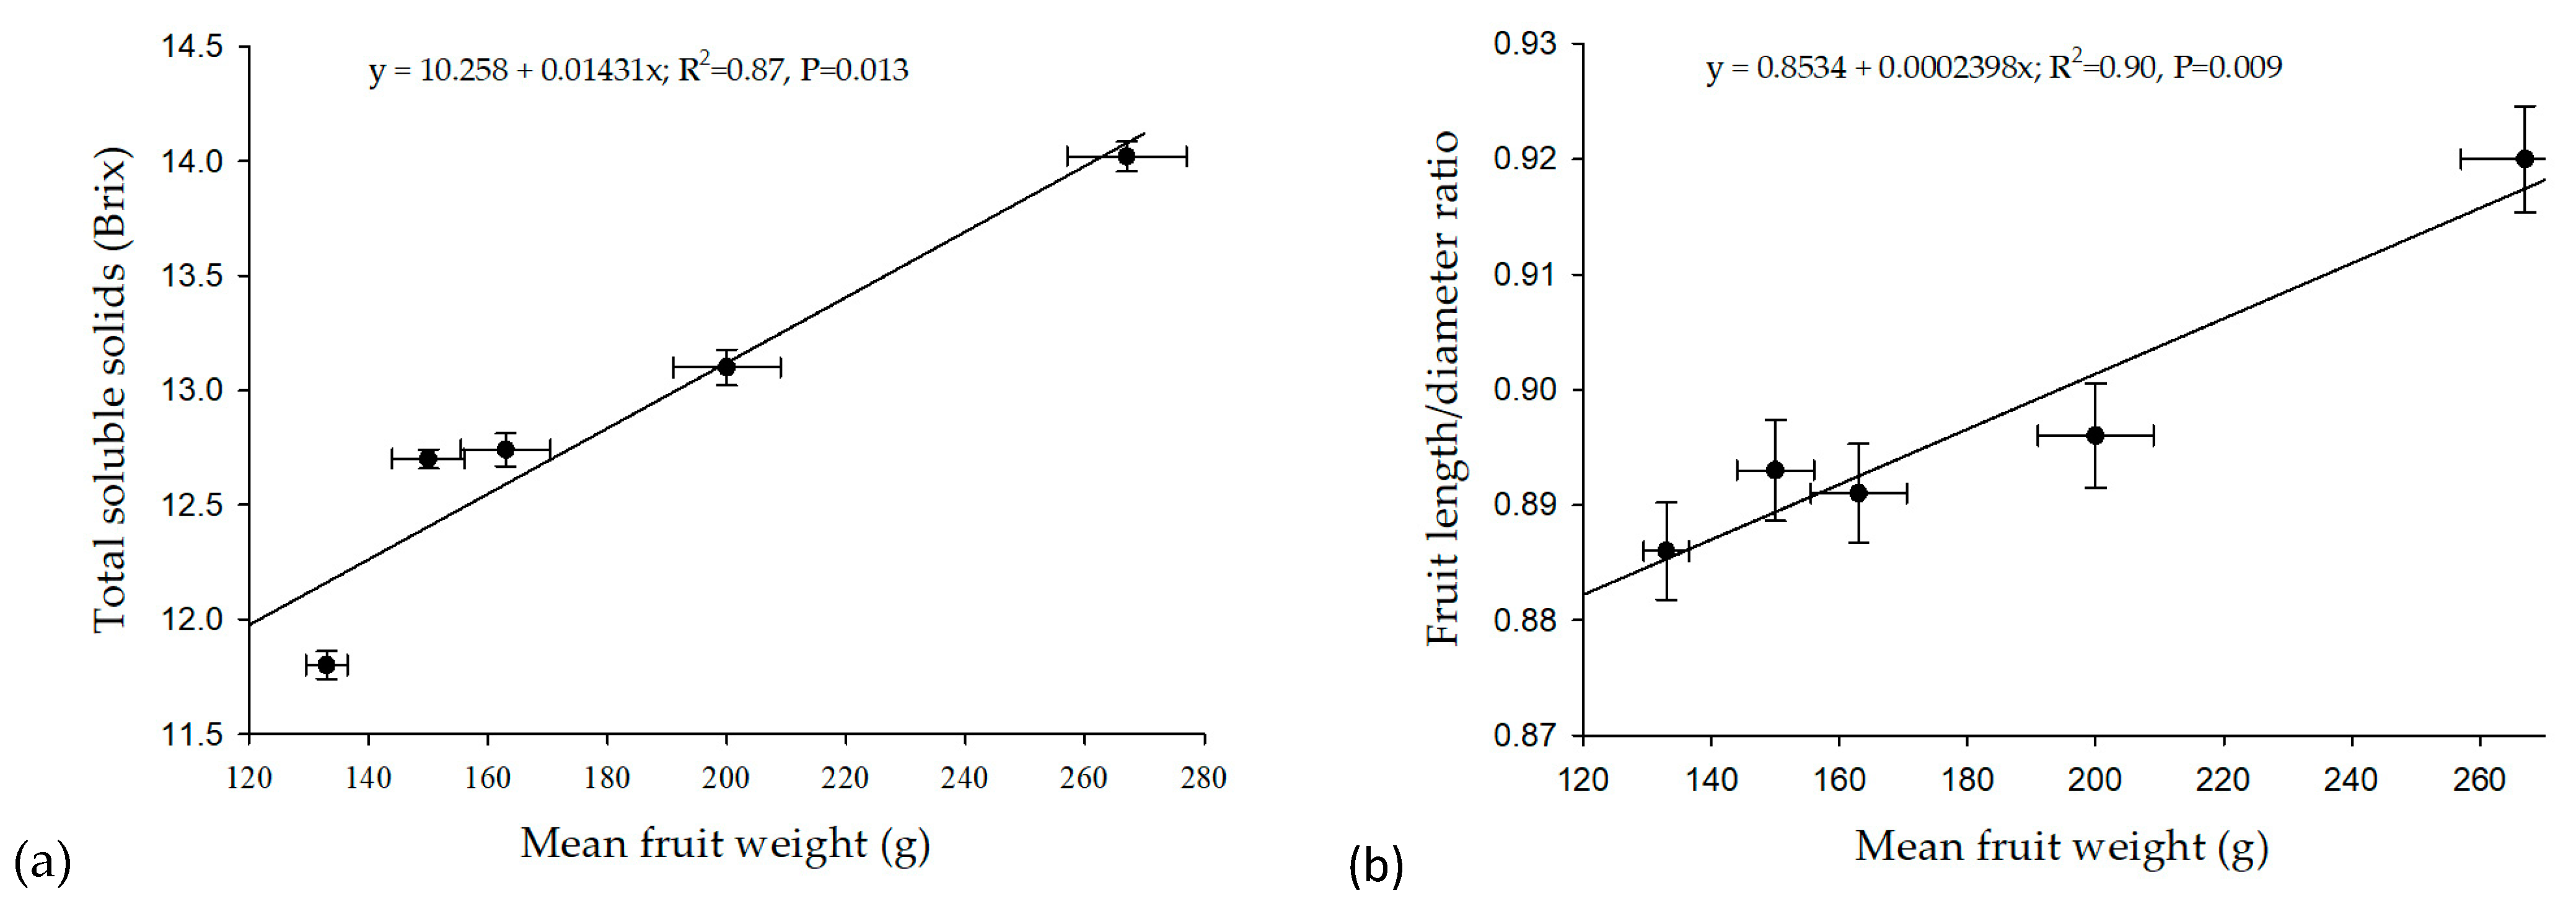
3.1. Trial 1: ‘Fuji’

A significant linear regression (R2 = 0.76) was observed between crop load and mean fruit weight (Figure 1a), with a reduction of 15.25 g for every unit increase in crop load. The regressions between fruit size, represented as percentage of fruit ≥ 75 mm in diameter, and crop load (Figure 1b), as well as between fruit TSS and crop load (Figure 1c), were also significant (R2 = 0.75 and 0.86, respectively).
Fruit with a significantly higher L/D ratio were produced at a crop load of two fruit cm−2 TCSA compared to other treatments, but there was no significant difference in the L/D ratio between higher crop loads (Table 3).
There was a significant regression between mean fruit weight and fruit sugar content (Figure 2a) and between mean fruit weight and fruit shape, represented by the fruit L/D ratio (Figure 2b) (R2 = 0.87 and 0.90, respectively).

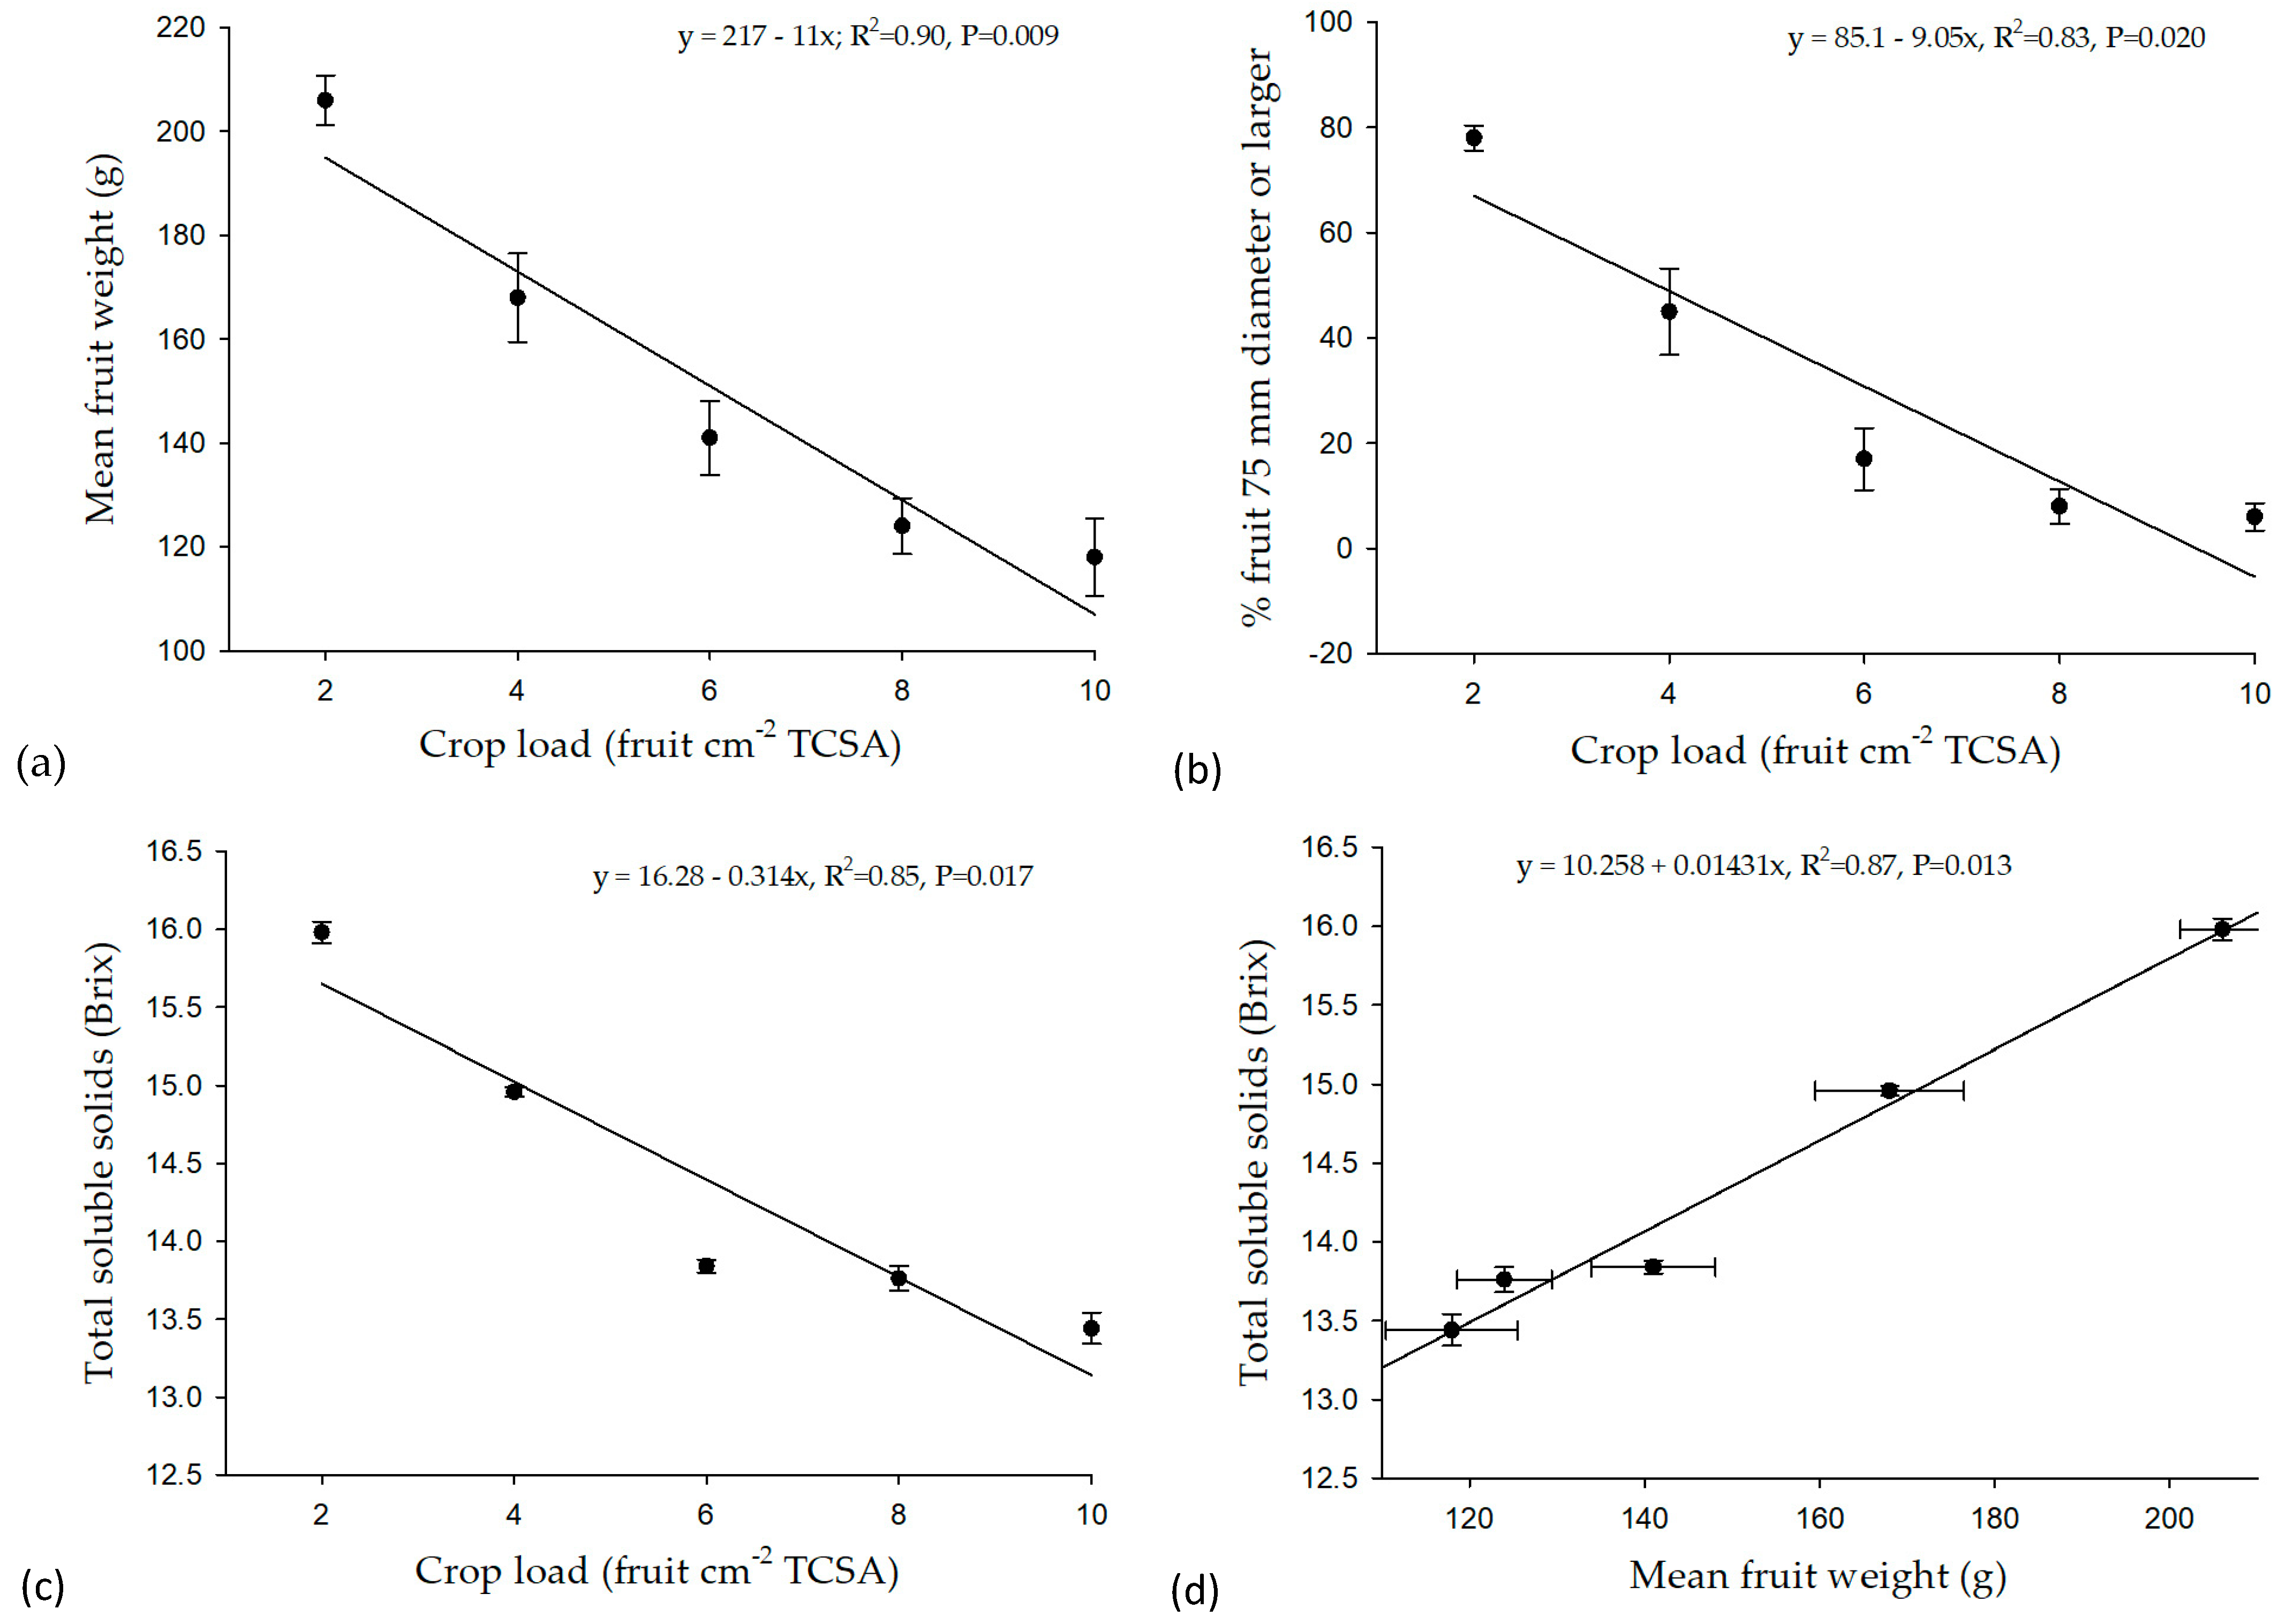
3.2. Trial 2: ‘Fuji’

As with trial 1, in trial 2, there was a significant linear regression between crop load and mean fruit weight (Figure 3a), with a reduction of 11 g for every unit increase in crop load (R2 = 0.90). There was also an inverse correlation between crop load and percentage of fruit ≥ 75 mm in diameter (Figure 3b) and a significant linear regression between crop load and fruit TSS (Figure 3c) (R2 = 0.83 and 0.85 respectively).
There was a significant linear regression between fruit weight and fruit sugar content (Figure 3d), with an increase of 0.014 °Brix for every gram increase in fruit weight (R2 = 0.87).
The fruit L/D ratio was highest at the two lower crop loads of two and four fruit cm−2 TCSA (Table 4).
Trees with a crop load of two fruit cm−2 TCSA produced significantly firmer fruit compared to heavier crop loads. Fruit was significantly softer in trees with a crop load of 10 fruit cm−2 TCSA than in trees with crop loads of 6 or 8 fruit cm−2 TCSA.

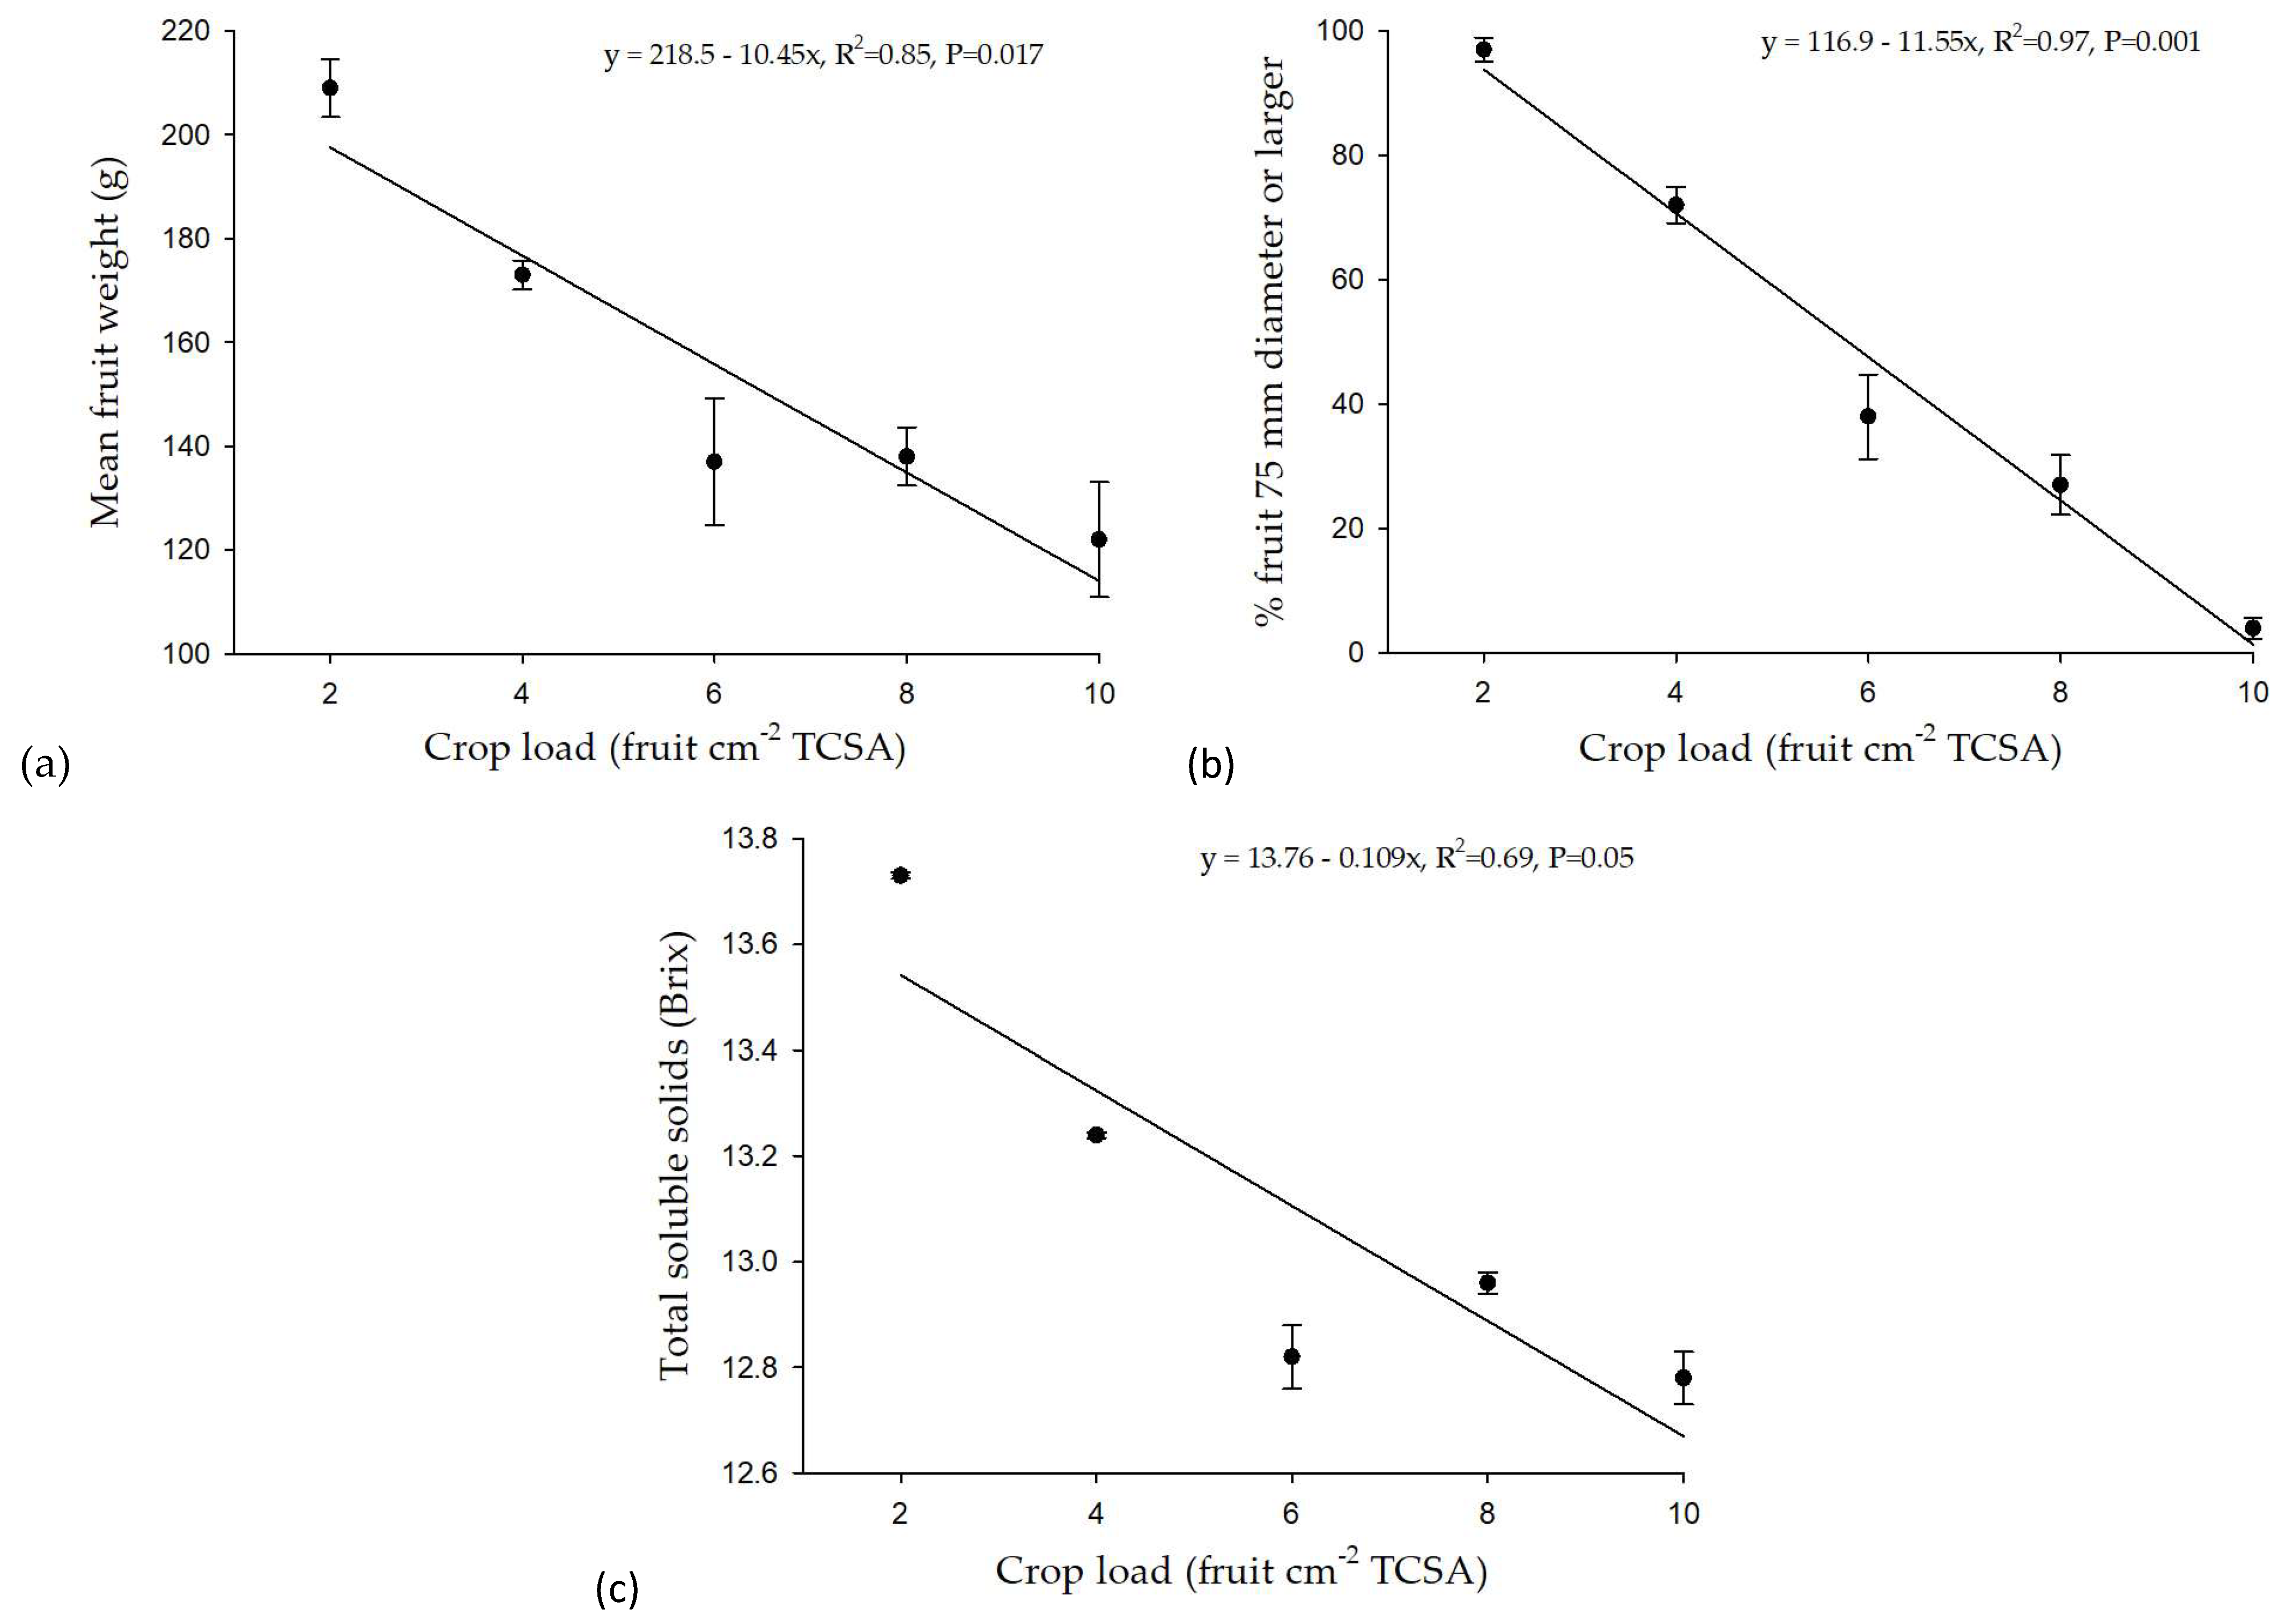
3.3. Trial 3: ‘Delicious’

As for ‘Fuji’, there was a significant negative linear regression between crop load and fruit weight (R2 = 0.85), with a reduction of 10.45 g for every unit increase in crop load (Figure 4a), and between crop load and fruit size (Figure 4b) (R2 = 0.97).
A significant negative regression was observed between fruit TSS and crop load (Figure 4c), with a reduction of 0.109 °Brix for every unit increase in crop load (R2 = 0.69).
Fruit flesh firmness decreased with increasing crop load from two to six fruit cm−2 TCSA (Table 5). Increasing crop load had no significant effect on the fruit L/D ratio.
There was a significant positive linear regression between fruit weight and fruit sugar content (Figure 5a), between fruit weight and flesh firmness (Figure 5b), and between fruit sugar content and firmness (Figure 6) (R2 = 0.97, 0.90 and 0.98, respectively).

3.4. Trial 4: ‘Delicious’

There were no significant interactions between crop load and time of thinning for mean fruit weight and return bloom (results not presented), but there were significant interactions for other parameters (Table 6).
Fruit size (% fruit ≥ 75 mm in diameter) was significantly higher at a crop load of three fruit cm−2 TCSA than at six fruit cm−2 TCSA at all thinning times, with the exception of 1 wAFB (Table 7). The treatments that produced the highest number of fruit ≥ 75 mm in diameter were the two 1 wAFB treatments and three fruit cm−2 TCSA thinned 2 or 4 wAFB.
The fruit L/D ratio was significantly lower in the three fruit cm−2 TCSA treatment at 1 wAFB than the higher crop load (Table 7). At 8 and 12 wAFB, the fruit L/D ratio was significantly lower at the higher crop load than the lower crop load.
Fruit TSS was significantly lower at the higher crop load compared with the lower crop load at all thinning times, except for 2 wAFB. At all thinning times, except for 8 wAFB, fruit firmness was significantly higher at three fruit cm−2 TCSA than at six fruit cm−2 TCSA. Trees thinned 16 wAFB produced significantly firmer fruit than all other treatments.
Mean fruit weight was significantly higher at three fruit cm−2 TCSA than at six fruit cm−2 TCSA (Table 7). The time of thinning also influenced mean fruit weight, with the later thinning times of 8, 12, or 16 wAFB producing significantly smaller fruit than the trees thinned 1 wAFB (Table 7). Crop load had no significant effect on return bloom (Table 7). The time of thinning showed a significant effect, with thinning at or later than 8 wAFB resulting in a lower return bloom than earlier thinning.

3.5. Trial 5: ‘Pink Lady’

No interactions were observed between crop load, time of thinning, and rootstock for mean fruit weight, size, or return bloom (results not presented). All three factors had a significant effect on both mean fruit weight and percentage of fruit ≥ 75 mm in diameter, while rootstock and time of thinning, but not crop load, had a significant effect on return bloom (Table 8).
Trees on M26 rootstock produced significantly heavier fruit than those on MM106 (Table 8). Fruit weight was significantly reduced at crop loads of eight fruit cm−2 TCSA compared with lower crop loads, while trees thinned at 10 and 14 wAFB produced significantly lighter fruit than earlier-thinned trees (Table 8). Similar patterns were observed in the percentage of fruit ≥ 75 mm in diameter for all three factors. Return bloom was significantly higher in trees on M26 rootstock than on MM106. Crop load had no significant effect on return bloom, but earlier thinning (2 or 6 wAFB) resulted in a higher return bloom than later thinning times.
Significant interactions were observed between the thinning treatments for fruit L/D ratio, TSS and firmness (Table 9). Although there were significant differences between treatments in the L/D ratio, the results showed no clear pattern with no consistent effects of rootstock, crop load or time of thinning.
Fruit TSS decreased with increasing crop load on M26 rootstocks on trees thinned 2 wAFB, and on MM106 rootstocks thinned at 6 wAFB. TSS levels were significantly higher on M26 rootstocks than in the corresponding MM106 treatments.
Fruit firmness was significantly higher in the four and six fruit cm−2 TCSA 6 wAFB treatments on M26 than all other treatments. Increasing crop load resulted in a decrease in firmness at all thinning times on M26 rootstocks, but there were no distinct trends for MM106 stocks. Firmness was significantly higher on M26 rootstocks than in the corresponding MM106 rootstocks, except for the eight fruit cm−2 TCSA 2 and 6 wAFB treatments.

3.6. Trial 6: ‘Jonagold’

There were no interactive effects between crop load, time of thinning and rootstock for mean fruit weight (p = 0.315), size (p = 0.269) or return bloom (p = 0.198) (results not presented). However, analysis of the main effects showed that mean fruit weight was influenced by crop load and time of thinning, percentage of fruit ≥ 85 mm in diameter was affected only by the crop load, and return bloom was affected by rootstock but not by crop load or time of thinning (Table 10).
Mean fruit weight decreased significantly with increasing crop load (Table 10). Thinning at 2 and 6 wAFB produced heavier fruit than later thinning. The percentage of fruit ≥ 85 mm in diameter was significantly higher at the lower crop load compared with the two higher crop loads.
Return bloom was influenced by rootstock, with trees on MM106 rootstocks having a significantly higher return bloom than trees on M26 rootstocks.
Although the interactions between thinning treatments were significant for the fruit L/D ratio, no distinct trends were discernible (Table 11). On the M26 rootstocks, TSS levels decreased significantly with increasing crop load on trees thinned 6 and 14 wAFB, and at 2 and 14 wAFB on MM106 rootstocks.

3.7. Trial 7: ‘Braeburn’

There were no significant interactions between crop load, time of thinning and rootstock for mean fruit weight (p = 0.732), fruit size (p = 0.237), return bloom (p = 0.568) or fruit L/D ratio (p = 0.076) (results not presented). Analysis of the main effects showed that the mean fruit weight, percentage of fruit ≥ 75 mm in diameter, return bloom and fruit shape (L/D ratio) were all influenced by rootstock and crop load but not by time of thinning (Table 12).
The fruit from M26 rootstocks was significantly heavier than those from MM106 rootstocks (Table 12), while increasing crop load from 2 to 6 fruit cm−2 TCSA resulted in lower fruit weight (Table 12(ii)). M26 rootstocks produced significantly more fruit ≥ 75 mm in diameter than MM106 rootstocks. There was no difference between two and four fruit cm−2 TCSA in the percentage of fruit ≥ 75 mm in diameter, but increasing the crop load from four to eight fruit cm−2 TCSA resulted in a decrease in fruit ≥ 75 mm in diameter.
Return bloom was significantly higher on M26 rootstocks compared to MM106 rootstocks. Return bloom was reduced significantly with increasing crop load from two to six fruit cm−2 TCSA. MM106 rootstocks produced fruit with a significantly higher L/D ratio than the M26 rootstocks. Increasing crop load from two to six fruit cm−2 TCSA resulted in a significant reduction in L/D ratio. Time of thinning had no effect on fruit weight, size, or shape, or on return bloom (results not presented).
The treatment interactions were significant for fruit TSS (Table 13). The level of TSS decreased with increasing crop load for the M26 rootstocks at all thinning times, but no distinct pattern emerged for the MM106 rootstocks.

3.8. Trial 8: ‘Gala’

There were significant interactions between treatments for all the parameters assessed in ‘Gala’ (Table 14 and Table 15).
At 2 and 6 wAFB, mean fruit weight was significantly higher with crop loads of three or six fruit cm−2 TCSA than with nine fruit cm−2 TCSA (Table 14). At 10 wAFB, a crop load of three fruit cm−2 TCSA produced significantly heavier fruit than crop loads of either six or nine fruit cm−2 TCSA. There was no significant difference in mean fruit weight between the different crop loads at 14 wAFB.
Fruit size (the percentage of fruit ≥ 65 mm in diameter) was significantly larger in the early-thinned lowest crop load trees than any other treatment. At 2 wAFB, there was a significant reduction in fruit size with increasing crop load.
Crop load had no significant effect on fruit shape (L/D ratio) at the earliest thinning time. However, the lightest crop load resulted in higher L/D ratios than the heaviest crop loads. Return bloom was significantly higher at the lowest crop load than the other treatments at 2, 6 and 10 wAFB.
Reducing crop load to three fruit cm−2 TCSA produced fruit with the highest TSS compared with other treatments for the two earlier times (Table 15). TSS levels decreased significantly from three to six fruit cm−2 TCSA at all thinning times except for 14 wAFB. Fruit firmness was significantly lower in fruit thinned 2 wAFB than later-thinned fruit.
The starch levels were lower in the early thinned trees with the lowest crop load, but this pattern was reversed at 6 and 14 wAFB. The general trend was for starch levels to be higher with later thinning.
There were significant differences between treatments in fruit background skin colour, with fruit from the highest crop load treatments at 2, 6 and 10 wAFB being greener than the two lighter crop loads at these times.

4. Discussion

The trials reported here demonstrate that both crop load and time of thinning play an important role in determining external and internal fruit quality parameters at harvest; however, between cultivars, there were differences in the optimum crop load and effect of thinning time.
Similar trends were observed in the two ‘Fuji’ trials conducted in consecutive years, but there were marked differences in the actual figures obtained for each parameter studied. This suggests that while crop load has a major influence, climatic differences between years (Supplementary Data, Figures S1–S5) can result in a shift in actual values obtained, most likely through variations in the date and spread of flowering, pollination, and early growth of fruit.

4.1. Fruit Weight and Size

The reduction in fruit weight with increasing crop load observed with all cultivars in this study is in line with the observation by Costa et al. [22] that there is an inverse relationship between the final fruit size and number of fruit per tree. For ‘Fuji’, weight reductions of 15.25 g and 11.00 g were observed for every unit increase in crop load in consecutive years, and for ‘Delicious’, the reduction was 10.45 g.
Weights of 200 g per fruit were achieved at crop loads of four fruit cm−2 TCSA in ‘Fuji’ in trial 1; however, in the following year, this fruit weight was only achieved at the lower crop load level of two fruit cm−2 TCSA. Jones et al. [6] suggested that weights of 200 g per fruit were readily achievable with crop loads of 4–6 fruit cm−2 TCSA; however, they also recommended thinning at blossom time rather than post-bloom. Setting target crop loads of 5–7 fruit cm−2 TCSA, Bound et al. [15] obtained fruit weights of around 200 g per apple with more than 40% of the fruit larger than 80 mm in diameter following chemical thinning with ethephon and BA within 3 weeks of FB. However, BA has been demonstrated to increase fruit size even in the absence of any thinning [23,24]. The lower weights achieved in this study at four or six fruit cm−2 TCSA are most likely the result of delaying thinning to 6 weeks after flowering, leading to a loss of fruit size through competition with fruit that was later removed. According to Jones et al. [6], delaying thinning can result in a loss of as much as 10 g per fruit for every week’s delay in thinning. Koike et al. [25] concluded that the primary thinning of ‘Fuji’ should be performed within 28 dAFB to ensure a good fruit size. For ‘Fuji’, crop loads of 4–6 fruit cm−2 TCSA are considered appropriate to avoid biennial bearing [1], and this study showed that large fruit of 200 g or more can be produced at these crop load levels, but if thinning is delayed, the crop load should be reduced in order to maximise the fruit size.
In ‘Delicious’, weights of at least 150 g per fruit were achieved at crop loads of 2–4 fruit cm−2 TCSA. However, crop loads of 6–10 fruit cm−2 TCSA produced fruit weights in the order of 125–145 g. These results confirm the conclusions of Koen et al. [26] that 2–4 fruit cm−2 TCSA is an ideal target range crop load for ‘Delicious’.
Recommendations for target crop loads for ‘Pink Lady’, ‘Jonagold’, ‘Braeburn’ and ‘Gala’ are lacking. Data from this study suggest that in both ‘Pink Lady’ and ‘Gala’, fruit weight and size start to decline with crop loads greater than six fruit cm−2 TCSA. However, in large-fruited cultivars such as ‘Jonagold’, crop loads of eight fruit cm−2 TCSA will still produce fruit of 200 g or heavier without affecting return bloom. A good fruit weight and size were achieved in ‘Braeburn’ at crop loads of up to eight fruit cm−2 TCSA; however, return bloom was reduced by increasing the crop load. Hence, the desire for large fruit should be carefully considered against the risk of pushing trees into biennial bearing.
Fruit weight and size were also heavily influenced by time of thinning, confirming the postulation by Link [27] that the supply of carbon available to the fruit may be limited by competition from other fruits; hence, a marked influence of time of thinning on fruit size would be expected.
The results of this study support the conclusion of Jones et al. [6] and McArtney et al. [28] that earlier thinning can result in considerable increase in fruit weight. Working with the cultivar ‘Empire’, Lakso et al. [29] concluded that effective hand thinning for size increases could be performed as late as 20 dAFB, but earlier application of the chemical thinning agents NAA, BA and carbaryl at 15 dAFB inhibited fruit growth too much to allow maximum response to crop reduction. This finding reinforces the negative impact that thinning chemicals can have on fruit quality, despite thinning relatively early in the season. In a comparison of hand thinning at 5 weeks AFB with artificial bud extinction (ABE), a thinning practice that reduces the number of floral buds prior to bud burst, at similar crop loads on the cultivar ‘Scilate’, Sidhu et al. [30] reported increased fruit weights of up to 70 g per fruit in ABE-managed trees, again demonstrating the importance of earlier removal of excess floral buds to reduce competition for, and wastage of, carbohydrate resources. This also agrees with the conclusions of Robinson et al. [31]: that leaving too many floral buds when pruning results in a lower crop value than pruning to the optimum bud load. High fruit weights can be achieved for most cultivars at relatively high crop loads if thinning is completed early in the season, preferably before or during flowering. If thinning is delayed, crop loads need to be reduced in order to achieve these weights, resulting in reduced yield, which is a function of the number and size of the fruit on the tree.
Rootstocks affect apple fruit quality by influencing both tree vigour and crop load. At similar crop loads, trees on M26 rootstocks in this study produced larger, heavier fruit than on the more vigorous MM106 rootstocks for both ‘Pink Lady’ and ‘Braeburn’, but there was no rootstock effect on the triploid cultivar ‘Jonagold’. The increased fruit size on the weaker M26 rootstock conflicts with the findings of Fallahi and Simons [32] and Riesen and Husistein [33]. However, these authors were comparing a range of dwarfing rootstocks and did not include any semi-vigorous or vigorous rootstocks in their studies.

4.2. Fruit Shape

In this study, fruit shape was influenced by thinning in some cultivars but not others. In those cultivars where there was an effect, higher crop loads generally produced flatter fruit. This is in agreement with the conclusions of Link [27] that thinning normally favours fruit development. However, it appears from the present study that fruit shape may also be influenced by the time of thinning in some cultivars, particularly ‘Delicious’, where thinning close to bloom reversed this trend towards flatter fruit. From a marketing perspective, fruit shape and typiness are important attributes in ‘Delicious’ and management practices that flatten the fruit impact on marketability [34,35].

4.3. Total Soluble Solids

For most cultivars, fruit soluble solids content decreased with increasing crop load. This is in agreement with the findings of Koike et al. [25] who reported a 14% increase in sugar levels in ‘Fuji’ fruit from hand-thinned trees compared with unthinned trees. A similar effect was also observed for hand-thinned ‘Cox’s Orange Pippin’ [36]. In the ‘Fuji’ and ‘Delicious’ trials that were thinned at 6 wAFB, the positive correlation between sugar content and fruit weight suggests that early thinning can maintain fruit sugar levels in larger fruit.
A rootstock effect was observed in ‘Pink Lady’, with lower soluble solids on the more vigorous MM106 rootstocks. Fallahi and Simons [32] also reported that soluble solids at harvest were lower in fruit from trees on M26 rootstocks compared with the more dwarfing M27 and M9 rootstocks. These trends suggest that the rootstock effect may be related to tree vigour, with higher soluble solids in less vigorous trees. This leads to the assumption that less assimilate is used for vegetative growth in the more dwarfing trees. It is important to note, however, that this trend was reversed in the triploid cultivar ‘Jonagold’, with TSS levels higher on MM106 rootstocks than on M26.

4.4. Firmness

While this study did not include fruit firmness results for ‘Braeburn’ and ‘Jonagold’ due to equipment breakdown, fruit firmness in the cultivars ‘Fuji’, ‘Delicious’ and ‘Pink Lady’ decreased with increasing crop load, supporting the results of Garriz et al. [37], who found that fruit flesh firmness was significantly lower in ‘Braeburn’ trees carrying high crop loads than in trees with moderate or low crop loads. Jones et al. [38] also reported increased firmness with reduced crop load following chemical thinning of ‘Pink Lady’ and ‘Jonagold’ with ethephon and BA. Link [27] suggested that the reduced firmness often observed in heavily cropped trees could be due to carbohydrate supply for cell wall synthesis becoming limited. In this study, ‘Gala’ showed no clear trends relating firmness to crop load, but there was an effect with time of thinning, with thinning close to bloom producing softer fruit than trees thinned from 6 weeks after bloom. A possible explanation for this result is that early thinning causes fruit to mature earlier than later thinning, as noted by Johnson [36]—the increased soluble solids observed in early-thinned fruit also lends support to this explanation.
An unanticipated finding from this work was the positive relationship in both ‘Fuji’ and ‘Delicious’ between fruit firmness and mean fruit weight, and between sugar content and firmness in early-thinned fruit. This study provides evidence that early thinning has a major role to play in fruit quality considerations. Previous correlations of fruit softness and high TSS in large fruit are based on concepts of the contrast between vigorously growing off-year trees compared with less vigorous on-year trees in a biennial bearing cycle. The leaf/fruit ratio in off-year trees is higher than in on-year trees, as off-year trees tend to be more vigorous [39]. Hence, more resources are available to each fruit in off-year trees, enabling a greater expansion of cells, regardless of cell number, potentially resulting in larger cell size with larger intercellular spaces, and consequently, softer fruit. In this study, early-thinned regular bearing trees produced large fruit that were firmer and with higher TSS than later-thinned fruit. Not only does this finding conflict with current thoughts on firmness, sugar content and fruit size, but it demonstrates additional advantages for early thinning beyond fruit size. However, caution may be needed with early thinning in areas prone to late spring frosts. These results also show that large fruit can be of better quality than small fruit, providing it is from regular bearing or on-year trees where the excess fruit was thinned early.
Rootstock influenced fruit firmness in ‘Pink Lady’. While no relationship was observed between firmness and crop load on MM106 rootstocks, M26 rootstocks produced firmer fruit than did MM106. Differences in firmness for ‘Arlet’ and ‘Fiesta’ fruit from trees with different rootstocks were also observed by Riesen and Husistein [33]. These authors suggested that the softer fruit, which also had higher sugar levels, were the result of advanced fruit maturity on some rootstocks. While this is a logical conclusion, ‘Pink Lady’ in this study produced softer fruit with a lower sugar content on MM106 rootstocks. As these fruits were also smaller than fruit from M26 rootstocks, this result is difficult to explain, as the expectation would be that fruit from MM106 rootstocks should be firmer. If fruit from MM106 rootstocks contained fewer and larger cells that those from M26 rootstocks, this would explain the difference in fruit firmness between the two rootstocks.

4.5. Starch and Background Skin Colour

Starch levels were examined in only one cultivar, ‘Gala’. The increase in starch hydrolysis with increasing crop load at the earliest thinning time of 2 wAFB in this study agrees with the findings of Sidhu et al. [30], who reported slower conversion of starch to sugar at higher crop loads in the cultivar ‘Scilate’. This slower conversion of starch to sugar combined with a greener skin colour with increasing crop load observed in this study, and as also observed by Sidhu et al. [30], indicate a retardation of fruit maturity at higher crop loads. Serra et al. [40] also reported that crop load can affect fruit maturity, with advanced fruit ripeness in low-crop-load trees.
However, time of thinning did influence starch levels, with earlier thinning resulting in lower starch levels, indicating increased hydrolysis of starch to sugar. This is most likely associated with fruit maturity, particularly when examined in conjunction with fruit soluble solids content, as earlier-thinned fruit also had higher soluble solids than later-thinned fruit. Johnson [36] suggested that early thinning can advance fruit maturity by up to 16 days.

4.6. Return Bloom

The effect of crop load and time of thinning on return bloom varied between cultivars. In ‘Delicious’, ‘Gala’, ‘Pink Lady’ and ‘Jonagold’, return bloom reduced once a particular level of cropping was reached, while in ‘Braeburn’, return bloom decreased with increasing crop load. These results demonstrate that different cultivars have different crop load thresholds and suggest that, if regular bearing is to be maintained, ‘Braeburn’ should not be cropped at levels higher than four fruit cm−2 TCSA, while both ‘Pink Lady’ and ‘Jonagold’ can maintain crop loads of at least eight fruit cm−2 TCSA. However, other factors such as fruit size should also be borne in mind if trees are to be cropped at these levels.
Time of thinning had no influence on return bloom in ‘Braeburn’ or ‘Jonagold’, but was important in the three cultivars ‘Delicious’, ‘Pink Lady’ and ‘Gala’, with thinning later than 6 weeks after bloom reducing return bloom. Although return bloom was not assessed on ‘Fuji’ in this study, Jones et al. [6] reported a decline in return bloom at 8 weeks after bloom, and Koike et al. [25] demonstrated the importance of thinning before 4 wAFB to ensure the return bloom of ‘Fuji’.
Williams and Edgerton [41] noted that the two factors of greatest influence on annual bearing, and thus return bloom, are the number of flowering spurs and the amount of initial fruit set. These authors suggest that, for thinning to be most effective, all fruit should be removed from about half of the fruiting spurs rather than reducing the fruit load to one fruit per spur. According to Costa et al. [22], fruit thinning performed after fruit set is normally ineffective in eliminating biennial bearing, but fruit thinning performed before fruit set may prevent or overcome biennial bearing. The importance of time of thinning on return bloom is reinforced by studies on the impact of artificial bud extinction (ABE). In a study of ABE on Fiero ‘Fuji’ and three strains of ‘Gala’, Bound [42] reported that ABE-managed trees showed no signs of biennial bearing, with sufficient return bloom to set a crop load of six fruit cm−2 limb cross-sectional area based on a single fruit per bud, unlike the conventional trees in which bud numbers varied between seasons. Breen et al. [43] found that as floral bud density was reduced, the proportion of buds failing to set fruit declined and the proportion setting multiple fruit increased, concluding that the early removal of competitive sinks through thinning improves the initiation and development of new floral buds, thus improving return bloom. This information, combined with the results of this study, shows the importance of reducing crop load early in the season.
In the three cultivars where rootstock effects were also examined, rootstock had an influence on return bloom. In both ‘Pink Lady’ and ‘Braeburn’ return bloom was tripled on trees with M26 rootstocks compared with the more vigorous MM106 rootstocks. However, the effect was reversed for ‘Jonagold’, with MM106 rootstocks producing twice as much return bloom as M26 rootstocks. While it is difficult to find an explanation for this differing effect of rootstock on ‘Jonagold’, its triploid genetic make-up may be one reason why this cultivar behaves differently to most other cultivars.

5. Conclusions

Optimum crop loads vary with cultivar, but large fruit can be obtained at higher crop loads by thinning during flowering or the early phase of fruit development, regardless of the method of thinning, whether by hand, chemical or mechanical. Seasonal weather patterns during early spring should be considered when determining final crop loads as climatic differences between years can also impact on fruit size and quality.
Early thinning also had a positive effect on fruit quality. Fruit sugar levels were higher in early-thinned fruit than in late-thinned fruit. The positive relationship demonstrated between fruit firmness and weight and between fruit firmness and sugar content with early thinning illustrate additional advantages for early thinning beyond those already established in relation to fruit size. Large fruit can be of better quality than small fruit, providing that it is from regular bearing early-thinned trees. While caution may be required in areas prone to late spring frosts, reducing fruit numbers at or soon after flowering has the effect of reducing competition for resources between fruit, allowing individual fruit to develop greater cell numbers, thus maintaining fruit firmness, even in larger fruit.
For ‘Fuji’, target crop loads of 4–6 fruit cm−2 TCSA are considered appropriate to avoid biennial bearing [1,6], and this study showed that large fruit of 200 g or more can be produced at these crop load levels, but if thinning is delayed, the crop load should be reduced to maximise fruit size. The current target crop load recommendation by Koen et al. [26] of 2–4 fruit cm−2 TCSA for ‘Delicious’ is confirmed by this study. While return bloom was adequate at crop loads of eight fruit cm−2 TCSA in both ‘Pink Lady’ and ‘Gala’, a decline in fruit size at crop loads above six fruit cm−2 TCSA suggests that the recommended target crop load for both these cultivars should be in the range of 4–6 fruit cm−2 TCSA. Large fruit size and good return bloom can be maintained in ‘Jonagold’ at crop loads of eight fruit cm−2 TCSA. However, crop loads of four fruit cm−2 TCSA are more realistic in ‘Braeburn’ to sustain regular bearing and good fruit size.
The positive relationships between fruit sugar content and weight and between fruit firmness and weight in both ‘Fuji’ and ‘Delicious’, and between fruit sugar content and fruit firmness in ‘Delicious’ have not been demonstrated previously and demonstrate that early thinning is a valuable tool in improving fruit quality. Early thinning also means that photosynthates produced by the tree are directed into the fruit that will remain on the tree, maximising resources during the cell division period in the first six weeks after bloom.

Supplementary Materials

The following supporting information can be downloaded at: https://www.mdpi.com/article/10.3390/applbiosci2040037/s1, Figure S1: Minimum monthly temperatures for Huon Valley trial sites; Figure S2: Maximum monthly temperatures for Huon Valley trial sites; Figure S3: Number of rain days for Huon Valley trial sites; Figure S4: Average monthly rainfall for Huon Valley trial sites; Figure S5: Cumulative rainfall over the growing season for trial sites; Table S1: Rating scales used for background fruit colour (Frappell and O’Loughlin 1962); Table S2: Mean crop loads (±standard deviation) obtained for each treatment in Trials 1–8.

Funding

This research received no external funding.

Institutional Review Board Statement

Not applicable.

Informed Consent Statement

Not applicable.

Data Availability Statement

Data is contained within the article and supplementary materials.

Acknowledgments

Thanks are due to Caron Summers and Shenan Daniels for technical assistance.

Conflicts of Interest

The author declares no conflict of interest.

References

  1. Costa, G.; Botton, A.; Vizzotto, G. Fruit thinning: Advances and trends. Hortic. Rev. 2019, 46, 185–226. [Google Scholar]
  2. Quinlan, J.D.; Preston, A.P. Effects of thinning blossom and fruitlets on growth and cropping of Sunset apple. J. Hortic. Sci. 1968, 43, 373–381. [Google Scholar] [CrossRef]
  3. Looney, N.E. Chemical thinning of apples: Some new strategies and important refinements to old procedures. Acta Hortic. 1986, 179, 597–604. [Google Scholar] [CrossRef]
  4. Johnson, D.S. The effect of flower and fruit thinning on the firmness of ‘Cox’s Orange Pippin’ apples at harvest and after storage. J. Hortic. Sci. 1992, 67, 95–101. [Google Scholar] [CrossRef]
  5. Johnson, D.S. Influence of time of flower and fruit thinning on the firmness of ‘Cox’s Orange Pippin’ apples at harvest and after storage. J. Hortic. Sci. 1994, 69, 197–203. [Google Scholar] [CrossRef]
  6. Jones, K.M.; Bound, S.A.; Koen, T.B.; Oakford, M.J. Effect of time of thinning on the cropping potential of red Fuji apple trees. Aust. J. Exp. Agric. 1992, 32, 417–420. [Google Scholar] [CrossRef]
  7. Kupferman, E. Critical Aspects of Harvest and Quality Management. Washington State University—Tree Fruit Research and Extension Centre, Postharvest information Network. 2002. Available online: http://postharvest.tfrec.wsu.edu/EMK2002A.pdf (accessed on 1 July 2004).
  8. Martin, D.; Lewis, T.L.; Cerny, J. Apple fruit cell numbers in relation to cropping alternation and certain treatments. Aust. J. Agric. Res. 1964, 15, 905–919. [Google Scholar] [CrossRef]
  9. Goffinet, M.C.; Robinson, T.L.; Lakso, A.N. A comparison of ‘Empire’ apple fruit size and anatomy in unthinned and hand-thinned trees. J. Hortic. Sci. 1995, 70, 375–387. [Google Scholar] [CrossRef]
  10. Link, H. Chemisches Ausdunnen mit Pantrin und Geramid Neu [Abstract]. Mitt. Obstbau 1967, 11, 96–101. [Google Scholar]
  11. Wertheim, S.J. Chemical thinning of apple. In Report for the Research Station for Fruit Growing, Wilhelminadorp for 1973; Foundation Research Station for Fruit Growing: Wilhelminadorp, The Netherlands, 1974; pp. 17–18. [Google Scholar]
  12. Flore, J.A. Chemical thinning of Paulared and Jerseymac [apple cultivars]. Compact. Fruit Tree 1978, 11, 115–119. [Google Scholar]
  13. Williams, M.W.; Edgerton, L.J. Fruit thinning of apples and pears with chemicals. In Agriculture Information Bulletin No. 289; United States Department of Agriculture: Washington, DC, USA, 1981. [Google Scholar]
  14. Jones, K.M.; Koen, T.B.; Longley, S.B.; Oakford, M.J. Thinning ‘Golden Delicious’ apples with naphthalene acetic acid in relation to spray concentration, volume and time of day. J. Hortic. Sci. 1988, 63, 27–30. [Google Scholar] [CrossRef]
  15. Bound, S.A.; Jones, K.M.; Graham, B.; Oakford, M.J.; Tichon, M. Modelling the effects of timing and rates of application of benzyladenine as a secondary thinner of ‘Fuji’ apple after ethephon. J. Hortic. Sci. 1993, 68, 967–973. [Google Scholar] [CrossRef]
  16. Greene, D.W. A review of the use of benzyladenine (BA) as a chemical thinner for apples. Acta Hortic. 1993, 329, 231–236. [Google Scholar] [CrossRef]
  17. Byers, R.E. Effects of bloom-thinning chemicals on apple fruit set. J. Tree Fruit Prod. 1997, 2, 13–31. [Google Scholar] [CrossRef]
  18. Koen, T.B.; Jones, K.M.; Oakford, M. Model building for prediction of ethephon thinning effects. Acta Hortic. 1986, 179, 645–652. [Google Scholar] [CrossRef]
  19. Little, C. Apple and Pear Maturity Manual; Colin R Little: Sherbrooke, VIC, Australia, 1999; p. 118. [Google Scholar]
  20. Frappell, B.D.; O’Loughlin, J.B. The harvest and storage of pears. Tasmanian J. Agric. 1962, 33, 70–77. [Google Scholar]
  21. Steel, R.G.D.; Torrie, J.H. Principles and Procedures of Statistics: A Biometrical Approach, 2nd ed.; McGraw-Hill: New York, NY, USA, 1980. [Google Scholar]
  22. Costa, G.; Blanke, M.M.; Widmer, A. Principles of thinning in fruit tree crops—Needs and novelties. Acta Hortic. 2013, 998, 17–26. [Google Scholar] [CrossRef]
  23. Greene, D.W.; Autio, W.R.; Miller, P. Thinning activity of benzyladenine on several apple cultivars. J. Am. Soc. Hortic. Sci. 1990, 115, 394–400. [Google Scholar] [CrossRef]
  24. Koike, H.; Tamai, H.; Ono, T.; Shigehara, I. Influence of time of thinning on yield, fruit quality and return flowering of ‘Fuji’ apple. J. Am. Pomol. 2003, 57, 169–173. [Google Scholar]
  25. Koen, T.B.; Jones, K.M.; Longley, S.B. Spray thinning strategies for ‘Red Delicious’ apple using naphthalene acetic acid and ethephon. J. Hortic. Sci. 1988, 63, 31–35. [Google Scholar] [CrossRef]
  26. Link, H. Significance of flower and fruit thinning on fruit quality. Plant Growth Regul. 2000, 31, 17–26. [Google Scholar] [CrossRef]
  27. McArtney, S.; Palmer, J.W.; Adams, H.M. Crop loading studies with ‘Royal Gala’ and ‘Braeburn’ apples: Effect of time and level of hand thinning. N. Z. J. Crop Hortic. Sci. 1996, 24, 401–407. [Google Scholar] [CrossRef]
  28. Lakso, A.N.; Robinson, T.L.; Goffinet, M.C.; White, M.D. Apple fruit growth responses to varying thinning methods and timing. Acta Hortic. 2001, 557, 407–412. [Google Scholar] [CrossRef]
  29. McLaughlin, J.M.; Greene, D.W. Effects of BA, GA4+7, and daminozide on fruit set, fruit quality, vegetative growth, flower initiation and flower quality of ‘Golden Delicious’ apples. J. Am. Soc. Hortic. Sci. 1984, 109, 34–39. [Google Scholar] [CrossRef]
  30. Sidhu, R.S.; Bound, S.A.; Hunt, I. Crop Load and Thinning Methods Impact Yield, Nutrient Content, Fruit Quality, and Physiological Disorders in ‘Scilate’ Apples. Agronomy 2022, 12, 1989. [Google Scholar] [CrossRef]
  31. Robinson, T.L.; Gonzalez, L.; Cheng, L.; Ziang, Y.; Peck, G.; Arnoldussen, B.; Gomez, M.; Guerra, M.; Sazo, M.M.; Kahlke, C.; et al. Studies in precision crop load management of apple. Acta Hortic. 2023, 1366, 219–225. [Google Scholar] [CrossRef]
  32. Fallahi, E.; Simons, B.R. Rootstock, time, technique, and quantity of nitrogen effects on production, mineral nutrition, and postharvest quality of ‘Fuji’ apple. HortScience 1995, 30, 787. [Google Scholar] [CrossRef]
  33. Riesen, W.; Husistein, A. Influence of rootstocks on apple fruit quality. Acta Hortic. 1998, 466, 161–166. [Google Scholar] [CrossRef]
  34. Unrath, C.R. The commercial implication of gibberellin A4+7 plus benzyladenine for improving shape and yield of Delicious apples. J. Am. Soc. Hortic. Sci. 1974, 99, 381–384. [Google Scholar] [CrossRef]
  35. Veinbrandts, N.; Miller, P. Promalin improves the shape of Delicious apples in Victoria. Aust. J. Exp. Agric. Anim. Husb. 1981, 21, 623–630. [Google Scholar] [CrossRef]
  36. Johnson, D.S. Effect of flower and fruit thinning on the maturity of ‘Cox’s Orange Pippin’ apples at harvest. J. Hortic. Sci. 1995, 70, 541–548. [Google Scholar] [CrossRef]
  37. Garriz, P.I.; Colavita, G.M.; Alvarez, H.L. Influence of crop level on growth and quality of ‘Braeburn’ apple fruit. HortScience 2000, 35, 418–419. [Google Scholar] [CrossRef]
  38. Jones, K.M.; Bound, S.A.; Summers, C.R.; Oakford, M.J. Preliminary examination of thinning strategies on young ‘Jonagold’ and ‘Pink Lady’ apples. Aust. J. Exp. Agric. 1997, 37, 377–382. [Google Scholar] [CrossRef]
  39. Jones, K.; Bound, S.; Miller, P. Crop Regulation of Pome Fruit in Australia; Tasmanian Institute of Agricultural Research: Hobart, TAS, Australia, 1998; ISBN 1-86295-027-X. [Google Scholar]
  40. Serra, S.; Leisso, R.; Giorani, L.; Kalcsits, L.; Musacchi, S. Crop load influences fruit quality, nutritional balance, and return bloom in ‘Honeycrisp’ apple. HortScience 2016, 51, 236–244. [Google Scholar] [CrossRef]
  41. Williams, M.W.; Edgerton, L.J. Biennial bearing of apple trees. Proc. 19th IHC Warszawa 1974, 3, 343–352. [Google Scholar]
  42. Bound, S.A. Precision crop load management of apple (Malus x domestica Borkh.) without chemicals. Horticulturae 2019, 5, 3. [Google Scholar] [CrossRef]
  43. Breen, K.C.; van Hooijdonk, B.M.; Tustin, D.S.; Wilkie, J.D.; Bound, S.A.; Middleton, S.G.; Close, D.C. Changes in fruit set of ‘Gala’ apple in response to environment and artificial spur extinction. Acta Hortic. 2014, 1058, 77–83. [Google Scholar] [CrossRef]
Figure 1. The effect of crop load on (a) mean fruit weight, (b) fruit size and (c) fruit soluble solids content of ‘Fuji’ apple (trial 1). Error bars represent the standard error of the mean (n = 700).
Applbiosci 02 00037 g001
Figure 2. The effect of fruit weight on (a) fruit sugar content and (b) fruit shape (length/diameter ratio) of ‘Fuji’ apple (trial 1). Error bars represent the standard error of the mean (n = 700).
Applbiosci 02 00037 g002
Figure 3. The effect of crop load on (a) mean fruit weight, (b) fruit size and (c) fruit soluble solids content, and (d) the relationship between fruit weight and sugar content of ‘Fuji’ apple (trial 2). Error bars represent the standard error of the mean (n = 700).
Applbiosci 02 00037 g003
Figure 4. The effect of crop load on (a) mean fruit weight, (b) fruit size and (c) fruit soluble solids content of ‘Delicious’ apple (trial 3). Error bars represent the standard error of the mean (n = 700).
Applbiosci 02 00037 g004
Figure 5. The effect of fruit weight on (a) fruit soluble solids content and (b) fruit firmness of ‘Delicious’ apple (trial 3). Error bars represent the standard error of the mean (n = 700).
Applbiosci 02 00037 g005
Figure 6. The relationship between fruit firmness and sugar content of ‘Delicious’ apple. Error bars represent the standard error of the mean (n = 700).
Applbiosci 02 00037 g006
Table 1. Details of apple cultivars used in each trial.
TrialCultivarRootstockHeight (m)Age (Years)Row Spacing (m)Tree Spacing (m)
1Naga-Fu No. 2 ‘Fuji’ MM1062.5943
2Naga-Fu No. 2 ‘Fuji’ MM1062.51043
3Oregon spur ‘Delicious’MM1062.0842.5
4Oregon spur ‘Delicious’MM1062.21042.5
5‘Pink Lady’M26
MM106
2.0
3.0
732
6‘Jonagold’M26
MM106
2.0
3.0
732
7‘Braeburn’M26
MM106
2.0
3.0
732
8Royal ‘Gala’M262.0631.5
Table 2. Details of treatments (thinning time and crop load level), date of full bloom, and number of replicates in hand-thinning trials conducted over four seasons. AFB, after full bloom; TCSA, trunk cross-sectional area.
TrialSeasonCultivarRootstockThinning Time
(Weeks AFB)
Crop Load Levels (Fruit cm−2 TCSA)Full Bloom DateReplicate Number
11‘Fuji’ MM10662, 4, 6, 8, 1017 Oct5
22‘Fuji’ MM10662, 4, 6, 8, 1014 Oct5
31‘Delicious’MM10662, 4, 6, 8, 1021 Oct5
42‘Delicious’MM1061, 2, 4, 8, 12, 163, 618 Oct3
53‘Pink Lady’M26, MM1062, 6, 10, 144, 6, 86 Oct4
63‘Jonagold’M26, MM1062, 6, 10, 144, 6, 812 Oct4
73‘Braeburn’M26, MM1062, 6, 102, 4, 6, 88 Oct4
84‘Gala’M262, 6, 10, 143, 6, 911 Oct4
Table 3. The effect of crop load on fruit shape (length/diameter ratio) and flesh firmness of ‘Fuji’ apples hand-thinned 6 weeks after full bloom (Trial 1). TCSA, trunk cross-sectional area.
Crop LoadLength/Diameter RatioFlesh Firmness (kg)
Two fruit cm−2 TCSA 0.920 b12.11 bc
Four fruit cm−2 TCSA 0.896 a12.28 c
Six fruit cm−2 TCSA 0.893 a11.74 a
Eight fruit cm−2 TCSA0.891 a11.95 ab
Ten fruit cm−2 TCSA0.886 a12.36 c
Means within each column with the same letter are not significantly different at the 5% level.
Table 4. The effect of crop load on fruit shape (length/diameter ratio) and flesh firmness of ‘Fuji’ apples hand-thinned 6 weeks after full bloom (Trial 2). TCSA, trunk cross-sectional area.
Crop LoadLength/Diameter RatioFlesh Firmness (kg)
Two fruit cm−2 TCSA 0.854 bc8.25 c
Four fruit cm−2 TCSA 0.859 c7.60 ab
Six fruit cm−2 TCSA 0.839 a7.78 b
Eight fruit cm−2 TCSA0.843 ab7.82 b
Ten fruit cm−2 TCSA0.841 a7.51 a
Means within each column with the same letter are not significantly different at the 5% level.
Table 5. The effect of crop load on fruit shape (length/diameter ratio) and flesh firmness of ‘Delicious’ apples hand-thinned 6 weeks after full bloom (trial 3). TCSA, trunk cross-sectional area.
Crop LoadLength/Diameter RatioFlesh Firmness (kg)
Two fruit cm−2 TCSA 0.98411.18 c
Four fruit cm−2 TCSA 0.98310.64 b
Six fruit cm−2 TCSA 0.96910.25 a
Eight fruit cm−2 TCSA0.97310.47 ab
Ten fruit cm−2 TCSA0.97710.28 a
Means within each column with the same letter are not significantly different at the 5% level.
Table 6. The interaction between crop load and time of thinning on fruit size (% fruit ≥ 75 mm in diameter), shape (length/diameter ratio), soluble solids content and flesh firmness of ‘Delicious’ apples. TCSA, trunk cross-sectional area; wAFB, weeks after full bloom; TSS, total soluble solids.
Crop Load (Fruit cm−2 TCSA)Thinning Time (wAFB)% Fruit ≥ 75 mm
Diameter
Length/Diameter RatioTSS Content
(°Brix)
Flesh Firmness
(kg)
3167 f0.971 ab13.43 f8.58 f
6163 f0.994 de13.23 de8.01 cd
3267 f0.997 de13.17 cd7.88 bc
6225 c1.003 e13.07 bc7.57 a
3459 ef0.989 cde13.90 h8.32 ef
6423 bc0.984 abcd12.70 a7.79 abc
3843 de0.987 bcde13.33 ef8.44 ef
688 ab0.969 a13.03 b8.25 de
31243 de0.998 de14.13 i8.59 f
61217 abc0.974 abc13.73 g7.72 ab
31633 cd0.999 de13.77 g9.47 h
6166 a0.984 abcd13.00 b8.90 g
Means within each column with the same letter are not significantly different at the 5% level.
Table 7. The effect of crop load and time of thinning on mean fruit weight and return bloom of ‘Delicious’ apples (trial 4). TCSA, trunk cross-sectional area; wAFB, weeks after full bloom.
Mean Fruit Weight (g)Return Bloom
(Buds cm−2 TCSA)
(i) Crop load
  Three fruit cm−2 TCSA170 b14.1
  Six fruit cm−2 TCSA144 a13.3
(ii) Time of thinning
   1 wAFB172 b16.7 b
   2 wAFB161 ab15.4 b
   4 wAFB164 ab17.9 b
   8 wAFB147 a10.5 a
   12 wAFB153 a10.6 a
   16 wAFB149 a11.3 a
Means within each column with the same letter are not significantly different at the 5% level.
Table 8. The effect of rootstock, crop load, and time of thinning on mean fruit weight, size (% fruit ≥ 75 mm in diameter), and return bloom of ‘Pink Lady’ apples. TCSA, trunk cross-sectional area; wAFB, weeks after full bloom.
Mean Fruit Weight
(g)
% Fruit ≥ 75 mm
in Diameter
Return Bloom
(Buds cm−2 TCSA)
(i) Rootstock
  M26 166 b30 b13.9 b
  MM106 156 a24 a5.3 a
(ii) Crop load
   Four fruit cm−2 TCSA 167 b32 b9.7
   Six fruit cm−2 TCSA 164 b28 b10.3
   Eight fruit cm−2 TCSA151 a20 a8.8
(iii) Time of thinning
    2 wAFB169 b36 b10.7 b
    6 wAFB165 b33 b11.4 b
    10 wAFB156 a18 a8.8 a
    14 wAFB153 a20 a7.4 a
Means within each column with the same letter are not significantly different at the 5% level.
Table 9. The effect of rootstock, crop load and time of thinning on fruit shape (length/diameter ratio), sugar content and flesh firmness of ‘Pink Lady’ apples. TCSA, trunk cross-sectional area; wAFB, weeks after full bloom; TSS, total soluble solids.
RootstockCrop Load (Fruit cm−2 TCSA)Thinning Time (wAFB)Length/Diameter
Ratio
TSS (°Brix)Flesh Firmness
(kg)
M26420.936 efghi15.96 lm8.96 hi
M26620.906 ab15.45 j8.98 i
M26820.941 ghi15.18 gh7.99 abcd
M26460.946 i15.88 kl9.60 j
M26660.934 defghi16.35 o9.53 j
M26860.942 hi15.53 j8.64 gh
M264100.964 j16.07 mn9.10 i
M266100.930 cdefghi16.30 o8.98 i
M268100.934 defghi16.18 no8.56 fg
M264140.916 bc15.40 ij8.92 def
M266140.917 bcd15.23 hi8.55 fg
M268140.923 bcdef15.45 j8.24 def
MM106420.924 cdefg15.16 gh8.18 de
MM106620.916 bc14.05 c8.06 bcde
MM106820.897 a14.35 de8.04 bcd
MM106460.923 bcdef15.23 hi7.98 abcd
MM106660.921 bcde15.00 g8.15 cde
MM106860.917 bcd14.58 f8.38 efg
MM1064100.920 bcde14.50 ef8.30 def
MM1066100.938 fghi13.70 a7.83 abc
MM1068100.929 cdefghi14.38 de7.75 ab
MM1064140.914 abc13.99 b8.00 abcd
MM1066140.925 cdefgh14.23 cd7.81 ab
MM1068140.918 bcd14.36 de7.68 a
Means within each column with the same letter are not significantly different at the 5% level.
Table 10. The effect of rootstock, crop load and time of thinning on fruit weight, size and return bloom of ‘Jonagold’ apples. TCSA, trunk cross-sectional area; wAFB, weeks after full bloom.
Mean Fruit Weight
(g)
% Fruit ≥ 85 mm
Diameter
Return Bloom
(Buds cm−2 TCSA)
(i) Main effects—rootstock
  M26 229336.7 a
  MM106 2314111.9 b
(ii) Main effects—crop load
   Four fruit cm−2 TCSA 259 c49 b10.6
   Six fruit cm−2 TCSA 223 b36 a9.0
   Eight fruit cm−2 TCSA 207 a27 a8.3
(iii) Main effects—time of thinning
    2 wAFB242 b4211.4
    6 wAFB240 b378.4
    10 wAFB226 ab417.7
    14 wAFB211 a299.6
Means within each column with the same letter are not significantly different at the 5% level.
Table 11. The effect of rootstock, crop load and time of thinning on fruit shape and total soluble solids (TSS) content of ‘Jonagold’ apples. TCSA, trunk cross-sectional area; wAFB, weeks after full bloom; TSS, total soluble solids.
RootstockCrop Load (Fruit cm−2 TCSA)Thinning Time (wAFB)Length/Diameter RatioTSS (Brix)
M26420.920 de13.70 b
M26620.911 bcde15.10 ij
M26820.917 cde13.65 b
M26460.924 e15.83 k
M26660.916 cde14.25 ef
M26860.899 ab13.75 bc
M264100.905 bcd14.45 fg
M266100.898 ab14.20 ef
M268100.899 ab14.13 def
M264140.912 bcde15.70 k
M266140.905 bcd14.65 gh
M268140.911 bcde13.85 bcd
MM106420.899 ab16.33 l
MM106620.911 bcde14.68 gh
MM106820.904 bc13.52 b
MM106460.910 bcde15.20 j
MM106660.909 bcde14.25 ef
MM106860.916 cde14.80 hi
MM1064100.910 bcde15.20 j
MM1066100.905 bcd14.80 hi
MM1068100.909 bcde14.94 hij
MM1064140.921 e15.68 k
MM1066140.902 bc14.05 cde
MM1068140.885 a13.15 a
Means within each column with the same letter are not significantly different at the 5% level.
Table 12. The effect of crop load and time of thinning on fruit weight, size, return bloom and fruit shape of ‘Braeburn’ apples. TCSA, trunk cross-sectional area.
Mean Fruit Weight
(g)
% Fruit ≥ 75 mm
Diameter
Length/Diameter
Ratio
Return Bloom
(Buds cm−2 TCSA)
(i) Main effects—rootstock
  M26 220 b70 b0.907 a20.2 b
  MM106 196 a45 a0.920 b7.4 a
(ii) Main effects—crop load
   Two fruit cm−2 TCSA 244 c76 c0.926 c23.5 c
   Four fruit cm−2 TCSA 218 b67 c0.916 b15.9 b
   Six fruit cm−2 TCSA 191 a51 b0.904 a9.4 a
   Eight fruit cm−2 TCSA 179 a37 a0.907 a6.3 a
Means within each column with the same letter are not significantly different at the 5% level.
Table 13. The effect of crop load and time of thinning on total soluble solids content (Brix) of ‘Braeburn’ apples on two different rootstocks, M26 and MM106. TCSA, trunk cross-sectional area; wAFB, weeks after full bloom; TSS, total soluble solids.
Crop Load (Fruit cm−2 TCSA)Thinning Time (wAFB)TSS (Brix)
M26MM106
2215.60 j13.82 de
4214.26 f14.05 ef
6213.95 e13.65 d
8213.06 c12.43 b
2615.25 i12.15 a
4614.87 g12.53 b
6612.50 b13.00 c
8612.65 b13.20 c
21015.20 i15.13 hi
41014.93 gh15.15 hi
61013.88 de12.03 a
81013.25 c13.12 c
Means within each column with the same letter are not significantly different at the 5% level.
Table 14. The effect of crop load and time of thinning on mean fruit weight, size (% fruit ≥ 65 mm in diameter), shape (length/diameter ratio) and return bloom of ‘Gala’ apples. TCSA, trunk cross-sectional area; wAFB, weeks after full bloom.
Crop Load (Fruit cm−2 TCSA)Thinning Time (wAFB)Mean Fruit Weight (g)% Fruit ≥ 65 mm
Diameter
Length/Diameter RatioReturn Bloom
(Buds cm−2 TCSA)
32148 e37 d0.928 efg19.7 e
62138 de16 c0.929 fg9.1 abc
92118 bc2 ab0.915 def10.6 abc
36140 de11 bc0.934 g18.5 de
66125 cd4 ab0.933 g11.5 bc
9695 a0 a0.908 cd8.2 abc
310133 cde7 abc0.942 g12.1 cd
61094 a1 ab0.904 bcd5.0 ab
91098 a0 a0.894 abc7.9 abc
314104 ab0 a0.913 de5.4 abc
61495 a0 a0.887 a7.7 abc
91488 a0 a0.892 ab3.9 a
Means within each column with the same letter are not significantly different at the 5% level.
Table 15. The effect of crop load and time of thinning on fruit sugar content, flesh firmness, starch index and background skin colour of ‘Gala’ apples. TCSA, trunk cross-sectional area; wAFB, weeks after full bloom; TSS, total soluble solids; SPI, starch pattern index.
Crop Load (Fruit cm−2 TCSA)Thinning Time (wAFB)TSS (°Brix)Flesh Firmness (kg)SPIBackground
Skin Colour
3215.38 g8.16 a4.0 f4.5 d
6214.50 c8.67 bc3.4 e4.5 d
9214.50 cd8.40 ab3.6 e4.1 c
3615.15 f9.26 e2.9 d4.2 cd
6614.69 e8.85 cd3.4 e4.5 d
9614.18 b9.60 fg3.6 e3.6 b
31014.44 c9.17 de2.7 cd4.5 d
61013.90 a9.28 ef2.9 d4.2 b
91015.20 f9.73 g2.9 d3.3 d
31414.23 b10.20 h1.9 a4.5 d
61414.60 de9.63 g2.3 b3.2 a
91413.85 a9.47 ef2.4 bc4.2 cd
Means within each column with the same letter are not significantly different at the 5% level.
Disclaimer/Publisher’s Note: The statements, opinions and data contained in all publications are solely those of the individual author(s) and contributor(s) and not of MDPI and/or the editor(s). MDPI and/or the editor(s) disclaim responsibility for any injury to people or property resulting from any ideas, methods, instructions or products referred to in the content.

