Article

Computational Modelling on Gasification Processes of Municipal Solid Wastes Including Molten Slag

1
Environmental Process Modelling Centre, Nanyang Environment and Water Research Institute, Nanyang Technological University, 1 Cleantech Loop, Singapore 637141, Singapore
2
Interdisciplinary Graduate Programme, Graduate College, Nanyang Technological University, 61 Nanyang Drive, Singapore 637335, Singapore
3
School of Civil and Environmental Engineering, Nanyang Technological University, 50 Nanyang Avenue, Singapore 639798, Singapore
4
School of Mechanical and Aerospace Engineering, Nanyang Technological University, 50 Nanyang Avenue, Singapore 639798, Singapore
*
Author to whom correspondence should be addressed.
Waste 2023, 1(2), 370-388; https://doi.org/10.3390/waste1020023
Submission received: 11 November 2022 / Revised: 15 February 2023 / Accepted: 7 March 2023 / Published: 10 April 2023

Abstract

:
The formulation of the CFD-DEM model, CD-MELT, is established in this study to include three-phase non-isothermal processes with simultaneous combustion and melting for gasification simulations. To demonstrate the model capability, CD-MELT is used to assess the need for slag recycling for the non-isothermal melting of municipal solid wastes (MSW) in a prototype waste-to-energy research facility. The simulation encompasses the full fixed-bed slagging gasification process, including chemical reactions and melting of MSW and slag. In order to assess the need for slag recycling, comparisons are made for the two cases of with and without, in terms of the slag mass, liquid slag volume fraction, exit gas composition, and temperature distribution in the gasifier. The prediction results enable the tracking of liquid molten slag as it permeates through the solids-packed bed for the first time in the literature as far as we are aware, which is crucial to address design considerations such as distribution of bed temperature and optimal location for slag-tap holes at the bottom, as well as potential slag clogging within the porous media. The model also predicts an uneven and intermittent slag permeation through the packed bed without the recycling, and provides a plausible explanation for the operators’ experience of why slag recycling is important for process stability. Finally, the predicted slag outlet temperature using the proposed CFD approach also agrees well with the measurement data published in an earlier case study for the same facility.

1. Introduction

In recent decades, gasification technology has been recognized as a promising approach in the management of solid wastes [1]. It differs from other waste-to-energy approaches by processing the wastes at a very high temperature that may exceed 2000 °C for volume reduction under a very low supply of oxidant, leading to the partial combustion of fuels and production of syngas as a mixture of carbon monoxide (CO), hydrogen (H2), carbon dioxide (CO2), nitrogen (N2) and methane (CH4) for energy production, together with the solid residues of tar and slag [2]. Full-scale gasifiers are typically large and their operating parameters are difficult to optimise, including, for example, the reactor geometry, supply air flow rate, blending of feedstock, and pollution control processes. Thus, various approaches, such as computational fluid dynamics (CFD) [3,4], artificial neural networks [5,6], thermodynamic equilibrium [7,8] and kinetic models [9] have been developed to assess and optimise the operating parameters [10]. These tools normally characterise the gasification process through the various stages of heating and drying, devolatilization, combustion, tar cracking and reduction [11]. In particular, due to its comprehensive nature and ability to model complex physical phenomena, CFD has been extensively used for thermal waste treatment applications such as incineration, pyrolysis and gasification [12,13], with a wide variety of Euler-Lagrange numerical methods such as CFD-DEM [14], multiphase particle-in-cell (MP-PIC) [15], and the coarse-grained model [16] to represent gas-solid flows. However, nearly all of them focus on the gas-solid mixing in the gasifier, while the melting inside the bottom high-temperature packed bed is usually disregarded due to the complexity of the three-phase interactions involved. Thus, these tools are generally unable to address technical issues related to the permeation of molten slag through the packed bed, such as to determine the optimal location for the slag tap-holes at the bottom of the gasifier, as well as to minimise the potential of slag clogging inside the bed media, which can disrupt the gasification process in the worst case.
In previous CFD studies, the simulation of melting has been carried out for various examples. In some cases, the melting was from a single solid, such as when Feng et al. modelled the deposition of a slag particle on the wall of a blast furnace to investigate the collision and spreading on the wall surface [17]. The observation and tracking of a solid-liquid interface is also of interest for encapsulated phase-change materials in thermal energy storage systems [18], with applications on determining modelling constants [19,20], and observation of heat transfer and temperature distribution [21]. The enthalpy-porosity method was most often used when interface tracking was important, as it is able to represent both solid and liquid phases in an Eulerian manner, and the solid-liquid interface is determined via the phase volume fraction. For others, the focus was on melting of multiple solids, such as through packed beds [17,22,23], and water infiltration into frozen soil [24]. For the present application of slagging gasifiers, which are operated at higher temperatures than conventional gasifiers, much of the available literature focuses on slag formation and its effects on gasifier performance. Slag is primarily formed through the melting of inorganic matter such as metal oxides or silica, depending on the fuels used. The inorganic matter, if not removed, can cause issues when deposited as fine ash particles in subsequent processes [25]. During the gasification process, slag is observed in two places: firstly, on the walls of the gasifier when particles become trapped and melt in a viscous layer, and secondly, when this viscous slag layer flows to the bottom of the gasifier before exiting at the tap-hole. At present, only a few studies for entrained-flow gasifiers have been reported in the literature that included the simulation of slag melting [26,27,28,29]. These gasifiers differ significantly from those for municipal solid wastes, which have a high-temperature packed bed at the bottom, whereby the slag flow is also contributed to by melting within the bed, which then permeates through the bed and is subsequently discharged. In order to prevent clogging and ensure stable operation, it is important to maintain a continuous, steady discharge of liquid slag from the bottom of the reactor, which can be achieved when the slag reaches a critical viscosity [30]. As the slag viscosity is directly influenced by reactor temperature, the predictions on the temperature distribution in the packed bed with the presence of molten slag are crucial. However, to the best of our knowledge, there is no modelling tool available that can assist in this task at present. Hence, the design is mostly based on empirical knowledge from prior field experience.
Earlier, a three-phase computational modelling tool called CD-MELT was developed to simulate both iso-thermal and non-isothermal melting [31,32], and the numerical predictions have been shown to be satisfactory in two earlier studies for packed beds under convective flows. The CD-MELT model is based on the CFD-DEM method, which represents the solid phase via discrete particles, and the fluid (gas and liquid) phases as separate continuums. Chemical reactions were not included in these earlier studies. The current study further establishes the CD-MELT formulation to include simultaneous combustion and melting, such that the particles’ temperature can reach the solidus temperature with a non-zero char mass fraction. In addition, the typical chemical reactions for the gas phase of a gasifier for municipal solid wastes are fully represented in the model. Together, the CD-MELT model can now act as a computational tool to aid the design of the gasification processes of municipal solid wastes, including the molten slag in the packed bed. In the following, the new formulation will be presented and the results from a case study discussed for model verification and analysis.

2. Numerical Simulation and CD-MELT Model

The CD-MELT model established in this study accounts for the full gasification processes and melting of municipal solid wastes. There are three sub-models for the three-phase interactions inside CD-MELT: one for the primary gas phase which flows readily through the pores of the packed bed; one for the secondary liquid phase which permeates slowly through the bed; and the last for the solid phase of the packed bed, comprising coal, waste and slag particles. The two Eulerian models (gas and liquid) and one Lagrangian model (solid) are coupled through source terms as well as interaction forces on a cell volume or particle basis. The model assumptions are: (i) drag is the only interaction force between each pair of phases; i.e., the inertial accelerations are assumed to be negligible, which are generally valid in packed beds, (ii) heat transfer only occurs between the gas-solid phases and gas-liquid phases, but not the liquid-solid phases; this assumption limits the analysis to a shallow packed bed with negligible thermal gradient, (iii) mass transfer only occurs from the solid to the liquid phase, i.e., there is no re-solidification, and (iv) particles can undergo combustion, heating and melting at the same time to account for the cross-sectional variation of the thermal gradient in the packed bed.

2.1. Fluid-Phase Equations

The Eulerian multiphase model is used to solve the continuity, momentum and energy conservation equations for the gas and liquid phases individually and simultaneously, with coupling occurring via the interaction terms for momentum transport and heat transfer. A summary of the governing equations for the fluid phases is listed in Table 1, and the details for the coupling terms are elaborated in Section 2.4.
The gas phase is assumed to be a mixture of gases, which are produced and consumed during chemical and physical reactions, and an additional species transport model is included to track the local mass fraction of each species. In the Eulerian equations, the dense discrete-phase model [33] is used to account for the high solid volume fraction, especially in the region of the fixed bed, while the Lagrangian method is used to track the discrete particles. As discussed above, the mass transfer is assumed to occur from the solid to gas phases via vaporization, devolatilization, and combustion, or from the solid to liquid phases via melting.

2.2. Solid-Phase Equations

In CD-MELT, the solid phase is represented by individual discrete particles, and the conservation equations are solved in a Lagrangian manner for each particle using the discrete element method (DEM) [34]. Three types of particles, namely coal, MSW and slag, can be specified to account for the complexity and heterogeneity in the gasification processes of municipal solid wastes. They can have varied composition, size distribution and melting rates, and their momentum fluxes are conserved in terms of accounting for the force balance and collision forces. These particles are tracked via UDFs in order to determine the particle laws, which in turn influence the particle temperature, mass, and diameter and source terms to the fluid phases. Their individual energy balance equation can differ significantly, depending on their temperature and other physical properties. Conversely, the primary gas phase generates the interaction forces that act on the particles as they pass through the cell volume. The governing equations for the solid phase are presented in the following, and the details of the UDFs for the particle laws and melting process are further elaborated in Section 2.3.
The DEM approach is based on Newton’s second law of motion, and the equations of motion are solved for each particle with the particle force balance as:
m p d v p d t = m p g ( ρ p ρ g ) ρ p + m p K gp ( v g v p ) ρ p + m p K lp ( v l v p ) ρ p + F coll
d x p d t = v p
The terms on the right-hand side of Equation (8) represent the sum of the gravitational and buoyancy forces, the drag forces exerted by the gas and liquid phases, and the contact forces due to particle collisions. Both drag force terms are represented via the Gidaspow model [35], and the exact form used is specified later in Section 2.4. The collision forces are computed based on the DEM soft sphere model [36] and exerted both normally and tangentially [33].

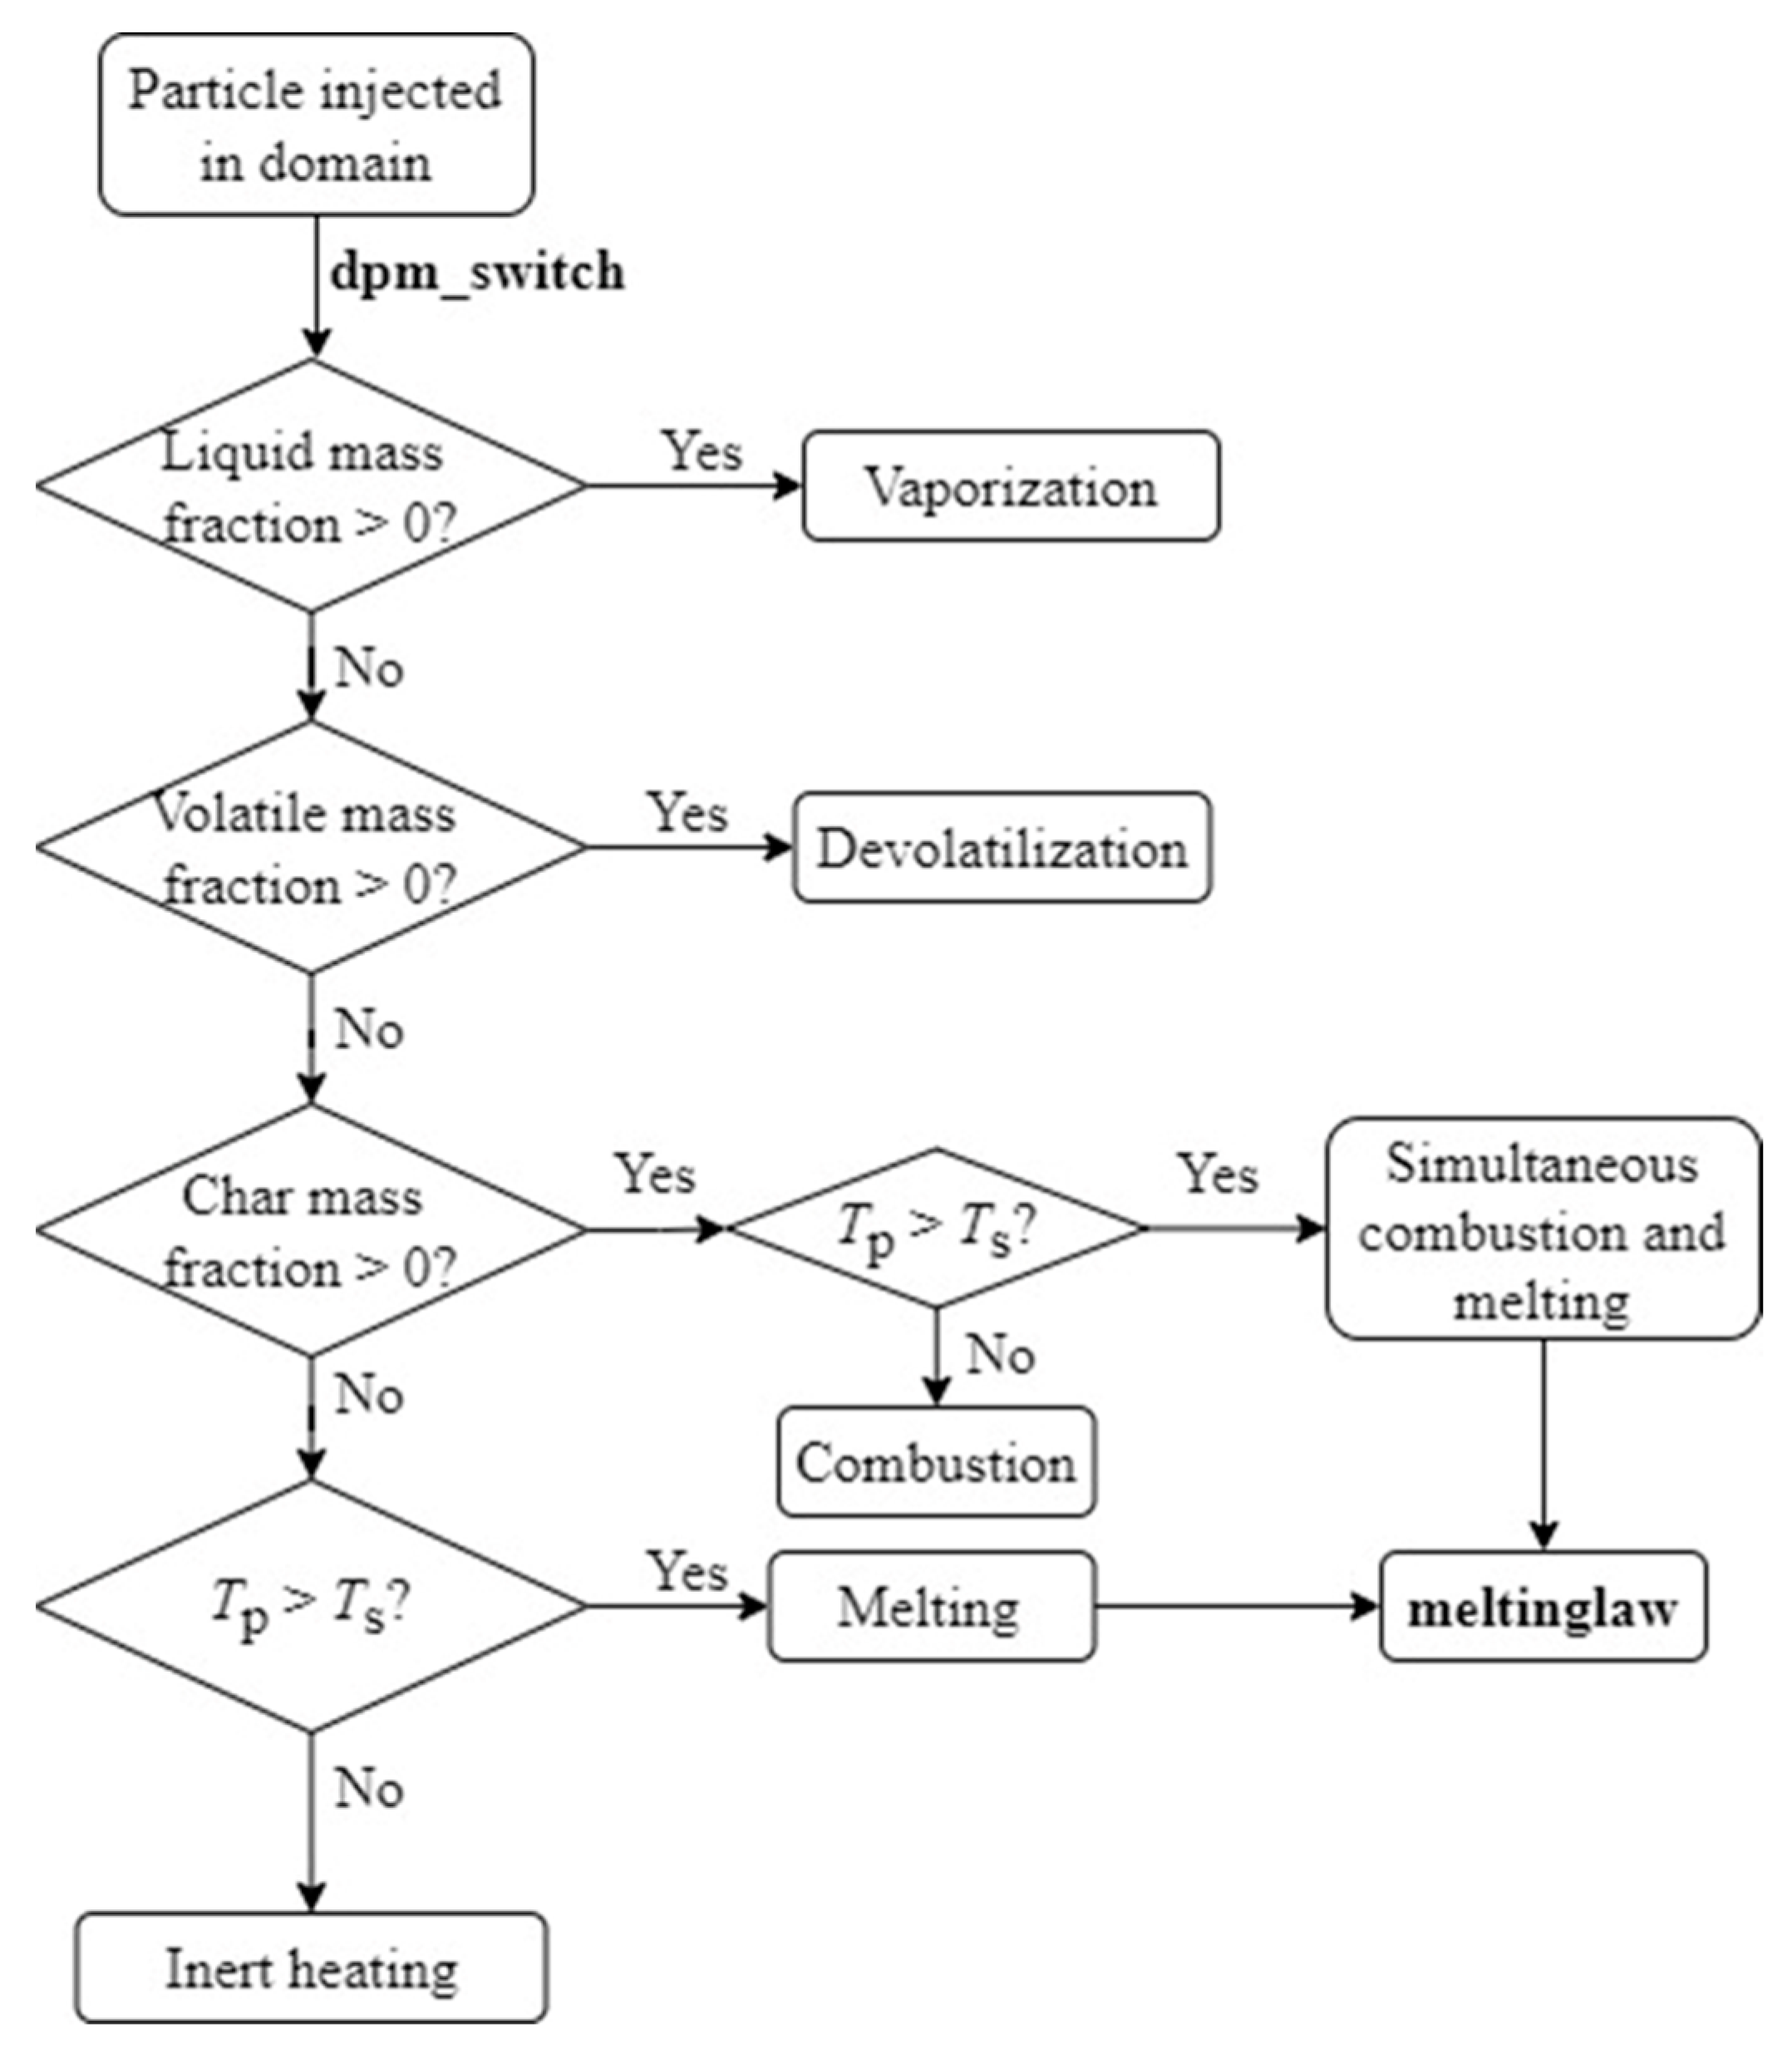
2.3. Particle Laws and Melting Model

Many chemical and physical processes occur inside a typical gasifier for municipal solid wastes, including vaporization, devolatilization, combustion and melting. The particles in CD-MELT will be subjected to these processes over their lifetime. At every DPM timestep, the particle law is implemented for each particle depending on its particle composition and temperature. In other words, particles in the same region but with different compositions, sizes or temperatures can undergo vastly different processes. Given the initial properties and composition (i.e., % moisture, VM, FC and ash) of the particles, CD-MELT simulates the subsequent changes of these particles with different melting rates, which are crucial in gasifiers that may handle varying types of waste. As discussed above, three types of particles are represented in the present study, i.e., municipal solid waste, coal, and slag, each having their own particle size distribution and compositions.
For applications with reactive gas-solid flows, a simplified particle lifetime process is illustrated in Figure 1. As shown in the figure, the switching of particle laws is implemented via a user-defined function (dpm_switch) based on the presence of liquid mass fraction, volatile fraction, char fraction, and temperature. The particle would then sequentially undergo vaporization, devolatilization, combustion and melting as its temperature increased. For particles without physical or chemical reactions, in this case, slag, dpm_switch is only used to switch the particle law from inert heating to melting and vice versa.
The Lagrangian equations for particle energy balance are solved for each particle at every DPM timestep, as listed in Table 2. To represent non-isothermal melting, a modified heat integration method is used [37]. Upon reaching the solidus temperature, only a portion of the particle is assumed to undergo phase change, depending on the quantity of heat absorbed. This portion is calculated via a unique particle-specific variable called particle enthalpy in CD-MELT, generated from the heat absorbed during convection from the gas phase and combustion of the particle, if any. When the particle temperature reaches the solidus temperature, there may still be char remaining in the particle. Theoretically, this means that a part of the particle can continue to burn while it undergoes melting. Thus, CD-MELT allows for simultaneous combustion and melting, and the heat generated from combustion is also channelled to melting. In each process, the energy equation for the particle in Table 2 is used correspondingly, and the particle diameter is assumed to decrease linearly based on its temperature [38] during the non-isothermal melting.
When the temperature of the particle exceeds the solidus temperature, T s , the non-isothermal melting law (through another UDF (meltinglaw)) is implemented and the full details are given in Appendix A. Upon the first instance that the particle reaches the solidus temperature, its mass, diameter and density are recorded in a storage array unique to the particle. This array can be accessed where subsequently needed (relevant variables subscripted as p,0). In summary, the combustion-melting model calculates the energy absorbed from the surrounding gas via convection and particle combustion. This absorbed energy is converted to melt a portion of the particle and simultaneously increase its temperature. When the particle is removed according to the stated conditions, its equivalent mass, momentum and energy source terms are added to the liquid phase to ensure the conservation within the numerical domain. Particles under the CD-MELT model are removed when the particle mass loss fraction is more than 95%.

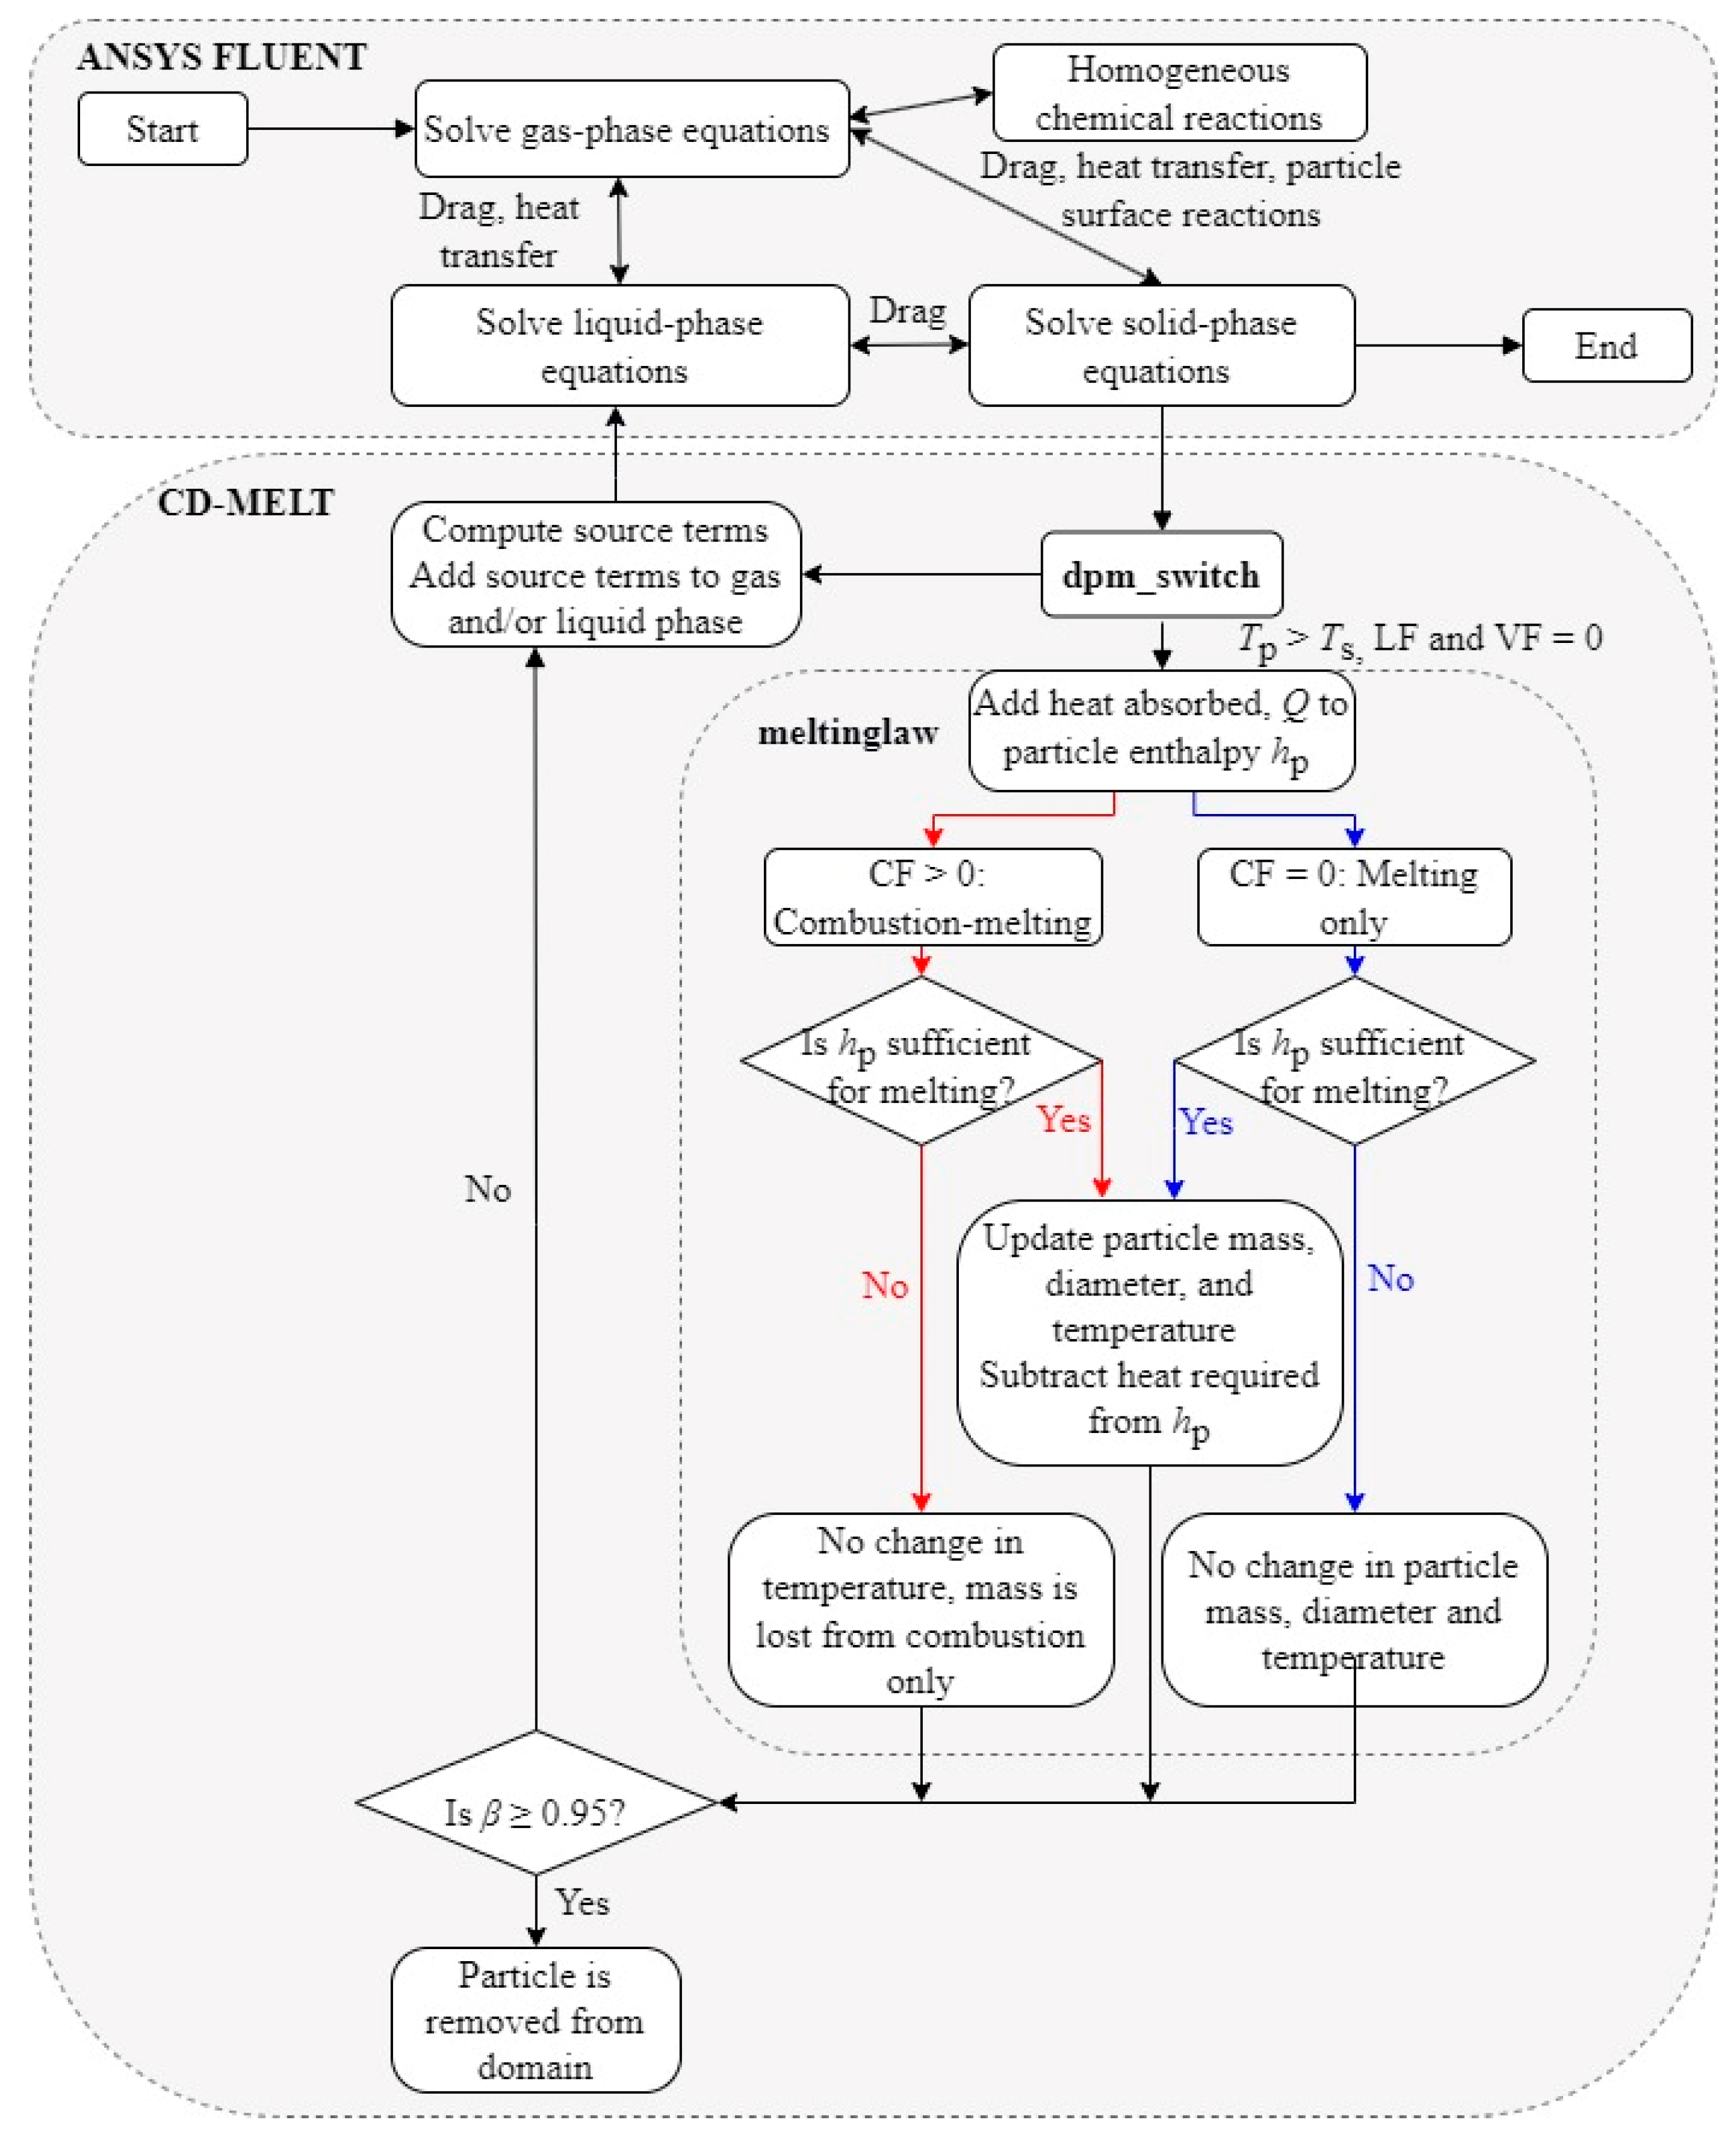
2.4. Solution Procedure and Inter-Phase Coupling of Mass, Momentum and Energy

The CD-MELT simulations in the present study are conducted using the commercial CFD software, ANSYS® Fluent, Release 20.2 [33]. An overview of the combustion-melting model in CD-MELT and its coupling with the ANSYS® Fluent software is further elaborated in Figure 2.
In Fluent, the pressure-velocity coupling in the fluid region is solved using the pressure-based Phase Coupled Semi-Implicit Method for Pressure Linked Equations (PC-SIMPLE) algorithm [39]. The coupling among the three phases in CD-MELT takes place through the mass transfer, interaction forces, and heat transfer terms. The mass transfer during vaporization, devolatilization and combustion is assumed to occur directly between the solid and gas phases, and during melting from the solid to liquid phases. Momentum transfer is represented via interaction forces in the form of drag only, due to the high density and large size of the solid and slag particles in the packed bed. Specifically, the Gidaspow drag model [35] has been chosen to represent the drag force between each pair of phases. The general form of the momentum exchange coefficient, K pq , is calculated based on either the Wen and Yu model [40] ( α q > 0.8 ) or the Ergun equation [41] ( α q 0.8 ), where phase q is the less dense phase. From our previous study [32], this drag model is capable of representing the resistance to the motion of the molten slag through the packed bed. However, for smaller MSW and solid slag particles, other forces such as pressure gradient or lift forces might also be needed, as they can be carried out of the domain via the gas.
Heat transfer is assumed to occur only between the gas phase and other phases, as represented by the Q lg ,   Q gl and Q pg terms. The convective heat transfer between gas and liquid is a function of the Ranz-Marshall correlation [42], interfacial area and temperature difference. The liquid phase is represented by an assembly of spherical droplets, assuming a single droplet in each cell for simplicity. This allows the liquid phase to be tracked independently of the gas and solid particles, and at the same time, to account for decreased local heat transfer when the volume of liquid increases. The heat transfer between the solid and the gas in each cell is then equal to the change in thermal energy of the particles:
Q pg = m p , 0 T ref T p , 0 c p , p d T m p T ref T p c p , p   d T
where m p , 0 and T p , 0 represent the mass and temperature of the particle at the beginning of each timestep respectively, and c p , p is the specific heat of the particle at constant pressure. Additionally, when the particle temperature is between the solidus and liquidus temperature, and the combustion-melting model is activated, Q pg is then equal to Q, representing the heat absorbed from the gas phase.

3. Case Study: Prototype Gasifier

In the case study for the prototype gasifier, the solids-packed bed is comprised of three types of particles (coal, MSW, and slag). Each particle is independently solved in terms of position, heat transfer, and force interactions from other particles or the gas phase. As mentioned previously in Section 2.1, the gas phase is assumed to be a mixture of gases, which are produced and consumed during chemical and physical reactions, and an additional species transport model is included to track the local mass fraction of each species.

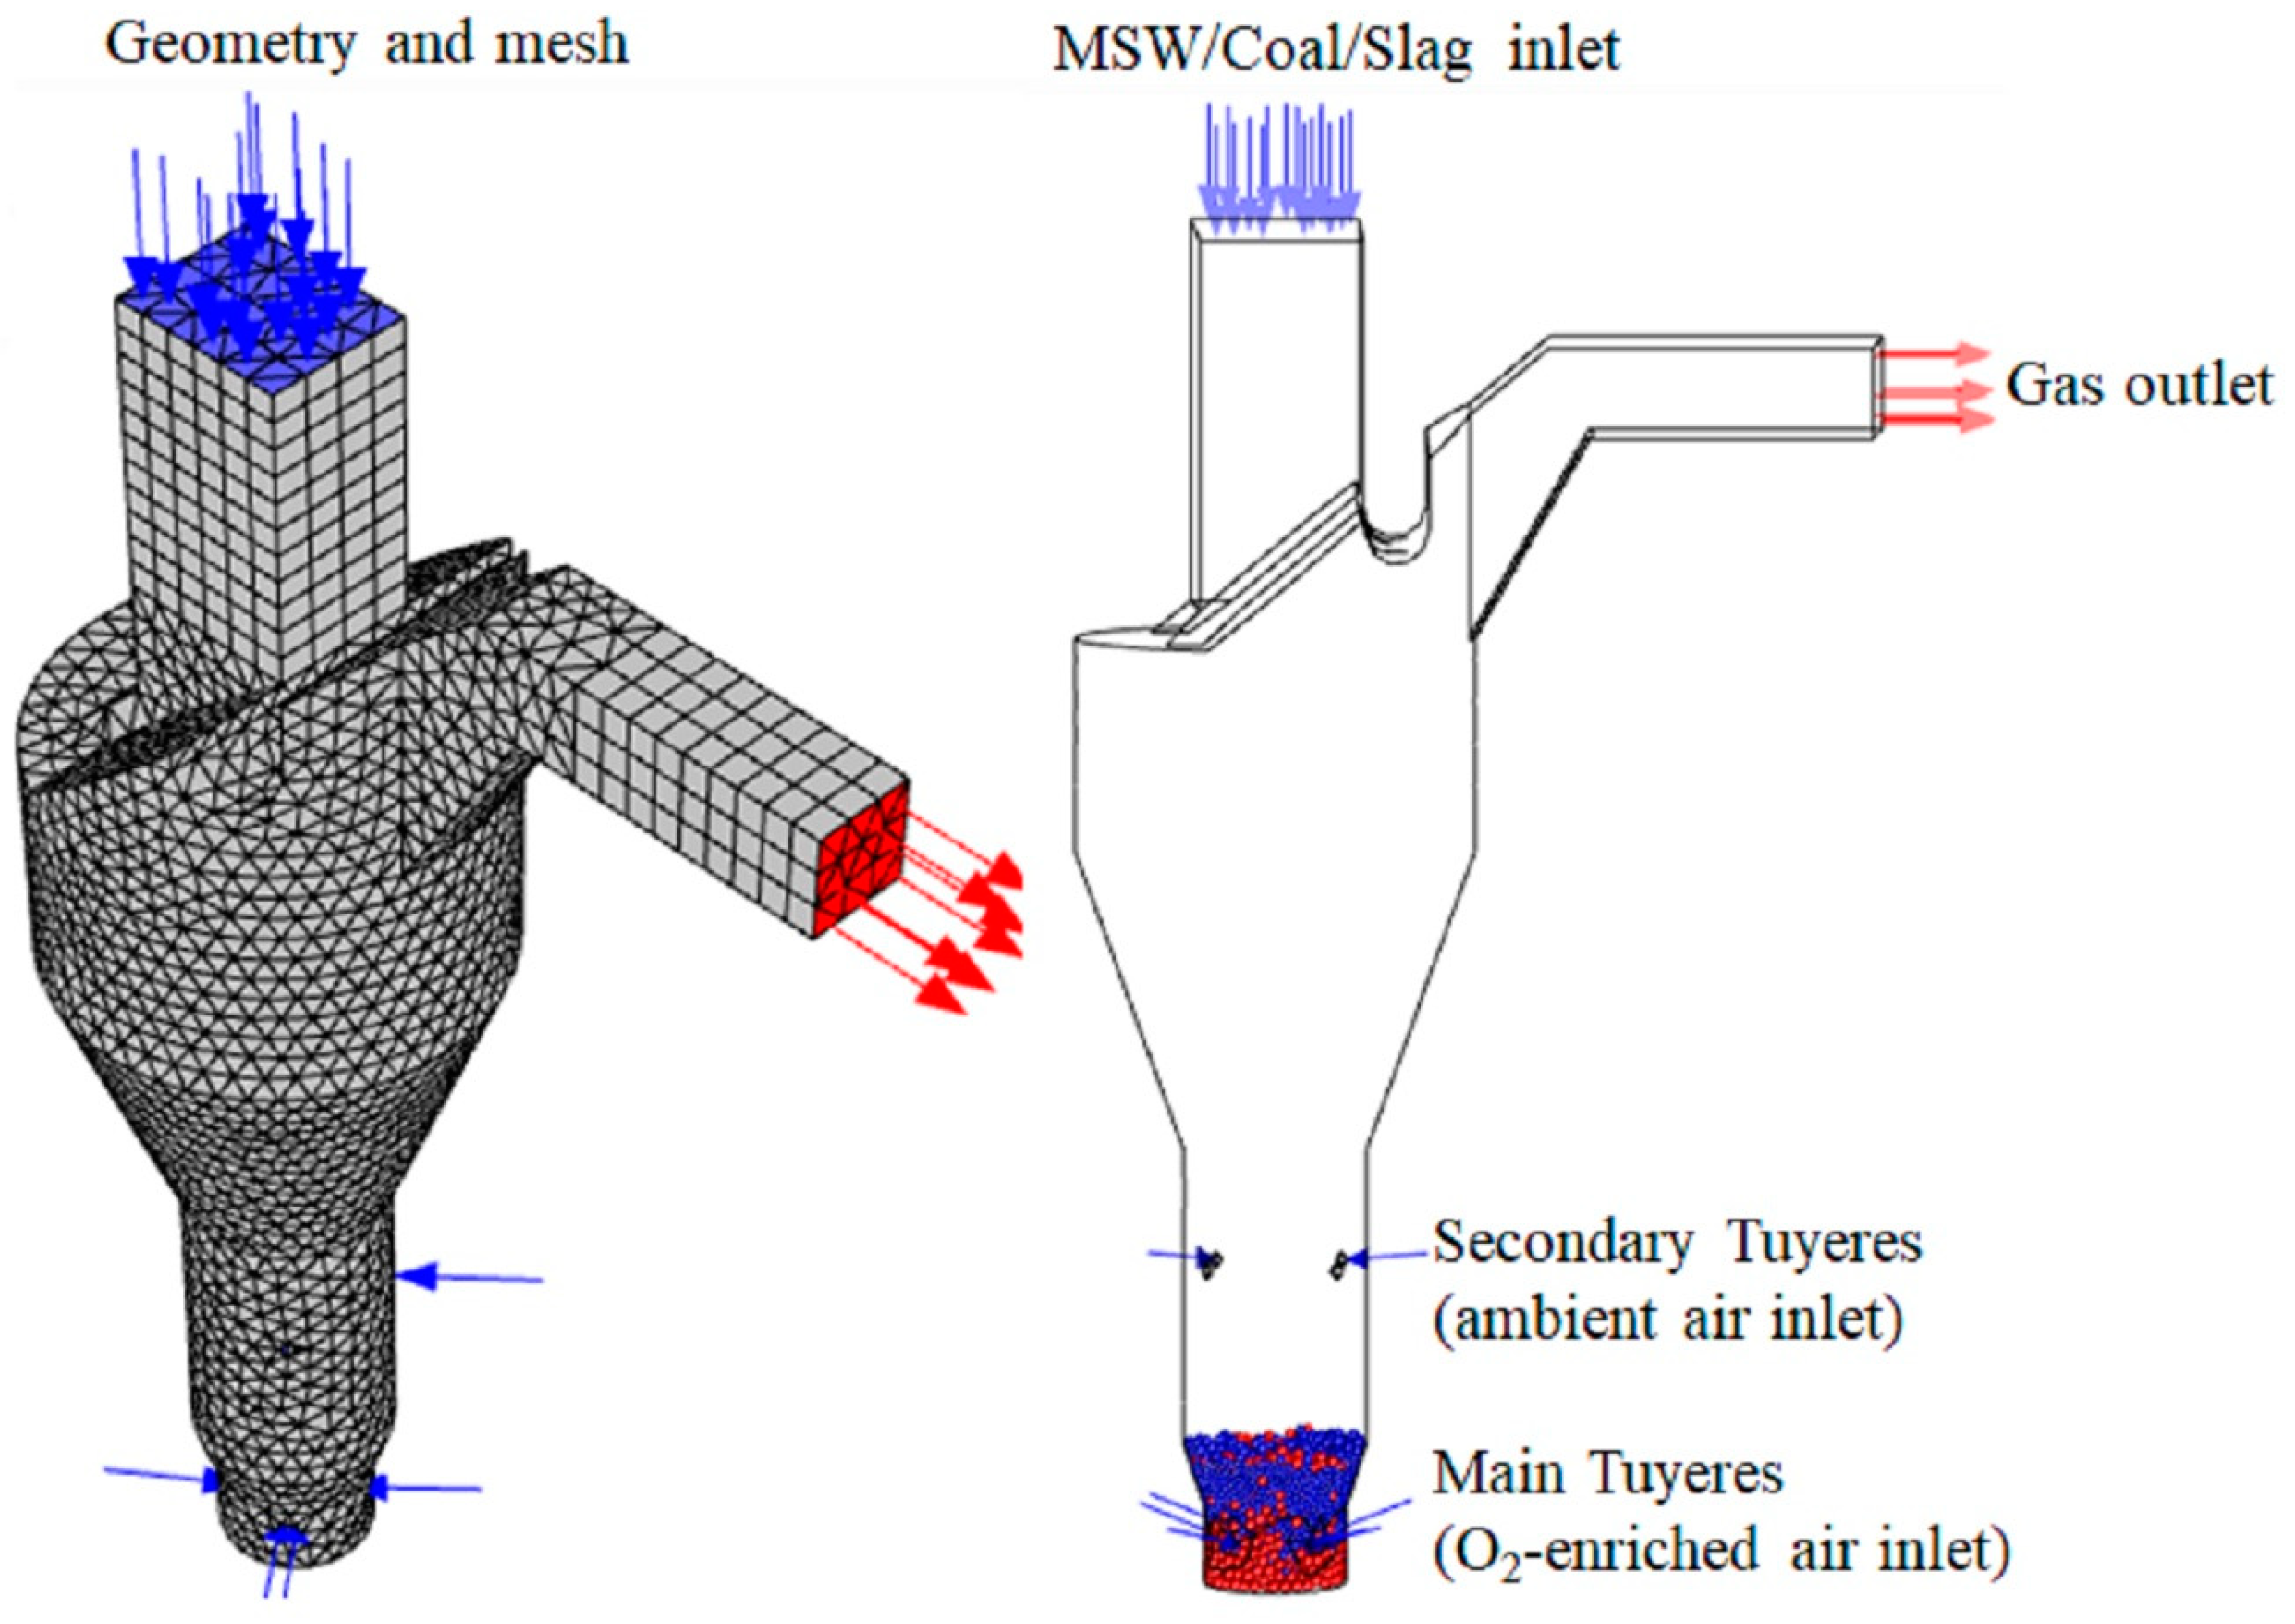
3.1. Simulation Model

The numerical simulations are performed based on the geometry and operating conditions of the slagging gasification plant for municipal solid wastes in the Waste-to-Energy Research Facility, Singapore [43]. Figure 3 shows the geometry and mesh of the gasifier, as well as the packing conditions. Due to the existence of DEM particles, the mesh must be of sufficient size (larger than particle size) in order to achieve numerical stability. Hence, the final size of the mesh was based on a reasonable particle-size ratio based on our experience and preliminary simulations. The gasifier has a single inlet at the top for the feeding of MSW, coal and solid slag, a single gas outlet for the exit of syngas, and a set of main tuyeres and secondary tuyeres to inject the oxygen-enriched air and ambient air, respectively. The MSW and coal particles form a fixed bed at the bottom of the gasifier, where the coal combustion provides the very high temperature required to heat the MSW, which is mostly gasified and eventually, with the melting of the remaining metal content, producing slag. The plant has a daily treatment capacity of 11.5 tonnes, with the bulk of the MSW feedstock being collected from the nearby campus of Nanyang Technological University. Slag recycling, whereby the molten slag after drainage from the bottom outlet is quenched in a water bath and then returned as feedstock to the inlet of the gasifier, is found to be necessary in order to achieve operational stability. Previously, the recycling of slag into the main reactor has been used in other applications such as steelmaking, in order to reduce the material cost and improve slag formation [44,45]. In the present application, the recycling leads to direct wastage of energy and adds to the cost of the operation, and should thus be minimised. The amount of slag recycling is presently determined empirically based on field experience, due to a lack of modelling tools for assessment.
The physical properties and composition of coal, MSW and slag particles are listed in Table 3. The coal particles are injected as auxiliary fuels, and they are assumed to be fully fixed carbon that can undergo combustion only. On the other hand, the MSW particles (comprised of moisture, volatile matter (VM), fixed carbon (FC) and ash) can be subjected to vaporization, devolatilization, combustion, and melting sequentially, as mentioned in Section 2.3. Finally, the slag particles are assumed to be inert and undergo only heating and melting. Due to the short simulation time and much higher liquidus temperature for coal (~1573 to 2873 K, depending on element composition [46]), it was assumed that only MSW and slag particles undergo melting, with the solidus temperature fixed at 1421 K and the liquidus temperature at 1573 K.
Numerous chemical reactions were included for the gasification processes for municipal solid wastes. They were classified into either homogenous (occurring within the gas phase) or heterogenous (occurring between solid and gas phase) reactions. The detailed chemical reactions and kinetics are listed in Table 4 [47].
In the simulations, the molten liquid phase and inert slag are assumed to be inactive in any chemical reactions. For homogenous reactions, the turbulence-chemistry interaction is based on the finite-rate/eddy-dissipation model, where the reaction rates are controlled by both the chemical kinetics and the turbulence mixing. Benzene is used to represent the formation of tar, with cracking into smaller gas molecules. For the heterogenous reactions, they are modelled as particle surface reactions and the rate of reaction modified based on Arrhenius kinetics [48,49,50].
The simulation is first performed for an initiation period from t = 0 to t = 5000 s with slag recycling. The feeding rate of MSW into the gasifier is kept constant at 446 kg/h, and the feeding rate of coal at 50 kg/h [43]. The solid slag recycling rate is kept constant at 130 kg/h. All solids are fed into the gasifier at 300 K. The main tuyere injects oxygen-enriched air at 400 Nm3/h to maintain the high temperature in the melting zone, while the secondary tuyeres provide ambient air to facilitate the chemical reactions inside the gasifier, such as tar cracking in the freeboard region. The initiation period includes the building up of the coke bed and is run for a comparatively long time (5000 s) to ensure the stability of the chemical reactions and the syngas composition. During this initiation period, simplifications are made by removing the MSW particles when their temperatures escalate to the liquidus temperature (1573 K). In other words, no molten liquid is added to the simulations. At the end of the period, the packed bed achieves a particle composition similar to site observations, while the composition of the exhaust gas and temperature became steady.
After the initiation period, the full CD-MELT is then used to assess the need for slag recycling, and the melting from the recycled solid slag or MSW particles are now added to the liquid molten slag phase. Two simulations are performed: the first one with the continuation of the slag recycling, and the other with the stoppage of the recycling. Both simulations are conducted for a period of 600 s from t = 5000 s to t = 5600 s, when the slag flow reaches a quasi-steady state. The molten slag is removed via UDF from a single cell located at the side wall and bottom of the reactor, which represents the slag outlet. In the real gasifier, thermocouples are used to measure the gas temperature at the upper, middle and lower parts of the furnace, as well as the exit gas outlet [43]. The temperature of the slag at the outlet is also measured with an infrared thermometer, and these temperature measurements are compared with the predicted results.

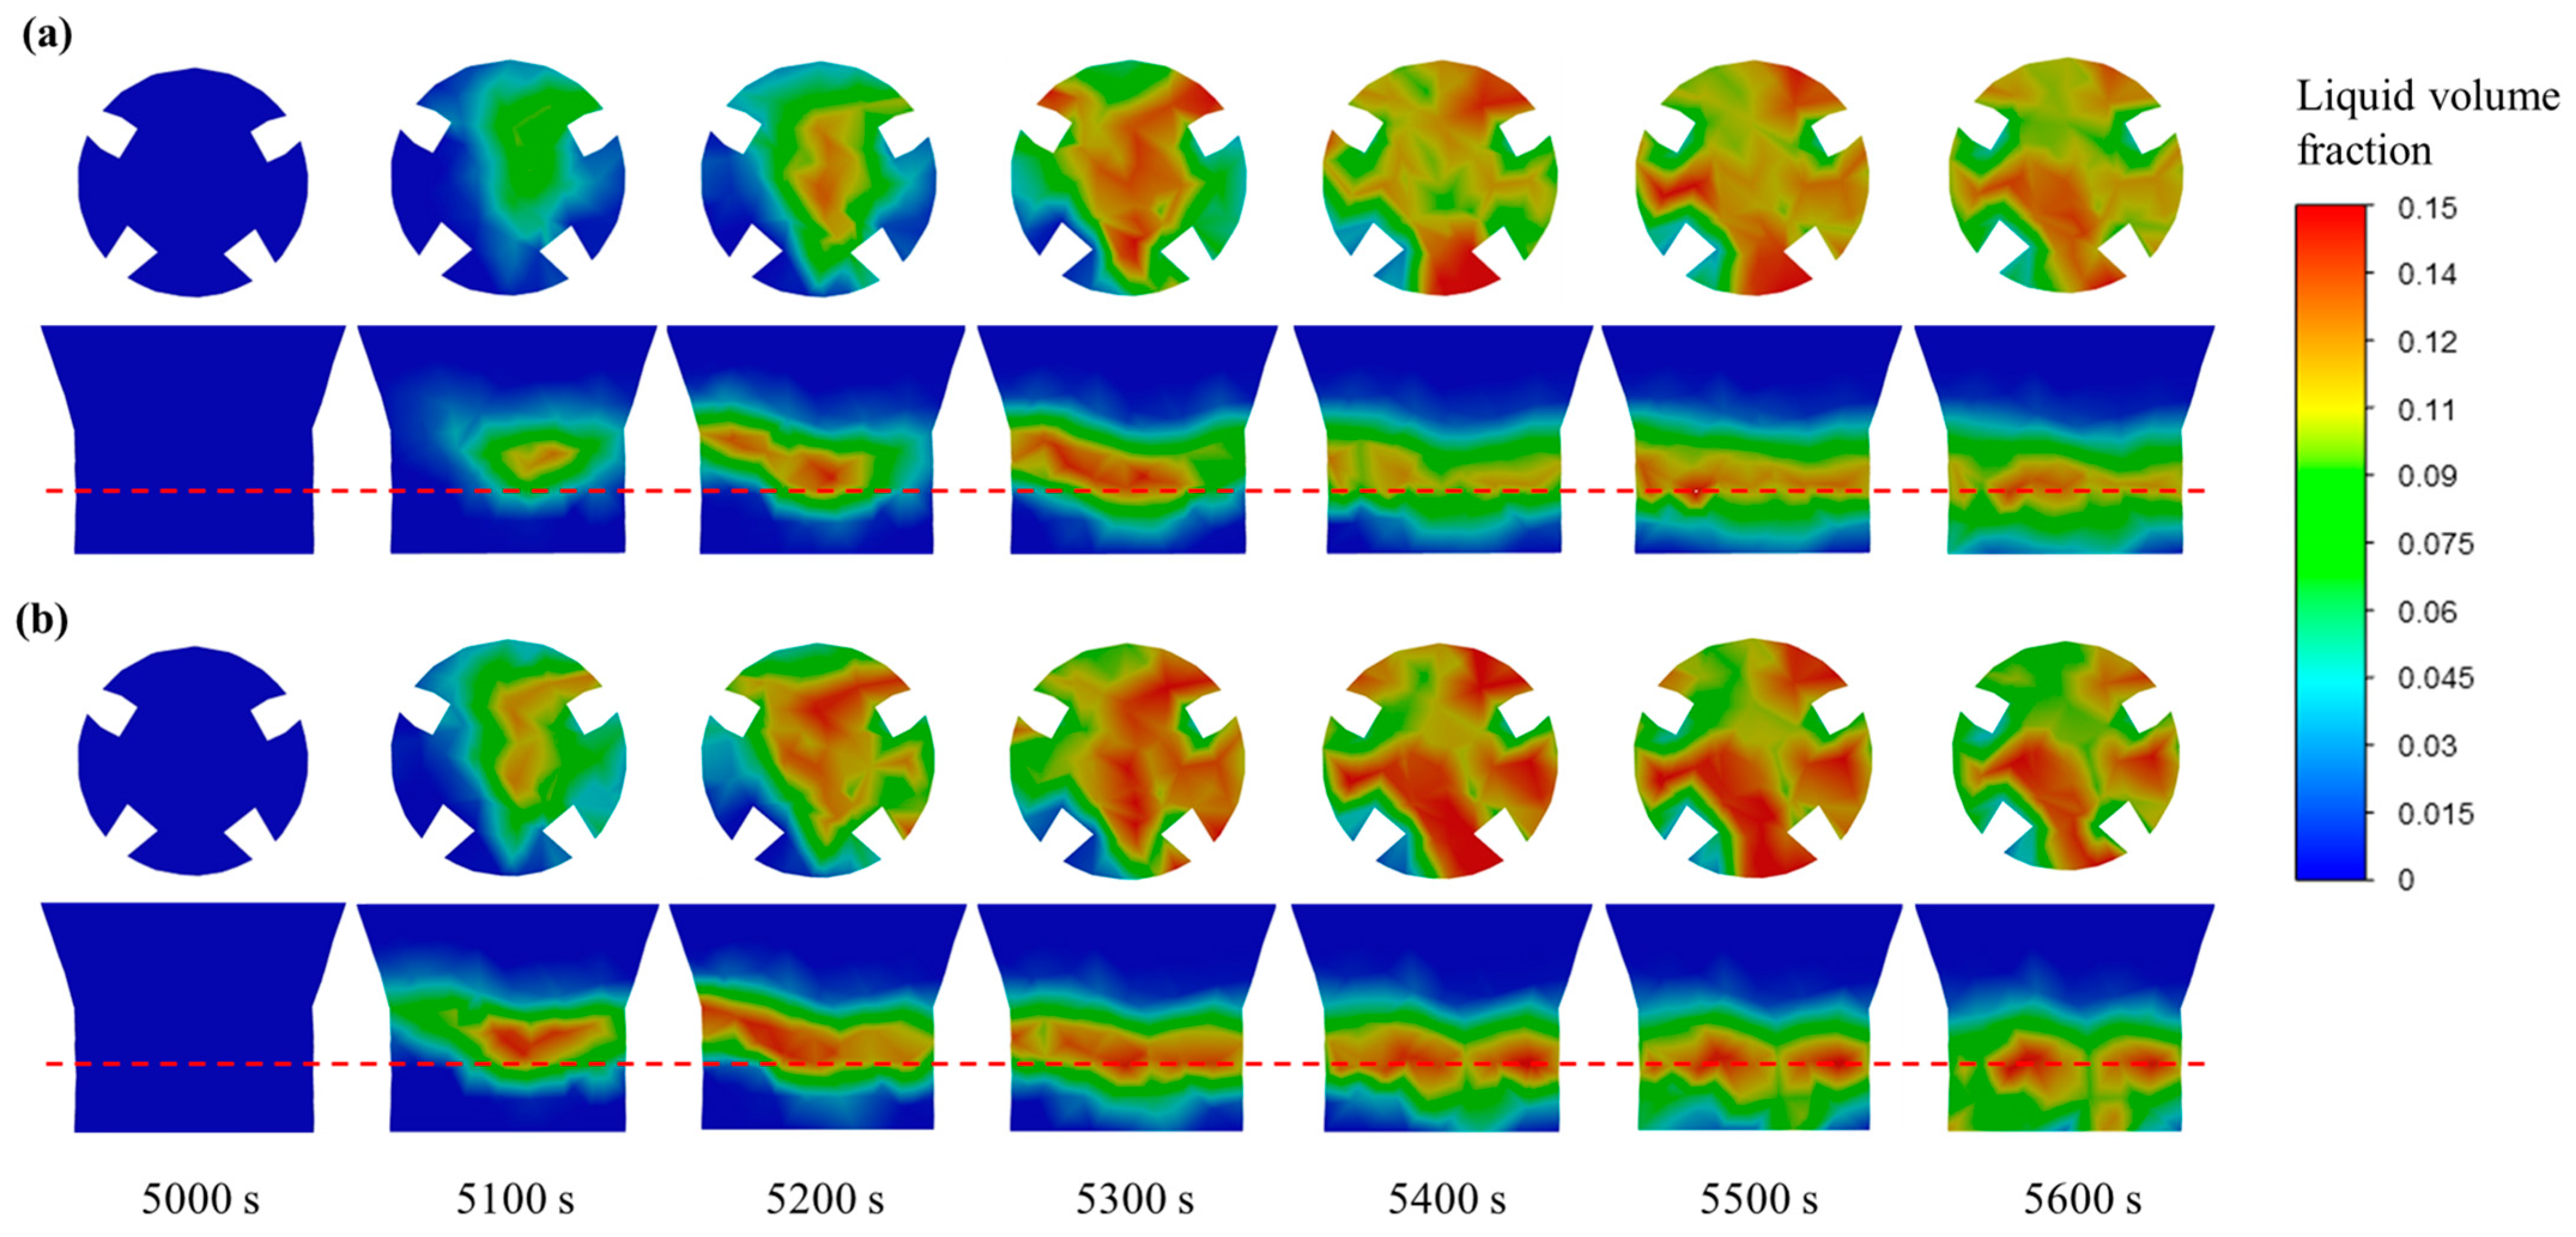
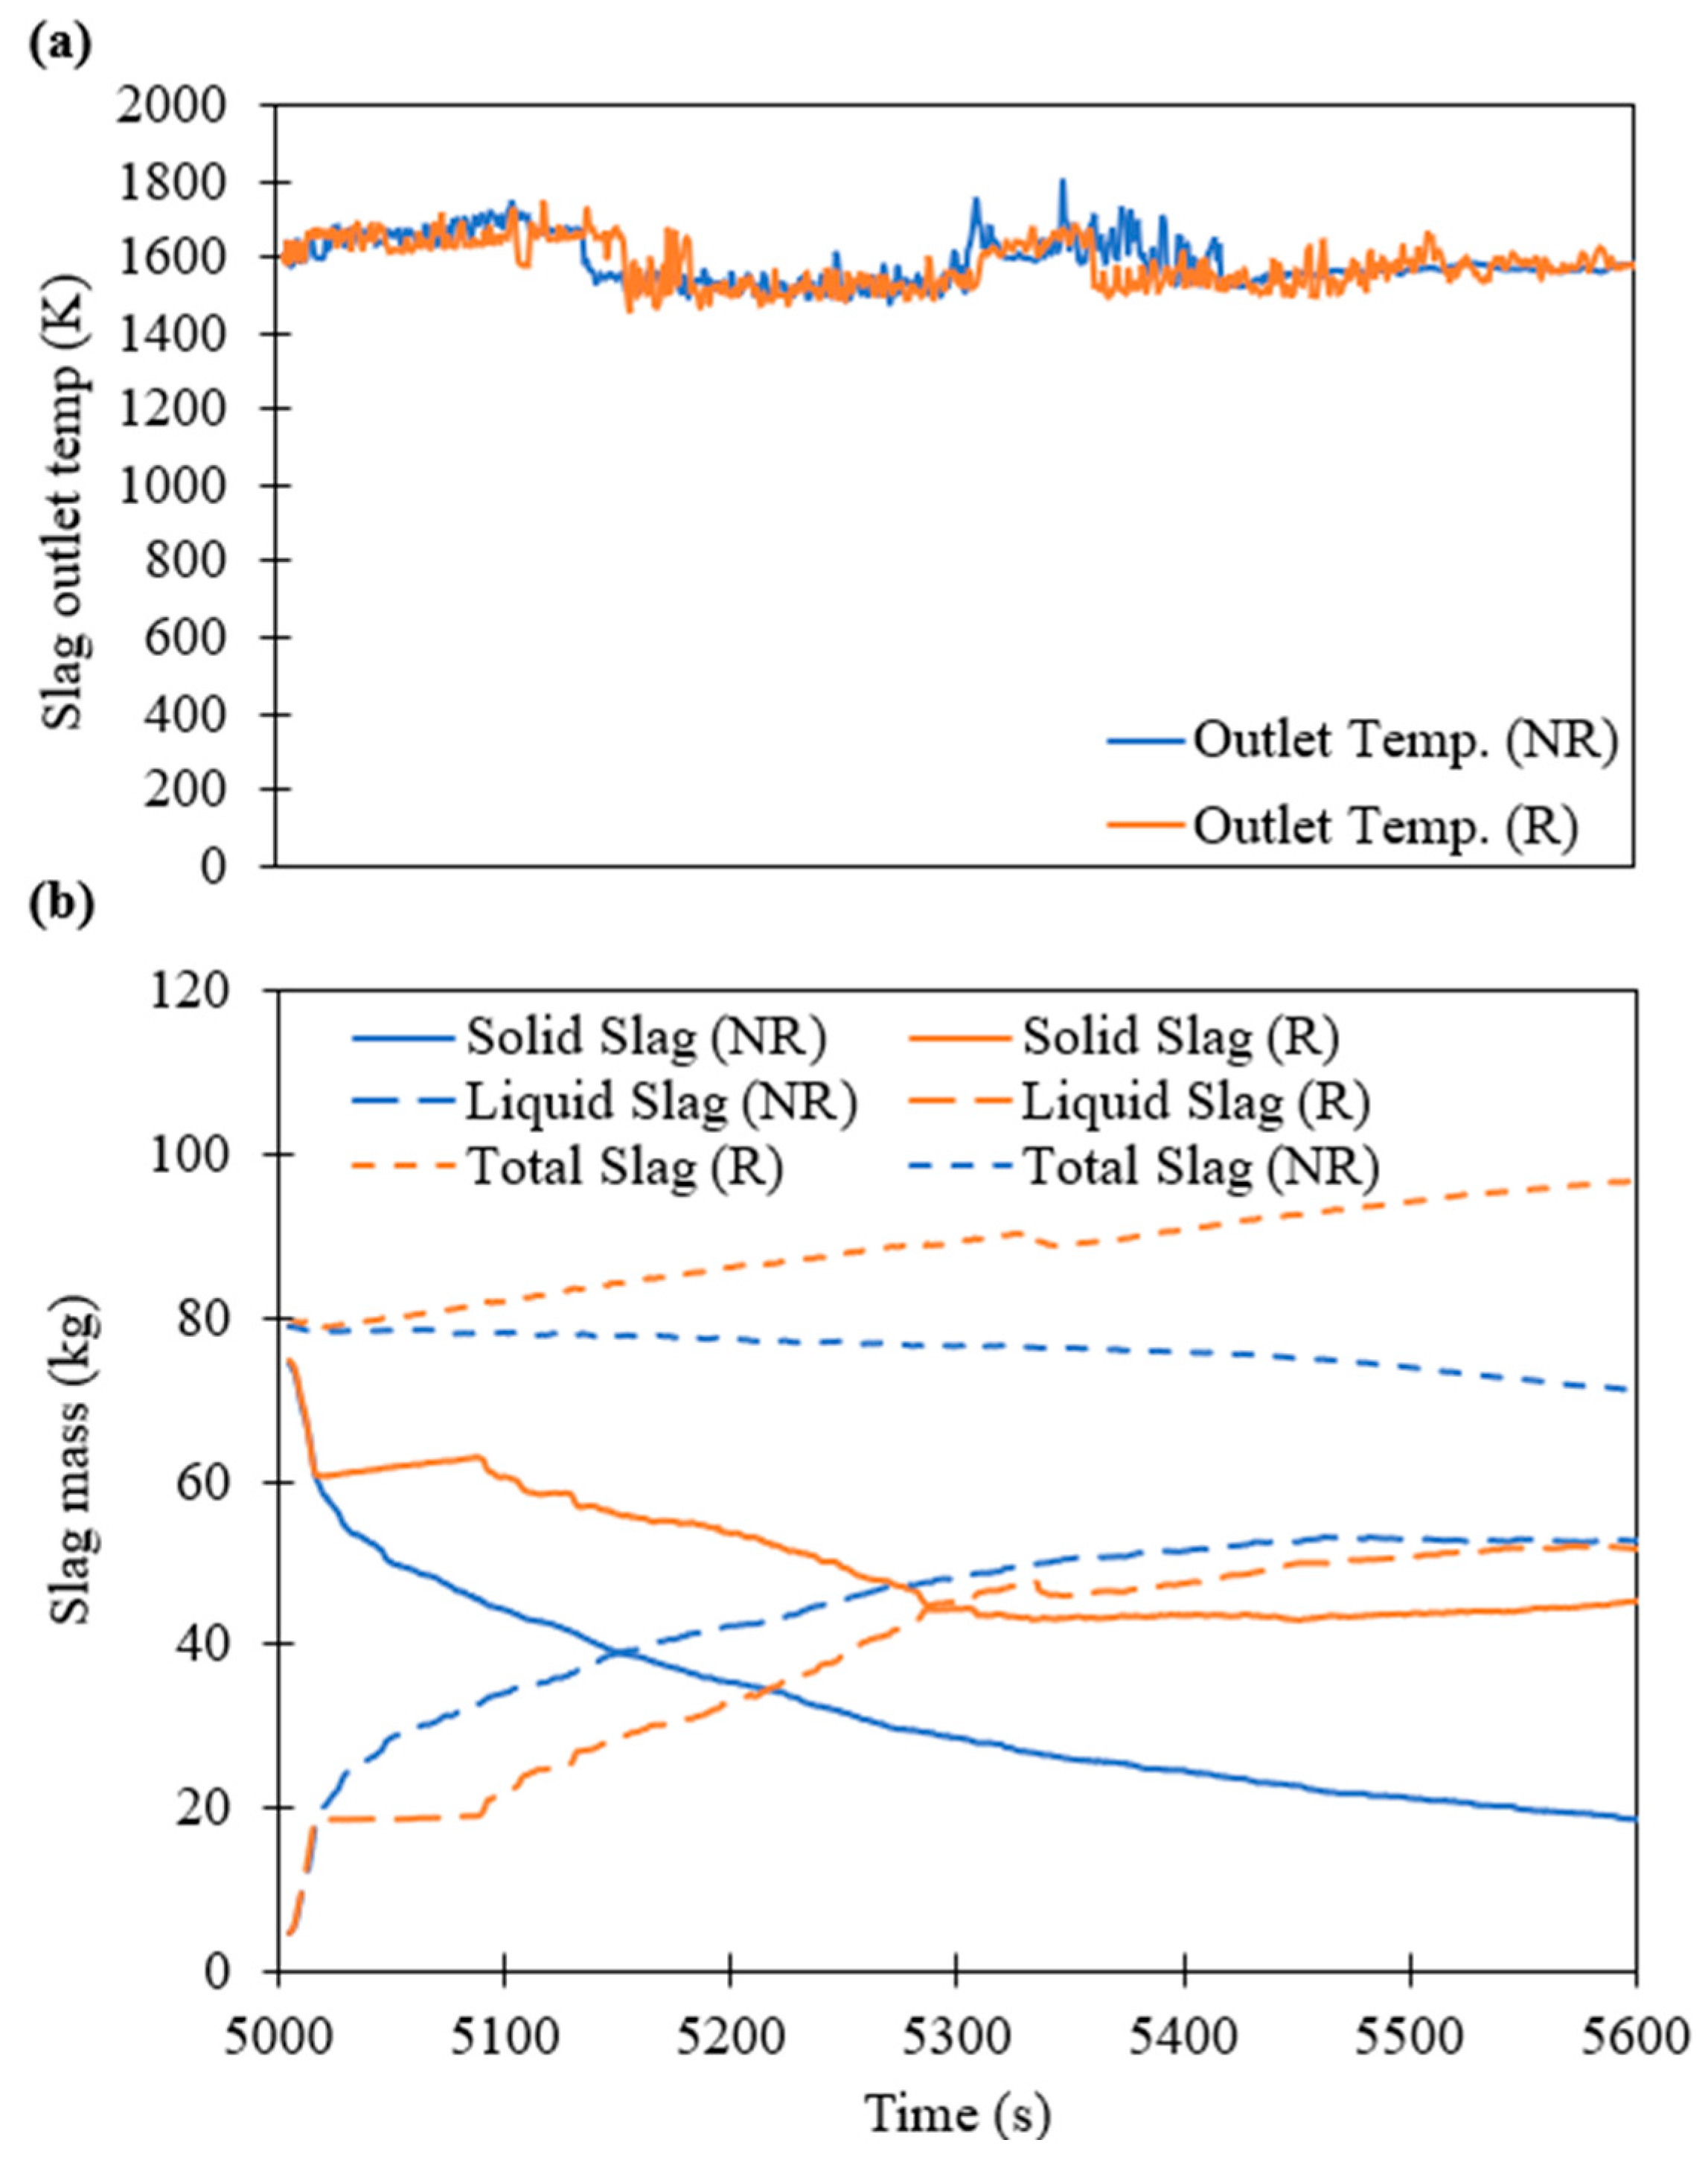
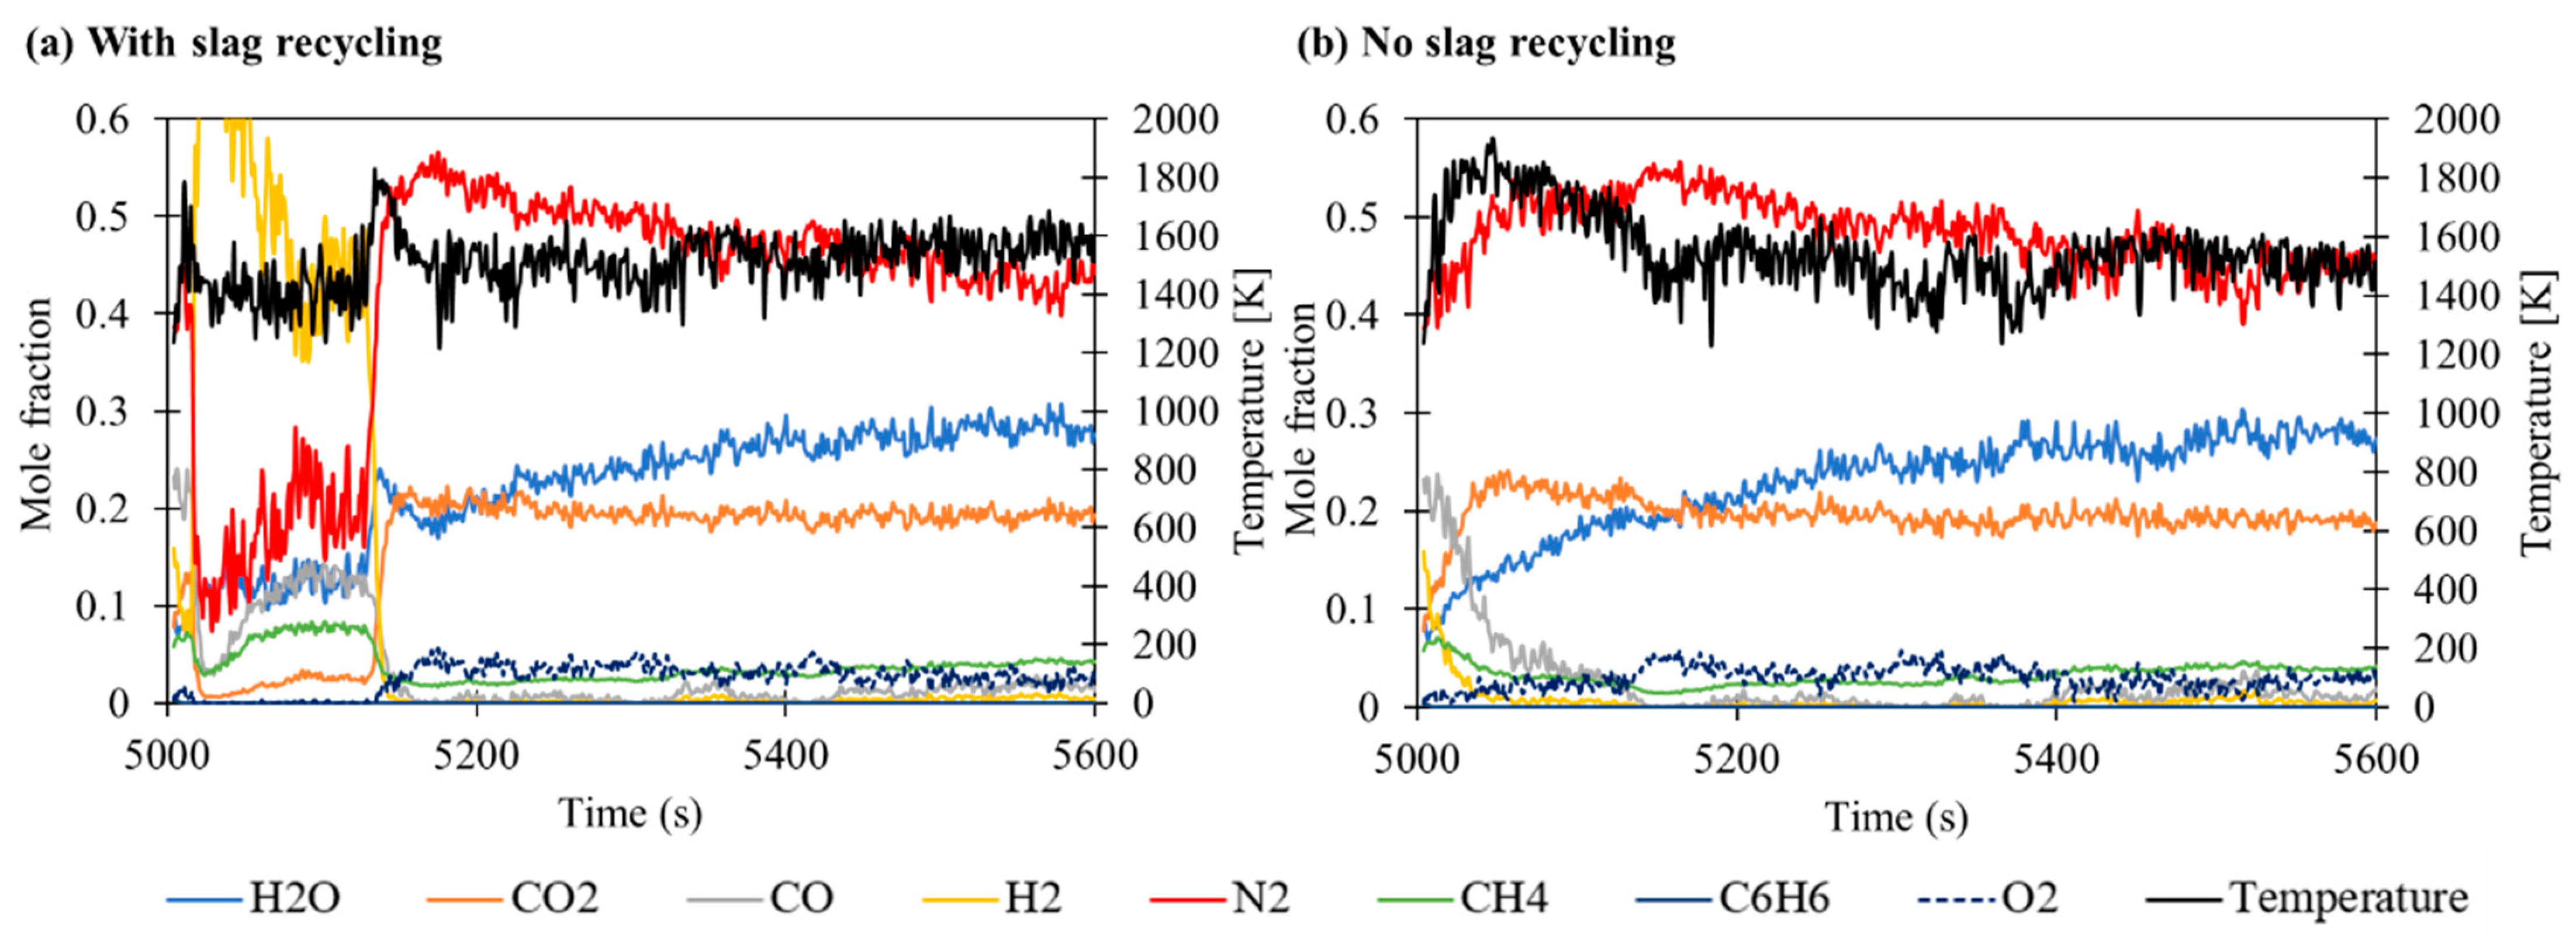
3.2. Effect of Slag Recycling on Slag Flow through Packed Bed

The following section compares the CD-MELT results for the two cases: with and without slag recycling. Figure 4a illustrates how a sample MSW particle changes in mass and temperature over time during this period inside the gasifier, while the liquid, volatile, and char mass fractions are shown in Figure 4b.
During vaporization, the MSW particle undergoes a linear reduction in mass while its temperature remains constant at approximately 373 K. After its liquid fraction decreases to zero, devolatilization occurs. Volatile gases are emitted from the particle surface and the particle temperature increases rapidly. When the devolatilization is completed, combustion and pyrolysis occur where the char fraction is consumed, and the particle temperature continues to increase steadily. Upon reaching the solidus temperature, the particle begins to melt and the solid particle mass reduces. The char fraction decreases rapidly upon the initiation of the combustion-melting. The particle is finally removed when the mass loss fraction exceeds 0.95, which occurs at a temperature of 1517 K, as shown in Figure 4a.
To investigate the need for slag recycling, the liquid slag flow through the bed is tracked at intervals of 100 s. Figure 5 shows the liquid volume fraction at the vertical cross-section of the centre plane (z = 0 m) as well as the horizontal cross-section within the packed bed at y = 0.25 m. The view plane is focused on the bottom packed bed of the gasifier for a clearer comparison. In both simulations, the liquid molten slag accumulates in and permeates through the bed over time. After reaching the slag outlet located at the bottom right corner in centre plane, z = 0.0 m, the liquid slag is then removed via UDF.
With slag recycling, the simulation results (Figure 5a) show that the distribution of molten slag is relatively uniform within the packed bed with the formation of a single horizontal layer. In contrast, the distribution is uneven without the slag recycling (Figure 5b), and pockets of accumulation with higher molten slag density can be observed, especially around the front tuyere. This accumulation diminishes the functioning of the packed bed in processing the MSW particles due to the lower temperature of the molten slag compared to the bed media, and the slag tapping would become challenging, which corresponds to the field experience from the plant operator that slag recycling is required to mitigate the process disruption.
The predictions of solid, liquid, and total slag mass, as well as the slag temperature at the outlet, are plotted in Figure 6 with and without slag recycling. In Figure 6a, the slag temperature at the outlet is nearly the same for both cases from t = 5400 s onwards, with predicted average temperature for the slag recycling being 1564 ± 33 K, compared to 1562 ± 20 K without slag recycling. The predicted temperature is slightly lower than what is observed at the prototype gasifier of 1638 ± 43 K [43]. This can be attributed to the values of solidus and liquidus temperature for the MSW and slag particles, which differ significantly but are assumed to be similar in CD-MELT as the first approximation.
In addition, other factors not considered in the simulations, such as the ash fusion temperature of coal, heat loss from the boundary wall, and thermal conductivity of slag, can all have little effect on the slag outlet temperature. Comparing the predicted mass of solid and liquid slag in Figure 6b, it is observed that the liquid slag is generated at a higher rate initially without slag recycling, but the rate of liquid slag production tapers off and eventually reaches a similar mass as the slag recycling case. This can be attributed to the fact that since the recycled slag is injected at 300 K, some of the energy in the gasifier is used to heat and melt the injected solid slag; the temperature of the gasifier is thus lower, leading to a lower initial melting rate.
The simulated exit gas composition and temperature are plotted in Figure 7. The values in the figure represent the area-weighted average of the y-z vertical cross-section at the gas outlet. The results in the first 200 s, from t = 5000 to t = 5200 s, show large fluctuations in the syngas composition with slag recycling, which can be attributed to the increase in H2. As discussed above, the slag recycling could cause a lower temperature in the gasifier, favouring the forward water-gas shift reaction which is mildly exothermic. Nevertheless, at the quasi-steady state, the exit gas composition is no longer significantly affected by the slag recycling, as the solid slag does not take part in any chemical reactions.
The area-averaged temperature of the gas mixture is recorded at different heights within the gasifier over a period of two minutes. The results are compared with the published data [43] in Figure 8. For the packed bed, the gas temperature is the highest at the bottom due to the charcoal combustion enhanced by the oxygen-enriched air, while the temperature decreases towards the surface (y ~ 1.0 m) due to the endothermic reactions of vaporization and devolatilization. In general, the case with slag recycling has higher temperatures (difference of ~60 K) in the freeboard and fixed bed, except for near the bed surface, due to the absorbed heat by the injected slag particles. This is due to the heat retained by the increased amount of solid slag, which is transferred via convection to the air. When comparing with the measured data from the case study [43], the predictions of the gas temperature at the outlet are significantly higher than the temperatures measured via thermocouples, which could be attributed to the heat loss in the gasifier through the inlet that was not accounted for in the simulations. Additionally, the discrepancy is also due to the difficulty of implementing the corrective energy source term to the gas phase, which is elaborated in the following section. Hence, the focus of the results is the comparison of the case study with and without slag recycling, rather than the site observation.

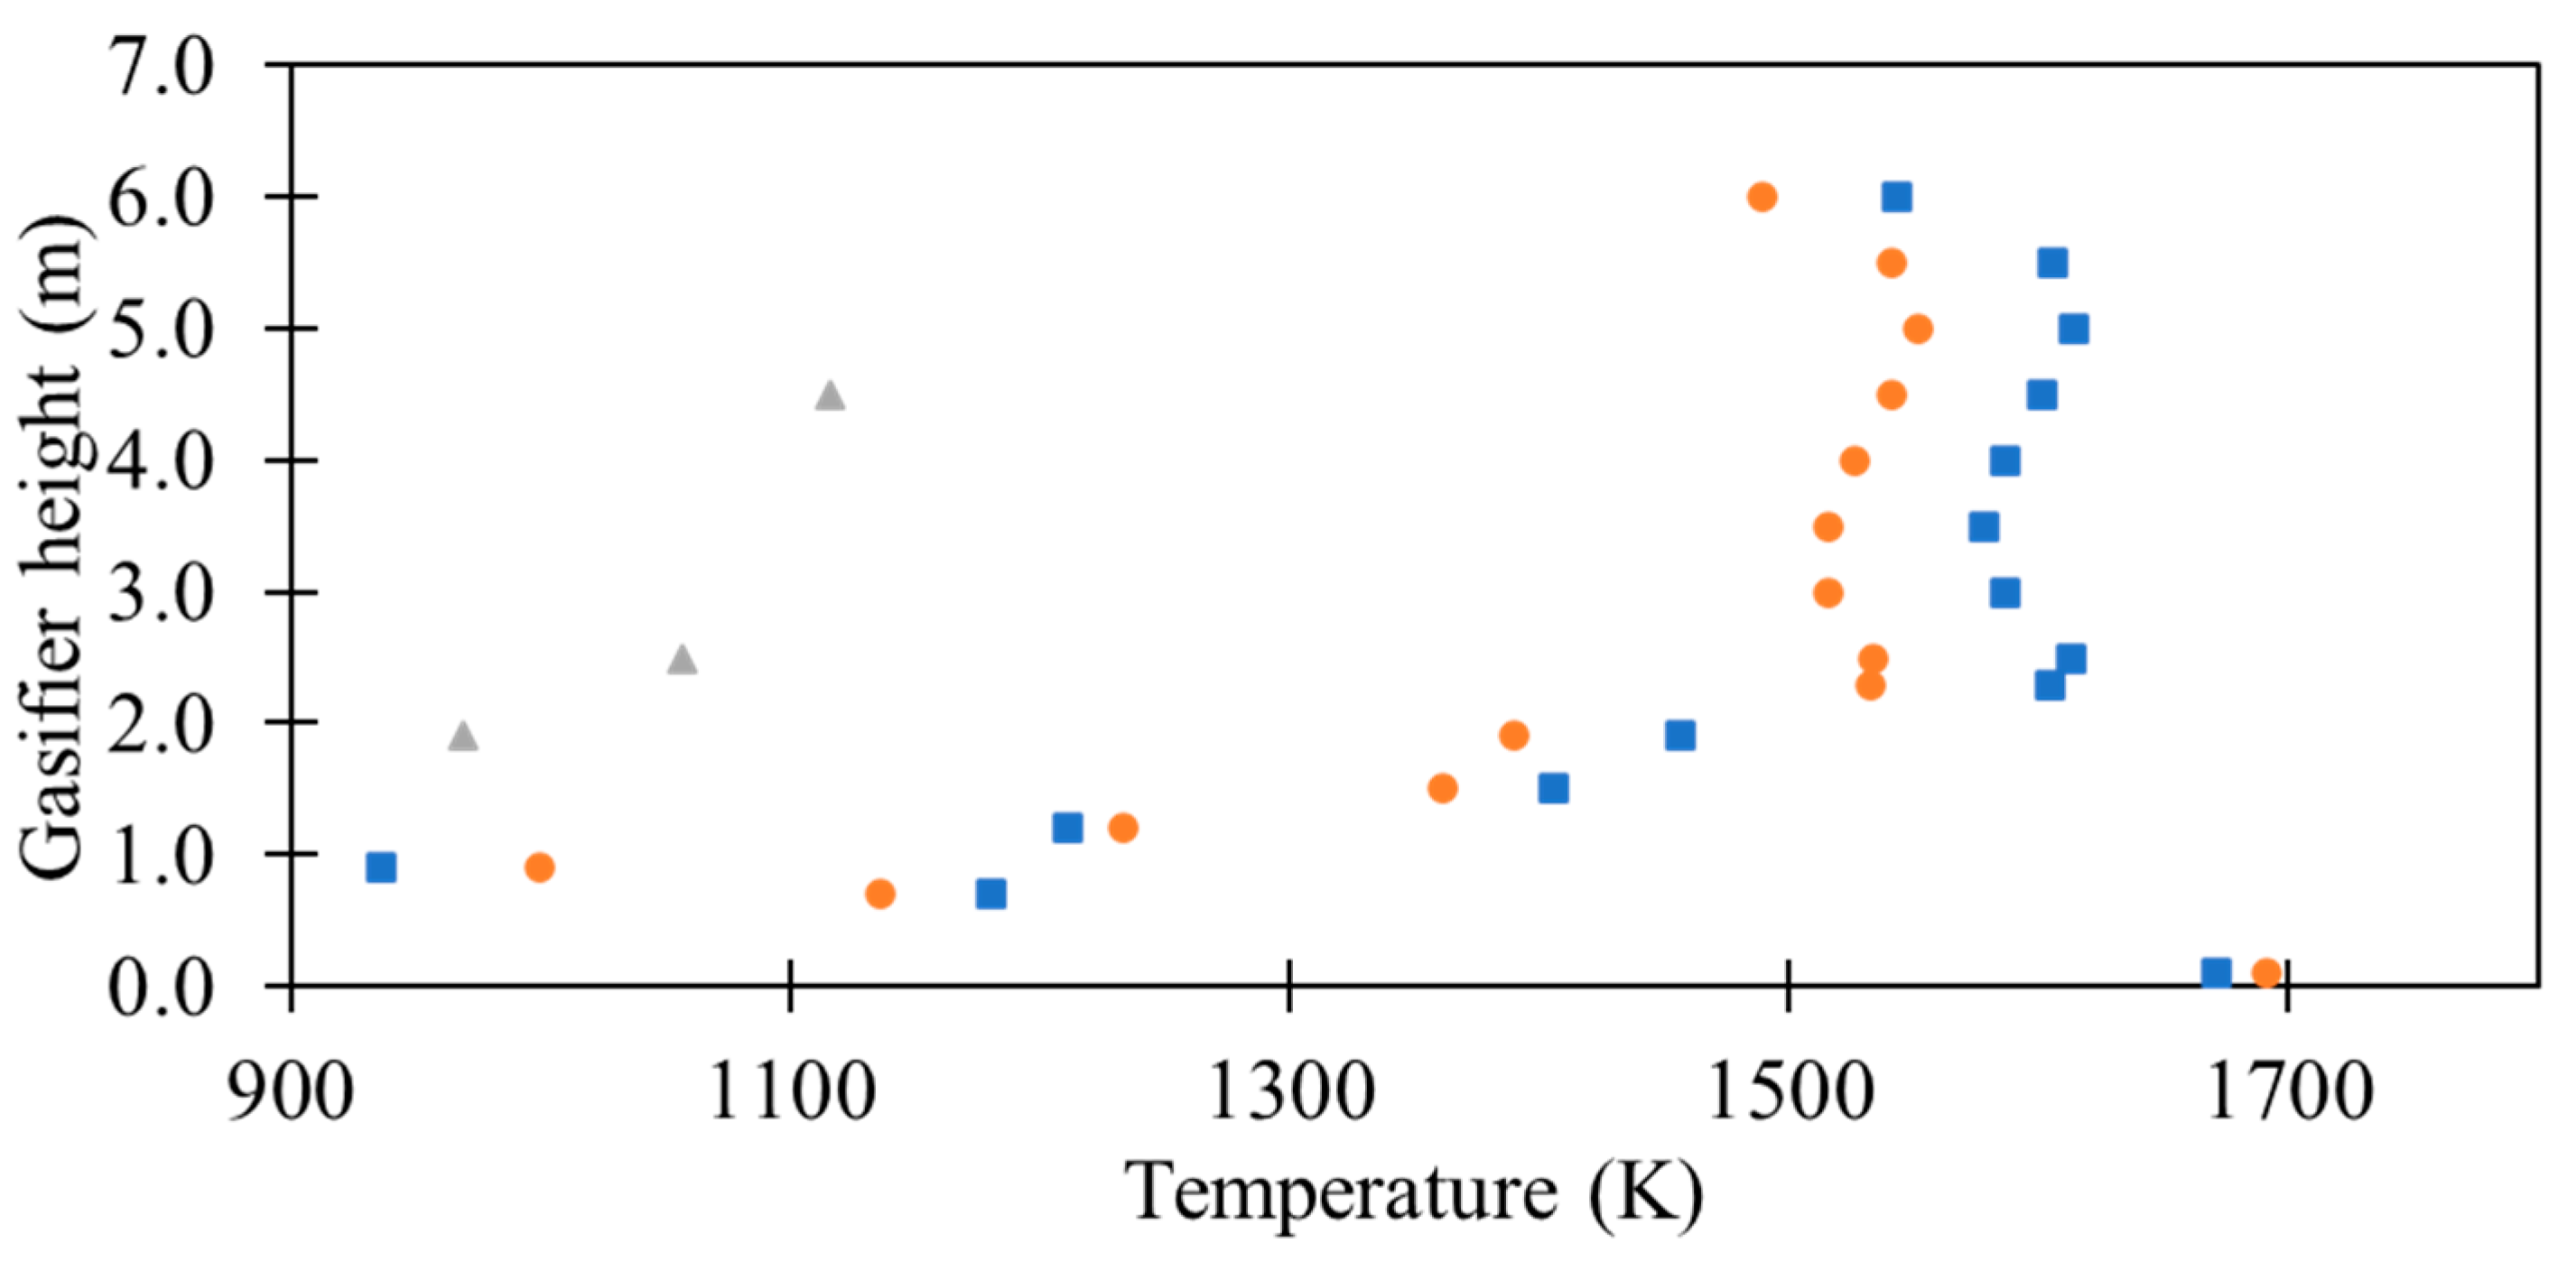
3.3. Challenges of the Melting Model

Several challenges were encountered during the implementation of the combustion-melting model in the simulations. Prior to t = 5000 s, there were existing MSW and slag particles in the system. These particles did not undergo melting (only combustion and inert heating) in order to speed up the computational time, and were removed upon reaching liquidus temperature. However, the melting model requires the variable of the particle diameter when it first reaches solidus temperature. Hence, the results of liquid slag observed are only from the melting of the slag particles, which were below solidus temperature at t = 5000 s; after that time, the melting model was then activated. This can be improved in the future if faster workstations are available. Additionally, it was noted that when a particle is removed from the system, the enthalpy of the particle should be transferred entirely to the liquid phase. However, due to the nature of the specific heat capacity being composition- and temperature-dependent, the exact particle enthalpy is unknown and some differences may be introduced. It is acknowledged that this may lead to the results being less accurate and that this aspect should be further improved in the future.
There were also issues with determining the corrective source term for ANSYS Fluent. During the preliminary development for the non-isothermal melting model, it was noted that a corrective source term was required due to the way the fluid was coupled with the particles in ANSYS Fluent. Mass and energy sources were computed during every DEM timestep based on the change in the mass and enthalpy of the particles, and added to the primary phase by default (programmed into the commercial software). This was acceptable for the simulation with two-phase flows where the solid was mixing directly with the primary phase (liquid) after melting, but where the primary phase was gaseous and no mass transfer should have occurred to or from that phase, the energy transfer term was also incorrect. Hence, corrective source terms for mass and energy had to be introduced to modify the default source terms. Due to the low velocity of the particles involved, corrective momentum source terms were not included. The corrective source terms were formulated given information from the ANSYS theory guide [33]. However, there was difficulty in determining the exact formulation of the corrective source term for the present study, as it was unclear how the char fraction of the particle factored into the equation, if at all. Numerical instabilities can occur after a certain point in the simulations and could not be resolved despite repeated attempts. Further investigation into the reason for the numerical instabilities will be needed in the future.

4. Conclusions

CD-MELT is extended to three-phase, non-isothermal, simultaneous combustion and melting in this study. The improved CFD-DEM model can be used for simulating multiphase flows with reactions, particularly in engineering applications with significant volume fractions of solid and liquid and with solid melting. It is especially useful for cases where the solid particles are separate or have different properties and melting rates, such as in mixed wastes gasifiers. In particular, CD-MELT is applied to simulate the operation of the slagging gasification plant for municipal solid wastes in the Waste-to-Energy Research Facility, Singapore. The simulation results agree well with the measurements from the facility, including the temperature of the slag at the outlet, exhaust gas composition, and liquid slag mass within the gasifier at a quasi-steady state (with deviation of less than 10%). The results also show that the distribution of the liquid slag within the packed bed is more uniform with slag recycling, which provides a plausible explanation for the operators’ experience as to why slag recycling is important for process stability. Thus, the present study shows that CD-MELT can be used to assess the need as well as quantity of slag recycling, which up to now is determined solely through empirical experience for MSW gasifiers. Hence, it can act as an effective tool to aid the design and optimisation of full-scale gasifiers for municipal solid wastes in the future. Nevertheless, we note that there remains a notable difference between the predicted and observed temperatures of the gas phases in the freeboard region, which can be attributed to possible air exchanges (and heat losses) through the inlets in field operations, as well as the difficulty of implementing the corrective energy source term to the gas phase. Further improvement of the modelling approach and more case studies of field applications are thus still necessary in the future.

Author Contributions

Conceptualisation, G.S. and A.W.-K.L.; formal analysis, G.S., H.Z. and A.W.-K.L.; funding acquisition, A.W.-K.L.; investigation, G.S., H.Z. and A.W.-K.L.; methodology, G.S.; resources, A.W.-K.L.; software, G.S.; supervision, H.Z., A.W.-K.L. and C.Y.; visualisation, G.S.; writing—original draft, G.S.; writing—review and editing, H.Z., A.W.-K.L. and C.Y. All authors have read and agreed to the published version of the manuscript.

Funding

This research received no external funding.

Institutional Review Board Statement

Not applicable.

Informed Consent Statement

Not applicable.

Data Availability Statement

Not applicable.

Acknowledgments

The authors would like to acknowledge the Nanyang Environment and Water Research Institute (NEWRI), Nanyang Technological University, Singapore for their administrative and technical support.

Conflicts of Interest

The authors declare no conflict of interest.

Nomenclature/Abbreviations

Nomenclature
Apparticle surface area
cpspecific heat capacity
CFchar mass fraction
ddiameter
F force
f h fraction of heat absorbed by solid particle
g gravitational acceleration
henthalpy
h c convective heat transfer coefficient
h m latent heat of melting
J diffusive flux
K p q interphase exchange coefficient between phase p and phase q
LFliquid mass fraction
mmass
m p , 0 initial particle mass
ppressure
Qheat transfer term
ReReynolds number
Rirate of production via chemical reaction or particle surface reactions
ttime
Ttemperature
v velocity
VFvolatile mass fraction
Ssource term
x position
Ylocal mass fraction of species within gas mixture
Greek symbols
αphase volume fraction
βmass loss fraction
ρdensity
τ = stress tensor
μ dynamic viscosity
Subscripts
collcollision
ggas
lliquid
p particle
refreference
Abbreviations
CFDComputational Fluid Dynamics
DEMDiscrete Element Method
DPMDiscrete Phase Model
FC Fixed Carbon
MSWMunicipal Solid Waste
UDFUser-Defined Function
VMVolatile Matter

Appendix A

Table A1. Process flow of combustion-melting model.
Char Fraction > 0Char Fraction = 0
Step 1Obtain the new particle temperature T p , assuming combustion takes place.Obtain the new particle temperature T p , assuming inert heating takes place.
Step 2Calculate the heat absorbed from fluid and combustion and add to particle enthalpy, h p .
Q = m p c p d T p d t = h c A p ( T f T p ) f h d m p d t H r e a c
Calculate the heat absorbed from fluid and add to particle enthalpy, h p .
Q = m p c p d T p d t = h c A p ( T f T p )
Step 3“State 1”: Record particle mass and diameter after combustion, and particle temperature before combustion.“State 1”: Record particle temperature and diameter before inert heating.
Step 4 to Step 9 are the same regardless of char fraction **
Step 4Assuming that particle temperature rises to temperature T p , calculate theoretical particle diameter and mass based on the new temperature. d p , 0 is the particle diameter just before melting occurs and is saved for every particle as the diameter when the particle first reaches the solidus temperature.
d p = d p , 0 d p , 0 T p T s T l T s
Particle density is assumed to be constant throughout the melting process by setting it to the particle density when the particle first reaches solidus temperature.
The theoretical mass is then calculated as m p = ρ p , 0 π 6 ( d p 3 ) .
Step 5Compare particle enthalpy with the calculated heat required for the change in mass (sum of sensible and latent heat). d m p d t for char fraction > 0 is the change in mass from the particle mass after combustion.
Compare h p with m p c p d T p d t + ( d m p d t h m ) .
Step 6If particle enthalpy is sufficient, melting occurs, and particle changes in mass, temperature, and diameter take place according to Step 4. Heat required is subtracted from particle enthalpy.
Step 7If particle enthalpy is insufficient, no melting occurs, and particle values return to those saved in Step 3 (“State 1”). This means that for char fraction > 0, particle mass is still lost to combustion.
Step 8Calculate the mass loss fraction, β = 1 − m p m p , 0 , where m p , 0 is the particle mass recorded at the start of the melting process.
Step 9Convert to volumetric and add the relevant source terms to the gas (energy: Q pg ) and molten liquid phase (mass: S mass ; momentum: S mass v f ; energy: S mass ( h melt h ref ) ).

References

  1. Arena, U. Process and technological aspects of municipal solid waste gasification. A review. Waste Manag. 2012, 32, 625–639. [Google Scholar] [CrossRef] [PubMed]
  2. Srivastava, T. Renewable energy (Gasification). Adv. Electron. Electr. Eng. 2013, 3, 1243–1250. [Google Scholar]
  3. Klimanek, A.; Adamczyk, W.; Katelbach-Woźniak, A.; Węcel, G.; Szlęk, A. Towards a hybrid Eulerian–Lagrangian CFD modeling of coal gasification in a circulating fluidized bed reactor. Fuel 2015, 152, 131–137. [Google Scholar] [CrossRef]
  4. Gao, X.; Zhang, Y.; Li, B.; Yu, X. Model development for biomass gasification in an entrained flow gasifier using intrinsic reaction rate submodel. Energy Convers. Manag. 2016, 108, 120–131. [Google Scholar] [CrossRef]
  5. Baruah, D.C.; Baruah, D.C.; Hazarika, M.K. Artificial neural network based modeling of biomass gasification in fixed bed downdraft gasifiers. Biomass Bioenergy 2017, 98, 264–271. [Google Scholar] [CrossRef]
  6. Yucel, O.; Aydin, E.S.; Sadikoglu, H. Comparison of the different artificial neural networks in prediction of biomass gasification products. Int. J. Energy Res. 2019, 43, 5992–6003. [Google Scholar] [CrossRef]
  7. Hu, Z.; Peng, Y.; Sun, F.; Chen, S.; Zhou, Y. Thermodynamic equilibrium simulation on the synthesis gas composition in the context of underground coal gasification. Fuel 2021, 293, 120462. [Google Scholar] [CrossRef]
  8. Onabanjo, T.; Patchigolla, K.; Wagland, S.T.; Fidalgo, B.; Kolios, A.; McAdam, E.; Parker, A.; Williams, L.; Tyrrel, S.; Cartmell, E. Energy recovery from human faeces via gasification: A thermodynamic equilibrium modelling approach. Energy Convers. Manag. 2016, 118, 364–376. [Google Scholar] [CrossRef] [Green Version]
  9. de Lemos, M.J.S.; Pivem, A.C. Turbulent flow with combustion in a moving bed. Int. Commun. Heat Mass Transf. 2012, 39, 1–7. [Google Scholar] [CrossRef]
  10. Ramos, A.; Monteiro, E.; Rouboa, A. Numerical approaches and comprehensive models for gasification process: A review. Renew. Sustain. Energy Rev. 2019, 110, 188–206. [Google Scholar] [CrossRef]
  11. Ramos, A.; Monteiro, E.; Silva, V.; Rouboa, A. Co-gasification and recent developments on waste-to-energy conversion: A review. Renew. Sustain. Energy Rev. 2018, 81, 380–398. [Google Scholar] [CrossRef]
  12. Xiong, Q.; Yang, Y.; Xu, F.; Pan, Y.; Zhang, J.; Hong, K.; Lorenzini, G.; Wang, S. Overview of Computational Fluid Dynamics Simulation of Reactor-Scale Biomass Pyrolysis. ACS Sustain. Chem. Eng. 2017, 5, 2783–2798. [Google Scholar] [CrossRef]
  13. Li, J.; Suvarna, M.; Li, L.; Pan, L.; Pérez-Ramírez, J.; Ok, Y.S.; Wang, X. A review of computational modeling techniques for wet waste valorization: Research trends and future perspectives. J. Clean. Prod. 2022, 367, 133025. [Google Scholar] [CrossRef]
  14. Wissing, F.; Wirtz, S.; Scherer, V. Simulating municipal solid waste incineration with a DEM/CFD method—Influences of waste properties, grate and furnace design. Fuel 2017, 206, 638–656. [Google Scholar] [CrossRef]
  15. Dymala, T.; Wang, S.; Jarolin, K.; Song, T.; Shen, L.; Dosta, M.; Heinrich, S. MP-PIC Simulation of Biomass Steam Gasification Using Ilmenite as an Oxygen Carrier. Atmosphere 2022, 13, 1009. [Google Scholar] [CrossRef]
  16. Hu, C.; Luo, K.; Wang, S.; Sun, L.; Fan, J. Influences of operating parameters on the fluidized bed coal gasification process: A coarse-grained CFD-DEM study. Chem. Eng. Sci. 2019, 195, 693–706. [Google Scholar] [CrossRef]
  17. Feng, Y.; Gao, J.; Feng, D.; Zhang, X. Modeling of the molten blast furnace slag particle deposition on the wall including phase change and heat transfer. Appl. Energy 2019, 248, 288–298. [Google Scholar] [CrossRef]
  18. Dhaidan, N.S.; Khalaf, A.F. Experimental evaluation of the melting behaviours of paraffin within a hemicylindrical storage cell. Int. Commun. Heat Mass Transf. 2020, 111, 104476. [Google Scholar] [CrossRef]
  19. Kheirabadi, A.C.; Groulx, D. The Effect of the Mushy-Zone Constant on Simulated Phase Change Heat Transfer. In Proceedings of the 6th International Symposium on Advances in Computational Heat Transfer (CHT-15), New Brunswick, NJ, USA, 25–29 May 2015. [Google Scholar]
  20. Mallya, N.; Haussener, S. Buoyancy-driven melting and solidification heat transfer analysis in encapsulated phase change materials. Int. J. Heat Mass Transf. 2021, 164, 120525. [Google Scholar] [CrossRef]
  21. Hummel, D.; Beer, S.; Hornung, A. A conjugate heat transfer model for unconstrained melting of macroencapsulated phase change materials subjected to external convection. Int. J. Heat Mass Transf. 2020, 149, 119205. [Google Scholar] [CrossRef]
  22. Ueda, S.; Kon, T.; Kurosawa, H.; Natsui, S.; Ariyama, T.; Nogami, H. Influence of Shape of Cohesive Zone on Gas Flow and Permeability in the Blast Furnace Analyzed by DEM-CFD Model. ISIJ Int. 2015, 55, 1232–1236. [Google Scholar] [CrossRef] [Green Version]
  23. Ueda, S.; Kon, T.; Miki, T.; Kim, S.-J.; Nogami, H. Softening, Melting, and Permeation Phenomena of CaO–FeO–SiO2 Oxide on a Coke Bed. ISIJ Int. 2015, 55, 2098–2104. [Google Scholar] [CrossRef] [Green Version]
  24. Heinze, T. A Multi-Phase Heat Transfer Model for Water Infiltration Into Frozen Soil. Water Resour. Res. 2021, 57, e2021WR030067. [Google Scholar] [CrossRef]
  25. Hosseini, S.; Gupta, R. Inorganic Matter Behavior during Coal Gasification: Effect of Operating Conditions and Particle Trajectory on Ash Deposition and Slag Formation. Energy Fuels 2015, 29, 1503–1519. [Google Scholar] [CrossRef]
  26. Kurowski, M.P.; Spliethoff, H. Deposition and slagging in an entrained-flow gasifier with focus on heat transfer, reactor design and flow dynamics with SPH. Fuel Process. Technol. 2016, 152, 147–155. [Google Scholar] [CrossRef]
  27. Safronov, D.; Förster, T.; Schwitalla, D.; Nikrityuk, P.; Guhl, S.; Richter, A.; Meyer, B. Numerical study on entrained-flow gasification performance using combined slag model and experimental characterization of slag properties. Fuel Process. Technol. 2017, 161, 62–75. [Google Scholar] [CrossRef]
  28. Montagnaro, F.; Salatino, P. Analysis of char–slag interaction and near-wall particle segregation in entrained-flow gasification of coal. Combust. Flame 2010, 157, 874–883. [Google Scholar] [CrossRef]
  29. Lu, X.; Wang, T. Water–gas shift modeling in coal gasification in an entrained-flow gasifier—Part 2: Gasification application. Fuel 2013, 108, 620–628. [Google Scholar] [CrossRef]
  30. Wang, P.; Massoudi, M. Slag Behavior in Gasifiers. Part I: Influence of Coal Properties and Gasification Conditions. Energies 2013, 6, 784–806. [Google Scholar] [CrossRef] [Green Version]
  31. Soon, G.; Zhang, H.; Yang, C.; Law, A.W.-K. Simulations of Melting in Fluid-filled Packed Media due to Forced Convection with Higher Temperature. Int. J. Heat Mass Transf. 2021, 175, 121358. [Google Scholar] [CrossRef]
  32. Soon, G.; Zhang, H.; Law, A.W.-K.; Yang, C. Modelling of Melting in Packed Media due to Forced Air Convection with Higher Temperature using Euler-Euler-Lagrangian approach. Int. J. Heat Mass Transf. 2022, 194, 123055. [Google Scholar] [CrossRef]
  33. Ansys® Academic Research Fluent, Release 20.2, Help System, ANSYS Fluent Theory Guide; ANSYS, Inc.: Canonsburg, PA, USA, 2020.
  34. Cundall, P.A.; Strack, O.D. A discrete numerical model for granular assemblies. Geotechnique 1979, 29, 47–65. [Google Scholar] [CrossRef]
  35. Gidaspow, D. Multiphase Flow and Fluidization: Continuum and Kinetic Theory Descriptions; Academic Press: Cambridge, MA, USA, 1994. [Google Scholar]
  36. Tsuji, Y.; Kawaguchi, T.; Tanaka, T. Discrete particle simulation of two-dimensional fluidized bed. Powder Technol. 1993, 77, 79–87. [Google Scholar] [CrossRef]
  37. Hu, H.; Argyropoulos, S.A. Mathematical modelling of solidification and melting: A review. Model. Simul. Mater. Sci. Eng. 1996, 4, 371–396. [Google Scholar] [CrossRef] [Green Version]
  38. Yang, W.J.; Zhou, Z.Y.; Pinson, D.; Yu, A.B. A New Approach for Studying Softening and Melting Behavior of Particles in a Blast Furnace Cohesive Zone. Metall. Mater. Trans. B 2015, 46, 977–992. [Google Scholar] [CrossRef]
  39. Patankar, S. Numerical Heat Transfer and Fluid Flow; Taylor & Francis: Boca Raton, FL, USA, 2018. [Google Scholar]
  40. Wen, C.Y. Mechanics of fluidization. Chem. Eng. Prog. Symp. Ser. 1966, 62, 100–111. [Google Scholar]
  41. Ergun, S. Fluid Flow through Packed Columns. J. Chem. Eng. Prog. 1952, 48, 89–94. [Google Scholar]
  42. Ranz, W.E.; Marshall, W.R. Evaporation from drops. Chem. Eng. Prog. 1952, 48, 141–146. [Google Scholar]
  43. Heberlein, S.; Chan, W.P.; Veksha, A.; Giannis, A.; Hupa, L.; Lisak, G. High temperature slagging gasification of municipal solid waste with biomass charcoal as a greener auxiliary fuel. J. Hazard. Mater. 2022, 423, 127057. [Google Scholar] [CrossRef]
  44. Nakai, Y.; Kikuchi, N.; Iwasa, M.; Nabeshima, S.; Kishimoto, Y. Development of Slag Recycling Process in Hot Metal Desulfurization with Mechanical Stirring. Steel Res. Int. 2009, 80, 727–732. [Google Scholar] [CrossRef]
  45. Diao, J.; Zhou, W.; Ke, Z.; Qiao, Y.; Zhang, T.; Liu, X.; Xie, B. System assessment of recycling of steel slag in converter steelmaking. J. Clean. Prod. 2016, 125, 159–167. [Google Scholar] [CrossRef]
  46. Song, W.J.; Tang, L.H.; Zhu, X.D.; Wu, Y.Q.; Zhu, Z.B.; Koyama, S. Effect of Coal Ash Composition on Ash Fusion Temperatures. Energy Fuels 2010, 24, 182–189. [Google Scholar] [CrossRef]
  47. Fourcault, A.; Marias, F.; Michon, U. Modelling of thermal removal of tars in a high temperature stage fed by a plasma torch. Biomass Bioenergy 2010, 34, 1363–1374. [Google Scholar] [CrossRef]
  48. Zhang, Z.; Lu, B.; Zhao, Z.; Zhang, L.; Chen, Y.; Luo, C.; Zheng, C. CFD modeling on char surface reaction behavior of pulverized coal MILD-oxy combustion: Effects of oxygen and steam. Fuel Process. Technol. 2020, 204, 106405. [Google Scholar] [CrossRef]
  49. Li, Z.; Jiang, L.; Ouyang, J.; Cao, L.; Luo, G.; Yao, H. A kinetic study on char oxidation in mixtures of O2, CO2 and H2O. Fuel Process. Technol. 2018, 179, 250–257. [Google Scholar] [CrossRef]
  50. Mularski, J.; Pawlak-Kruczek, H.; Modlinski, N. A review of recent studies of the CFD modelling of coal gasification in entrained flow gasifiers, covering devolatilization, gas-phase reactions, surface reactions, models and kinetics. Fuel 2020, 271, 117620. [Google Scholar] [CrossRef]
Figure 1. Simplified particle lifetime process implemented by UDF (dpm_switch). Tp is particle temperature, while Ts is the solidus temperature.
Waste 01 00023 g001
Figure 2. Implementation and coupling of the combustion-melting model in CD-MELT with user-defined functions. CF is the char mass fraction, β is the mass loss fraction, and dp is the diameter of the particle.
Waste 01 00023 g002
Figure 3. Geometry and mesh of gasifier in the Waste-to-Energy Research Facility (WTERF) in Singapore (isometric and side views). Particle packing conditions of coal (red spheres) and MSW, including solid slag (blue spheres), at t = 5000 s are shown in the right-hand figure.
Waste 01 00023 g003
Figure 4. Predicted process and lifetime of a sample MSW particle in the gasifier: (a) temperature and mass over time, and (b) heat capacity and liquid, volatile and char mass fractions. The colored zones represent the physical and chemical processes occurring in the particle at any one time. The grey line represents the solidus temperature of MSW at 1423 K.
Waste 01 00023 g004
Figure 5. CD-MELT model prediction: liquid slag volume fraction in gasifier at 100 s intervals from t = 5000 s to t = 5600 s, at y = 0.25 m (top view, position indicated by red dotted line) and centre of domain z = 0.0 m (side view), and y < 0.8 m; (a) with slag recycling, and (b) without slag recycling.
Waste 01 00023 g005
Figure 6. Predicted slag profile in reactor with (R) and without (NR) slag recycling: (a) outlet temperature of slag, and (b) mass of solid, liquid and total slag.
Waste 01 00023 g006
Figure 7. CD-MELT’s predictions for exit gas composition in terms of mole fraction for H2O, CO2, CO, H2, N2, CH4, C6H6, and O2, and temperature over time: (a) with and (b) without slag recycling.
Waste 01 00023 g007
Figure 8. Comparison of predicted area-averaged temperature of gas mixture along the gasifier height (: with slag recycling, and : without slag recycling; : site observations).
Waste 01 00023 g008
Table 1. Conservation equations for mass, momentum and energy for fluid phases.
EquationNo.
Primary Phase (Gas Mixture)
Continuity:
t ( α g ρ g ) + · ( α g ρ g v g ) = R p g (1)
Momentum:
t ( α g ρ g v g ) + · ( α g ρ g v g v g ) = α g p + · ( τ g = ) + α g ρ g g + K p g ( v p v g ) + K l g ( v l v g ) (2)
Energy:
( α g ρ g h g ) t + · ( α g ρ g h g v g ) = α g d p g d t + τ g =   : v g · q g · i h i , g J i + Q pg + Q lg (3)
Species:
t ( ρ g Y i ) + · ( ρ g v g Y i ) = · J i + R i (4)
where i is used to refer to each individual species in the gas mixture.
Secondary Phase (Liquid)
Continuity:
t ( α l ρ l ) + · ( α l ρ l v l ) = S mass (5)
where S mass is the mass source added from the solid phase due to melting.
Momentum:
t ( α l ρ l v l ) + · ( α l ρ l v l v l ) = α l p + · ( τ l = ) + α l ρ l g + K gl ( v g v l ) + K pl ( v p v l ) + S mass v p (6)
Energy:
( α l ρ l h l ) t + · ( α l ρ l h l v l ) = α l d p l d t + τ l =   : v l · q l + Q gl + S mass ( h melt h ref ) (7)
Table 2. Particle laws and corresponding particle energy balance equation [33].
Particle Law (s)Particle Energy Balance EquationNo.
Inert Heating m p c p d T p d t = h c A p ( T f T p ) (10)
Vaporization m p c p d T p d t = h c A p ( T f T p ) + d m p d t h v a p o r i z a t i o n (11)
Devolatilization m p c p d T p d t = h c A p ( T f T p ) + d m p d t h d e v o l a t i l i z a t i o n (12)
Surface Reactions (Combustion/Pyrolysis) m p c p d T p d t = h c A p ( T f T p ) f h d m p d t H r e a c (13)
Simultaneous Melting and Combustion m p c p d T p d t = h c A p ( T f T p ) f h d m p d t H r e a c + d m p d t h m (14)
Melting m p c p d T p d t = h c A p ( T f T p ) + d m p d t h m (15)
Table 3. Properties and composition of solid particles used in the simulation.
PropertiesMSWCoalSlag
Chemical composition (% weight)
Moisture (W)43.71--
Volatile matter (VM) (% wt, dry basis)79.89--
Fixed Carbon (FC) (% wt, dry basis)11.72100.00-
Ash (% wt, dry basis)8.39-100.00
Density, ρ (kg/m3)
ρ w = 1000, ρ V M = 400, ρ F C = 430, ρ a s h = 2200
Volume-weighted average from each component8002200
Heat capacity, c p (J/kg K)
c p , w = 4200, c p , V M = 4.5099T − 101.4917, c p , F C = −6.85 × 10⁻⁴T2 + 2.09T + 420,
c p , a s h = −1.95 × 10⁻⁴T2 + 0.644T + 644
Mass-weighted average from each component c p , FC c p , ash
Elemental composition (% weight)
C51.81--
H7.48--
N1.40--
O30.92--
Table 4. Chemical reactions modelled and Arrhenius kinetics [47]. Adapted with permission from Fourcault, A.; Marias, F.; Michon, U. Modelling of thermal removal of tars in a high temperature stage fed by a plasma torch. Biomass Bioenergy 2010, 34, 1363–1374. Copyright 2010, Elsevier.
Chemical ReactionsReaction Rates
Homogenous reactions
Combustion
CO (g) + 0.5 O2 (g) → CO2 (g)3.165 × 10¹² exp ( 1.8 × 10 5 R T ) [CO][O2]0.25[H2O]0.5
H2 (g) + 0.5 O2 (g) → H2O (g)1.08 × 10¹⁰exp ( 1.255 × 10 5 R T ) [O2][H2]
CH4 (g) + 2O2 (g)→ 2 H2O (g) + CO2 (g)1.3 × 10⁵exp ( 2.025 × 10 5 R T ) [CH4]0.3[O2]1.3
C6H6 (g) + 3 O2 (g) → 6 CO (g) + 3 H2 (g)1.58 × 10¹⁵exp ( 2.026 × 10 5 R T ) [C6H6][O2]
Tar Cracking
C6H6 (g) + 5 H2O (g) → 5 CO + 6 H2 (g) + CH4 (g)4.4 × 10⁸exp ( 2.2 × 10 5 R T ) [C6H6]
C6H6 (g) + 7.5 O2 (g) → 6 CO2 (g) + 3 H2O (g)1.783exp ( 1.255 × 10 5 R T ) [C6H6]−0.1[O2]1.25
Water-gas shift reaction
CO (g) + H2O (g) → CO2 (g) + H2 (g)
(forward reaction)
2.778 × 10²exp ( 1.256 × 10 4 R T ) [CO][H2O]
CO2 (g) + H2 (g) → CO (g) + H2O (g)
(backward reaction)
1.263 × 10⁴exp ( 4.729 × 10 4 R T ) [CO2][H2]
Heterogenous reactions
Pyrolysis
C1.088H1.732N0.023O0.361 (s) → 0.088 C (char, s) + 0.03 CO2 (g)
+ 0.065 H2 (g) + 0.061 H2O (g) + 0.08 C6H6 (g) + 0.24 CO (g) + 0.25 CH4 (g) + 0.0115 N2 (g)
2.0 × 10¹¹exp ( 1.8 × 10 5 R T )
C (s) + O2 (g) → CO2 (g)MSW: 5.88 × 10⁻⁶exp ( 3.99 × 10 4 R T ) [O2]
Coal: 4.53 × 10⁻⁶exp ( 3.99 × 10 4 R T ) [O2]
C (s) + CO2 (g) → 2 CO (g)MSW: 5.88 × 10⁻⁶exp ( 3.99 × 10 4 R T ) [CO2]
Coal: 4.13 × 10⁻⁶exp ( 3.99 × 10 4 R T ) [CO2]
C (s) + H2O (g) → CO (g) + H2 (g)MSW: 5.0 × 10⁻⁶exp ( 3.99 × 10 4 R T ) [H2O]
Coal: 4.13 × 10⁻⁶exp ( 3.99 × 10 4 R T ) [H2O]
Disclaimer/Publisher’s Note: The statements, opinions and data contained in all publications are solely those of the individual author(s) and contributor(s) and not of MDPI and/or the editor(s). MDPI and/or the editor(s) disclaim responsibility for any injury to people or property resulting from any ideas, methods, instructions or products referred to in the content.

