Article

Machine Learning Approach to Predicting Rift Valley Fever Disease Outbreaks in Kenya

1
Department of Mathematics and Statistics, College of Natural and Applied Sciences, Sokoine University of Agriculture, P.O. Box 3038, Morogoro 67125, Tanzania
2
Department of Microbiology, Parasitology and Biotechnology, College of Veterinary Medicine and Biomedical Sciences, Sokoine University of Agriculture, P.O. Box 3019, Morogoro 67125, Tanzania
3
SACIDS Africa Centre of Excellence for Infectious Diseases, SACIDS Foundation for One Health, Sokoine University of Agriculture, P.O. Box 3297, Morogoro 67125, Tanzania
4
International Livestock Research Institute, P.O. Box 30709, Nairobi 00100, Kenya
*
Author to whom correspondence should be addressed.
Zoonotic Dis. 2025, 5(3), 20; https://doi.org/10.3390/zoonoticdis5030020
Submission received: 24 November 2024 / Revised: 29 January 2025 / Accepted: 17 February 2025 / Published: 21 July 2025

Simple Summary

Rift Valley fever (RVF) disease affects farmed animals and also has the capacity to infect humans. The disease has been reported in Africa and is associated with great economic losses. Most works on RVF have focused on the epidemiology and the spatial temporal analysis of the disease with little consideration on statistical modeling of historical outbreaks. Furthermore, several machine learning algorithms have been used in disease prediction but so far, no algorithm has ever been used to predict or classify RVF outbreaks. As such, the study employed sophisticated machine learning models for RVF outbreaks prediction and control.

Abstract

In Kenya, Rift Valley fever (RVF) outbreaks pose significant challenges, being one of the most severe climate-sensitive zoonoses. While machine learning (ML) techniques have shown superior performance in time series forecasting, their application in predicting disease outbreaks in Africa remains underexplored. Leveraging data from the International Livestock Research Institute (ILRI) in Kenya, this study pioneers the use of ML techniques to forecast RVF outbreaks by analyzing climate data spanning from 1981 to 2010, including ML models. Through a comprehensive analysis of ML model performance and the influence of environmental factors on RVF outbreaks, this study provides valuable insights into the intricate dynamics of disease transmission. The XGB Classifier emerged as the top-performing model, exhibiting remarkable accuracy in identifying RVF outbreak cases, with an accuracy score of 0.997310. Additionally, positive correlations were observed between various environmental variables, including rainfall, humidity, clay patterns, and RVF cases, underscoring the critical role of climatic conditions in disease spread. These findings have significant implications for public health strategies, particularly in RVF-endemic regions, where targeted surveillance and control measures are imperative. However, this study also acknowledges the limitations in model accuracy, especially in scenarios involving concurrent infections with multiple diseases, highlighting the need for ongoing research and development to address these challenges. Overall, this study contributes valuable insights to the field of disease prediction and management, paving the way for innovative solutions and improved public health outcomes in RVF-endemic areas and beyond.

1. Introduction

Rift Valley fever virus (RVFV) is the cause of Rift Valley fever (RVF) in farmed animals in all Sub-Saharan African countries and the Arabian Peninsula [1]. RVF virus is classified within the family Phenuiviridae and the order Hareavirales [2]. The virus was first identified in 1931 during an investigation into an endemic among sheep on a farm in the Rift Valley province of Kenya [3]. The livestock disease outbreaks remain a public health concern, with the biggest burden of the diseases belonging to the pastoral communities [4]. Once an animal or human being has been exposed to the RVF virus, it takes between 2–6 days for the symptoms to appear [5]. The infection in humans can be lethal in rare cases (~1%) [6].
The RVF virus is particularly virulent in sheep, followed by goats and cattle [7]. It is characterized by fever, abortions, and weaknesses, with abortions occurring in nearly 100 percent of all pregnancies [8]. For adult animals, the severity is much lower [9]. Artificial intelligence and ML are growing in popularity very quickly these days [10]. They are extensively employed in many fields, such as stock market trading, fraud detection, medical diagnosis, and speech, picture, and pattern recognition [11]. They have not been used widely in the field of public health, particularly in disease modeling and integrating local climate and ecological data. Numerous studies have been conducted to show how livestock diseases reduce livestock productivity, restrict access to domestic and foreign markets, and jeopardize human health through the spread of zoonotic diseases; however, none of these studies have used ML techniques to predict or categorize these outbreaks.
RVF is a climate-sensitive zoonosis whose outbreaks (s) are majorly influenced by external factors, especially climatic factors [12]. Environmental factors, particularly abnormal rainfall and high humidity, create ideal conditions for the breeding of RVF’s primary vectors, such as Aedes mosquitoes [13,14]. Low temperatures typically inhibit vector breeding activity [15]. Excessive rainfall often leads to flooding, which is associated with El Niño-Southern Oscillation (ENSO) events, leading to the formation of stagnant water pools, providing ideal habitats for mosquito multiplication [16]. Studies by [3,17] on humidity and soil cover reveal that the RVF vector reproduction rates are amplified by the two environmental factors. This study aims at integrating specific environment and climatic factors in the models to capture the complex associations between the RVF dynamics, modeling, and predictions.
Because of its strong performance in handling complicated and non-linear (interactions where the relationship between variables does not follow a straight-line pattern) high-dimensional datasets, XG Boost (Extreme Gradient Boosting) has become more and more popular in the field of disease modeling [18]. A study by [19] on the application of an XG Boost model in predicting RVF outbreaks showed that incorporating advanced machine learning models that consider several climatic variables can significantly enhance the prediction and management of RVF incidences. Research has shown that in disease prediction tasks, XG Boost consistently performs better than statistical models and conventional ML algorithms [20]. For instance, XG Boost outperformed LR and RF algorithms in a study by [21] when it came to predicting diseases like diabetes and cardiovascular disorders. Because of its capacity to manage large-scale, highly dimensional datasets, XG Boost is an excellent choice for disease modeling tasks involving a multitude of predictors and intricate relationships between variables. To sum up, XG Boost presents a robust framework for disease modeling that offers high accuracy, insights into the importance of features, and versatility in managing a variety of datasets.

2. Literature Review

RVF, which is caused by the RVF virus, is a zoonotic disease that is endemic to sub-Saharan Africa and the Arabian Peninsula [22]. The disease predominantly affects livestock and humans and causes significant economic losses and public health burdens [13]. The seasonal climatic occurrences, especially the El Niño-related anomalies’, are strongly linked to RVF outbreaks by facilitating vector population surges, as highlighted by [23].
Traditional RVF outbreak and prediction efforts have relied on statistical models that incorporate environmental factors such as rainfall, humidity, and vegetation indices. For instance, a study by [24] utilized remote sensing data to map vector breeding grounds, but these approaches often lacked the granularity required for real-time outbreak predictions. Recent advancements in ML offer an opportunity to bridge this gap. ML models like Random Forest (RF), Support Vector Machines (SVM), and Extreme Gradient Boosting (XG Boost) have demonstrated superior accuracy in handling complex, high-dimensional datasets, as shown by [25] in various predictive tasks, including disease modeling.
Despite these advancements, applications of ML to RVF outbreak prediction remain limited. Existing studies, such as [26], have applied ML to zoonotic disease surveillance but often fail to integrate critical epidemiological and seasonal data. Furthermore, the lack of a standardized approach to data pre-processing and feature selection has limited the biological relevance of many ML-driven models. This study builds on these gaps by applying XGBoost and other ML methods to historical RVF case data, emphasizing environmental and seasonal predictors.

3. Materials and Methods
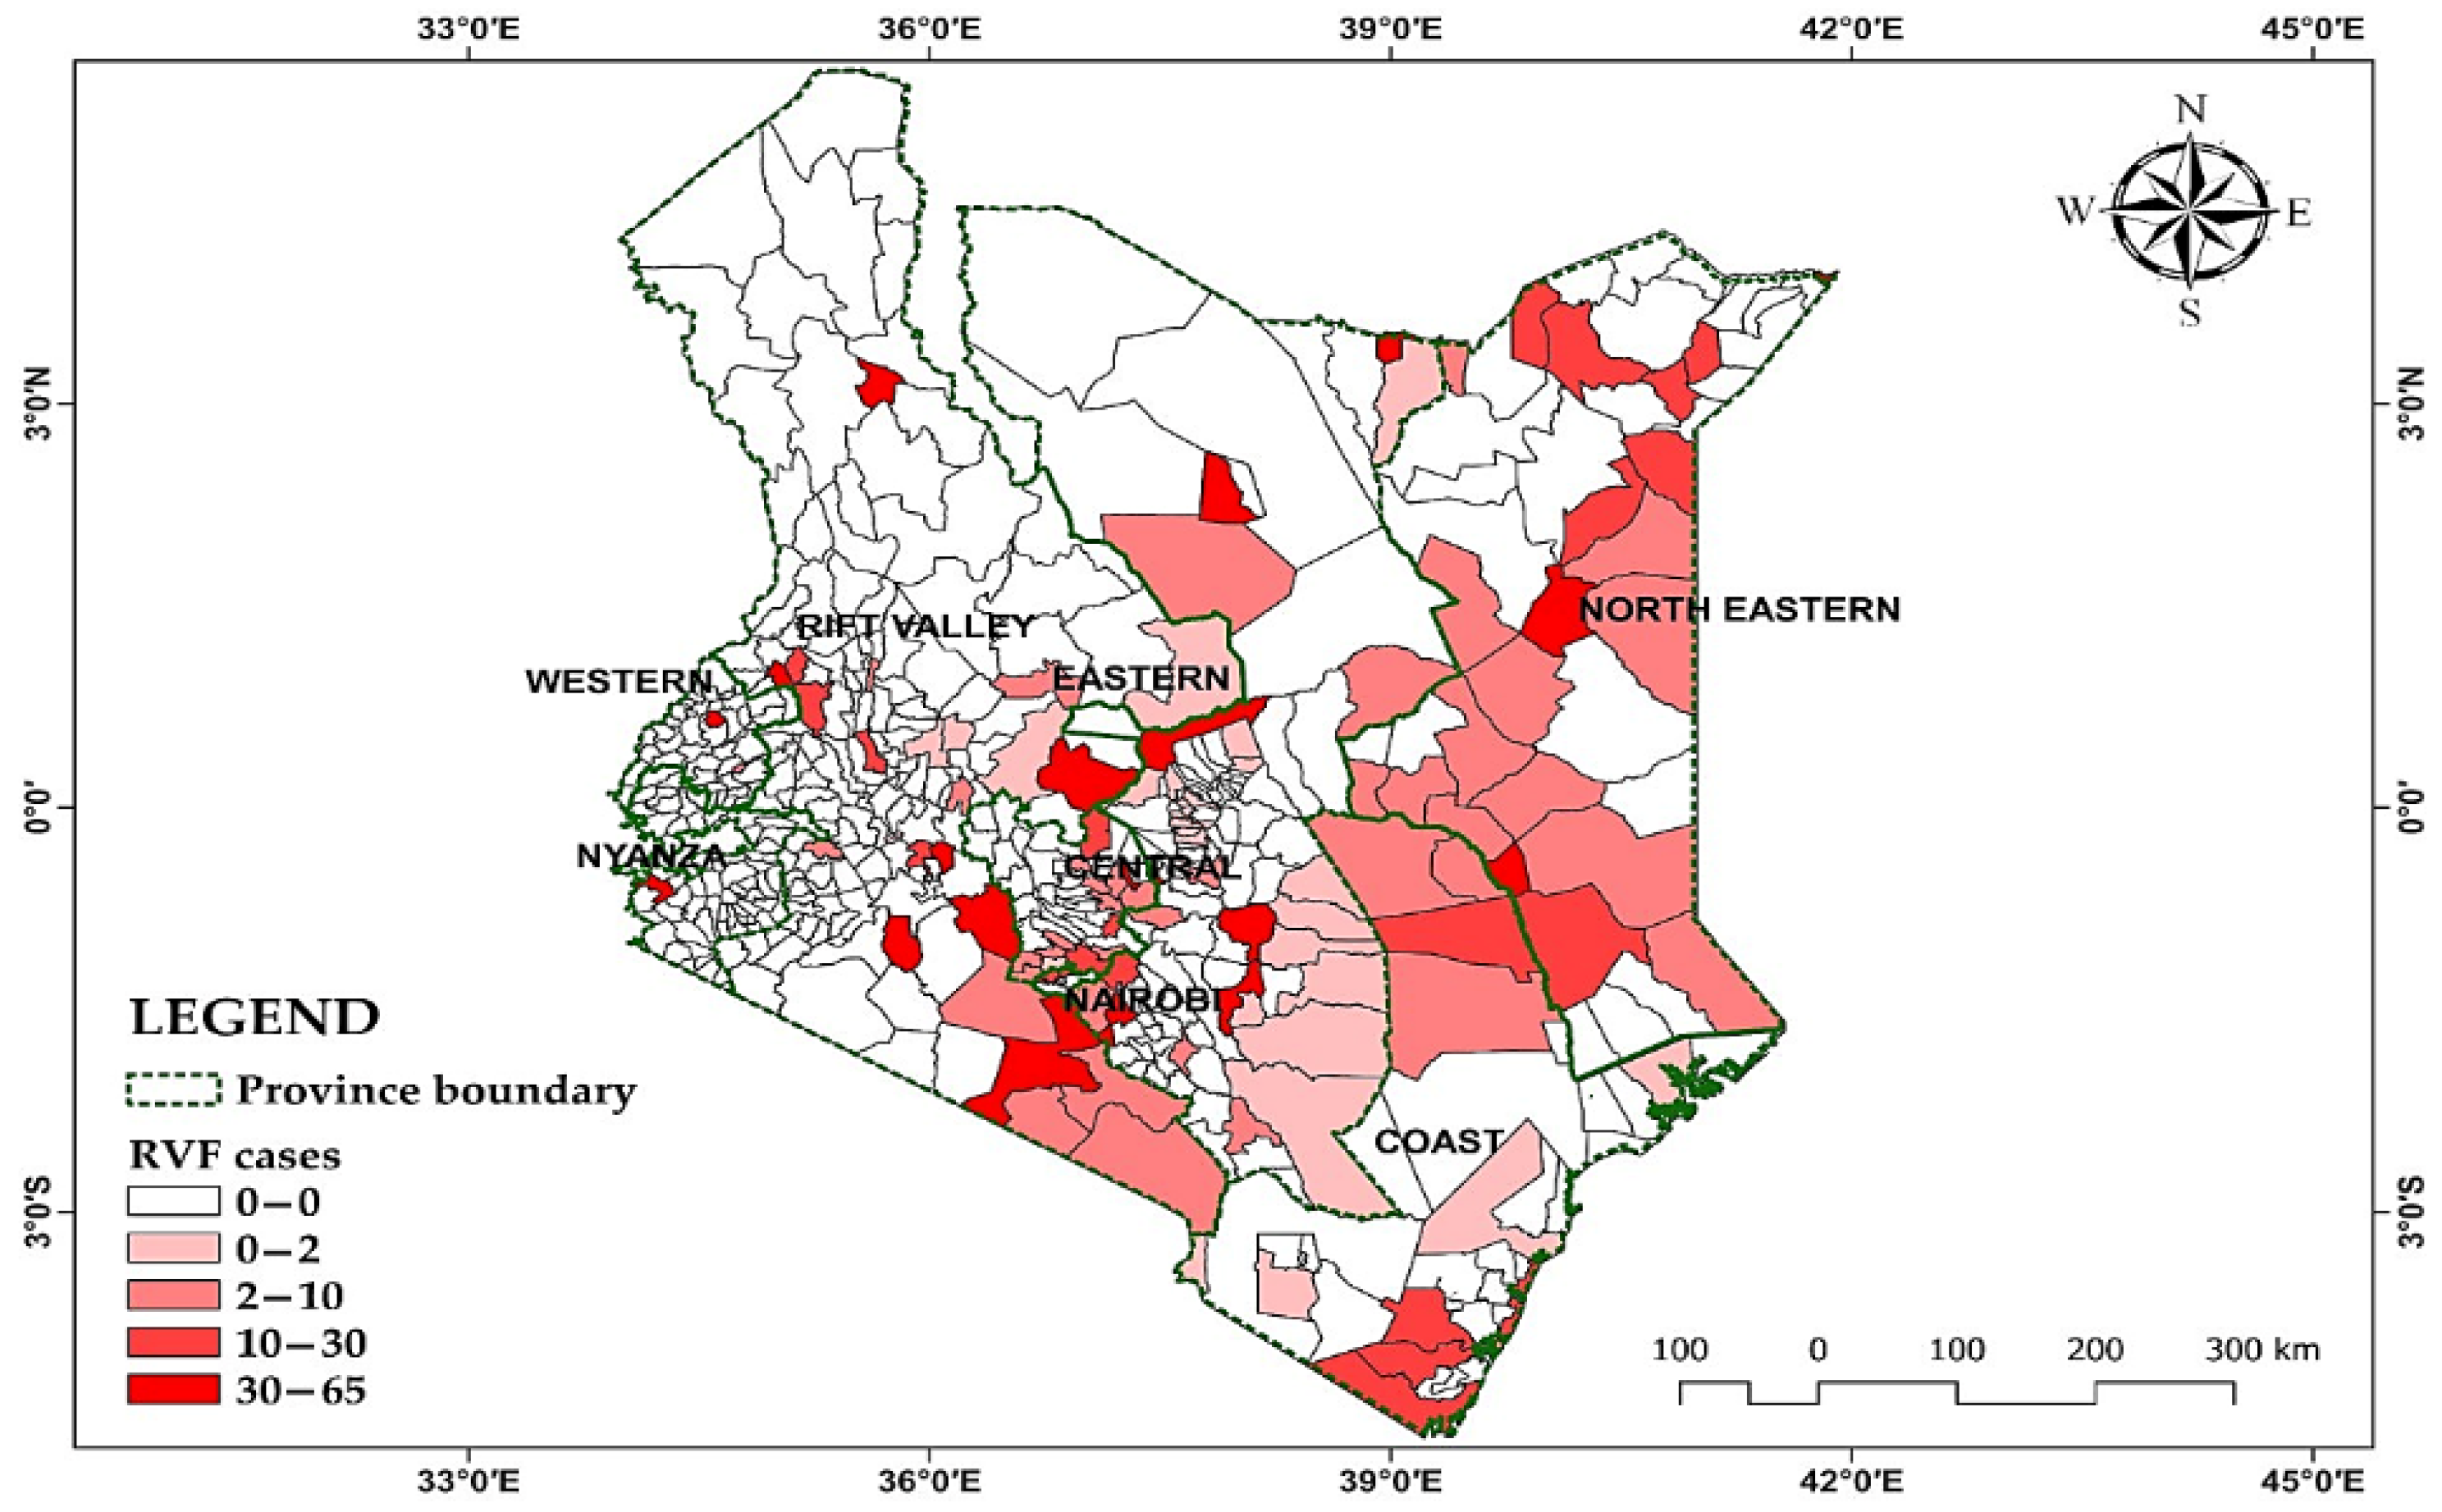
This study encompasses several essential steps, including data pre-processing, the attributes selection part, K-fold cross-validation, and assessment of the available important attributes. The subsequent sections provide a comprehensive overview of the entire process undertaken in predicting the RVF cases in Kenya. This includes a detailed presentation and explanation of the data using the ML methodologies employed, the evaluation metrics utilized, and a breakdown of the workflow followed throughout the study.

3.1. Study Area

The data encompasses 30 years of monthly RVF outbreaks in Kenya, from 1981 to 2010, and the distribution pattern is mapped in Figure 1.

3.2. Data Description and Attribute Selection

Alongside the RVF cases in years, comprehensive topographic details were collected, including climate metrics like rainfall (mm), humidity, and slope, sourced from the meteorological department. These variables are continuous, while the target variable, the occurrence of RVF outbreaks, is binary (“1 = RVF outbreak, 0 = No outbreak”), denoting its presence or absence within a specific location over a defined period exceeding typical expectations.
Additional data categories, such as clay patterns, were also included, following the contribution to a detailed taxonomy of Kenya’s meteorological landscape. Descriptions of the variables considered in this study are outlined in Table 1.
This dataset serves as a rich resource for analyzing the interplay between environmental factors and the prevalence of RVF, facilitating informed research and mitigation strategies.
To assess the relationships between the variables in our study, the Pearson correlation coefficient was used.

Correlation Coefficient

This is a measure of the strength of the linear association between 2 paired variables. It takes values from −1 to +1. Values close to 0 indicate a weak relationship, while values close to 1 indicate a strong relationship. If r = 0, there is no relationship, and if r r = 1 , we have a perfect relationship [27].
Further, the correlation matrix, constructed from pairwise correlations, provided a comprehensive view of the dependencies, enabling the identification of multi-collinearity or redundant variables within the dataset.

3.3. Data Pre-Processing

In this study, our initial dataset contained 181,801 records, which were reduced to 180,289 after removing the outliers. The outliers were identified and eliminated using statistical thresholds to ensure data quality and model accuracy. Continuous variables were flagged as outliers if their values fell outside 1.5 times the interquartile range. The binary and categorical variables were assessed for plausibility. Removing 1512 outliers refined the dataset, reducing model distortion. Specifically, 1512 records were identified as outliers and were eliminated. Following outlier removal, data splitting was conducted with a test size of 0.2 (meaning 80% for the training data and 20% for the test data), and the random state used was 42, indicating that the random train and test sets were obtained across different 42 executions. Random state 42 is a widely accepted standard practice in machine learning and statistical analyses to maintain reproducibility, as it is able to balance randomness with determinism without any specific bias in data splitting.

3.4. Statistical Software

The latest version, 4.4.2 of the R statistical software [28], was chosen due to its robust capabilities in statistical computation and graphics visualization. The following R packages were employed in the analysis: library (caret), library (ROCR), library (dplyr), library (tidyr), library (lubricate), library (ROSE), and library (random Forest).

3.5. Machine Learning Methodology

Models in ML

In this study, several ML methods to address classification tasks within our dataset were applied. These methods included Linear Discriminant Analysis, Logistic Regression (LR), Gaussian Naive Bayes (NB), K-Nearest Neighbors (K-NN), SVM, Decision Tree Classifier (CART), RF, and XG Boost. Each of these ML models offers distinct advantages and is suited for different types of data and tasks [29]. LR is effective for binary classification tasks and provides interpretable results, while LDA works well with multiclass classification and assumes normality in data distribution [10]. K-NN is a non-parametric method that is suitable for small datasets and simple decision boundaries [30].
CART is intuitive, simple to interpret, and can handle both categorical data and numerical data [31]. NB is efficient with large datasets and works well with categorical data [32]. SVM is powerful for complex classification tasks and can handle high-dimensional data effectively [33]. RF is an ensemble method that reduces overfitting and improves accuracy by aggregating predictions from multiple decision trees [34].
Using a variety of ML models allows us to compare their performance, identify the most suitable model for our dataset, and improve the robustness and reliability of our classification results [35]. Each model brings unique strengths and capabilities, and by leveraging multiple models, we can enhance our understanding of the data and make more accurate predictions or classifications.

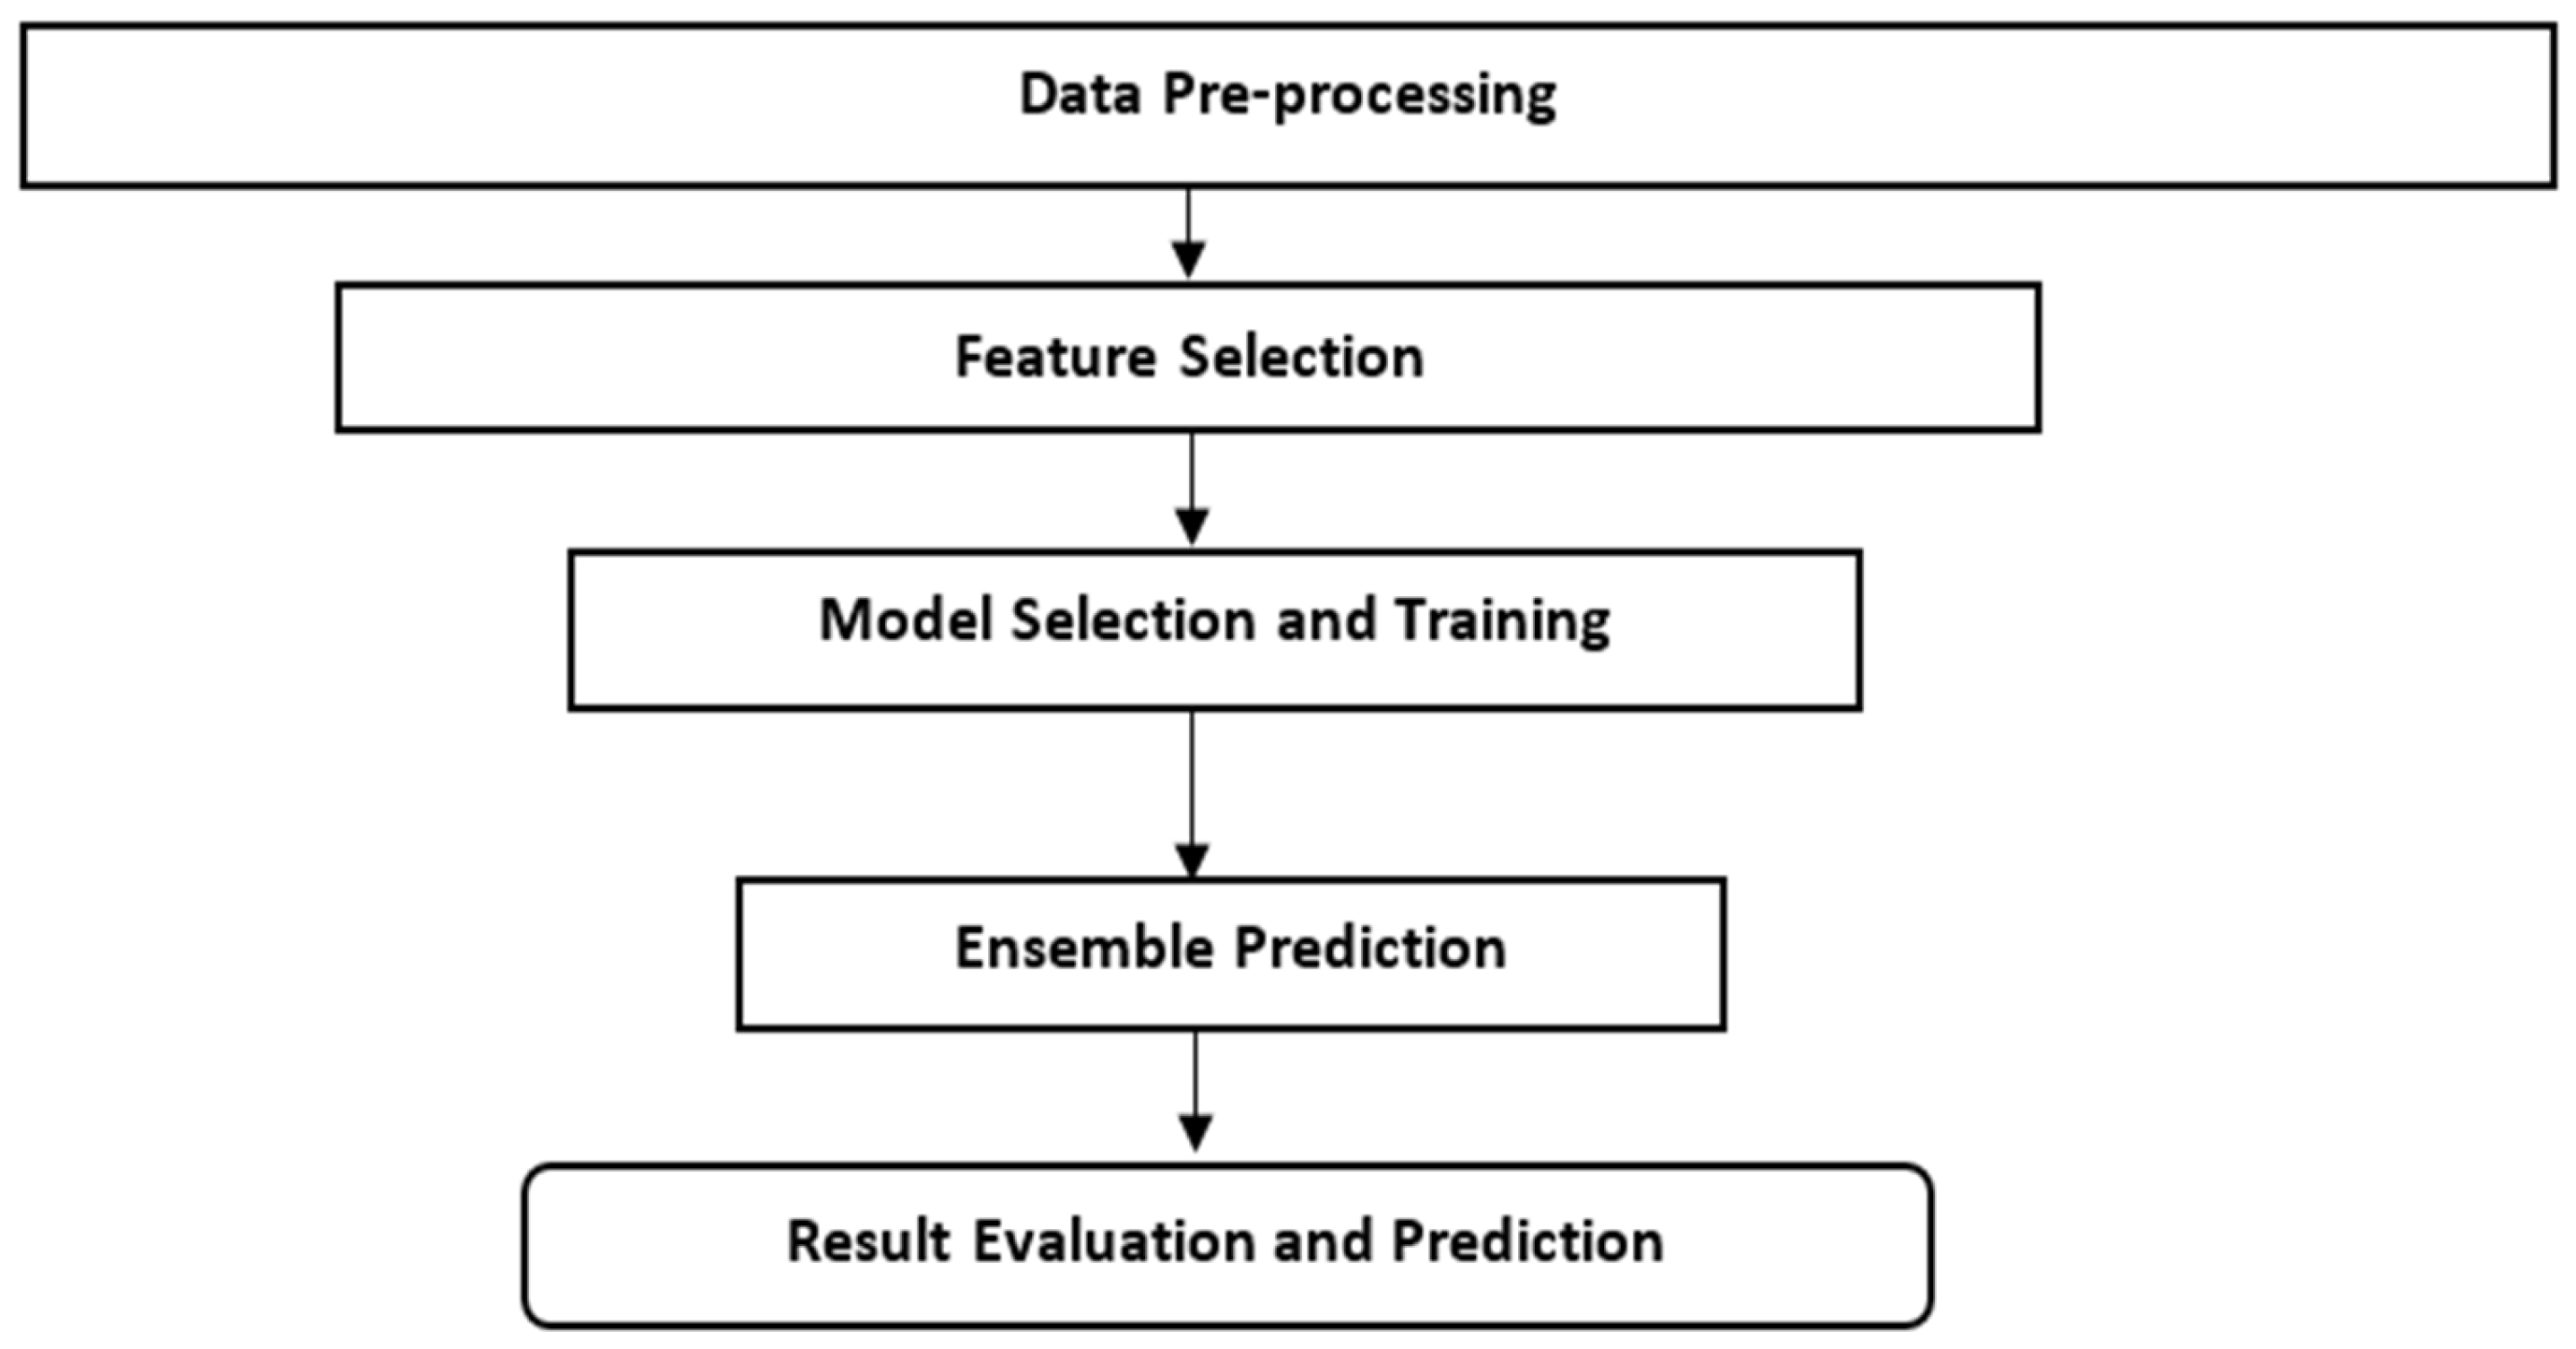
3.6. Analytical Flow Chart Approach

The overall flowchart illustrated in Figure 2 of our study’s ML approach for predicting RVF outbreaks in Kenya begins with data collection and pre-processing, followed by data cleaning and outlier removal using Isolation Forest.

3.7. Evaluation Metrics in ML

In predicting RVF cases in Kenya, the evaluation of our ML models is crucial for assessing their effectiveness and reliability. We utilized a range of evaluation metrics tailored to the nature of our classification task and the specific challenges posed by RVF outbreak prediction, which is shown in Table 2.

4. Results

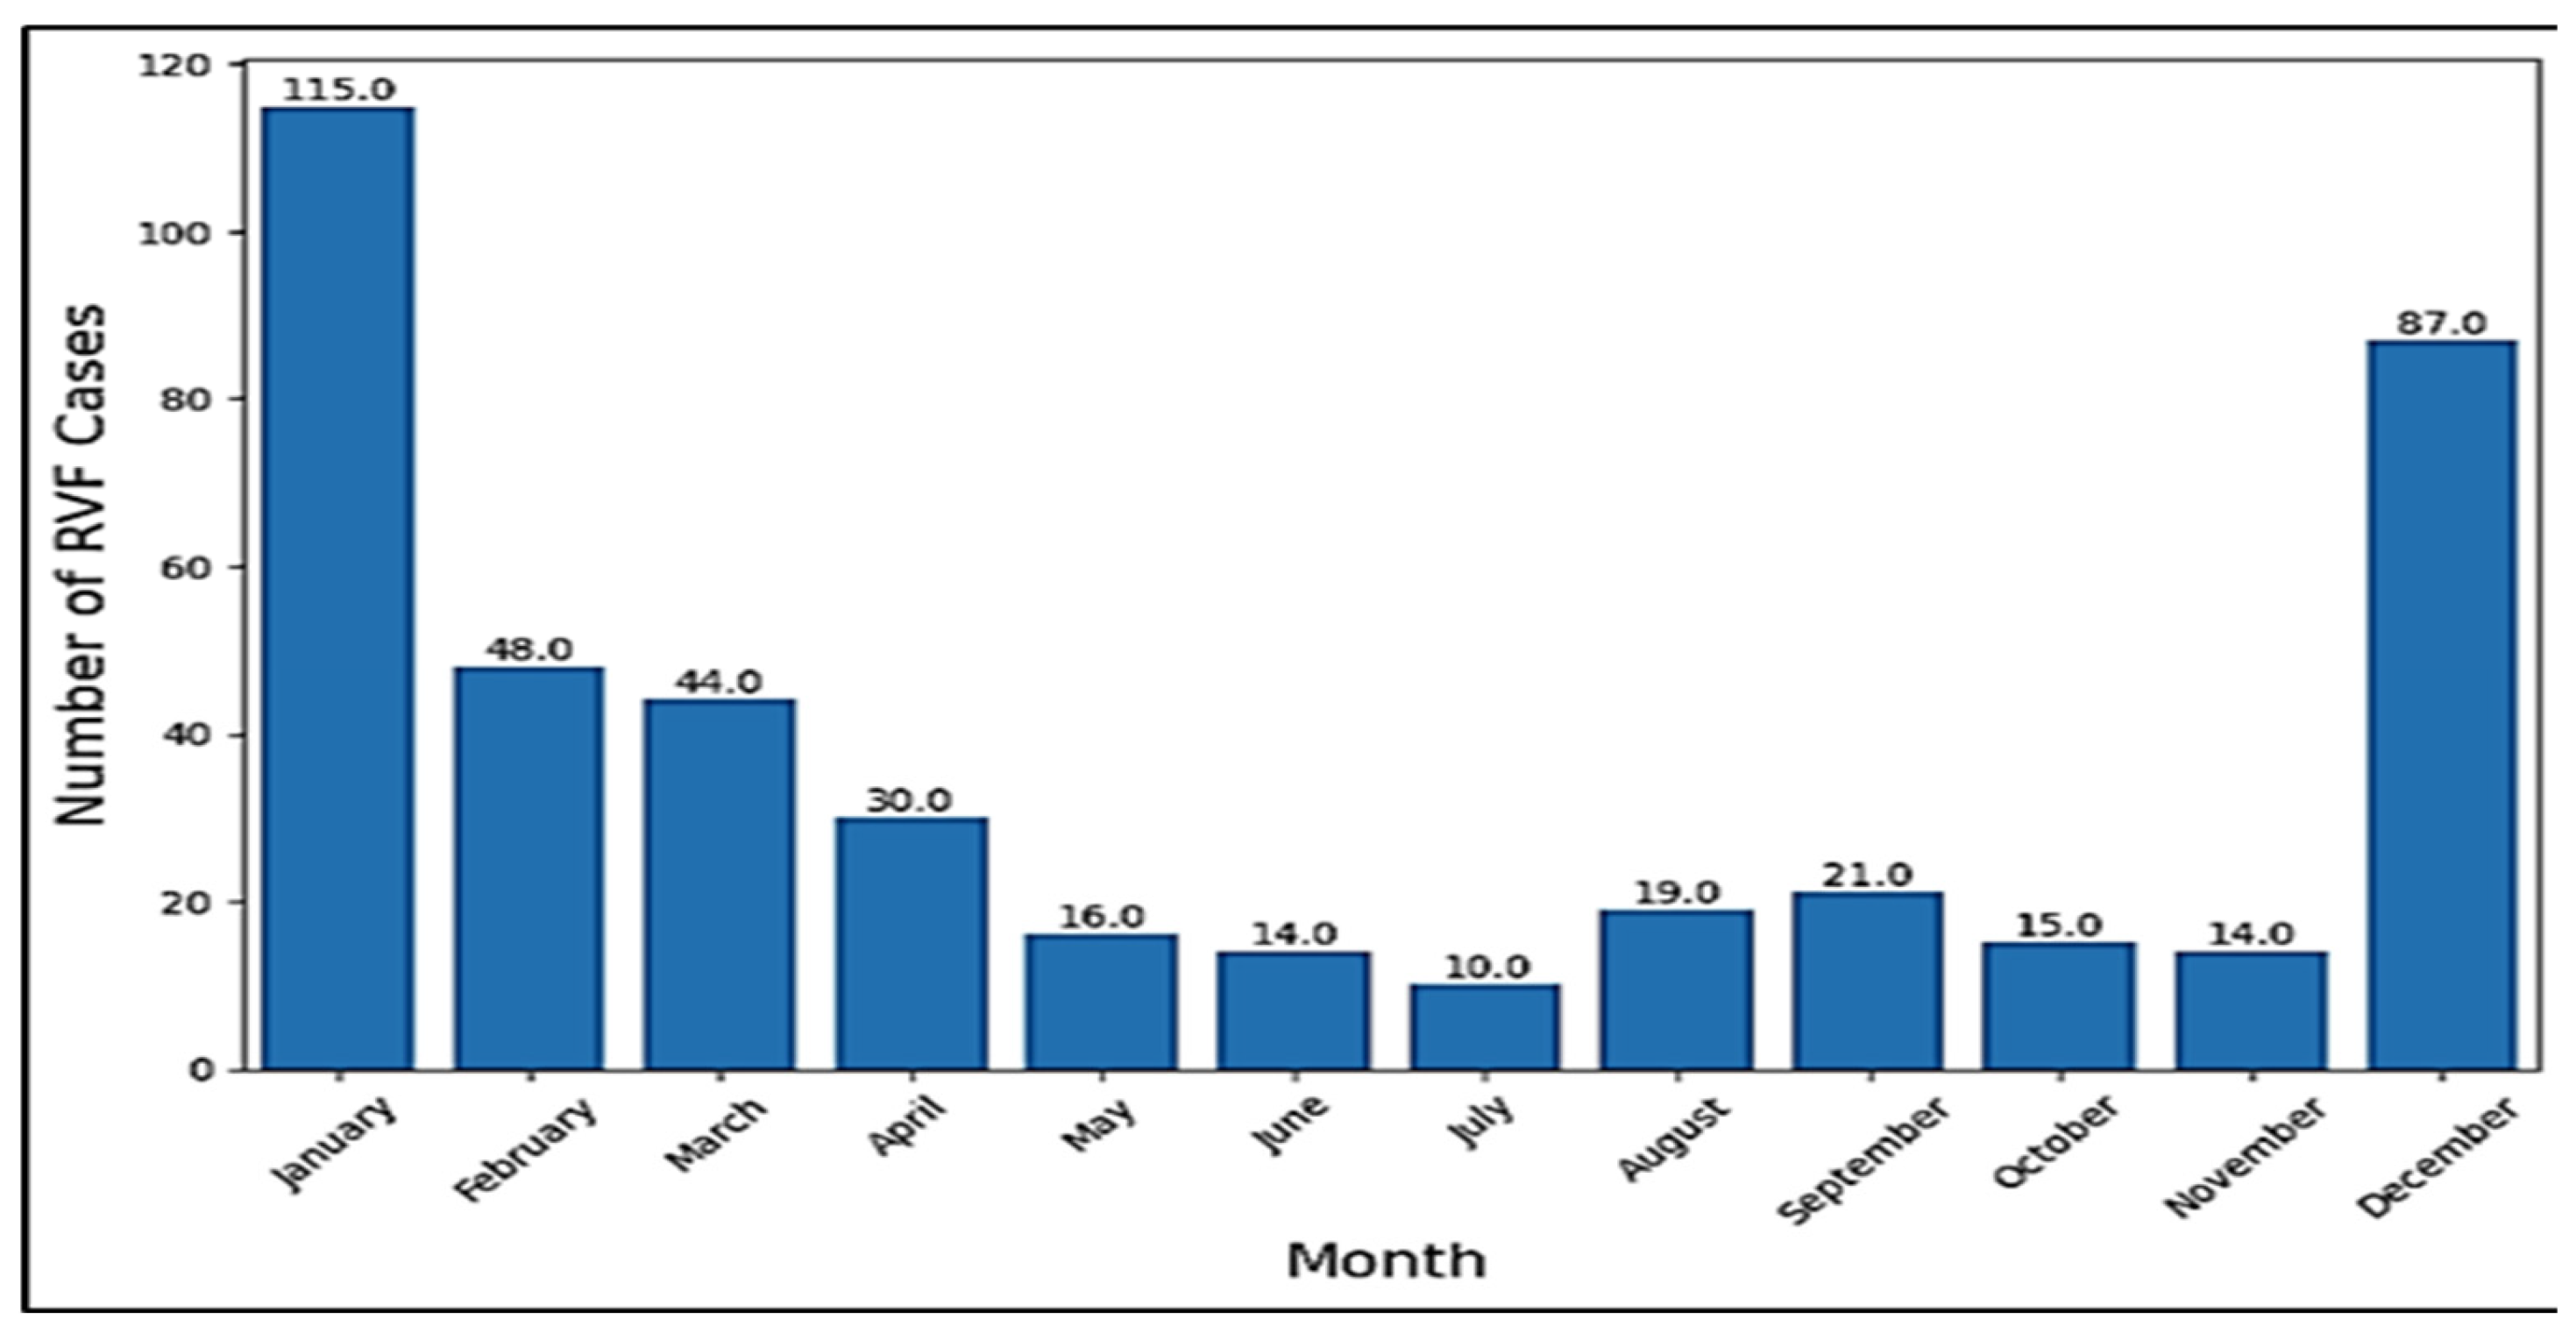
4.1. Descriptive Statistics of Data Used

Table 3 presents the RVF cases in Kenya from 1981 up to the year 2010, categorized by province. The table shows the number of RVF cases reported in each province, along with the corresponding percentage of RVF cases relative to the total cases reported across all provinces. The provinces are listed with their respective RVF case counts, ranging from 0 cases in Nyanza and the Western provinces to the highest number of cases in Rift Valley Province, with 116 cases in Rift Valley Province.
The percentages highlight the distribution of RVF cases across different regions of Kenya, indicating that Rift Valley Province had the highest proportion of RVF cases at 26.8%, followed by Eastern Province at 20.6%, Northeastern Province at 18.9%, and Central Province at 14.5%. Coast Province had 10.6% of RVF cases, while Nairobi had 8.5%. Notably, Nyanza and the Western provinces did not report any RVF cases during this period. These data provide valuable insights into the geographic distribution and prevalence of RVF cases within Kenya, aiding in understanding disease patterns and informing public health strategies and interventions [36].
For instance, the Rift Valley Province, at 26.8%, is a result of its large population of livestock, hence increasing the likelihood of disease spillover. Additionally, the area is favored by low-lying and poorly drained soils, which promote water-standing pools that are breeding grounds for the RVF vectors. The Eastern and North Eastern provinces, with 20.6% and 18.9%, are classified as arid and semi-arid lands with seasonal rainfall, which is characterized by flooding during periods of heavy rainfall. Furthermore, livestock movement in these areas is more frequent, which contributes to the virus spread. The absence of RVF cases in Nyanza and the Western provinces is a result of high elevations, which reduce the effects of stagnant water and, hence, limited mosquito habitats. These areas are also characterized by smaller livestock populations.
The provided context contains a dataset of RVF cases per month, with a range from January to December. The data indicate that RVF cases are not uniformly distributed throughout the year, with some months experiencing significantly higher numbers of cases (up to 115) compared to others (as low as 10). This variation suggests a potential seasonal pattern, with RVF cases being more frequent during certain months, including December up to April, possibly due to factors such as climate, vector activity, or human behavior.
Further, Figure 3 shows that the number of RVF cases has been steadily increasing over time, with a significant jump from 1996 to 2007. The increasing detection of RVF outbreaks reflects improved surveillance systems. The trend continues to rise, with a consistent upward slope from 1996 to 2010; hence, it is essential to take measures to control its spread and mitigate its impact on public health.

4.2. Correlation Across Variables

The correlation matrix in Figure 4 provides insights into the relationships between various variables and their impact on the outbreak of RVF. Among the variables positively impacting RVF outbreak cases, rainfall showed a slight positive correlation (0.029), indicating that higher rainfall levels may contribute slightly to the increased RVF cases. Similarly, the positive correlation with humidity (0.014) suggests that higher humidity levels might contribute to slightly increased RVF cases. Additionally, the year also exhibits a positive correlation (0.020) with RVF outbreak cases. Conversely, variables such as elevation (−0.010) and slope (−0.015) show negligible correlations with RVF outbreak cases, suggesting that these factors may not significantly influence the occurrence of RVF outbreaks. The positive correlation with clay patterns (0.003) implies that specific soil characteristics, possibly related to the clay content, may have a minor impact on the occurrence of RVF outbreaks.

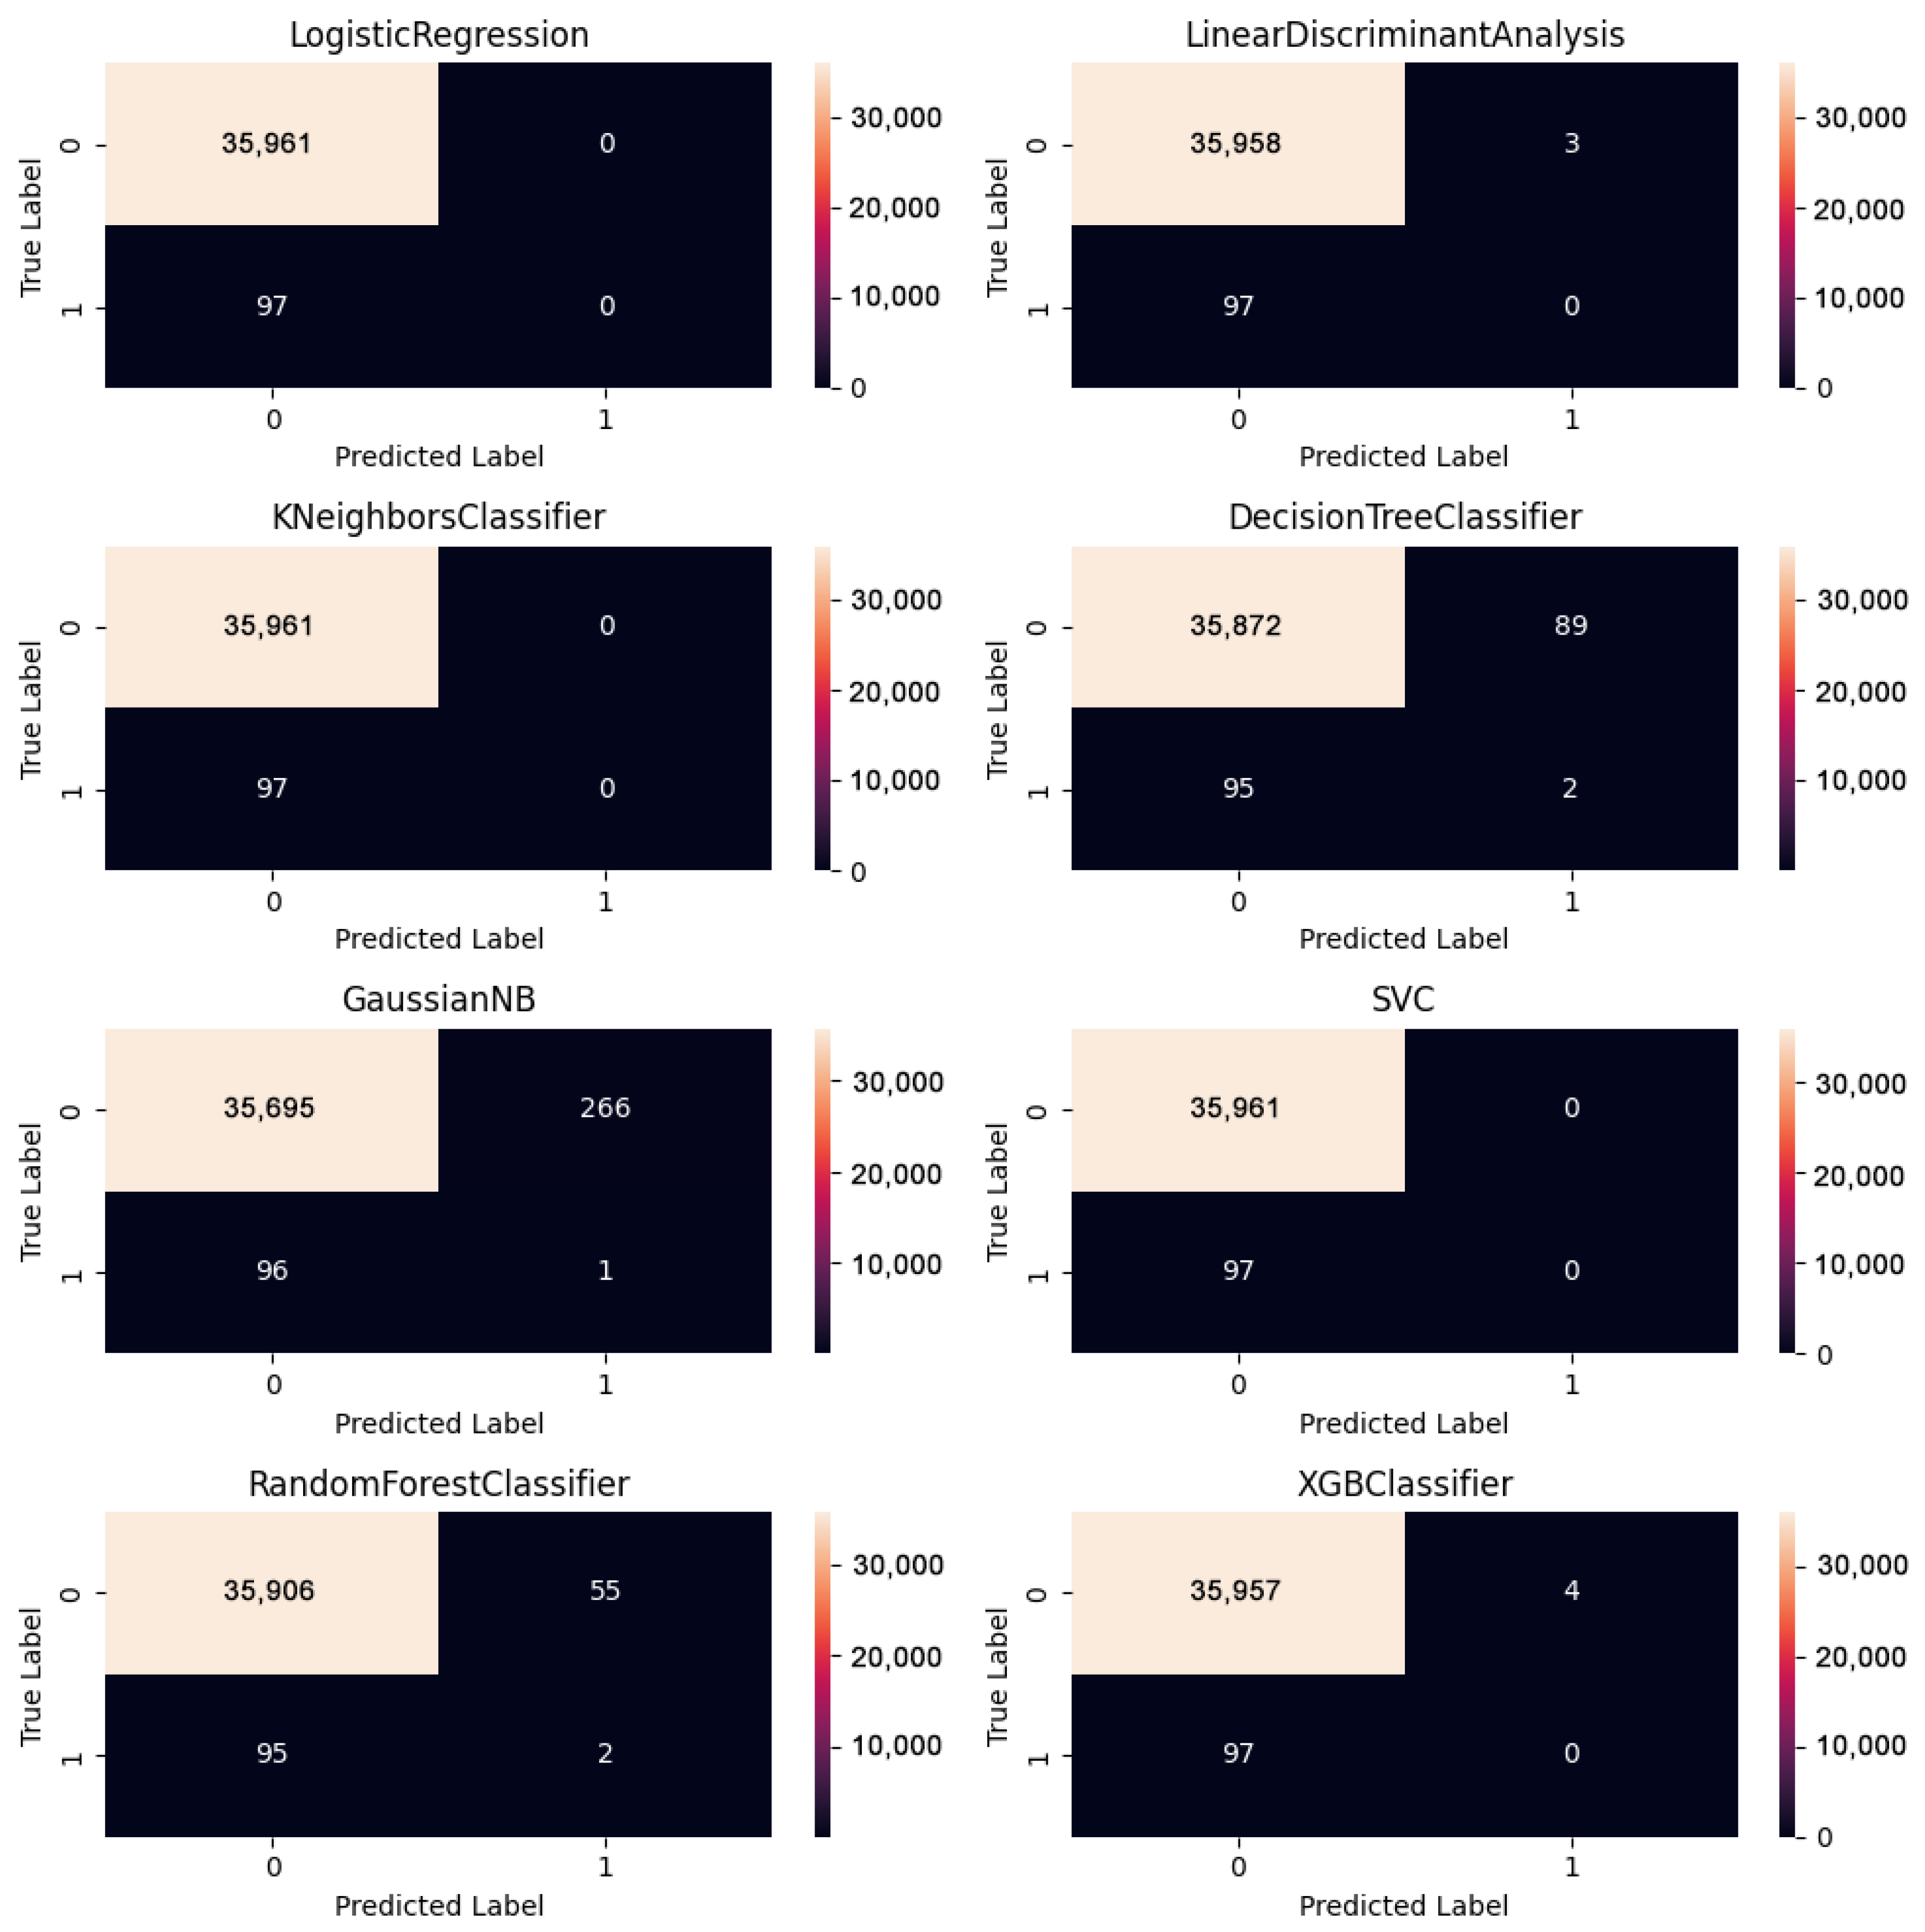
4.3. Model Selection and Evaluation

In this section, we delve into the critical process of selecting appropriate ML models for predicting RVF outbreaks in Kenya. This section outlines the rationale behind choosing specific ML algorithms and details the evaluation metrics used to assess the performance of these models. By thoroughly examining the model selection criteria and evaluation methods, we aim to ensure the reliability, accuracy, and robustness of our prediction tool, ultimately contributing to effective public health management strategies for RVF control.

4.4. ML Models Evaluation Metrics and Ensemble Predictions

Among the ML models evaluated in Table 4 for predicting RVF outbreaks in Kenya, LR, LDA, SVM, RF, and XG Boost demonstrate a somewhat good performance across various metrics in the context of balanced data. LR and LDA exhibit the highest accuracy scores of 0.9973 and 0.9972, respectively, showcasing their reliability in overall predictions. LR, SVM, and RF achieve near-perfect specificity scores of 1.00, followed by LDA and XG boost, indicating their proficiency in correctly identifying non-outbreak periods.
However, none of the models perform well in terms of sensitivity, precision, recall, or the F1 score for identifying RVF outbreak cases, as evidenced by the low or zero values across these metrics. This discrepancy guided further model refinement on feature engineering to improve the models’ ability to detect actual RVF outbreaks accurately, whereby the AUC ROC and PR AUC were used for further comparison and dealing with imbalanced data.

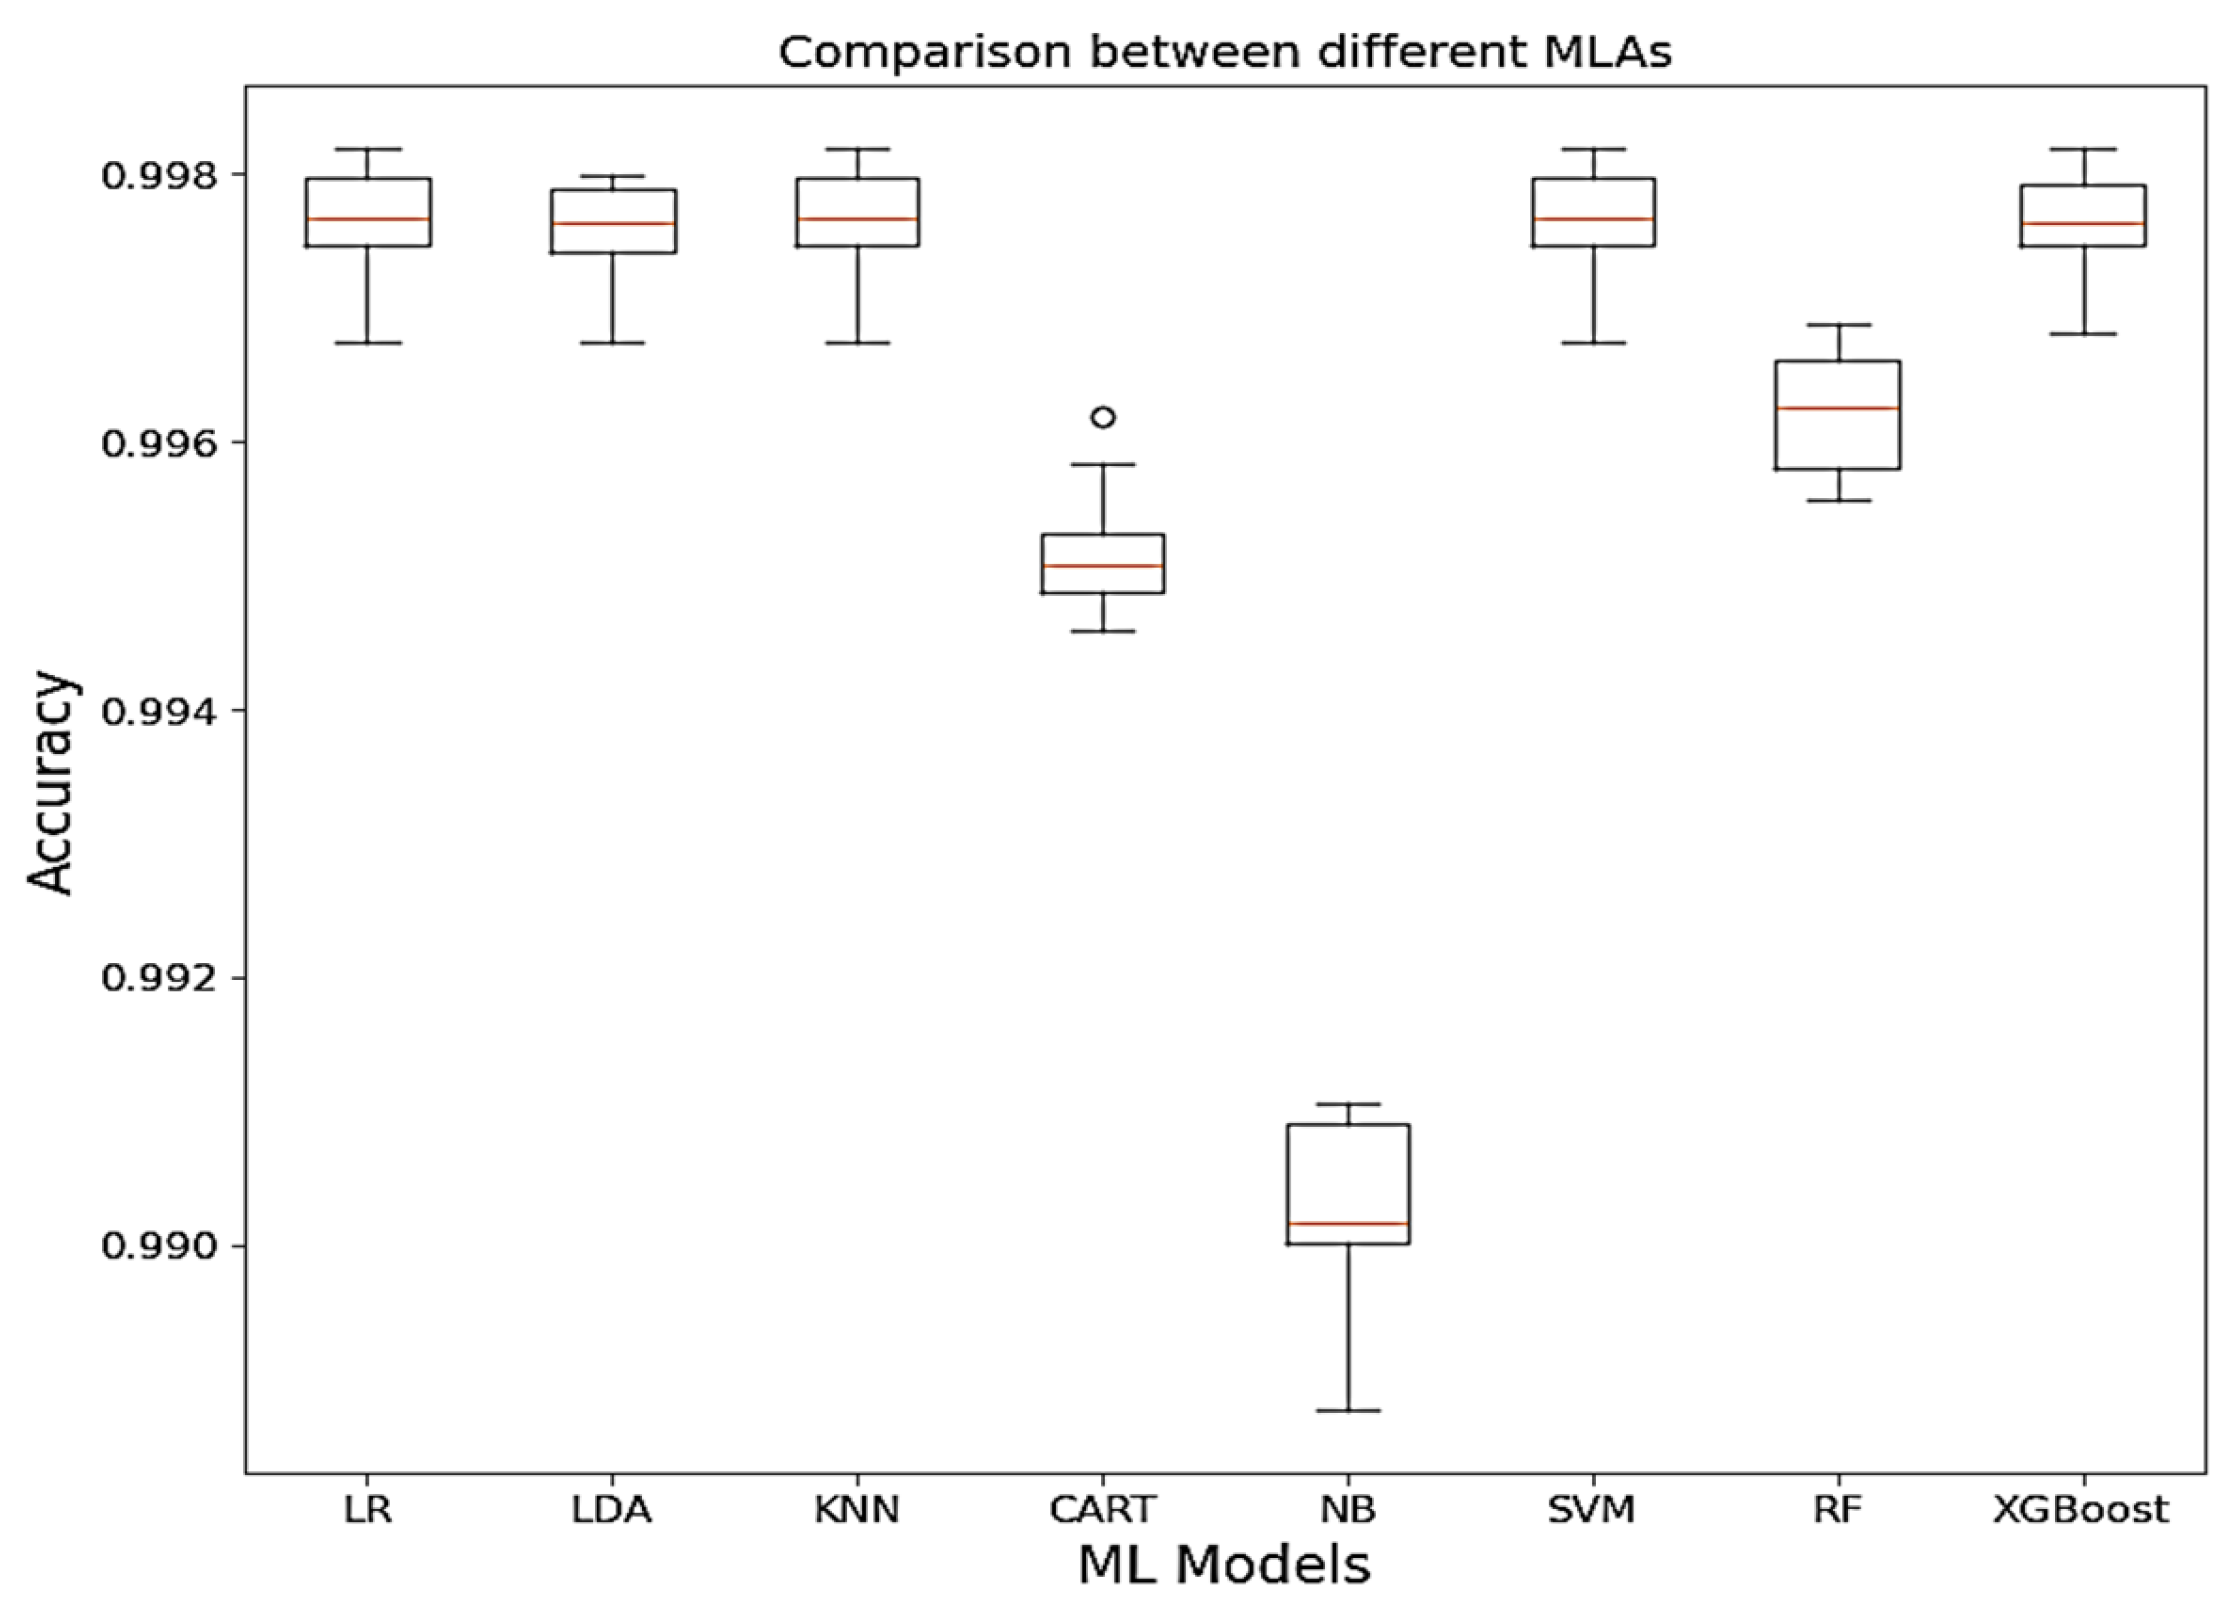
4.5. Comparison Between ML Models Based on Accuracy

Relying on the accuracy of the models, Figure 5 provides some insight into the model performances by showing that LR, LDA, SVM, RF, and XG Boost have good model accuracy.
Figure 6 shows the confusion matrix of the ensemble predictions that reflect the performance of the ML models when predicting RVF cases.

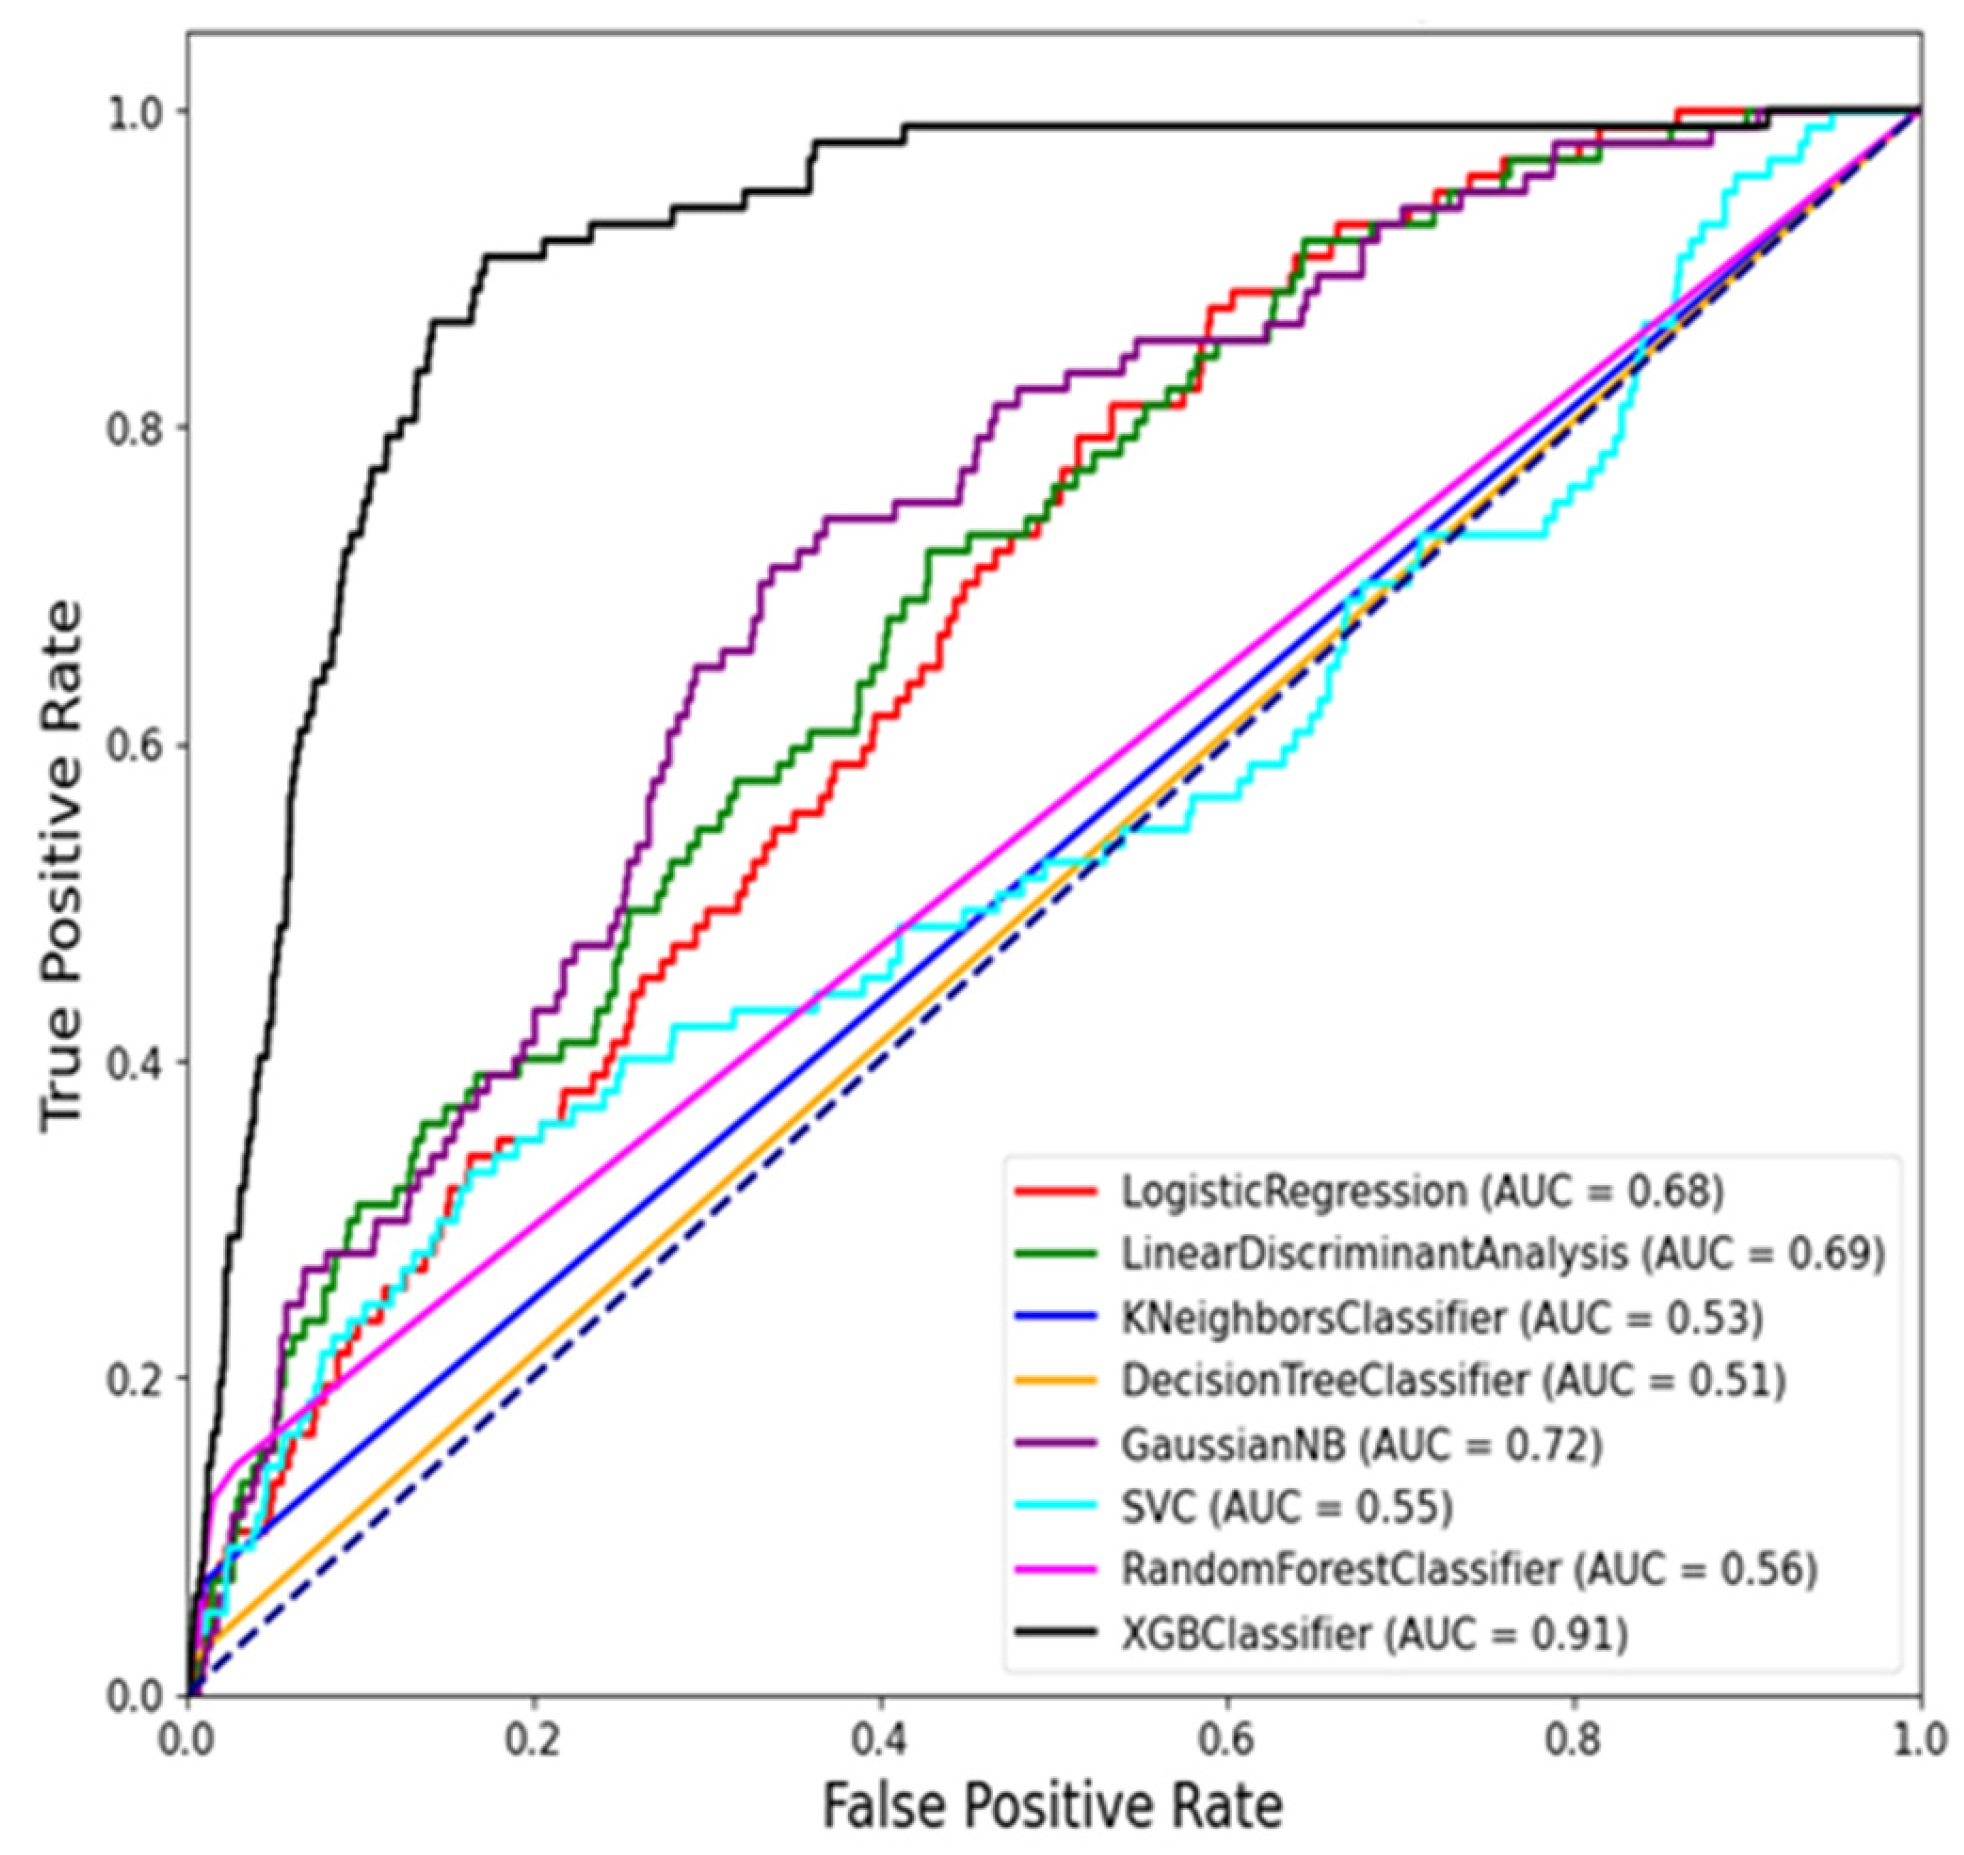
4.6. Advanced ML Models Evaluation Metrics

Previously, we explored the performance of various ML models using standard evaluation metrics such as accuracy, sensitivity, specificity, precision, recall, and the F1 score. However, here, we delve into more nuanced evaluation metrics that specifically focus on predictive performance, namely the precision–recall area under the curve (PR AUC) and receiver operating characteristic area under the curve (ROC AUC).
According to [20], these metrics provide deeper insights into how well ML models distinguish between positive and negative cases, emphasizing the importance of model discrimination and reliability in complex prediction tasks such as RVF outbreak detection and justifying the model even regardless of the imbalanced effect arising in it.
Figure 7 and Figure 8 show the ROC curve for the ML models using balanced tests and the average precision–recall curve for the ML models using unbalanced tests.
The comparison in Table 5 above highlights the performance of various ML models based on two key metrics that are PR AUC and ROC AUC. Based on the results, the XGB Classifier emerges as the top-performing model, achieving the highest PR AUC of 0.911 and a strong ROC AUC of 0.022. This indicates that the XGB Classifier is particularly effective in distinguishing RVF outbreak cases from non-outbreak periods, with high precision and recall rates [37]. Following closely behind, the Gaussian NB model demonstrates a respectable PR AUC of 0.719 and an ROC AUC of 0.021, suggesting decent performance in classifying RVF cases. Similarly, the LDA and LR models show moderate PR AUC and ROC AUC scores, indicating acceptable discriminatory power but with room for improvement. On the other hand, the RF Classifier, often considered a robust ML model, ranks lower in this comparison with a PR AUC of 0.5736 and a ROC AUC of 0.0089, underscoring the importance of considering multiple metrics for model evaluation.

5. Discussion

Currently, the use of ML techniques has been on the rise. The ML models have been shown to outperform several other statistical models in both predictions and classification tasks [38]. However, there is limited research on how these models classify disease outbreaks in East Africa. In the current study, various ML models were evaluated based on the statistical metrics, and the XG Boost Classifier emerged as the most accurate model in predicting RVF outbreaks based on the PR AUC and ROC AUC metrics.
The XG Boost model outperformed all the other models with a precision–recall AUC of 0.9110 and ROC AUC of 0.022, thus demonstrating its robustness in distinguishing outbreak periods [39]. These findings align with those of [40] on the application of ML algorithms in prediction and classification tasks. The ML models serve as powerful tools in disease surveillance and management, offering insights that can significantly impact public health strategies [41]. The strong performance of the XG Boost classifier underscores its potential as a valuable tool for early detection and intervention in RVF outbreaks.
It was keenly noted that while XG Boost demonstrated outstanding performance, other algorithms also contributed valuable insights. For instance, RF and LR models, though ranking lower, provided additional perspectives on RVF outbreak dynamics. This underscores the importance of considering a range of ML models to gain a comprehensive understanding of disease patterns [25].
The climatic predictors, such as rainfall, humidity, and clay patterns, were positively correlated with RVF cases. These positive correlations observed underscore the role of climatic conditions in vector population dynamics and RVF transmissions [42]. A major critique of this study was its use of random data splitting, which overlooked the seasonality and temporal trends critical for epidemiological predictions. Some reliable and potential solutions, such as time-series-based splitting or incorporating temporal trends, can be employed in future studies.
This study’s findings have significant implications for public health in RVF-endemic regions, especially East Africa. Accurate outbreak predictions enable timely interventions, such as vector control and vaccination campaigns, ultimately reducing economic losses and human morbidity. Future research should focus on integrating genomic data and longitudinal surveillance to refine the predictive models further. The integration of genomic data and longitudinal surveillance offers significant potential to improve the accuracy and biological relevance of predictive models for RVF. By capturing genetic variations in both mosquito vector populations and virus strains, these approaches provide critical insights into the dynamics of RVF outbreaks. The genomic data can reveal diversity in the genes and traits in the vectors. The longitudinal surveillance ensures the availability of environmental data, vector populations, and RVF cases over time.
Lastly, collaborative research between epidemiologists, climatologists, and data scientists is essential for developing holistic approaches to RVF surveillance.

6. Conclusions

The current study aimed to demonstrate the application of ML models to classify RVF outbreaks using climatic factors. The positive relationship between climatic factors and RVF cases stresses the significance of incorporating these factors in disease modeling and predictions. These insights are directly applicable to public health and can be used by policymakers. For instance, the XG Boost model stood out as being robust and the most accurate in predicting RVF outbreaks. The strong performance metrics displayed by the XG Boost model reveal its potential for making real-time disease predictions and firm decision-support tools for use in global health.
The study also emphasizes the need for improved data pre-processing methods, such as seasonal data splitting and the incorporation of recent case data, in order to increase model relevance and accuracy.
As such, incorporating ML into RVF surveillance and control demonstrates a significant step in mitigating the effects of zoonotic diseases. These findings can be directly applied to improving public health responses, such as early warning systems and better resource allocation for RVF outbreaks in East Africa and similar regions. Prioritizing interdisciplinary collaborations and research can improve global health security and resilience to emerging infectious disease outbreaks.

Author Contributions

Conceptualization, D.M., B.K. and B.B. Methodology, B.K., G.M. and D.M.; software, D.M.; validation, D.M. and B.B.; formal analysis, D.M.; investigation, D.M.; resources, B.B.; data curation, D.M.; writing—original draft preparation, D.M.; writing—review and editing D.M., B.B. and G.M.; visualization, D.M.; supervision, B.B., G.M. and B.K. All authors have read and agreed to the published version of the manuscript.

Funding

This study was funded by the Regional Scholarship and Innovation Fund (RSIF) of the Partnership for Skills in Applied Sciences, Engineering and Technology (PASET) (Project Grant No. P165581) grant to SACIDS Africa Centre of Excellence for Infectious Diseases of Humans and Animals in Southern and East Africa (SACIDS-ACE) at the Sokoine University of Agriculture (SUA). This study also received additional support from USAID, Operational research to improve policies and practices on the use of Rift Valley fever vaccines in East Africa, Contract Number 720FDA19IO00102.

Institutional Review Board Statement

Not applicable.

Informed Consent Statement

Not applicable.

Data Availability Statement

Acknowledgments

The authors extend their appreciation to their universities for supporting their research work.

Conflicts of Interest

The authors declare no conflicts of interest.

References

  1. Gaudreault, N.N.; Indran, S.V.; Balaraman, V.; Wilson, W.C.; Richt, J.A. Molecular aspects of Rift Valley fever virus and the emergence of reassortants. Virus Genes 2019, 55, 1–11. [Google Scholar] [CrossRef]
  2. Kuhn, J.H.; Brown, K.; Adkins, S.; De La Torre, J.C.; Digiaro, M.; Ergünay, K.; Firth, A.E.; Hughes, H.R.; Junglen, S.; Lambert, A.J.; et al. Promotion of order Bunyavirales to class Bunyaviricetes to accommodate a rapidly increasing number of related polyploviricotine viruses. J. Virol. 2024, 98, e01069-24. [Google Scholar] [CrossRef]
  3. Environmental Change and Rift Valley Fever in Eastern Africa: Projecting Beyond HEALTHY FUTURES|Geospatial Health. Available online: https://www.geospatialhealth.net/gh/article/view/387 (accessed on 22 November 2024).
  4. Webb, J., Jr. Disease and Epidemiology of Humans and Animals. In Oxford Research Encyclopedia of African History; Oxford University Press: Oxford, UK, 2019. [Google Scholar] [CrossRef]
  5. Peters, C.J.; Linthicum, K.J. Rift Valley Fever. In Handbook of Zoonoses, 2nd ed.; CRC Press: Boca Raton, FL, USA, 1994; ISBN 978-0-203-75246-3. [Google Scholar]
  6. Hartman, A. Rift Valley Fever. Clin. Lab. Med. 2017, 37, 285–301. [Google Scholar] [CrossRef] [PubMed]
  7. Insights into the Pathogenesis of Viral Haemorrhagic Fever Based on Virus Tropism and Tissue Lesions of Natural Rift Valley Fever. Available online: https://www.mdpi.com/1999-4915/13/4/709 (accessed on 23 November 2024).
  8. Ali, H.; Ali, A.; Umer, Z.; Numan, A.; Ali, H.; Adil, M.T.; Randhawa, U.A.; Khan, H.H.; Jamil, H.; Umar, S. Rift Valley Fever: Insights into Abortive and Zoonotic Disease. Int. J. Agric. Biosci. 2023, 48, 609–624. [Google Scholar] [CrossRef]
  9. LaBeaud, A.D.; Pfeil, S.; Muiruri, S.; Dahir, S.; Sutherland, L.J.; Traylor, Z.; Gildengorin, G.; Muchiri, E.M.; Morrill, J.; Peters, C.J.; et al. Factors Associated with Severe Human Rift Valley Fever in Sangailu, Garissa County, Kenya. PLoS Negl. Trop. Dis. 2015, 9, e0003548. [Google Scholar] [CrossRef]
  10. Das, S.; Dey, A.; Pal, A.; Roy, N. Applications of Artificial Intelligence in Machine Learning: Review and Prospect. Int. J. Comput. Appl. 2015, 115, 31–41. [Google Scholar] [CrossRef]
  11. Bent, O. Machine Learning Applied to Prediction, Control and Planning from Dynamic Epidemiological Models. University of Oxford, 2020. Available online: https://ora.ox.ac.uk/objects/uuid:db5aaded-6f10-4683-9b25-878f2ed8f9e0 (accessed on 7 August 2024).
  12. Kiunga, P.N. The Application of Ecological Niche Model to Map out the Rift Valley Fever Risk Areas in Kenya. Master’s Thesis, University of Nairobi, Nairobi, Kenya, 2015. Available online: http://erepository.uonbi.ac.ke/handle/11295/95236 (accessed on 23 November 2024).
  13. Chevalier, V.; Pépin, M.; Plée, L.; Lancelot, R. Rift Valley fever—A threat for Europe? Eurosurveillance 2010, 15, 19506. [Google Scholar] [CrossRef] [PubMed]
  14. Nanyingi, M.O.; Munyua, P.; Kiama, S.G.; Muchemi, G.M.; Thumbi, S.M.; Bitek, A.O.; Bett, B.; Muriithi, R.M.; Njenga, M.K. A systematic review of Rift Valley Fever epidemiology 1931–2014. Infect. Ecol. Epidemiol. 2015, 5, 28024. [Google Scholar] [CrossRef] [PubMed]
  15. Lumley, S.; Horton, D.L.; Hernandez-Triana, L.L.M.; Johnson, N.; Fooks, A.R.; Hewson, R. Rift Valley fever virus: Strategies for maintenance, survival and vertical transmission in mosquitoes. J. Gen. Virol. 2017, 98, 875–887. [Google Scholar] [CrossRef]
  16. Anyamba, A.; Chretien, J.-P.; Small, J.; Tucker, C.J.; Formenty, P.B.; Richardson, J.H.; Britch, S.C.; Schnabel, D.C.; Erickson, R.L.; Linthicum, K.J. Prediction of a Rift Valley fever outbreak. Proc. Natl. Acad. Sci. USA 2009, 106, 955–959. [Google Scholar] [CrossRef]
  17. Gachohi, J.; Bett, B.; Njogu, G.; Mariner, J.; Jost, C. The 2006–2007 Rift Valley fever outbreak in Kenya: Sources of early warning messages and response measures implemented by the Department of Veterinary Services. Rev. Sci. Tech. Int. Off. Epizoot. 2012, 31, 877–887. [Google Scholar] [CrossRef] [PubMed]
  18. Demirsoy, I.; Karaibrahimoglu, A. Identifying drug interactions using machine learning. Adv. Clin. Exp. Med. 2023, 32, 829–838. [Google Scholar] [CrossRef]
  19. Mulwa, D.; Kazuzuru, B.; Misinzo, G.; Bett, B. An XGBoost Approach to Predictive Modelling of Rift Valley Fever Outbreaks in Kenya Using Climatic Factors. Big Data Cogn. Comput. 2024, 8, 148. [Google Scholar] [CrossRef]
  20. Afrifa-Yamoah, E.; Adua, E.; Peprah-Yamoah, E.; Anto, E.O.; Opoku-Yamoah, V.; Acheampong, E.; Macartney, M.J.; Hashmi, R. Pathways to chronic disease detection and prediction: Mapping the potential of machine learning to the pathophysiological processes while navigating ethical challenges. Chronic Dis. Transl. Med. 2024, in press. [Google Scholar] [CrossRef]
  21. XGBoost and Random Forest Algorithms: An in Depth Analysis|Pakistan Journal of Scientific Research. Available online: https://pjosr.com/index.php/pjosr/article/view/946 (accessed on 22 November 2024).
  22. Balkhy, H.H.; Memish, Z.A. Rift Valley fever: An uninvited zoonosis in the Arabian peninsula. Int. J. Antimicrob. Agents 2003, 21, 153–157. [Google Scholar] [CrossRef]
  23. Rupasinghe, R.; Chomel, B.B.; Martínez-López, B. Climate change and zoonoses: A review of the current status, knowledge gaps, and future trends. Acta Trop. 2022, 226, 106225. [Google Scholar] [CrossRef] [PubMed]
  24. Palaniyandi, M.; Anand, P.; Maniyosai, R.; Mariappan, T.; Das, P. The integrated remote sensing and GIS for mapping of potential vector breeding habitats, and the Internet GIS surveillance for epidemic transmission control, and management. J. Entomol. Zool. Stud. 2016, 4, 310–318. [Google Scholar]
  25. Rizaldi, M.I.; Chandranegara, D.R.; Akbi, D.R. Comparison of Machine Learning Techniques for Classification of Distributed Denial of Service Attacks Based on Feature Engineering in SDN-Based Networks. JIPI J. Ilm. Penelit. Dan Pembelajaran Inform. 2024, 9, 1180–1197. [Google Scholar] [CrossRef]
  26. Early Detection and Prediction of Zoonotic Disease Events Using Event-Based Surveillance and Machine Learning—ProQuest. Available online: https://www.proquest.com/openview/9eae8386fd3703c3ced08eda07fc4ae5/1?pq-origsite=gscholar&cbl=18750&diss=y (accessed on 22 November 2024).
  27. Ratner, B. The correlation coefficient: Its values range between +1/−1, or do they? J. Target. Meas. Anal. Mark. 2009, 17, 139–142. [Google Scholar] [CrossRef]
  28. Download R-4.4.2 for Windows. The R-Project for Statistical Computing. Available online: https://cran.r-project.org/bin/windows/base/ (accessed on 23 November 2024).
  29. Mupangwa, W.; Chipindu, L.; Nyagumbo, I.; Mkuhlani, S.; Sisito, G. Evaluating machine learning algorithms for predicting maize yield under conservation agriculture in Eastern and Southern Africa. SN Appl. Sci. 2020, 2, 952. [Google Scholar] [CrossRef]
  30. Martinasek, Z.; Zeman, V.; Malina, L.; Martinasek, J. k-Nearest Neighbors Algorithm in Profiling Power Analysis Attacks. Radioengineering 2016, 25, 365–382. [Google Scholar] [CrossRef]
  31. Sarker, I.H. Machine Learning: Algorithms, Real-World Applications and Research Directions. SN Comput. Sci. 2021, 2, 160. [Google Scholar] [CrossRef]
  32. Singh, A.; Halgamuge, M.H.; Lakshmiganthan, R. Impact of Different Data Types on Classifier Performance of Random Forest, Naïve Bayes, and K-Nearest Neighbors Algorithms. Int. J. Adv. Comput. Sci. Appl. 2017. [Google Scholar] [CrossRef]
  33. Maldonado, S.; López, J. Dealing with high-dimensional class-imbalanced datasets: Embedded feature selection for SVM classification. Appl. Soft Comput. 2018, 67, 94–105. [Google Scholar] [CrossRef]
  34. Ali, J.; Khan, R.; Ahmad, N.; Maqsood, I. Random Forests and Decision Trees. IJCSI Int. J. Comput. Sci. Issues 2012, 9, 272–278. [Google Scholar]
  35. Machine Learning: A Review of Classification and Combining Techniques|Artificial Intelligence Review. Available online: https://link.springer.com/article/10.1007/s10462-007-9052-3 (accessed on 23 November 2024).
  36. Hayman, D.T.S.; Adisasmito, W.B.; Almuhairi, S.; Behravesh, C.B.; Bilivogui, P.; Bukachi, S.A.; Casas, N.; Becerra, N.C.; Charron, D.F.; Chaudhary, A.; et al. Developing One Health surveillance systems. One Health 2023, 17, 100617. [Google Scholar] [CrossRef] [PubMed]
  37. Zhang, T.; Rabhi, F.; Chen, X.; Paik, H.; MacIntyre, C.R. A machine learning-based universal outbreak risk prediction tool. Comput. Biol. Med. 2024, 169, 107876. [Google Scholar] [CrossRef]
  38. Carnahan, B.; Meyer, G.; Kuntz, L.A. Comparing Statistical and Machine Learning Classifiers: Alternatives for Predictive Modeling in Human Factors Research. Hum. Factors 2003, 45, 408–423. [Google Scholar] [CrossRef]
  39. XGBoost|Proceedings of the 22nd ACM SIGKDD International Conference on Knowledge Discovery and Data Mining. Available online: https://dl.acm.org/doi/abs/10.1145/2939672.2939785 (accessed on 23 November 2024).
  40. Chen, M.; Hao, Y.; Hwang, K.; Wang, L.; Wang, L. Disease Prediction by Machine Learning Over Big Data From Healthcare Communities. IEEE Access 2017, 5, 8869–8879. [Google Scholar] [CrossRef]
  41. Javaid, M.; Haleem, A.; Pratap Singh, R.; Suman, R.; Rab, S. Significance of machine learning in healthcare: Features, pillars and applications. Int. J. Intell. Netw. 2022, 3, 58–73. [Google Scholar] [CrossRef]
  42. Leedale, J.; Jones, A.E.; Caminade, C.; Morse, A.P. A dynamic, climate-driven model of Rift Valley fever. Geospat. Health 2016, 11, 394. [Google Scholar] [CrossRef]
Figure 1. Distribution of RVF cases in Kenya from 1981–2010.
Zoonoticdis 05 00020 g001
Figure 2. Flowchart for ML approach.
Zoonoticdis 05 00020 g002
Figure 3. RVF cases across months.
Zoonoticdis 05 00020 g003
Figure 4. Correlation matrix of variables used.
Zoonoticdis 05 00020 g004
Figure 5. Comparison between ML models based on accuracy.
Zoonoticdis 05 00020 g005
Figure 6. Confusion matrix for the ML models used.
Zoonoticdis 05 00020 g006
Figure 7. ROC curve for the ML models using balanced tests.
Zoonoticdis 05 00020 g007
Figure 8. Average precision–recall curve for the ML models using unbalanced tests.
Zoonoticdis 05 00020 g008
Table 1. Description of the variables used in this study.
VariableScale of MeasurementVariable CategoryPossible Impact
Dependent/independentDiscreteIndependent variable+/−
MonthCategorical (Jan–Dec)Independent variable+/−
RainfallContinuousIndependent variableHigher rainfall increases RVF outbreaks due to vector breeding grounds.
ElevationContinuousIndependent variableLower elevations create ideal conditions for mosquitoes, while higher elevations reduce mosquito activity and virus transmission.
SlopeContinuousIndependent variableSteeper slopes facilitate runoff, reducing mosquito habitats and RVF outbreak risk.
ClayContinuousIndependent variableSoil with high clay content retains water for longer periods, hence increasing the likelihood of RVF outbreaks in areas with clay-heavy soils.
HumidityContinuousIndependent variableHigh humidity levels enhance mosquito survival and activity, hence increasing the lifespan of the virus in the environment, contributing to higher risks of RVF transmission in humid regions.
RVF outbreak casesCategoricalDependent variable+/−
Table 2. Binary classification evaluation metrics and their importance.
Metric and CurvesImplication of UsageFormula
False PositiveWhen we predict a level or event that did not happen F P = F P F P + T N
False NegativeWhen we do not predict a level or event, and it does happen F N = F N F N + T P
True positiveWhen we predict the right level T P = T N T N + F P
Negative Predictive valueLooks on precision for negative class. N P = T N T N + F N
Sensitivity/RecallHow accurately does the classifier classify actual events? T P = T P T P + F N
PrecisionHow accurately does the classifier predict events? P = T P T P + F N
AccuracyHow good at classifying both positive
and negative cases the model is
A C C = T P + T N   T P + F N + T N + F P
Confusion matrixTable that contains true negative, false
positive, false negative, and true positive values
T P F P T N F N
F1 scoreGeometric average of precision and recall F 1 = 1 + β 2 ( p r e c i s i o n     r e c a l l ) / ( β ^ 2     p r e c i s i o n + r e c a l l )
ROC AUC curve and scoresIt can be used to show the trade-off be
tween the false predictive rate (FPR) and
true positive rate (TPR) in a single visualization
Precision–Recall curve and scoresWhen data are heavily imbalanced, they can
be used to combine precision (PPV)
and recall (TPR) in a single visualization
Table 3. Prevalence of RVF outbreaks in Kenya up to the year 2010.
ProvinceRVF OutbreaksPercentage (%)
Central6314.5
Coast4610.6
Eastern8920.6
Nairobi378.5
North Eastern8218.9
Nyanza00
Rift Valley11626.8
Western00
Table 4. Performance of classification models for RVF case prediction.
LRLDAKNNCARTNBSVM
Accuracy0.9970.9970.9970.9940.9890.997
Sensitivity0.0000.0000.0000.0210.0100.000
Specificity1.0000.9991.0000.9970.9921.000
Precision0.0000.0000.0000.0210.0040.000
Recall0.0000.0000.0000.02060.0100.000
F1score0.0000.0000.0000.02120.0050.000
Table 5. Ranking ML models based on feature importance and balanced nature of tests.
PR ClassifierAUCROCAUC
Decision Tree Classifier0.0223XG B Classifier0.9110
X GB Classifier0.0214Gaussian NB0.7192
K-Neighbors0.0096LDA0.6941
Random Forest Classifier0.0089Logistic Regression0.6756
Gaussian NB0.0062Random Forest Classifier0.5736
LDA0.0059K-Neighbors Classifier0.5303
Logistic Regression0.0052Decision Tree Classifier0.5090
SVM0.0049SVM0.4487
Disclaimer/Publisher’s Note: The statements, opinions and data contained in all publications are solely those of the individual author(s) and contributor(s) and not of MDPI and/or the editor(s). MDPI and/or the editor(s) disclaim responsibility for any injury to people or property resulting from any ideas, methods, instructions or products referred to in the content.

