Article

Tracking Co-Occurrence of N501Y, P681R, and Other Key Mutations in SARS-CoV-2 Spike for Surveillance

by
Carol Lee
1,
Shruthi Mangalaganesh
2,3,
Laurence O. W. Wilson
1,
Michael J. Kuiper
4,
Trevor W. Drew
2,5 and
Seshadri S. Vasan
2,6,7,*
1
Commonwealth Scientific and Industrial Research Organisation, Transformational Bioinformatics Group, North Ryde, NSW 2113, Australia
2
Commonwealth Scientific and Industrial Research Organisation, Australian Centre for Disease Preparedness, Geelong, VIC 3220, Australia
3
Monash Biomedicine Discovery Institute, Monash University, Clayton, VIC 3800, Australia
4
Commonwealth Scientific and Industrial Research Organisation, Data61, Docklands, VIC 3008, Australia
5
School of Veterinary Medicine and Science, Sutton Bonington Campus, University of Nottingham, Sutton Bonington LE12 5RD, UK
6
Department of Health, 189 Royal Street, East Perth, WA 6004, Australia
7
Department of Health Sciences, University of York, York YO10 5DD, UK
*
Author to whom correspondence should be addressed.
Zoonotic Dis. 2022, 2(3), 147-162; https://doi.org/10.3390/zoonoticdis2030014
Submission received: 6 April 2022 / Revised: 29 August 2022 / Accepted: 5 September 2022 / Published: 9 September 2022
(This article belongs to the Special Issue Feature Papers of Zoonotic Diseases 2021–2022)

Abstract

:
The severe acute respiratory syndrome coronavirus 2 (SARS-CoV-2) has produced five variants of concern (VOC) to date. The important spike mutation ‘N501Y’ is common to Alpha, Beta, Gamma, and Omicron VOC, while the ‘P681R’ is key to Delta’s spread. We have analysed circa 10 million SARS-CoV-2 genome sequences from the world’s largest repository, ‘Global Initiative on Sharing All Influenza Data (GISAID)’, and demonstrated that these two mutations have co-occurred on the spike ‘D614G’ mutation background at least 5767 times from 12 May 2020 to 28 April 2022. In contrast, the Y501-H681 combination, which is common to Alpha and Omicron VOC, is present in circa 1.1 million entries. Over half of the 5767 co-occurrences were in France, Turkey, or US (East Coast), and the rest across 88 other countries; 36.1%, 3.9%, and 4.1% of the co-occurrences were Alpha’s Q.4, Gamma’s P.1.8, and Omicron’s BA.1.1 sub-lineages acquiring the P681R; 4.6% and 3.0% were Delta’s AY.5.7 sub-lineage and B.1.617.2 lineage acquiring the N501Y; the remaining 8.2% were in other variants. Despite the selective advantages individually conferred by N501Y and P681R, the Y501-R681 combination counterintuitively did not outcompete other variants in every instance we have examined. While this is a relief to worldwide public health efforts, in vitro and in vivo studies are urgently required in the absence of a strong in silico explanation for this phenomenon. This study demonstrates a pipeline to analyse combinations of key mutations from public domain information in a systematic manner and provide early warnings of spread. The study here demonstrates the usage of the pipeline using the key mutations N501Y, P681R, and D614G of SARS-CoV-2.

1. Introduction

The severe acute respiratory syndrome coronavirus 2 (SARS-CoV-2), which causes the ongoing novel coronavirus disease 19 (COVID-19) pandemic, has a single-stranded positive-strand ribonucleic acid genome (ssRNA(+) genome) of size 26–32 kb with high fidelity replication due to a 3′-to-5′ exoribonuclease ‘proof-reading’ mechanism [1,2]. As this virus adapts to its human host, we have seen it evolve and present quasi-species diversity [2,3]. While most of the several thousands of mutations catalogued to date are not substantial functional changes, they have proven to be ætiologically useful [4,5].
Two years since the start of the COVID-19 pandemic, we now have a good idea of its key mutations, especially in the spike protein, which are punctuations in the evolutionary story of this virus to date. The D614G mutation reported in April 2020 resulted in the ‘G-strain’, with increased infectivity, replacing the genomic background of this virus globally, although there was no impact on vaccine efficacy [5,6,7]. However, the N501Y mutation common to the Alpha, Beta, Gamma, and Omicron variants of concern (VOC) has contributed to enhanced infection and transmission, reduced vaccine efficacy, and the ability of SARS-CoV-2 to infect new species such as wild-type mice [8,9,10,11]. Another key mutation is the P681R, which alters the furin cleavage site and has been responsible for increased infectivity, transmission, and global impact of the Delta variant [12,13,14].
Our primary objective was to investigate the risk of the three aforementioned ‘mutations of current interest’ (MOCI) co-occurring naturally due to convergent evolution and resulting in a SARS-CoV-2 variant that is of greater concern than those declared to date, noting that the latest Omicron VOC has the N501Y but not the P681R mutation. Our secondary objective was to demonstrate a methodology and pipeline to analyse the spread of variants containing combinations of important mutations. We achieved this by mining data from GISAID, the Global Initiative on Sharing All Influenza Data, which is the largest and the most comprehensive repository of SARS-CoV-2 sequences [15,16].

2. Methods

2.1. Study Rationale

As per our objectives above, we firstly calculated the delay from sample collection to submission to outline the importance of prompt investigations of key mutations identified. GISAID has been one of the most-utilized databases since the COVID-19 pandemic, and while there are a host of other databases, these are not as readily available. One example is the European Nucleotide Archive (ENA), which contains a subset of data available on GISAID. Figure 1 shows that data analysed on 1 November 2021 had a 31-day average delay (median = 21, with >25% being above average, and maximum difference being 277 days or ~9 months) between sample collection and sample submission based on our MOCI. A comparison with data from 6 months after initial analysis (28 April 2022) shows that the average delay increased to ~36 days with a median of 22 days; >28% were above average, and the largest delay was 583 days after collection (~1.6 years). Our study presents a methodology to analyse mutations of interest in locally available sequences without the need to wait for globally submitted sequences. Given the current knowledge of SARS-CoV-2, response time in the event of highly transmissible VOCs can be significant in helping health authorities survey specific mutations that are emerging and transmitting. In the case of Omicron, Figure 1 illustrates that from the date of first report at the start of November, the average daily prevalence globally had already reached over 80% by the fourth week.
The pipeline presented here can allow local authorities to search for mutations of interest with their local data (VCF input), which are most relevant, without the need to rely solely on GISAID. This does not disclaim GISAID as a highly important database but emphasizes our approach as an additional means to interrogate the viral genome. In addition, our pipeline can also customize mutation ratio thresholds (rate of mutation compared to reference) and timeframes to examine when mutation combinations have exceeded reference:mutation ratios [11]. As a case study, we have chosen the MOCI based on its importance for SARS-CoV-2 transmission and infection to illustrate the practicality of our pipeline. We used quasi-species theory and in silico modelling to interpret our findings to the extent possible. We conclude with recommendations for future research directions.

2.2. Bioinformatics Analysis

We mined GISAID data, available online: https://gisaid.org (accessed on 5 May 2022) containing 10,625,557 entries; 99.9% (10,617,203) were sequenced from people who tested positive for COVID-19. Of these, 10,460,786 contained over 29 thousand nucleotides and were deemed ‘complete’. GISAID has also defined a subset of these 10.6 million sequences, containing 5,351,745 entries, as ‘high coverage’. This is because 99% of their bases are defined; there is no unverified deletion or insertion, and unique mutations not seen in other sequences constitute fewer than 0.05% in these entries. Consequently, some of our analysis of the data downloaded on 28 April 2022 (10,233,769 sequences) required manual curation whenever we encountered incorrect dates or low coverage sequencing that could skew our results. Supplementary Table S1 provides GISAID’s break down of these 10.6 million entries by variants containing the D614G (97.7%), N501Y (41.1%), and P681R (41.2%) mutations; by Alpha (11.1%), Beta (0.4%), Gamma (1.2%), Delta (41.2%), Omicron (0.1%) VOC; and by Lambda (0.1%) and Mu (0.1%) variants of interest (VOI).
Human-origin SARS-CoV-2 sequences over 29 kb length were aligned to the nominal reference (EPI_ISL_402123) using an in-house alignment pipeline that generated a file in the ‘variant call format’ (VCF) containing all the mutations as of 28 April 2022 [1,2]. In the VCF containing 10,233,768 genome sequences, we searched for entries with our MOCI. For example, the spike N501Y was searched at nucleotide position 23,403 for an A to G transition. The EPI_ISL sample IDs containing our MOCI were merged with their respective GISAID metadata (location, date of collection, lineage) to create an annotated database. Supplementary Table S1 shows the split up of these 10.2 million sequences by variants containing the D614G (99.3%), N501Y (40.8%), and P681R (42.7%) mutations; and by Alpha (11.2%), Beta (0.4%), Gamma (1.2%), Delta (41.7%), Omicron (31.5%), Lambda (0.1%), and Mu (0.2%) VOC/VOI.
Using a custom Python code, we identified the presence of the D614G, N501Y, and P681R mutations and combinations thereof (c.f. ‘Data Availability’ for our code). Our final dataset contained 9,955,794 entries after filtering out GISAID records with incomplete dates, i.e., retaining those with a ‘YYYY-MM-DD’ format. We ascertained whether these isolates are one of the VOC (and if so, which sub-lineage), their location (country, state, and city depending on information available), and sample collection date. Using the latter, we calculated rolling averages over 14 days, as this window has been shown from previous experience to be an optimal period to reduce background noise, especially as the data are discrete and highly variable in size across countries [11]. However, unlike our previous study, in which we were interested in macroscopic trends, here we have looked at every instance of key mutations co-occurring; therefore, we did not use a threshold or filter based on minimal sample size. Our analysis presents the spread of these mutations from the notional start of the SARS-CoV-2 pandemic (31 December 2019) to the end of our observation period (28 April 2022) with appropriate classifications (e.g., Alpha, Beta, Gamma, Delta, and Omicron).

2.3. Biomolecular Modelling

Fully glycosylated in silico models of the SARS-CoV-2 spike protein were constructed based on the ‘6VSB’ protein databank (PDB) structure [17], minus the transmembrane domain (residues 1161–1272), for additional computational efficiency as described previously [7]. Models were simulated in aqueous solution (TIP3, water, 0.15M ions, NVT ensemble, 310K) using NAMD 2.14 software [18]. Models were visualised with the visual molecular dynamics (VMD) program for large biomolecular systems, which uses 3D graphics and built-in scripting to assess the spatial arrangement of mutations and any complementary or inhibitory interactions [19].

3. Results

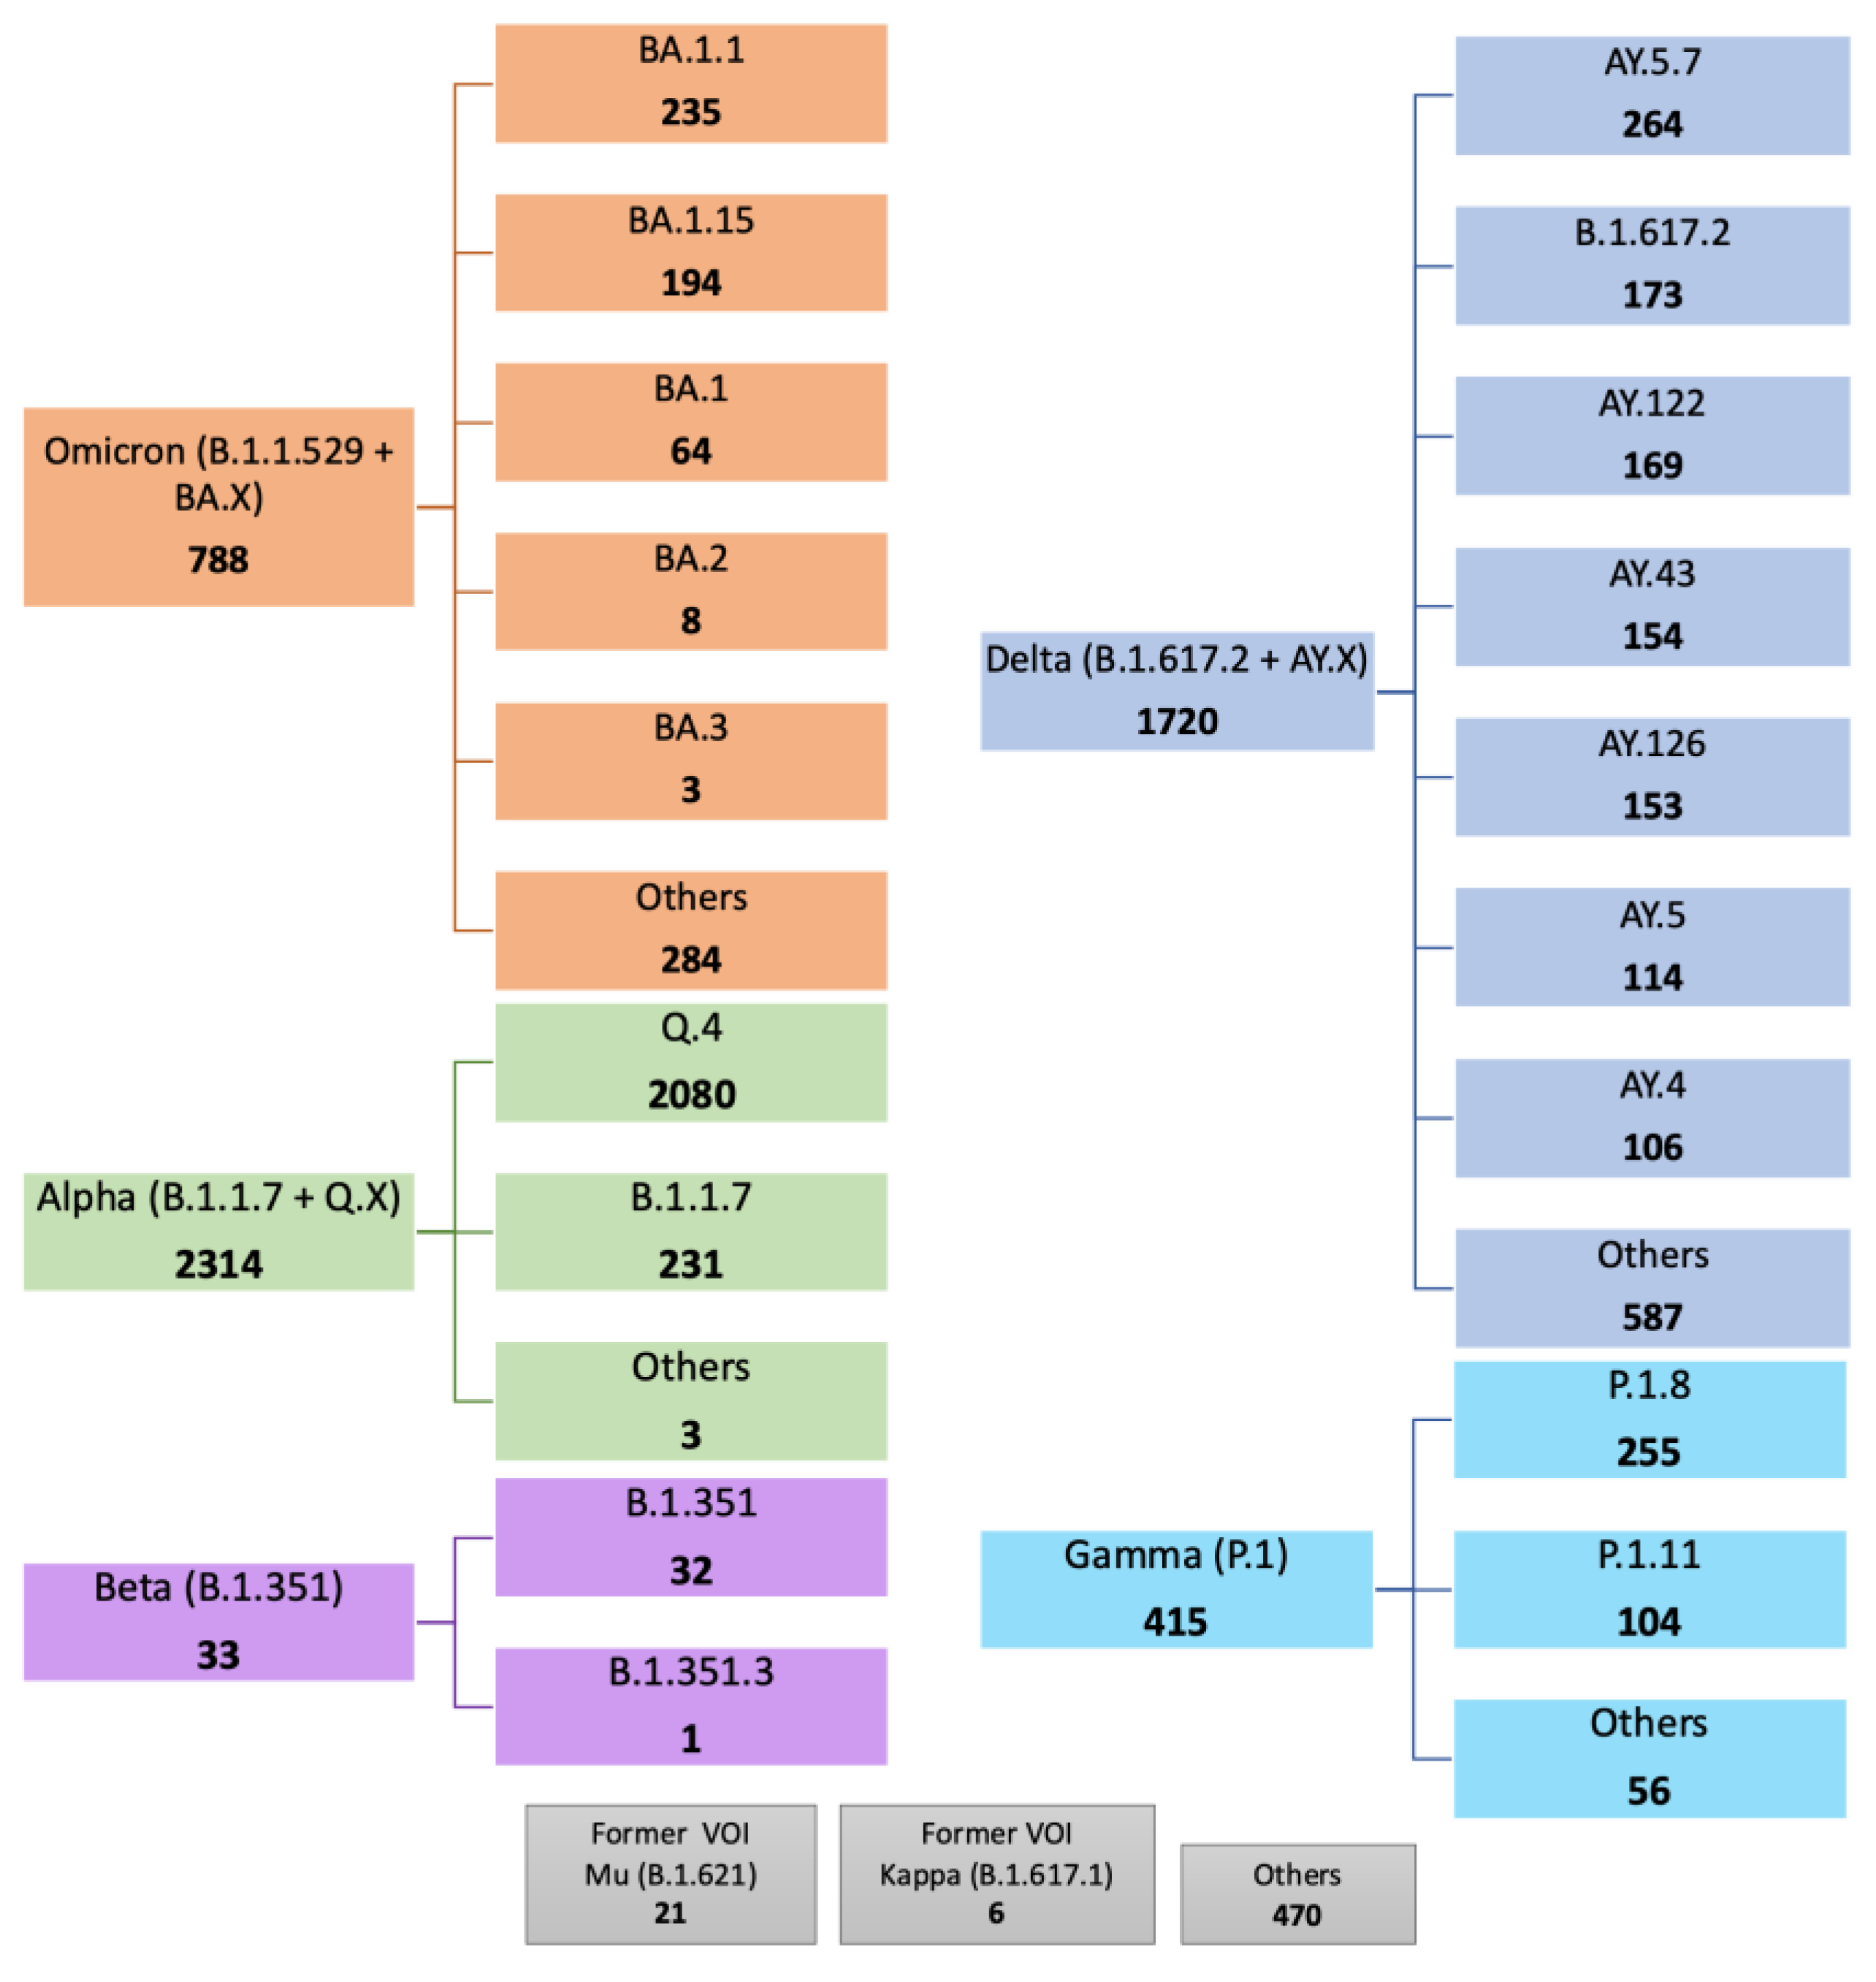
3.1. Predominance of Alpha Q.4 acquiring P681R and Delta Acquiring N501Y

Mining of GISAID data found 5767 entries (0.05%) containing the MOCI; a majority of these were in current VOC (Alpha (40.1%), Beta (0.6%), Gamma (7.2%), Delta (29.8%), Omicron (13.7%)), and a small proportion were in current or former VOI (Mu (0.4%) and Kappa (0.1%)). A small proportion (8.1%) was also observed in other variants not classified as VOC, VOI, Variant Under Monitoring (VUM), or specific sub-lineages (Figure 2). We report that the co-occurrence of the MOCI is largely due to (a) the Alpha VOC acquiring the P681R, overwhelmingly in Alpha’s Q.4 sub-lineage (89.9%) by definition; (b) the Omicron VOC acquiring P681R, mainly in the BA.1.1 sub-lineage (29.8%); (c) the Delta VOC acquiring the N501Y (29.8%), in Delta’s sub-lineage (AY.5.7; 15.4%); (d) the Gamma VOC acquiring the P681R (7.2%), predominantly in its P.1.8 sub-lineage (61.5%). It is worth noting that the Q.4 sub-lineage has P681R by definition (https://outbreak.info/situation-reports?pango=Q.4, accessed on 11 March 2022). The Beta VOC acquiring the P681R only constituted 0.6% of the total occurrences, and this was almost entirely in the B.1.351 parent lineage (97.0%). Supplementary Table S2 shows a breakdown of the 501Y and 681R mutations acquired in the Delta and Alpha-Beta-Gamma-Omicron variants, respectively. We also see that 5800 entries contain N501Y + P681R, just 33 more than the 5767 entries that contain D614G + N501Y + P681R.
Supplementary Table S3 shows the results for other key spike mutations in comparison to those obtained from GISAID. For H69del and Y145del, more samples were identified using our pipeline than on GISAID: 3,355,555 versus 3,257,233 before date filtering and 3724 versus 3297 after date filtering.

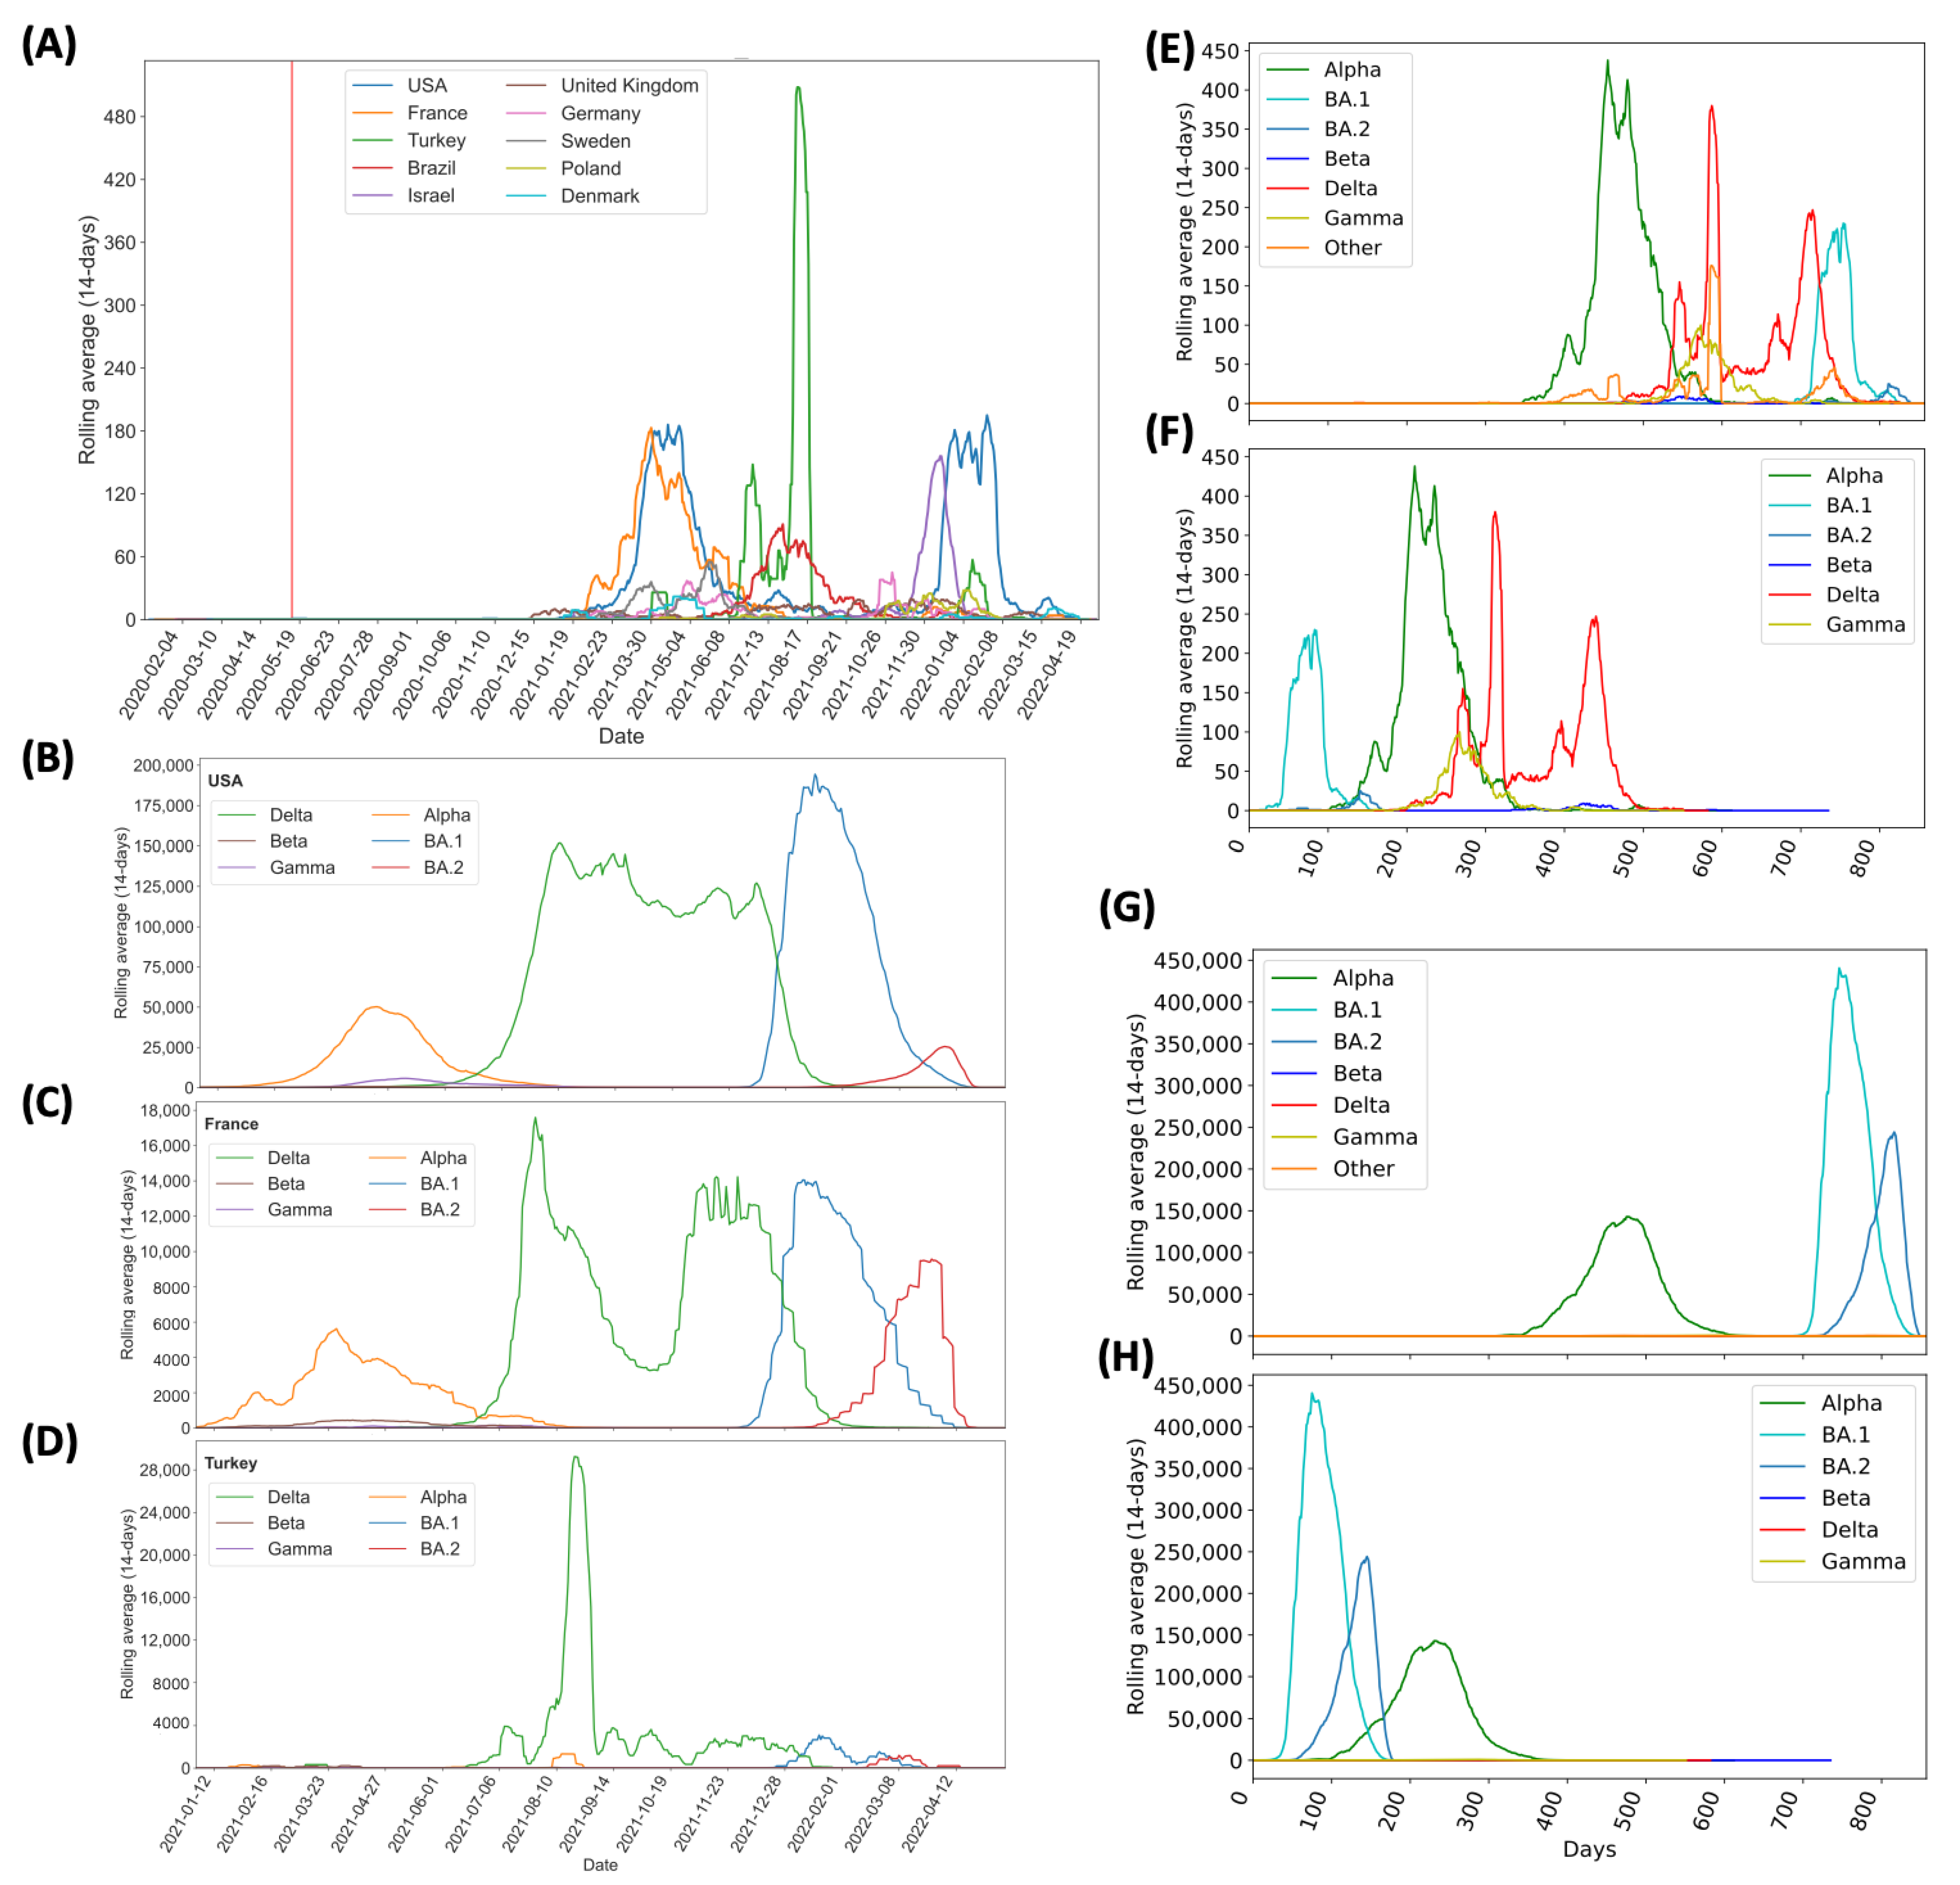
3.2. Frequency and Distribution of D614G, N501Y and P681R Mutations

The earliest record of these three MOCI coming together was in the USA on 12 May 2020; however, no further observations were recorded since then in that country. Figure 3 illustrates the MOCI frequency in the top ten countries: USA (26.7%), France (15.3%), Turkey (14.8%), Brazil (6.7%), Israel (6.0%), UK (4.2%), Germany (4.0%), Sweden (3.6%), Poland (2.0%), and Denmark (1.6%). These ten countries represent 85.1% of the cases containing the MOCI (Figure 3, which shows a continuous timeline). Figure 4A illustrates the rolling average (over 14-days) for these 10 countries. Eighty-one other countries recorded less than 90 entries for the period 12 May 2020 to 28 April 2022 (Supplementary Table S4).
One estimate of the likely total number of cases is 276,816 obtained by dividing the total number of sequences with concurring MOCI (5767) by the global average sequencing-to-positivity ratio (1:48) (Table 1). However, the S:P ratio varies significantly across countries, so we estimate 424,362 to be the more likely value (Supplementary Table S5).
Three countries—France, USA, and Turkey—stand out as they each contribute to over 56.8% of the total instances of the MOCI co-occurrence. It is unsurprising that these trends overlap with the spread of VOC in these nations (Figure 4B–D), because there would have been more opportunities for Delta to acquire N501Y, and for Alpha, Gamma, or Omicron to acquire P681R (Figure 4B–F). In comparison to the number of isolates with P681H, we observed similar trends at a much higher number (Figure 4G,H). Such co-occurrences also appear to have happened over short periods of time; for instance, during March to June 2021 in France and USA with the Alpha VOC and between June and August 2021 in Turkey with the Delta VOC (Figure 3 and Figure 4B–D). A second peak of co-occurrences was also observed during late 2021 to February in USA with the spread of Omicron (BA.1 sub-lineage) but was not observed in other countries such as France, which had a similar increase in Omicron wave. This could be due to founder effects, but we cannot establish this by mining GISAID data alone; it will require detailed epidemiological investigations by national public health authorities, which is beyond the scope of this work. These observations also show that occurrences in three examples of Sweden, Denmark, and the USA were in locations of close proximity of each other (Figure 5). The observations of MOCI are in contrast with the more common Y501-H681 combination that are signatures of Alpha. Nevertheless, from Figure 4, we can be reasonably sure that a number of independent events of convergent evolution (i.e., MOCI co-occurring) have taken place. It is worth investigating why we do not see as many instances of Delta acquiring N501Y in France and USA, even though they had a very high number of this VOC from July 2021.

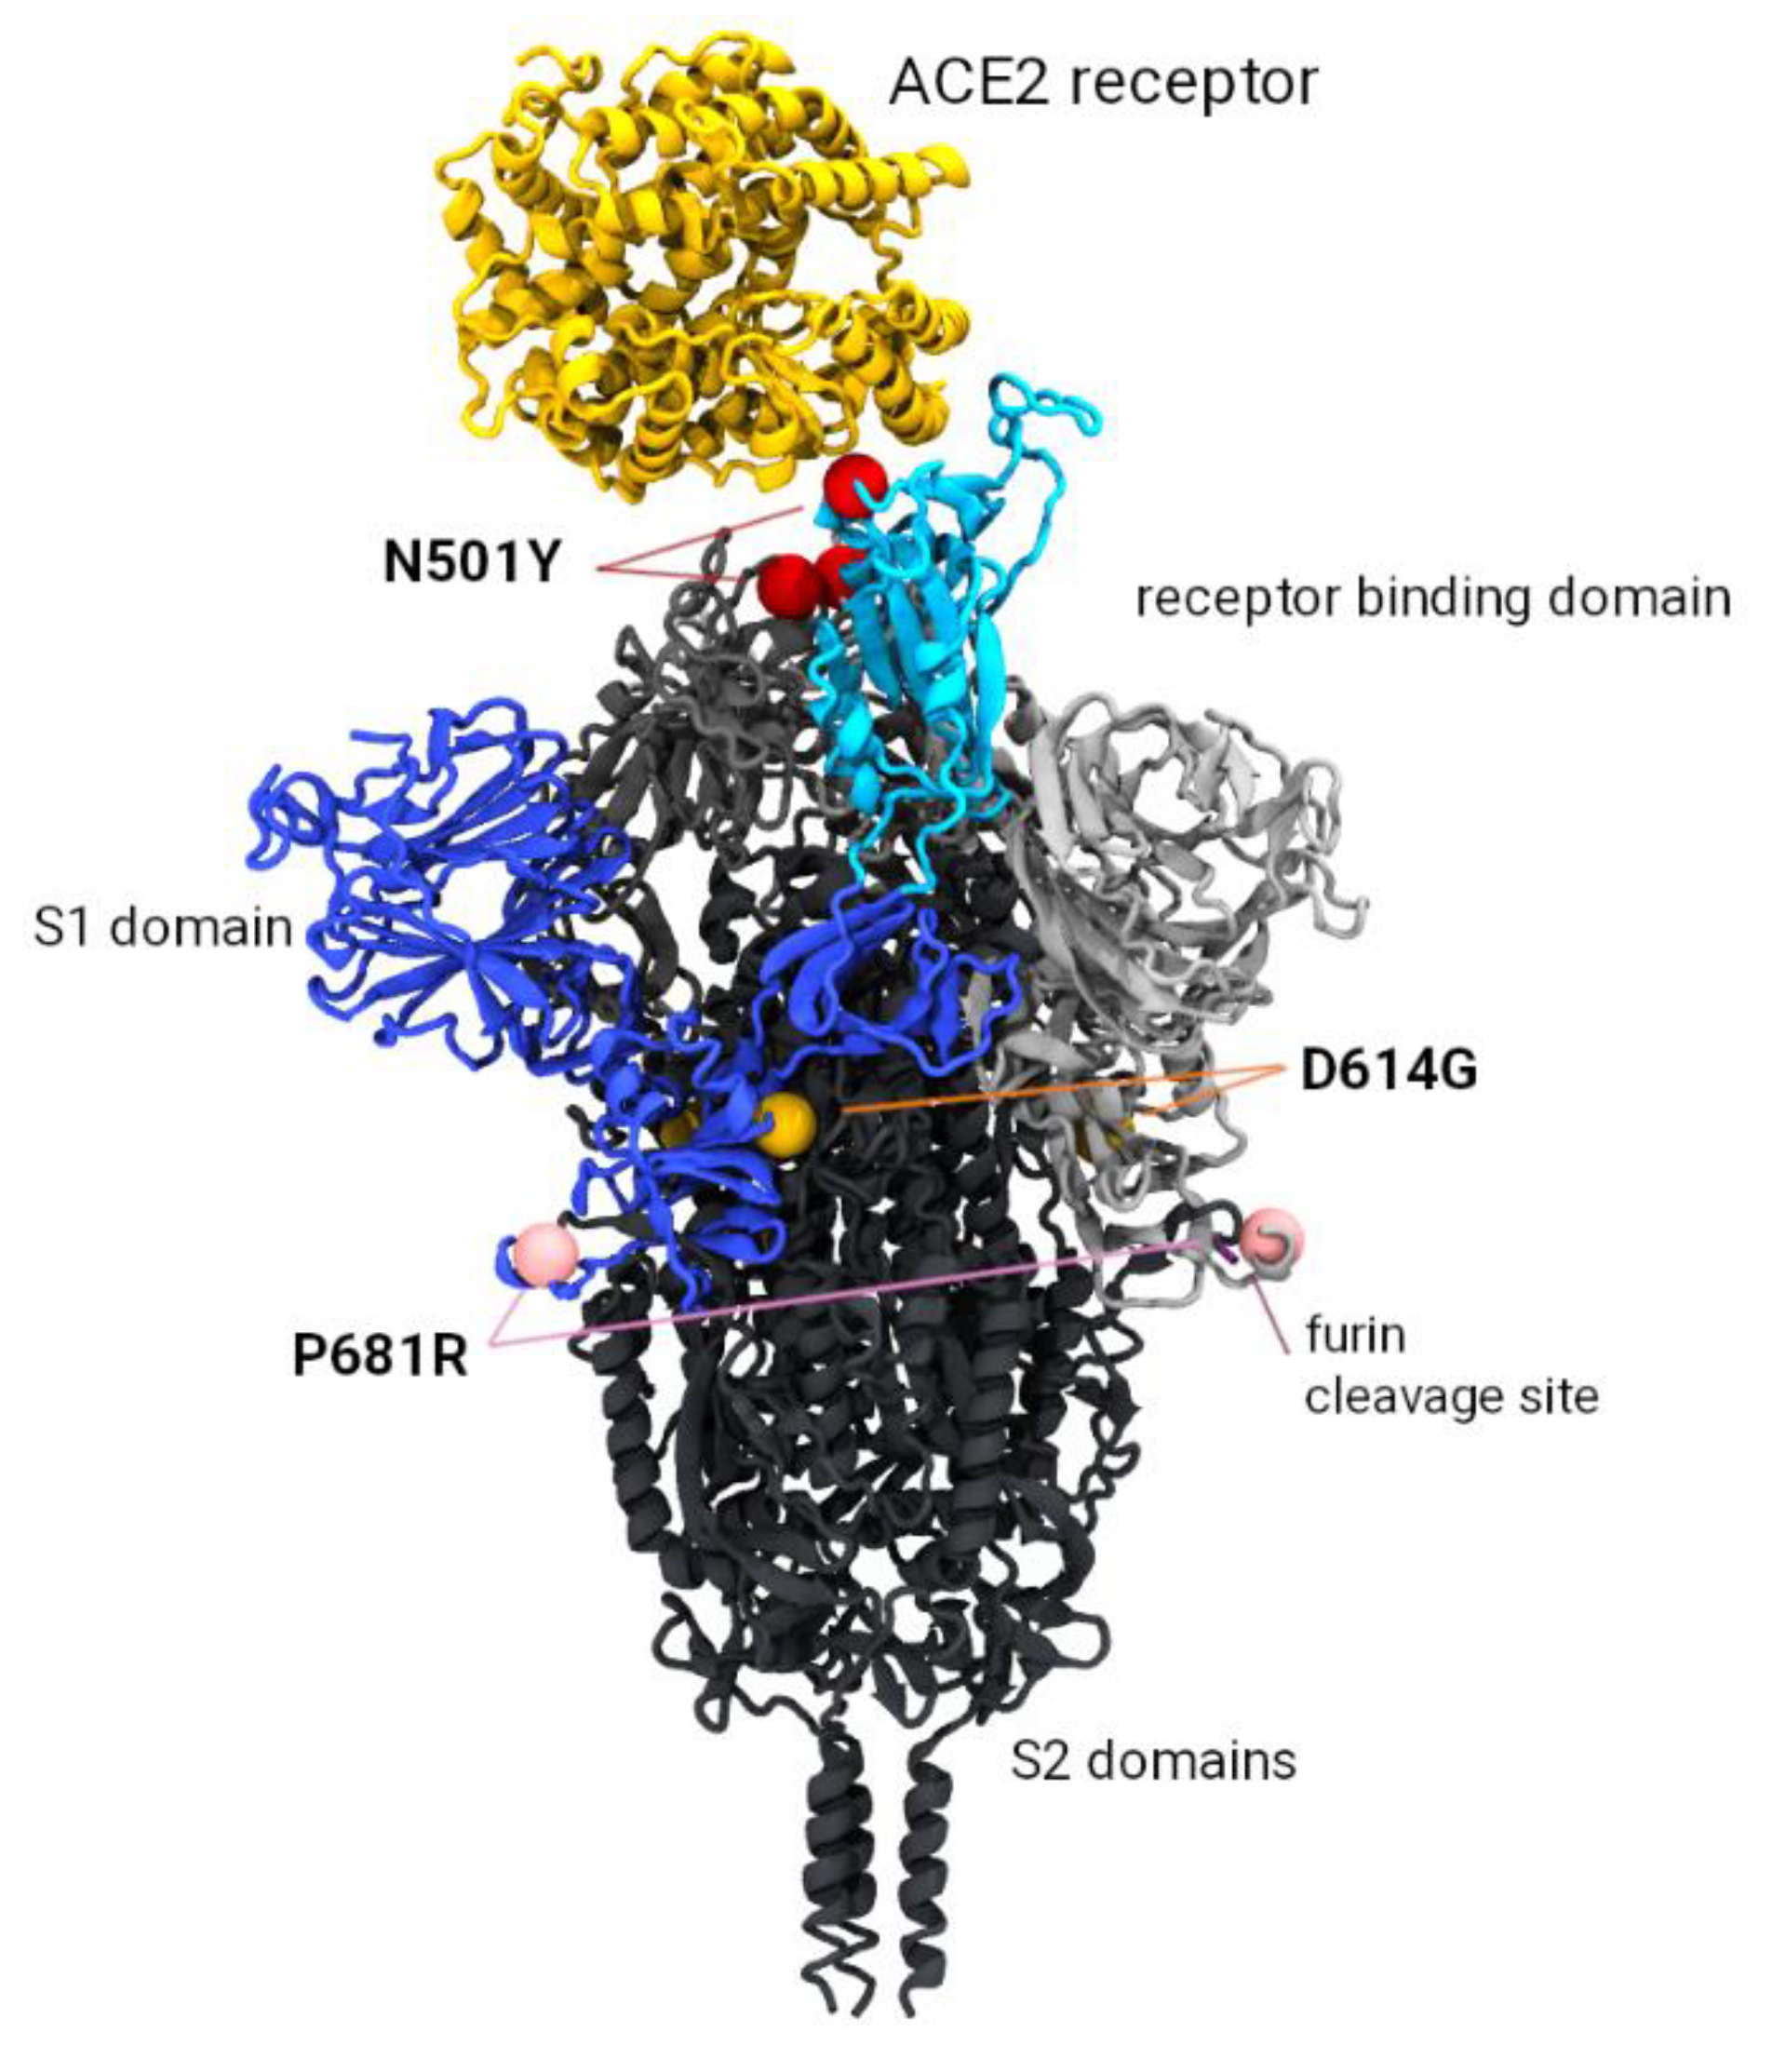
3.3. In Silico Modelling of the Spike Trimer

Based on the molecular structure of the spike trimer, the locations of our MOCI are not in close proximity of each other (Figure 6), despite the co-occurrence of these three mutations under convergent evolution. Due to the separation of the 501 and 681 sites by approximately 100 Ångstroms, molecular dynamic analyses to examine the conformational changes in the protein were not pursued.

4. Discussion

4.1. Y501-R681 Almost Always in the G614 Background

From Table S2, the instances of N501Y co-occurring with P681R have almost always happened on the D614G background as predicted [5,6,7]. Although these three mutations are positioned sufficiently far apart in the 3-dimensional protein structure to suggest that they do not interact, further studies are required to understand whether there may be indirect functional links that could enhance viral efficiency. The 501Y has become a dominant mutation across almost all SARS-CoV-2 genomes sequenced to date. It has been shown to enhance binding to the receptor domain in a range of existing and hypothetical mutation combinations [20]. Given the lack of an adequate model of the cleavage enzyme and large separation of the 501 and 681 site (~100 Angstroms), a molecular dynamics analysis would be insufficient to demonstrate the dynamics of the 681 site, which is known to enhance pathogeneicity [21].

4.2. Alpha Acquiring P681R Ahead of Other VOC Could Be Due to P/H681R

Alpha, Beta, Gamma, and Omicron each have N501Y; however, Alpha was the first VOC to acquire P681R in terms of absolute (Figure 4E) timelines. Omicron (BA.1) was the first relatively (Figure 4F), although Beta was reported four months before Alpha in May 2020. Alpha, especially its Q.4 sub-lineage, also contributes to most instances of the MOCI co-occurrence. There is a possible biomolecular basis for this; P681H is present in Alpha, but not in the other two VOC. The Grantham scores associated with P681R (103) and P681H (77) are comparable, and the H681R substitution is thus a conservative change (Grantham distance 29). There is only one way to get to histidine (H) or arginine (R) from proline (P), and for H and R, there is only one way to get to each other; we see no structural reason from our in silico model as to why one should be preferred to the other. Thus, we may infer that some of the instances of Alpha acquiring P681R could have been due to a substitution of H with R, which is the signature of the Q.4 sub-lineage. The 681st spike position is the fifth substrate sequence for cleavage recognition; both furin and the transmembrane serine protease 2 (TMPRSS2) cleave the spike at 685/686 position, with H (and possibly R) enhancing this process [7,22,23]. It is worth noting that to penetrate host cells, the SARS-CoV-2 spike protein must be cut twice by host proteins. In the SARS-CoV-1 (SARS), both incisions occur after the virus has locked on to a cell. However, with SARS-CoV-2, the presence of the furin cleavage site enables host enzymes like furin to make the first cut as newly formed viral particles emerge from an infected cell. These pre-activated viral particles can then go on to infect cells more efficiently compared to particles requiring two cuts. Thus, the P681R increases the susceptibility of the furin cleavage site in Delta VOC [13,21] and allows the exposure of the Spike’s S2 subunit for better cell integration.

4.3. Co-Occurrences Have Been Reported Predominantly in Eight Countries

Co-occurrences of the MOCI were observed with Alpha, Beta, Gamma, Delta, and Omicron VOC in 48, 9, 14, 59, and 40 countries respectively, indicating convergent evolution, especially as much of the world was under lockdown during 2020–2021. Curiously, at least half of the observations have been reported from just France, Turkey and USA; 83.4% from these three countries plus Brazil, Israel, UK, Germany, Sweden, Poland, and Denmark, (Supplementary Table S4). Several instances involve proximal regions, suggesting multiple founder effects (Figure 3 and Figure 6). For example, in Denmark and Sweden, variants with the MOCI were concentrated in highly populous Hovedstaden and Svealand regions (Sörmland, Stockholm, Uppsala, and Västmandland) [24]; the MOCI frequencies were also correlated with the most common lineage in respective countries and regions, suggesting community transmission, although these MOCI did not go on to become the dominant variant in those locations. This is in line with most within-host variants getting lost during transmission and only a few founding infections being maintained in a given population [25].
Co-occurrence of the MOCI in the UK occurred mostly with the Delta VOC since April 2021, especially in AY.4, which had the highest (58%) prevalence, followed by the initial wave of Alpha VOC’s B.1.1.7 and Q.4 from late 2020 to May 2021 (Figure 3). The latter period had ten times the death rate (~1200 per week between September 2020 and March 2021) compared to the former (~120 per week; probably due to lockdowns and 30% of the population already being double-vaccinated). In the UK, which has a very high rate of sequencing, the overall numbers of co-occurring MOCI were still low (241 records, 87.1% in England). Of these, there were respectively 82, 35, 18, 44, and 13 instances of the AY.4, AY.5, AY.125 acquiring N501Y, B.1.1.7, and Q.4 acquiring P681R [26,27]. It is possible that the lockdown protocols and vaccination coverage may have influenced the observed viral transmission dynamics [28]. In the Americas, most of 2011 co-occurrences of the MOCI were detected either in the US East Coast (828 entries) or in the Sul (Santa Catarina) and Sudeste (São Paulo, Rio de Janeiro) regions in the South and Southeast of Brazil (332 entries). These trends could be due to founder effects and lack of travel restrictions from early 2021, especially in the United States [29] (Figure 3 and Figure 5). In Brazil, the co-occurrences of the MOCI also corresponded with the prevalence of P.1 until August 2021 after which the AY.99.2 became the dominant variant (Supplementary Figure S1). The presence of MOCI did not increase following the surge of Omicron. Unfortunately, regional and city-level information was not available for Turkey on GISAID and was limited for Israel, preventing further analysis and insights and highlighting the importance of metadata [16]. Supplementary Figure S1 shows the frequency of the MOCI cooccurring in countries with over 50 observations over a 2-year period; Supplementary Figure S2 shows the 14-day rolling average of the MOCI cooccurring in Beta, Gamma and Delta VOC.

4.4. Y501-R681 Does Not Outcompete Other Variants

From our analysis, SARS-CoV-2 isolates containing Y501-R681 in spike did not outcompete other variants in every single instance we have examined (Figure 3 and Figure 4), which is both counterintuitive and a relief to worldwide public health efforts. Although individually, these two mutations have been reported to confer selective advantage [8,9,10,11,12,13,14], their combination apparently has not, and we have not found any compelling biomolecular reason for this (Figure 6). It would be desirable to conduct in vitro and in vivo studies to gain a better understanding, either using infectious clones and reverse genetics [30,31,32,33], or using naturally occurring comparable isolates with and without these mutations; see [7], for example.

4.5. Implications for the Omicron VOC

Alpha and Omicron each have the Y501-H681 combination, which is present in 3,885,817 entries out of the 10.2 million we have examined in this study (i.e., over 35%); this contrasts with the Y501-R681, of which we have only found 5814 observations (Figure 4G,H). Just as the Q.4 sub-lineage with Y501-R681 emerged when the Alpha VOC started to spread, Omicron has emerged with Y501-R681 as the latest VOC [34,35,36]. In this context, it is important to highlight the problem of sequencing artefacts; for example, 65 high-coverage sequences of Omicron with P681R appeared on GISAID but were subsequently corrected by the submitting laboratory following repeat libraries with fewer cycles and other improvements [37]. The spread of VOC in immunocompromised patients could lead to mutations with a selective advantage for antibody escape and/or transmissibility (e.g., N501Y and P681H/R), in addition to a number of deletions in the N terminal domain [38], and this aspect needs further investigation given Omicron’s large number of mutations (many of them are yet to be studied in depth). The adaptation and evolution of this virus in new hosts, for instance mice and rats, also pose additional risks, such as additional reservoirs and reinfection of humans [11]. Investigations into the dynamics affecting the SARS-CoV-2 pandemic in each of the eight countries are also warranted in the wider context of travel restrictions, population demographics, and dynamics [39,40]. Lack of patient-deidentified metadata in a consistent format further complicates meaningful analysis, as emphasized before [16].
The COVID-19 pandemic has brought to light the importance of genomic surveillance to control the transmission of pathogenic new strains. The response to new mutations has been achieved by the submission of genomic sequences to public databases such as GISAID. However, this is often deterred by a lag time in sample collection and submission with reasons that differ by country, even after rapid sequencing (e.g., private diagnostic labs with no incentive to share data or sensitivity to the country name associated to virulent strains) (Table 1) [41,42]. Nevertheless, health agencies can use the pipeline presented here to track and monitor locally identified (single or co-occurring) mutations of interest or globally identified mutations in a more localized method with their own identifiable metadata.

4.6. SARS-CoV-2 Evolution and Selective Pressures on Quasispecies

Any virus which is new to a host will undergo a period of adaptation as selective pressures come to bear. RNA viruses, such as coronaviruses, are error-prone in their replication and exist as a cloud of variants, with the dominant clade representing the majority population, but with a number of diverse variants also represented within the population, known as quasi-species [2,3,43,44]. Among viruses which are established in their host, the dominant clade is generally relatively ‘fit’ in its ability to replicate and out-competes all the other clades. However, when a virus is new to a host, its relative fitness may be quite low. Consequently, in any environment, different clades can have similar relative fitness. This means that subtle differences might give a particular clade a small advantage, enabling it to predominate as the population continues its host adaptation. The environment may comprise of host factors, such as host genetics, tissue tropism, age, immune status or competence, or presence of other infections, as well as external factors such as temperature and humidity. In the case of SARS-CoV-2, the extraordinary public health measures in some regions of the world are likely exerting their own selective pressures on its evolution and creating numerous local environments. This phenomenon, called the ‘survival of the flattest’ [3], can lead to the emergence of multiple clades dominating under different environments. These is also an increasing appreciation that, within the host, different clades may predominate in different tissues at the same time and that there may be interactions among the diverse quasi-species that facilitate the infection [45].
The pathway of adaptation is not always towards severe disease since this may not lead to maximum replication and transmission. Indeed, for many viruses with a long history of acute infection in an established host species, the disease may be mild or inapparent, reflecting a relationship more towards stasis, where the impact on the host does not compromise the chances of the progeny virus being transmitted to a new host. For many coronaviruses, we have seen an evolution towards milder infection, albeit with greater transmission rates than those of SARS-CoV-2 to date. Certainly, some level of reduction in the efficacy of vaccine-induced antibody in neutralising the Delta and Omicron variants has been demonstrated, but the other feature of these viruses, which is less often discussed, is the ability of these VOC to replicate by means of syncytial formation, rather than the simple apoptotic cycle seen with earlier variants [46]. This may confer an important immune evasive aspect to replication, which might offer a distinct advantage in immune avoidance. It might also explain why these clades are more productive and less pathogenic, since systemic infection is not always involved.

4.7. Error Catastrophe, Muller’s Ratchet, and Implications for SARS-CoV-2

A phenomenon related to quasi-species evolution is that of error catastrophe, which may occur if the mutational rate exceeds the ability of the fitness landscape to accommodate the resultant evolving clades [47]. The key triggers for this are not fully understood, but it is thought that the application of strict biosecurity measures may play a part by restricting the availability of new hosts. In such cases, the quasi-species becomes increasingly attenuated, with mutations accumulating via a mechanism called ‘Muller’s ratchet’, to the point where the epidemic may die out [48]. This has been seen in many prior outbreaks of Ebola, where the infection became increasingly less pathogenic and less transmissible. While the current environment of SARS-CoV-2 is complex and highly variable, the selective pressure on a virus is towards higher transmissibility and milder disease in all environments, and the current systems of control preferentially select for such. Once a virus develops either or both traits, it is very unusual for the reverse to occur because viruses with higher transmissibility out-compete those with lesser transmissibility and those which are milder disable the host less, so they continue to travel and mix with susceptible hosts. This appears to be the case with the Omicron VOC with higher transmissibility and less severe disease: death rates have not increased compared to other VOC waves (https://covid19.who.int, accessed on 11 March 2022).
In comparing variants of SARS-CoV-2, it is tempting to focus on specific mutations and their location—perhaps with overt attention being paid to the spike protein, especially its receptor binding domain—and not consider that the observed changes could evolve independently of each other. The secondary and tertiary folding of proteins, as well as post-translational modifications, can have a profound effect on function, such that a mutation at one site might require a complimentary change at another site in order to confer advantage, or be wiped out by another seemingly unrelated change. For the same reason, convergent evolution might also occur, as exhibited by the co-existence of identical co-mutations in virus clades of different lineage [49]. Another phenomenon known to occur in many coronaviruses is recombination, where partial genomic exchange may occur between two coronaviruses when simultaneously infecting the same host. The extent to which this may have occurred in SARS-CoV-2 is the likely subject of future analysis [50,51].

5. Conclusions and Limitations

SARS-CoV-2 is the most-sequenced virus in the world; however, there is an inherent bias introduced by the highly variable sequencing-to-COVID-19 positivity ratio (S:P) across countries (e.g., the UK has one of the highest P:S ratios in the world) and across time (S:P has generally gone up in all countries, e.g., India). Thus, the GISAID data is likely to contain non-random samples with a skew in favour of sequences associated with epidemiologically consequent cases, albeit this is difficult to decipher, as most sequences have little or no meaningful patient-deidentified information. The lockdowns and vaccination coverage associated with this viral pandemic have also been unprecedented in human history and spatio-temporally variability, further complicating our analysis. Notwithstanding these limitations, which have led to the proliferation of certain clades in certain environments, we are still able to make broad conclusions thanks to the very large number of sequences available on GISAID. We are also able to demonstrate a process and pipeline to analyse mutations of structural, functional, and epidemiological consequence from public domain information in a systematic manner and provide early warnings of certain combinations starting to spread. Though it is unclear which combinations of mutations provide the best selective advantage, there is concern that mutations previously observed in other dominant lineages may arise spontaneously in contemporary strains, further increasing their potential for infectivity and adverse clinical outcomes.
In this case study, we analysed three key mutations (viz. D614G, N501Y, and P681R) co-occurring, but found no evidence of this combination spreading. Although 5767 sequences were found on GISAID between 12 May 2020 to 28 April 2022, mainly in USA, France, and Turkey, the Y501-R681 combination has not outcompeted other variants and this warrants further in silico, in vitro, and in vivo investigations. Given that the latest VOC Omicron contains a large number of mutations, many of which are yet to be studied in-depth, our methodology will be very useful to understand whether certain combinations of mutations are more transmissible. If GISAID entries are double-checked for sequencing artefact before submission and strengthened with patient-deidentified metadata, this approach could enable early epidemiological intelligence; for instance, on case severity, mortality, and factors such as age, gender, race, and co-morbidities that could increase infection risk.

Supplementary Materials

The following are available online at https://www.mdpi.com/article/10.3390/zoonoticdis2030014/s1, Figure S1: Frequency of the P681R, N501Y and D614G mutations cooccurring in countries with more than 50 observations between May 2020 and April 2022, Figure S2: Rolling average (14-days) of the P681H, N501Y and D614G mutations cooccurring in Beta, Gamma and Delta VOC, Table S1: GISAID data on key SARS-CoV-2 mutations classified by VOC/VOI, Table S2: Observation of key mutations and their combinations on GISAID, Table S3: Observation of other key SARS-CoV-2 Spike mutations, Table S4: Raw data for countries with cooccurring P681R, N501Y and D614G mutations, Table S5: Predictions for the true number of SARS-CoV-2 sequences with the cooccurring MOCI, after accounting for the S:P ratio.

Author Contributions

Describe the contributions of each author (use initials) to the paper. Conceptualization and methodology, S.S.V.; bioinformatics, C.L. and L.O.W.W.; biomolecular modelling and interpretation, M.J.K. and T.W.D.; data analysis and original draft preparation, S.M., C.L. and S.S.V.; funding acquisition, S.S.V. and L.O.W.W.; manuscript review and editing, all authors. All authors have read and agreed to the published version of the manuscript.

Funding

This work was supported by funding (Principal Investigator: S.S.V.) from the CSIRO Future Science Platforms, National Health and Medical Research Council (MRF2009092), and United States Food and Drug Administration (FDA) Medical Countermeasures Initiative contract (75F40121C00144); and by funding (Principal Investigator: L.O.W.W.) from the Australian Academy of Science and the Australian Department of Industry, Science, Energy and Resources. The article reflects the views of the authors and does not represent the views or policies of the funding agencies including the FDA.

Informed Consent Statement

Identifying Information and Clinical Trial Registration: This study does not involve any human samples, identifiable human data, or patient records. It only involves bioinformatics analysis of novel coronavirus genome sequences openly accessible from the public repository ‘GISAID’, and these sequences do not contain any metadata that can be identified with any individual. This includes sample collection dates and anonymous sample IDs that are openly accessible. Our study does not report any exact age or photographs. Clinical trial registration is not applicable as this is neither an interventional study nor an observational study involving humans.

Data Availability Statement

This paper only uses publicly accessible data that can be downloaded from GISAID, the world’s largest repository of SARS-CoV-2 genome sequences. The lists of GISAID’s EPI_ISL_ sample IDs and data used by our analysis can obtained using the EPI_SET ID: EPI_SET_20220508nt. Our Python code is available at https://github.com/Carol-Lee-gh/Covid-Mutation-Pipieline.git (accessed on 17 December 2021).

Acknowledgments

General: We are grateful for support from our CSIRO colleagues at the Australian Centre for Disease Preparedness (https://www.grid.ac/institutes/grid.413322.5, accessed on 5 April 2022), especially Kim Blasdell, Simran Chahal, Alexander McAuley and Nagendrakumar Singanallur, and the Australian e-Health Research Centre, especially Denis Bauer, David Hansen, Yatish Jain, Brendan Hosking and Aidan Tay. We thank Professor Adriana Heguy of New York University Langone Health for discussions on sequences of Omicron with P681R.

Conflicts of Interest

The authors declare no conflict of interest.

References

  1. Zhou, P.; Yang, X.-L.; Wang, X.-G.; Hu, B.; Zhang, L.; Zhang, W.; Si, H.-R.; Zhu, Y.; Li, B.; Huang, C.-L.; et al. A Pneumonia Outbreak Associated with a New Coronavirus of Probable Bat Origin. Nature 2020, 579, 270–273. [Google Scholar] [CrossRef] [PubMed]
  2. Bauer, D.C.; Tay, A.P.; Wilson, L.O.W.; Reti, D.; Hosking, C.; McAuley, A.J.; Pharo, E.; Todd, S.; Stevens, V.; Neave, M.J.; et al. Supporting Pandemic Response Using Genomics and Bioinformatics: A Case Study on the Emergent SARS-CoV-2 Outbreak. Transbound. Emerg. Dis. 2020, 67, 1453–1462. [Google Scholar] [CrossRef] [PubMed]
  3. Wilke, C.O.; Wang, J.L.; Ofria, C.; Lenski, R.E.; Adami, C. Evolution of Digital Organisms at High Mutation Rates Leads to Survival of the Flattest. Nature 2001, 412, 331–333. [Google Scholar] [CrossRef] [PubMed]
  4. Grubaugh, N.D.; Petrone, M.E.; Holmes, E.C. We Shouldn’t Worry When a Virus Mutates during Disease Outbreaks. Nat. Microbiol. 2020, 5, 529–530. [Google Scholar] [CrossRef] [PubMed]
  5. Callaway, E. The Coronavirus Is Mutating—Does It Matter? Nature 2020, 585, 174–177. [Google Scholar] [CrossRef]
  6. Korber, B.; Fischer, W.M.; Gnanakaran, S.; Yoon, H.; Theiler, J.; Abfalterer, W.; Hengartner, N.; Giorgi, E.E.; Bhattacharya, T.; Foley, B.; et al. Tracking Changes in SARS-CoV-2 Spike: Evidence That D614G Increases Infectivity of the COVID-19 Virus. Cell 2020, 182, 812–827.e19. [Google Scholar] [CrossRef]
  7. McAuley, A.J.; Kuiper, M.J.; Durr, P.A.; Bruce, M.P.; Barr, J.; Todd, S.; Au, G.G.; Blasdell, K.; Tachedjian, M.; Lowther, S.; et al. Experimental and in silico Evidence Suggests Vaccines Are Unlikely to Be Affected by D614G Mutation in SARS-CoV-2 Spike Protein. npj Vaccines 2020, 5, 96. [Google Scholar] [CrossRef]
  8. Liu, Y.; Liu, J.; Plante, K.S.; Plante, J.A.; Xie, X.; Zhang, X.; Ku, Z.; An, Z.; Scharton, D.; Schindewolf, C.; et al. The N501Y Spike Substitution Enhances SARS-CoV-2 Infection and Transmission. Nature 2021, 602, 294–299. [Google Scholar] [CrossRef]
  9. Karim, S.S.A.; de Oliveira, T. New SARS-CoV-2 Variants—Clinical, Public Health, and Vaccine Implications. N. Engl. J. Med. 2021, 384, 1866–1868. [Google Scholar] [CrossRef]
  10. Riddell, S.; Goldie, S.; McAuley, A.J.; Kuiper, M.J.; Durr, P.A.; Blasdell, K.R.; Tachedjian, M.; Druce, J.D.; Smith, T.R.F.; Broderick, K.E.; et al. Live Virus Neutralisation of the 501Y.V1 and 501Y.V2 SARS-CoV-2 Variants Following INO-4800 Vaccination of Ferrets. Front. Immunol. 2021, 12, 694857. [Google Scholar] [CrossRef]
  11. Kuiper, M.J.; Wilson, L.O.W.; Mangalaganesh, S.; Lee, C.; Reti, D.; Vasan, S.S. “But Mouse, You Are Not Alone”: On Some Severe Acute Respiratory Syndrome Coronavirus 2 Variants Infecting Mice. ILAR J. 2021, 62, 48–59. [Google Scholar] [CrossRef] [PubMed]
  12. Callaway, E. The Mutation That Helps Delta Spread like Wildfire. Nature 2021, 596, 472–473. [Google Scholar] [CrossRef] [PubMed]
  13. Liu, Y.; Liu, J.; Johnson, B.A.; Xia, H.; Ku, Z.; Schindewolf, C.; Widen, S.G.; An, Z.; Weaver, S.C.; Menachery, V.D.; et al. Delta Spike P681R Mutation Enhances SARS-CoV-2 Fitness over Alpha Variant. Cell Rep. 2022, 39, 110829. [Google Scholar] [CrossRef] [PubMed]
  14. Peacock, T.P.; Sheppard, C.M.; Brown, J.C.; Goonawardane, N.; Zhou, J.; Whiteley, M.; Consortium, P.V.; de Silva, T.I.; Barclay, W.S. The SARS-CoV-2 Variants Associated with Infections in India, B.1.617, Show Enhanced Spike Cleavage by Furin. bioRxiv 2021. [Google Scholar] [CrossRef]
  15. Elbe, S.; Buckland-Merrett, G. Data, Disease and Diplomacy: GISAID’s Innovative Contribution to Global Health. Glob. Chall. 2017, 1, 33–46. [Google Scholar] [CrossRef]
  16. Bauer, D.C.; Metke-Jimenez, A.; Maurer-Stroh, S.; Tiruvayipati, S.; Wilson, L.O.W.; Jain, Y.; Perrin, A.; Ebrill, K.; Hansen, D.P.; Vasan, S.S. Interoperable Medical Data: The Missing Link for Understanding COVID-19. Transbound. Emerg. Dis. 2021, 68, 1753–1760. [Google Scholar] [CrossRef]
  17. Wrapp, D.; Wang, N.; Corbett, K.S.; Goldsmith, J.A.; Hsieh, C.-L.; Abiona, O.; Graham, B.S.; McLellan, J.S. Cryo-EM Structure of the 2019-NCoV Spike in the Prefusion Conformation. Science 2020, 367, 1260–1263. [Google Scholar] [CrossRef]
  18. Phillips, J.C.; Braun, R.; Wang, W.; Gumbart, J.; Tajkhorshid, E.; Villa, E.; Chipot, C.; Skeel, R.D.; Kalé, L.; Schulten, K. Scalable Molecular Dynamics with NAMD. J. Comput. Chem. 2005, 26, 1781–1802. [Google Scholar] [CrossRef]
  19. Humphrey, W.; Dalke, A.; Schulten, K. VMD: Visual Molecular Dynamics. J. Mol. Graph. 1996, 14, 33–38. [Google Scholar] [CrossRef]
  20. Khan, A.; Zia, T.; Suleman, M.; Khan, T.; Ali, S.S.; Abbasi, A.A.; Mohammad, A.; Wei, D.Q. Higher Infectivity of the SARS-CoV-2 New Variants Is Associated with K417N/T, E484K, and N501Y Mutants: An Insight from Structural Data. J. Cell. Physiol. 2021, 236, 7045–7057. [Google Scholar] [CrossRef]
  21. Saito, A.; Irie, T.; Suzuki, R.; Maemura, T.; Nasser, H.; Uriu, K.; Kosugi, Y.; Shirakawa, K.; Sadamasu, K.; Kimura, I.; et al. Enhanced Fusogenicity and Pathogenicity of SARS-CoV-2 Delta P681R Mutation. Nature 2021, 602, 300–306. [Google Scholar] [CrossRef] [PubMed]
  22. Remacle, A.G.; Shiryaev, S.A.; Oh, E.-S.; Cieplak, P.; Srinivasan, A.; Wei, G.; Liddington, R.C.; Ratnikov, B.I.; Parent, A.; Desjardins, R.; et al. Substrate Cleavage Analysis of Furin and Related Proprotein Convertases. J. Biol. Chem. 2008, 283, 20897–20906. [Google Scholar] [CrossRef] [PubMed]
  23. Mahoney, M.; Damalanka, V.C.; Tartell, M.A.; Chung, D.H.; Lourenco, A.L.; Pwee, D.; Bridwell, A.E.M.; Hoffmann, M.; Voss, J.; Karmakar, P.; et al. A Novel Class of TMPRSS2 Inhibitors Potently Block SARS-CoV-2 and MERS-CoV Viral Entry and Protect Human Epithelial Lung Cells. Proc. Natl. Acad. Sci. USA 2021, 118, e2108728118. [Google Scholar] [CrossRef]
  24. Statista Demographics I Statista. f. Available online: https://www.statista.com/markets/411/topic/466/demographics/ (accessed on 22 December 2021).
  25. Lythgoe, K.A.; Hall, M.; Ferretti, L.; de Cesare, M.; MacIntyre-Cockett, G.; Trebes, A.; Andersson, M.; Otecko, N.; Wise, E.L.; Moore, N.; et al. SARS-CoV-2 within-Host Diversity and Transmission. Science 2021, 372, 6539. [Google Scholar] [CrossRef]
  26. Latif, A.A.; Mullen, J.L.; Alkuzweny, M.; Tsueng, G.; Cano, M.; Haag, E.; Zhou, J.; Zeller, M.; Hufbauer, E.; Matteson, N.; et al. United Kingdom Variant Report. Available online: https://outbreak.info/location-reports?loc=GBR&selected=Delta&selected=Alpha (accessed on 22 December 2021).
  27. Ritchie, H.; Mathieu, E.; Rodés-Guirao, L.; Appel, C.; Giattino, C.; Ortiz-Ospina, E.; Hasell, J.; Macdonald, B.; Beltekian, D.; Roser, M. Coronavirus Pandemic (COVID-19). Available online: https://ourworldindata.org/coronavirus (accessed on 22 December 2021).
  28. Timeline of UK Government Coronavirus Lockdowns. Available online: https://www.instituteforgovernment.org.uk/charts/uk-government-coronavirus-lockdowns (accessed on 22 December 2021).
  29. Ballotpedia Travel Restrictions Issued by States in Response to the Coronavirus (COVID-19) Pandemic, 2020–2021. Available online: https://ballotpedia.org/Travel_restrictions_issued_by_states_in_response_to_the_coronavirus_(COVID-19)_pandemic,_2020-2021 (accessed on 22 December 2021).
  30. Thi Nhu Thao, T.; Labroussaa, F.; Ebert, N.; V’kovski, P.; Stalder, H.; Portmann, J.; Kelly, J.; Steiner, S.; Holwerda, M.; Kratzel, A.; et al. Rapid Reconstruction of SARS-CoV-2 Using a Synthetic Genomics Platform. Nature 2020, 582, 561–565. [Google Scholar] [CrossRef] [PubMed]
  31. Xie, X.; Muruato, A.; Lokugamage, K.G.; Narayanan, K.; Zhang, X.; Zou, J.; Liu, J.; Schindewolf, C.; Bopp, N.E.; Aguilar, P.V.; et al. An Infectious CDNA Clone of SARS-CoV-2. Cell Host Microbe 2020, 27, 841–848.e3. [Google Scholar] [CrossRef]
  32. Hou, Y.J.; Okuda, K.; Edwards, C.E.; Martinez, D.R.; Asakura, T.; Dinnon, K.H.; Kato, T.; Lee, R.E.; Yount, B.L.; Mascenik, T.M.; et al. SARS-CoV-2 Reverse Genetics Reveals a Variable Infection Gradient in the Respiratory Tract. Cell 2020, 182, 429–446.e14. [Google Scholar] [CrossRef]
  33. Xie, X.; Lokugamage, K.G.; Zhang, X.; Vu, M.N.; Muruato, A.E.; Menachery, V.D.; Shi, P.-Y. Engineering SARS-CoV-2 Using a Reverse Genetic System. Nat. Protoc. 2021, 16, 1761–1784. [Google Scholar] [CrossRef]
  34. Ferguson, N.; Ghani, A.; Cori, A.; Hogan, A.; Hinsley, W.; Volz, E. Report 49—Growth, Population Distribution and Immune Escape of Omicron in England; Faculty of Medicine, Imperial College London: London, UK, 2021. [Google Scholar]
  35. Cele, S.; Jackson, L.; Khoury, D.S.; Khan, K.; Moyo-Gwete, T.; Tegally, H.; San, J.E.; Cromer, D.; Scheepers, C.; Amoako, D.; et al. SARS-CoV-2 Omicron Has Extensive but Incomplete Escape of Pfizer BNT162b2 Elicited Neutralization and Requires ACE2 for Infection. medRxiv 2021. [Google Scholar] [CrossRef]
  36. Pulliam, J.R.C.; van Schalkwyk, C.; Govender, N.; von Gottberg, A.; Cohen, C.; Groome, M.J.; Dushoff, J.; Mlisana, K.; Moultrie, H. Increased Risk of SARS-CoV-2 Reinfection Associated with Emergence of Omicron in South Africa. medRxiv 2022, 376, eabn4947. [Google Scholar] [CrossRef]
  37. Heguy, A.; (New York University Langone Health). Personal Communication, 2021.
  38. Corey, L.; Beyrer, C.; Cohen, M.S.; Michael, N.L.; Bedford, T.; Rolland, M. SARS-CoV-2 Variants in Patients with Immunosuppression. N. Engl. J. Med. 2021, 385, 562–566. [Google Scholar] [CrossRef] [PubMed]
  39. Grépin, K.A.; Ho, T.-L.; Liu, Z.; Marion, S.; Piper, J.; Worsnop, C.Z.; Lee, K. Evidence of the Effectiveness of Travel-Related Measures during the Early Phase of the COVID-19 Pandemic: A Rapid Systematic Review. BMJ Glob. Health 2021, 6, e004537. [Google Scholar] [CrossRef] [PubMed]
  40. Liebig, J.; Najeebullah, K.; Jurdak, R.; El Shoghri, A.; Paini, D. Should International Borders Re-Open? The Impact of Travel Restrictions on COVID-19 Importation Risk. BMC Public Health 2021, 21, 1573. [Google Scholar] [CrossRef] [PubMed]
  41. Gordon, D.R.; Jaffe, G.; Doane, M.; Glaser, A.; Gremillion, T.M.; Ho, M.D. Responsible Governance of Gene Editing in Agriculture and the Environment. Nat. Biotechnol. 2021, 39, 1055–1057. [Google Scholar] [CrossRef]
  42. Abbud, A.; Castilho, E.A. A Call for a More Comprehensive SARS-CoV-2 Sequence Database for Brazil. Lancet Reg. Health Am. 2022, 5, 100095. [Google Scholar] [CrossRef]
  43. Domingo, E.; Perales, C. Viral Quasispecies. PLoS Genet. 2019, 15, e1008271. [Google Scholar] [CrossRef]
  44. Drew, T.W. The Emergence and Evolution of Swine Viral Diseases: To What Extend Have Husbandry Systems and Global Trade Contributed to Their Distribution and Diversity? Rev. Sci. Tech. l’OIE 2011, 30, 95–106. [Google Scholar] [CrossRef]
  45. Sun, F.; Wang, X.; Tan, S.; Dan, Y.; Lu, Y.; Zhang, J.; Xu, J.; Tan, Z.; Xiang, X.; Zhou, Y.; et al. SARS-CoV-2 Quasispecies Provides an Advantage Mutation Pool for the Epidemic Variants. Microbiol. Spectr. 2021, 9, e00261-21. [Google Scholar] [CrossRef]
  46. Lin, L.; Li, Q.; Wang, Y.; Shi, Y. Syncytia Formation during SARS-CoV-2 Lung Infection: A Disastrous Unity to Eliminate Lymphocytes. Cell Death Differ. 2021, 28, 2019–2021. [Google Scholar] [CrossRef]
  47. Tejero, H.; Marín, A.; Montero, F. The Relationship between the Error Catastrophe, Survival of the Flattest, and Natural Selection. BMC Evol. Biol. 2011, 11, 2. [Google Scholar] [CrossRef] [Green Version]
  48. de Alcañíz, J.G.G.; López-Rodas, V.; Costas, E. Sword of Damocles or Choosing Well. Population Genetics Sheds Light into the Future of the COVID-19 Pandemic and SARS-CoV-2 New Mutant Strains. medRxiv 2021. [Google Scholar] [CrossRef]
  49. Brüssow, H. COVID-19: Emergence and Mutational Diversification of SARS-CoV-2. Microb. Biotechnol. 2021, 14, 756–768. [Google Scholar] [CrossRef] [PubMed]
  50. Haddad, D.; John, S.E.; Mohammad, A.; Hammad, M.M.; Hebbar, P.; Channanath, A.; Nizam, R.; Al-Qabandi, S.; Al Madhoun, A.; Alshukry, A.; et al. SARS-CoV-2: Possible Recombination and Emergence of Potentially More Virulent Strains. PLoS ONE 2021, 16, e0251368. [Google Scholar] [CrossRef] [PubMed]
  51. Pollett, S.; Conte, M.A.; Sanborn, M.; Jarman, R.G.; Lidl, G.M.; Modjarrad, K.; Berry, I.M. A Comparative Recombination Analysis of Human Coronaviruses and Implications for the SARS-CoV-2 Pandemic. Sci. Rep. 2021, 11, 17365. [Google Scholar] [CrossRef] [PubMed]
Figure 1. Schematic illustrating the process from patient identification, obtaining samples, sequencing, submission to GISAID and research groups. The advantage of using the methodology outlined in this study can identify mutations of interest via local servers for prompt analysis and response by local health authorities as compared to other application programming interfaces (API), where there is a delay between sample collection and submission on databases (GISAID). A comparison of the delay before sample collection and submission 6 months prior (1 November 2021; average = 30.8, median = 21, range = 0–277) and 28 April 2022 (average = 36.4, median = 22, range = 0–583) for sequences with MOCI shows that approximately one month was sufficient for Omicon to become the most globally prevalent variant. Average daily Omicron prevalence obtained from https://outbreak.info/situation-reports/omicron (accessed on 18 July 2022).
Zoonoticdis 02 00014 g001
Figure 2. Summary of SARS-CoV-2 lineages and sub-lineages containing the D614G, N501Y, and P681R mutations of current interest (MOCI) on GISAID. 5767 sequences were found with our MOCI from a total of 9,955,794. Bold numbers in each box shows the number of observations for each VOC/VOI and their sub-lineages (where such information was available). Sub-lineages with under 100 observations are labelled as others unless specified. ‘Others’ indicate samples not further classified on GISAID.
Zoonoticdis 02 00014 g002
Figure 3. Discrete timeline depicting the start and end dates (visual approximations) during which SARS-CoV-2 variants with the P681R, N501Y, and D614G mutations were observed in various countries, states, and cities between October 2020 and April 2022. The top 10 countries with the highest number of MOCI co-occurrences, and states/cities with 20 or more observations, are deemed significant and thus included in this timeline (as of 4 May 2022). Raw data with the full list of countries are provided in Supplementary Table S4. * The first observation in USA (specifically in New York) was recorded on 12 May 2020. However, for the purpose of visual clarity, the timeline for USA begins on 30 October 2020, which is the date of the second observation.
Zoonoticdis 02 00014 g003
Figure 4. Continuous representation of the timeline during which SARS-CoV-2 variants with the P681R/H, N501Y, and D614G mutations were observed between May 2020 and April 2022. (A) Number of isolates with MOCI, plotted as 14-day rolling average, in the top 10 countries. The vertical red line shows the first recorded co-occurrence in USA on 12 May 2020; (BD) number of VOC sequences observed in the top three countries (USA, France, and Turkey respectively); (E,F) number of isolates with MOCI which are also VOC, plotted as 14-day rolling average, either from the notional start of the pandemic in December 2019, or from September, May, November, October 2020 and November 2021 as the first reported months for Alpha, Beta, Gamma, Delta, and Omicron, respectively. (G,H) Number of isolates with the P681H (rather than P681R), N501Y, and D614G, plotted as 14-day rolling average, either from the notional start of the pandemic in December 2019, or from the month of first report for each VOC. ‘Other’ indicates MOCI found in variants other than these VOC.
Zoonoticdis 02 00014 g004
Figure 5. World map depicting the 91 countries where SARS-CoV-2 variants containing the co-occurring MOCI were recorded between May 2020 and April 2022. (A). A zoomed-in view of the regions observed with MOCI are shown for (B) Sweden, (C) Denmark, and (D) USA. Countries are color-coded based on the number of records of MOCI observed, as shown in the legend; greyed out regions indicate no observations. For some countries such as Turkey, region information was not available, but EPI numbers can be provided upon request.
Zoonoticdis 02 00014 g005
Figure 6. Model of the SARS-CoV-2 spike trimer protein indicating the relative position of the P681R, N501Y, and D614G mutations of current interest (MOCI). The N501Y mutation occurs in the receptor binding domain (highlighted in cyan) and is associated with increased binding affinity to the ACE2 receptor (shown in yellow). The P681R mutation is implicated with more efficient cleavage of the S1/S2 furin site (required prior to viral fusion to the host cell). Mutation D614G occurs at the S1/S2 interface and has also been implicated with increased replication efficiency.
Zoonoticdis 02 00014 g006
Table 1. Predictions for the true number of SARS-CoV-2 sequences with the co-occurring MOCI, after accounting for the sequencing-to-positivity ratio. The sequencing-to-positivity ratio was calculated by dividing the total number of COVID-19 cases since the start of the pandemic (from Google News and Our World in Data), by the number of SARS-CoV-2 sequences that have been uploaded onto GISAID, as of 10th May 2022. For the top ten countries with the highest number of MOCI co-occurrences, country-specific sequencing-to-positivity ratios have been calculated, whilst the overall global sequencing-to-positivity ratio for SARS-CoV-2 was used for the remaining countries.
Country Sequencing-to-Positivity Ratio Observed Number of MOCI Co-Occurrences from GISAID Predicted True Number of MOCI Co-Occurrences Based on the Ratio Difference between the Predicted and Observed Number of MOCI Co-Occurrences
USA1:25153938,70737,168
France1:8688175,90875,027
Turkey1:165854141,105140,251
Brazil1:21938985,13984,750
Israel1:5434818,67818,330
United Kingdom1:824119251684
Germany1:4223197779546
Sweden1:1321027682558
Poland1:7311785748457
Denmark1:695594499
All remaining countries with the MOCI co-occurrences (n = 81) 1:4886241,37640,514
Total 1:485747275,856271,877
Publisher’s Note: MDPI stays neutral with regard to jurisdictional claims in published maps and institutional affiliations.

