Article

Spatiotemporal Evaluation of Water Resources in Citarum Watershed during Weak La Nina and Weak El Nino

by
Armi Susandi
1,2,*,
Arief Darmawan
3,
Albertus Sulaiman
3,*,
Mouli De Rizka Dewantoro
4,
Aristyo Rahadian Wijaya
2,5,
Agung Riyadi
6,
Agus Salim
7,
Rafif Rahman Darmawan
8 and
Angga Fauzan Pratama
2,5
1
Department of Intelligent Technology, Sekolah Tinggi Intelijen Negara (STIN), Bogor 16810, Indonesia
2
Department of Meteorology, Faculty of Earth Science and Technology, Institut Teknologi Bandung, Bandung 40132, Indonesia
3
Research Center for Climate and Atmosphere, Badan Riset dan Inovasi Nasional (BRIN), Jakarta Pusat 10340, Indonesia
4
Perusahaan Jasa Tirta 2, Purwakarta 41152, Indonesia
5
PT Inovastek Glomatra, Bandung 40135, Indonesia
6
Environmental and Clean Technology Research Center, Badan Riset dan Inovasi Nasional (BRIN), Jakarta Pusat 10340, Indonesia
7
Faculty of Science and Technology, UIN Syarif Hidayatulah, Kota Tangerang Selatan 15412, Indonesia
8
PT Schlumberger Limited, Cikarang 17350, Indonesia
*
Authors to whom correspondence should be addressed.
Hydrology 2024, 11(6), 73; https://doi.org/10.3390/hydrology11060073
Submission received: 4 April 2024 / Revised: 17 May 2024 / Accepted: 18 May 2024 / Published: 22 May 2024
(This article belongs to the Topic Hydrology and Water Resources Management)

Abstract

:
This study investigates the dynamics of water resources in the Citarum watershed during periods of weak La Niña, normal, and weak El Niño conditions occurring sequentially. The Citarum watershed serves various purposes, being utilized not only by seven (7) districts and two (2) cities in West Java, Indonesia but also as a source of raw water for drinking in the City of Jakarta. Using a time-series analysis of surface water data, data-driven (machine learning) methods, and statistical analysis methods, spatiotemporal predictions of surface water have been made. The surface water time series data (2017–2021), obtained from in situ instruments, are used to assess water resources, predict groundwater recharge, and analyze seasonal patterns. The results indicate that surface water follows a seasonal pattern, particularly during the monsoon season, corresponding to the groundwater recharge pattern. In upstream areas, water resources exhibit an increasing trend during both weak La Nina and weak El Niño, except for Jatiluhur Dam, where a decline is observed in both seasons. Machine learning predictions suggest that water levels and groundwater recharge tend to decrease in both upstream and downstream areas.

1. Introduction

The climate system of the Indonesian Maritime Continent (IMC) is influenced by a combination of daily land–sea breeze circulation and global interannual variations, such as El Nino and the Indian Ocean Dipole (IoD) [1,2,3]. Climate patterns like El Nino–La Nina and IoD can influence the duration of droughts and rainy seasons. El Nino events are known to be associated with longer droughts, while La Nina events can lead to longer rainy seasons. A positive IoD is generally linked to deficit rainfall in certain regions, while a negative IoD is often associated with increased rainfall intensity. The physical climatology of IMC can be divided into three regions: Region A, where the research area is located, characterized by strong monsoon effects and semi-annual variability; System B, where ENSO-related signals are suppressed; and System C, where ENSO has the most significant influence. To monitor El Nino, which is the periodicity of sea surface temperature (SST) in the tropical Pacific Ocean, we use the Nino 3.4. SST anomaly around (5 N, 120 W–170 W). It is divided into four: normal, weak, moderate, and strong when Niño3.4 is less than ±0.5 °C, between ±[0.5–1] °C, ±[1.0–1.5] °C, and larger than ±1.5 °C, respectively (https://ggweather.com/enso/oni.htm, accessed on 17 May 2024). The Indian Ocean Dipole is represented by the Dipole Mode Index (DMI), which is the mean SST anomaly difference between the western (10° S–10° N and 50°–70° E) and eastern (10–0° S and 90°–120° E) Indian Ocean. Previous research demonstrated how El Nino affected the Citarum watershed’s water resources, specifically that the long dry season caused a significant decrease in water inflow into the reservoir [4,5]. Subsequent research on the relationship between El Nino and water resources in the Citarum watershed was scarce.
Water resources are more or less proportional to the rainfall and other factors involved, such as climate change, soil characteristics, and human activities. Currently, anthropogenic influences and climate change become the primary sources of changes and vulnerability in the Earth’s water resources, i.e., water reservoirs, such as lakes or dams, that play an important role in the global ecological balance and provide rich biological and social resources [6]. Climate change has caused rivers worldwide to experience such a dramatic change in their discharge and flows, thus reducing their natural ability to adapt to and absorb interference. The projections by Liersch et al. (2017) [7] show that every residential basin will experience changes in its river discharge, and many will experience water stress. Furthermore, they also show that the affected area is more significant for a basin with dams than some free-flowing rivers. Recently, some methods have been developed to monitor the water level as a parameter of water resources, such as the Kriging method of spatio-temporal regression [8]; wavelets; the Artificial Neural Network [9]; the hydrogeological–hydrochemical model [10]; the Modular Finite Difference Model of groundwater flow [11]; a combination of remote sensing, water balance, and the physics-based hydrological model [12]; and empirical and water balance methods [13]. Meanwhile, one of unmet needs in managing water resources is the need for continuous, sustained, and periodic water level measurement data. Different approaches or ways of calculating can produce different results. For example, in calculations of the water balance in the upstream Citarum watershed, Indonesia’s decision makers use an indirect water balance method to estimate this water resource, and it shows groundwater storage to be depleting [14]. In contrast, NASA’s Gravity Recovery and Climate Experiment (GRACE) identified an opposite trend of increasing groundwater storage changes [15] by improving the water balance estimation by considering the volume of groundwater abstraction and other water balance components, i.e., rainfall, actual evaporation, discharge, and changes in groundwater storage derived from various global datasets and measurements. Rusli et al. (2021) [15] also show several inaccurate and inadequate models related to water resources in the Citarum watershed.
In fact, in contrast to groundwater monitoring, massive monitoring has been carried out for surface parameters such as the water level. The water level has become a crucial proxy parameter for monitoring anthropogenic and climate change effects on water resources in an area. For instance, the monitoring of the changes of the water level in the Yangtze River has shown that there has been a meaningful change due to the effects of various rainfall and dam operations, which have significantly affected irrigation, navigation, and the ecosystem, while also providing information related to water management and the effects of climate change by revealing the average water level trend [16]. Further, water level monitoring over the past 52 years has revealed that rainfall is the dominant factor that causes seasonal variations in water level, while the arrangement of the floodgates and dams has been the primary driver of hydrological regime change in the last 20 years. By comparing trends in each monitoring location, we can obtain an intense state of climate change and anthropogenic activity [17].
In this paper, we analyze three years of water level monitoring data to investigate the dynamics of water resources in the Citarum watershed. Since El Nino and IoD are interannual phenomena, the time series data in this paper is insufficient to establish a correlation between the two. Only the effects of weak El Nino and weak La Nina, as well as the positive IoD, are visible. We make up for the lack of temporal data by using spatial data, which depict the Citarum watershed’s upstream and downstream conditions. This work aims to investigate how El Nino, La Nina, and IoD represent global climate conditions in the Citarum watershed.
The water resources related to groundwater (GWL) can be estimated through GWL recharging [18] in the watershed by monitoring several surface parameters, such as the water level and the rainfall, and by analyzing them by employing the time series and machine learning methods. The Citarum watershed is inhabited by millions of people with various water needs ranging from agriculture and industrial drinking water to power plants, which puts pressure on its water resources. Climate change, characterized by extreme rainfall, has resulted in increased runoff, so only a tiny amount of water can be stored as groundwater. It was found that, in 2005, 24% of the villages were vulnerable to and at risk of water resources depletion, and in 2011, the percentage increased to 54% [14]. A combination of anthropogenic activities and climate change will result in such depleted water resources in the Citarum River; thus, water resources estimation based on the surface data that we can obtain relatively more easily is required.

2. Materials and Methods
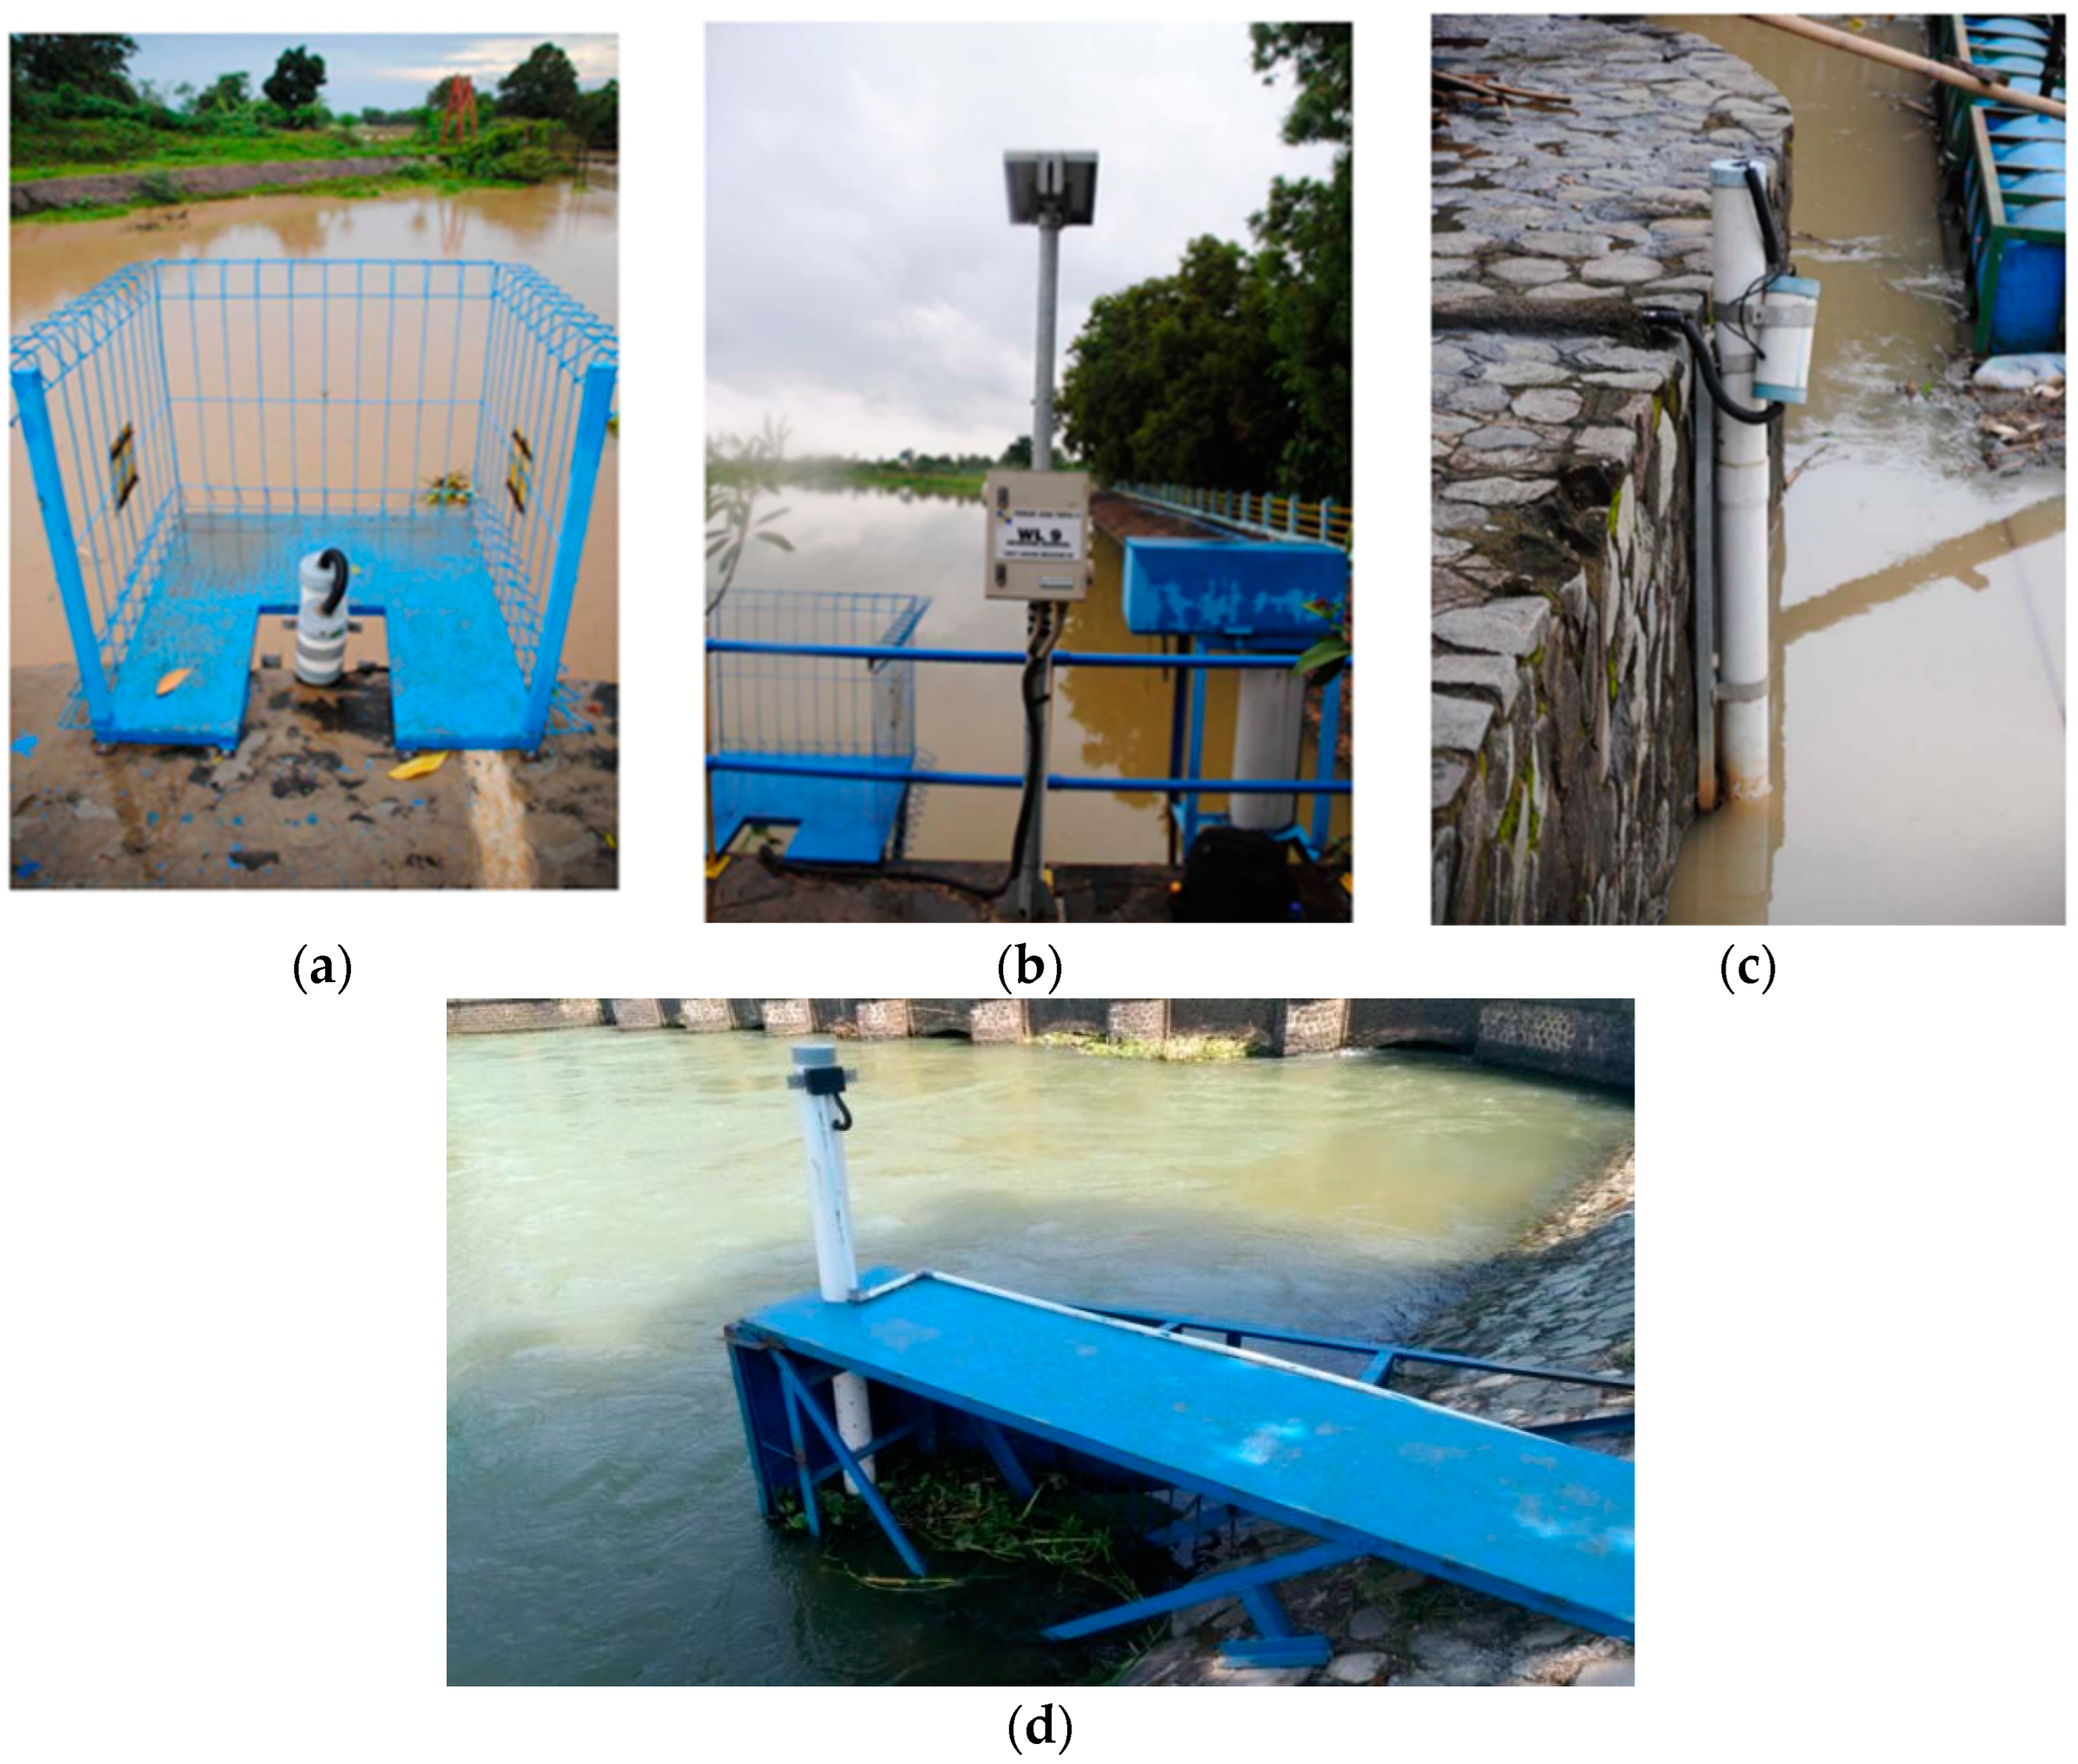
2.1. Field Site

The studied area was the Citarum watershed, covering an area of 6600 km2 with a 5.5-billion-cubic-meter average annual flow volume, and 2353-mm annual rainfall, 80% of which falls from November to May (Figure 1). The Citarum River is the main river in the Citarum watershed that is utilized for various purposes; it is not only used by 7 districts and 2 cities in West Java but also as a source of raw water for drinking water in the Capital City of Jakarta. The Citarum River and other rivers in northern West Java, such as the Ciherang, Cilamaya, Cijengkol, Ciasem, Cigadung, Cipunegara, and Cilalanang Rivers, form an integrated hydrological area with a hydrological unit of 1.10 million ha. The Citarum watershed is the main catchment area of the Saguling Dam, and the Jatiluhur Dam supplies approximately 7650 million cubic meters of water per year (m3 a−1). Since 2012, approximately 78% of the extracted water has been used for irrigation, 14% for industrial and electricity generation activities, and 8% for domestic consumption [14]. This watershed is affected by the monsoon system, which changes its direction twice a year. The average river discharge in the wet season shows an increasing trend, while the average river discharge in the dry season shows a decreasing trend.

2.2. Surface Water Data

In 2015, we developed a system for collecting the surface field data required to analyze the impacts of climate change based on water level measurement (see Figure 2a Ciqadung Weir, Figure 2b Jengkol Weir, Figure 2c Cibeet Weir, Figure 2d Leuweung Weir). The system’s name is the sensory data transmission service assisted by Midori Engineering (SESAME), developed by Midori Engineering Laboratory Co., Ltd. (MEL), Sapporo, Japan. The instrument was an automatic real-time measurement with a 10-min time interval. It had a power-saving sensor (measuring temperature, rainfall, and the water level) driven by a solar cell and rechargeable batteries lasting 24 h. The water level sensor employed a pressure sensor (black pressure compensated) ranging from 2 cm to 400 cm, with an error rate of approximately 3 mm and with an electrode or ultrasonic sensor type. The temperature operating the instrument ranged from −20 °C to 50 °C.
This study used two hydrological parameters: rainfall (mm) and water level (m). We observed from December 2016 to December 2021 with a one-day measurement time interval. The instruments were installed in the locations shown in Table 1. We used Global Satellite Mapping of Precipitation (GSMaP), which is a global hourly rainfall observation system with a 0.1-by-0.1-degree resolution (≈10 km). This system was initiated by the Japan Science and Technology Agency (JST) in 2002 and has been promoted by the Japan Aerospace Exploration Agency (JAXA) Precipitation Measuring Mission (PMM) science team since 2007. GSMaP uses data from several sensors under the Global Precipitation Measurement mission (GPM), which currently has a constellation of low-orbit satellites operating passive microwave data and geostationary satellites operating in the infrared range [19].
In this study, the spatial rainfall data used are GSMaP_NRT (near real-time) from 1 January 2017 to 7 February 2022, in the Citarum watershed (6.25° S, 106.95° E to 6.65° S, 107.85° E). The GSMaP_NRT data of the rainfall are a GSMaP product applying a Kalman filter algorithm [20], with a domain coverage extending from 60° N to 60° S. It can be downloaded at https://sharaku.eorc.jaxa.jp/GSMaP/, accessed on 17 May 2024. The grid selected on the GSMaP_NRT data was defined by adjusting the location of the SESAME rain gauge station with a ±-0.05-degree latitude/longitude position (≈5 km) from the grid’s coordinate (Table 1). Nino 3.4. data are available from NOAA (https://www.cpc.ncep.noaa.gov/data/indices/, accessed on 17 May 2024) and DMI data are available from https://stateoftheocean.osmc.noaa.gov/sur/ind/dmi.php, accessed on 17 May 2024.
We only used the rainfall data to study the water resources through the estimated GWL recharge. Several researchers have tried to estimate an empirical relationship between the GWL recharges by fitting the estimated rainfall values in the monsoon season by employing a nonlinear regression technique [21,22] that modified the above-mentioned method for the tropics, and we adopted his method.

2.3. Data Driven

In this study, we dealt with time-series data. Time-series modeling involves a technique relating the time-series data as a dependent variable to the predictors, all of which were the function of time. The climatology of the studied area is driven by the monsoon system that reverses twice a year. It shows us that it is important to consider the periodicity properties of the dynamical properties of this area. The technique refers to decomposing the time series data into the frequency (periodicity) of various lengths or scales. The decomposition of a signal or of the data of the time series (f(t)) into the constituent frequency (ω) is called the Fourier series [23]. A generalized Fourier series, which, in terms of its integral transform, can be used to convert the time series data from a time into a frequency domain, is shown below,
f ( t ) = 1 2 π F ( ω ) e i ω t d ω F ( ω ) = 1 2 π f ( t ) e i ω t d t
After this process is conducted using the time series data, low-frequency variability will be obtained by applying the low-pass filter. Likewise, high-frequency variability can also be obtained by applying the high-pass filter. In this study, the employed low frequency was a signal with a shorter-than-30-day period. It was be employed as a cutoff frequency in the convolution processes. The low frequency or filtered output g(t) is just the convolution of the data or the unfiltered input time series f(t) and the filter weighting function w(t), which is represented as,
g ( t ) = f ( τ ) w ( t τ ) d τ
Furthermore, the curve fitting using the Gaussian probability density function of the high-frequency variability would be used to characterize the daily variation of the water table. Finally, we used linear regression to study the trend analysis.
In this study, we used a data-driven model, also known as an experimental model. We separated the data of the time series in training from that of the validation with a 75%:25% ratio. We used a groundwater prophet forecasting method developed by Aguirela et al., 2019 [24], with the specification of data of the time series as follows,
y ( t ) = g ( t ) + s ( t ) + h ( t ) + x ( t ) + ε t
where y(t) is the data, g(t) is the trend function, s(t) is a periodic component, h(t) is potentially missing data, x(t) is a predictor variable, and εt is a random function that satisfies the normal distribution. In this study, we employed a Prophet R package implementation. This method uses a linear growth model to evaluate a constant function. S changes the point in time sj, j = 1, …, S (the date on which the growth rate changes) and is modeled using a rate adjustment vector. The change point date can manually or automatically be determined from the first 80% of the time-series data (training), and the remaining value is used for verification. The R code for this method is available at https://cran.r-project.org/web/packages/prophet/index.html, accessed on 17 May 2024. One of the essential matters in the management of water resources is predicting the future water level dynamics. We used four-year data as the model data and made some forecasting for the following year. In this case, we did not apply the low-pass filter in our prediction model; instead, we used the original unfiltered data.

3. Results and Discussion

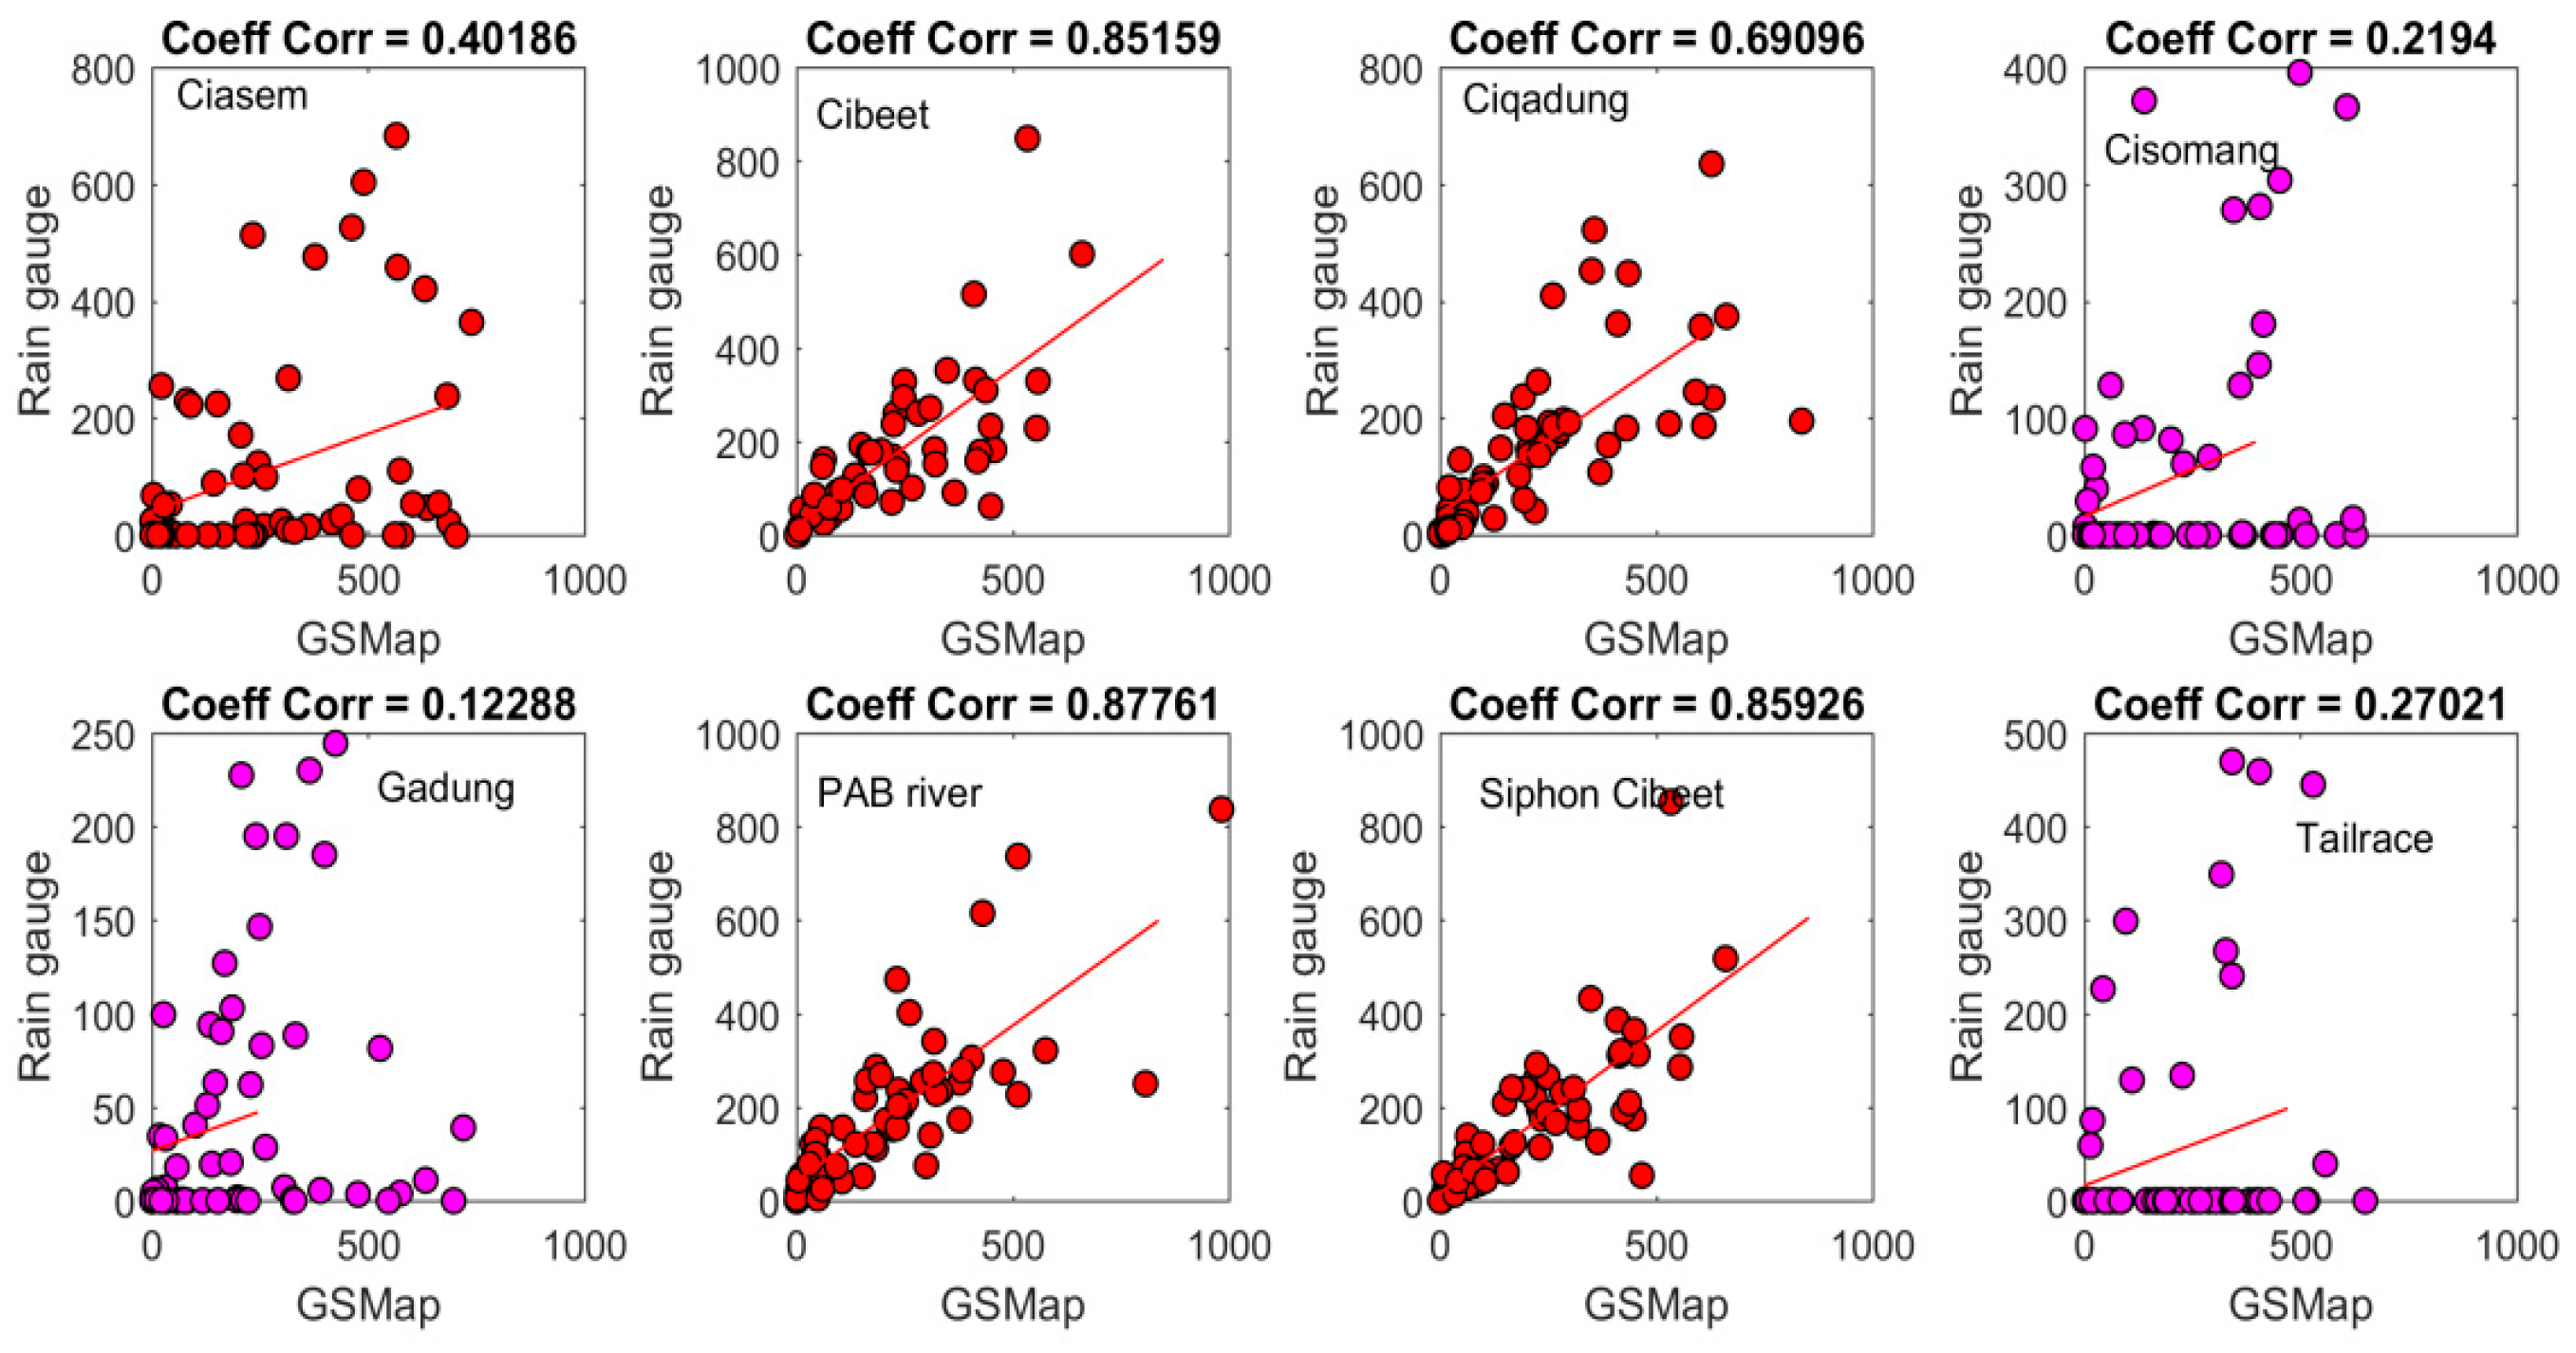
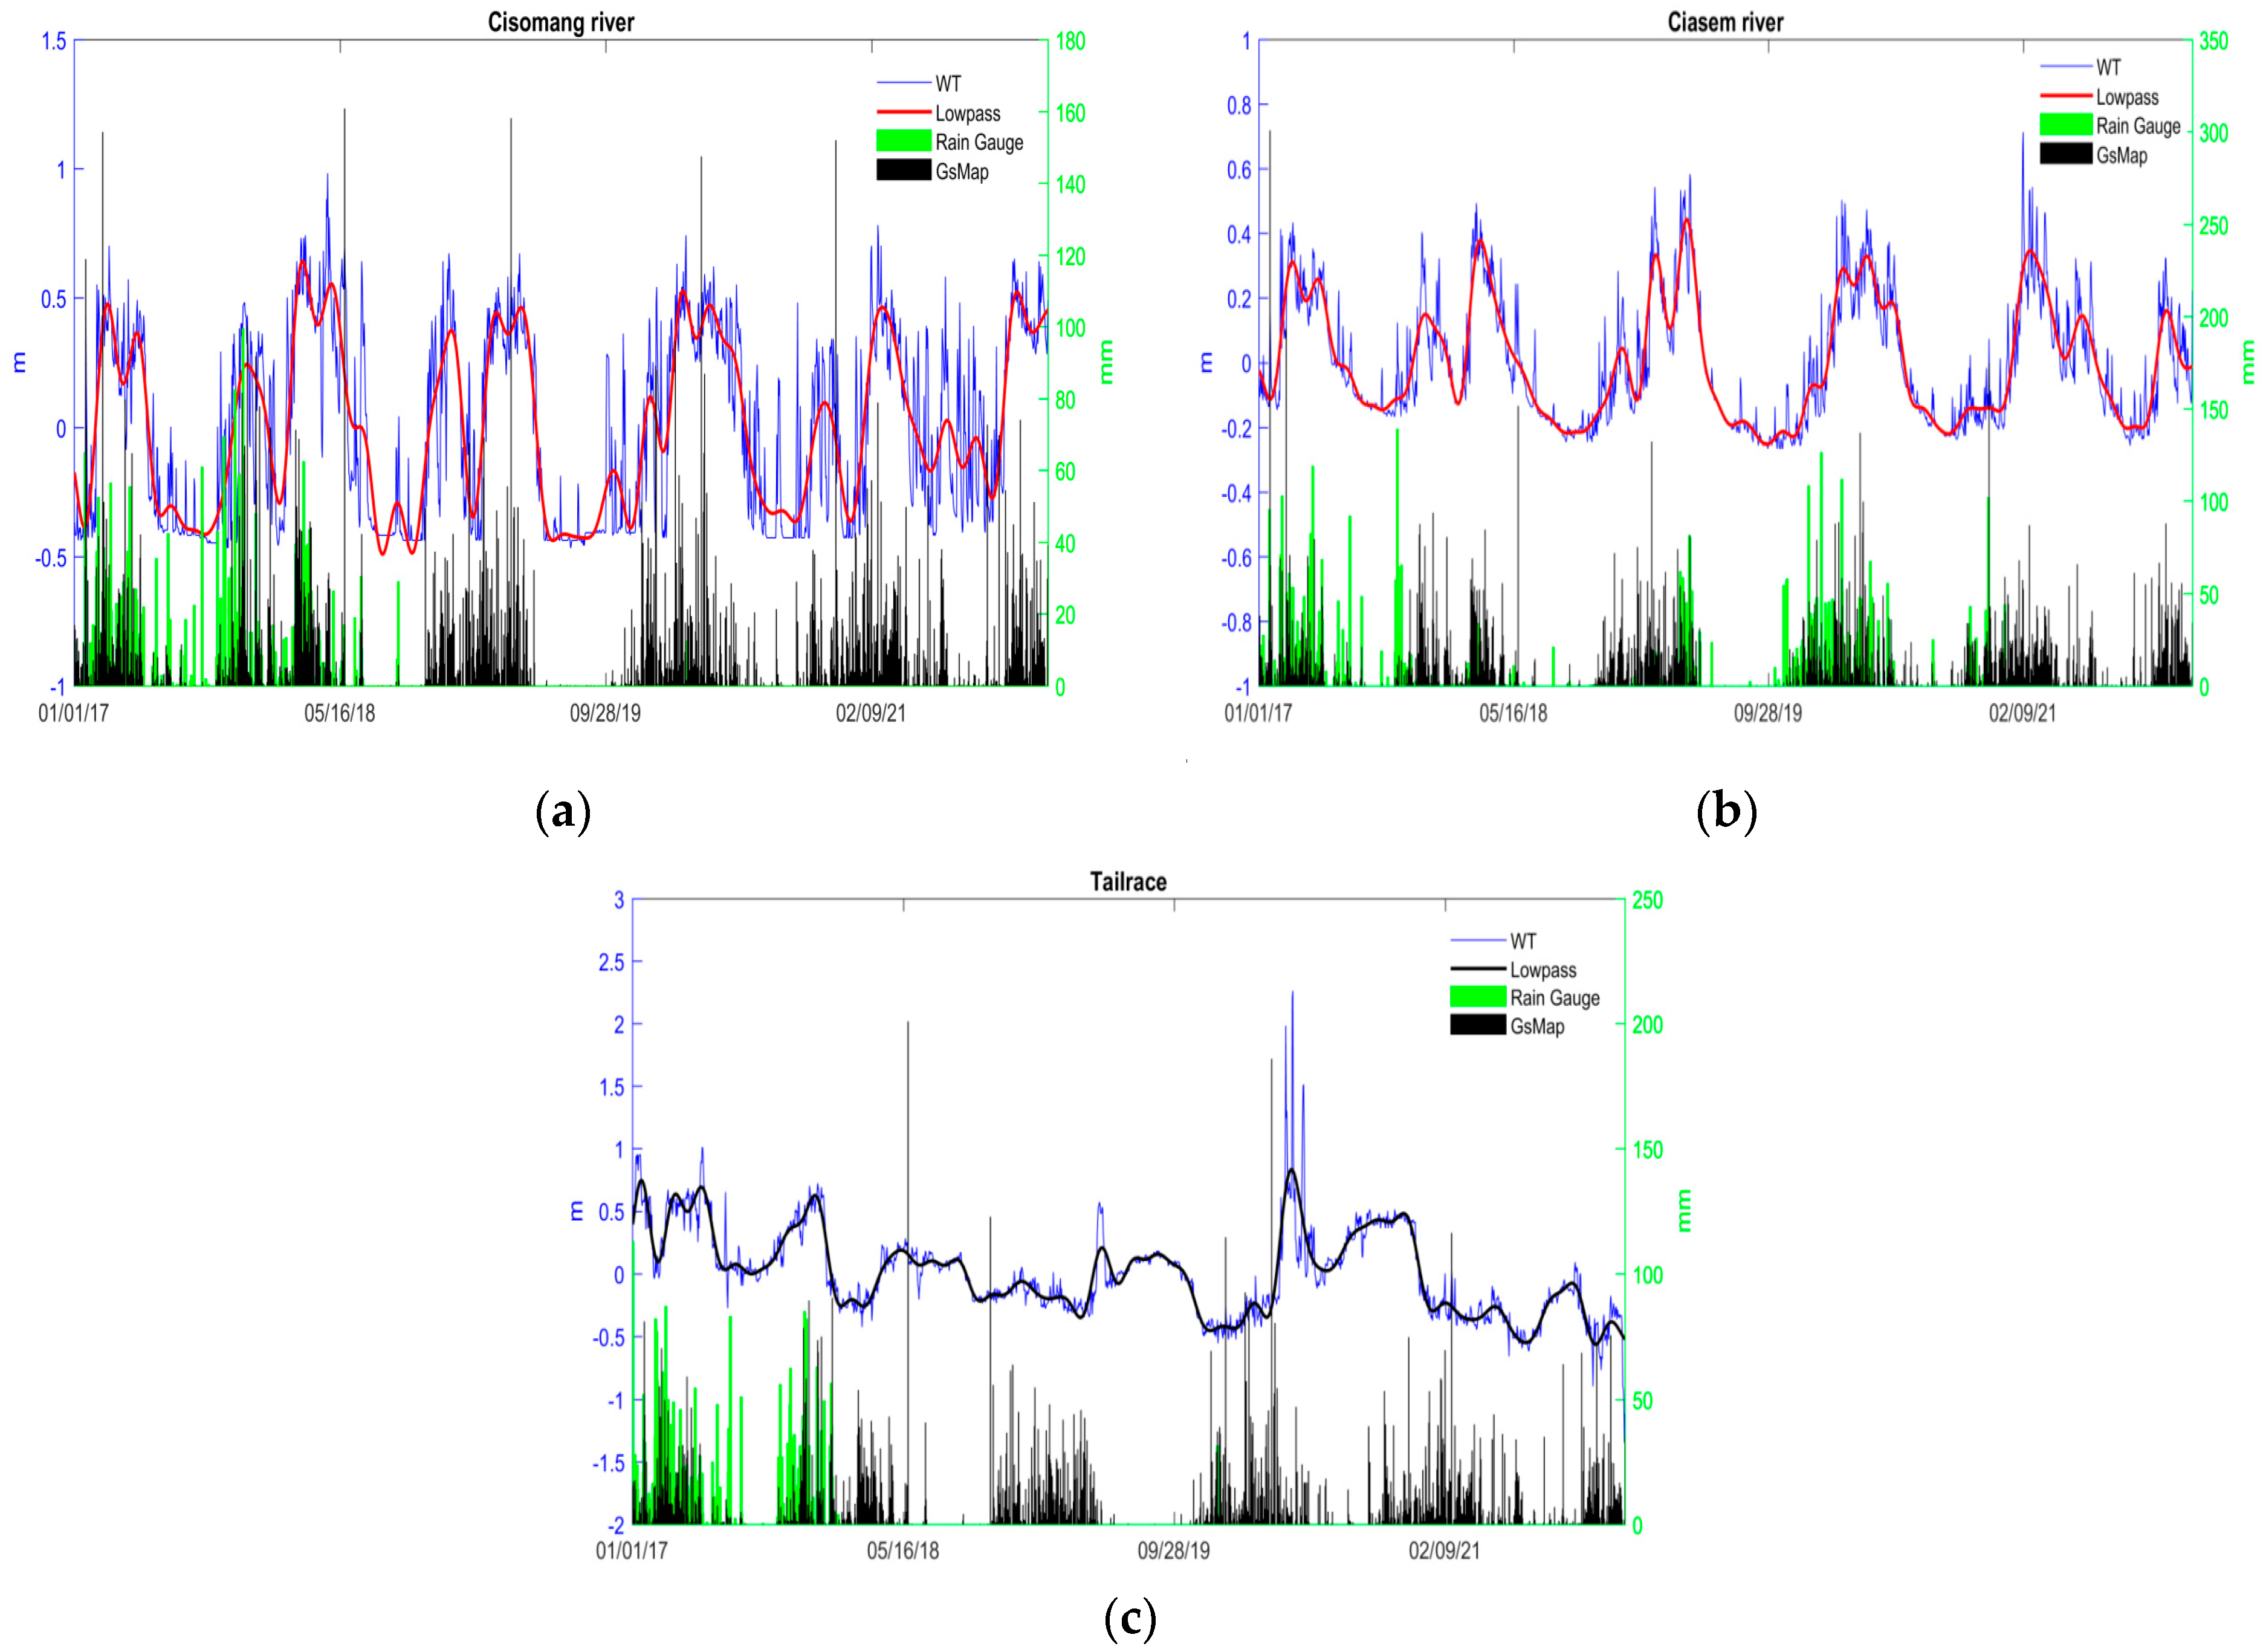
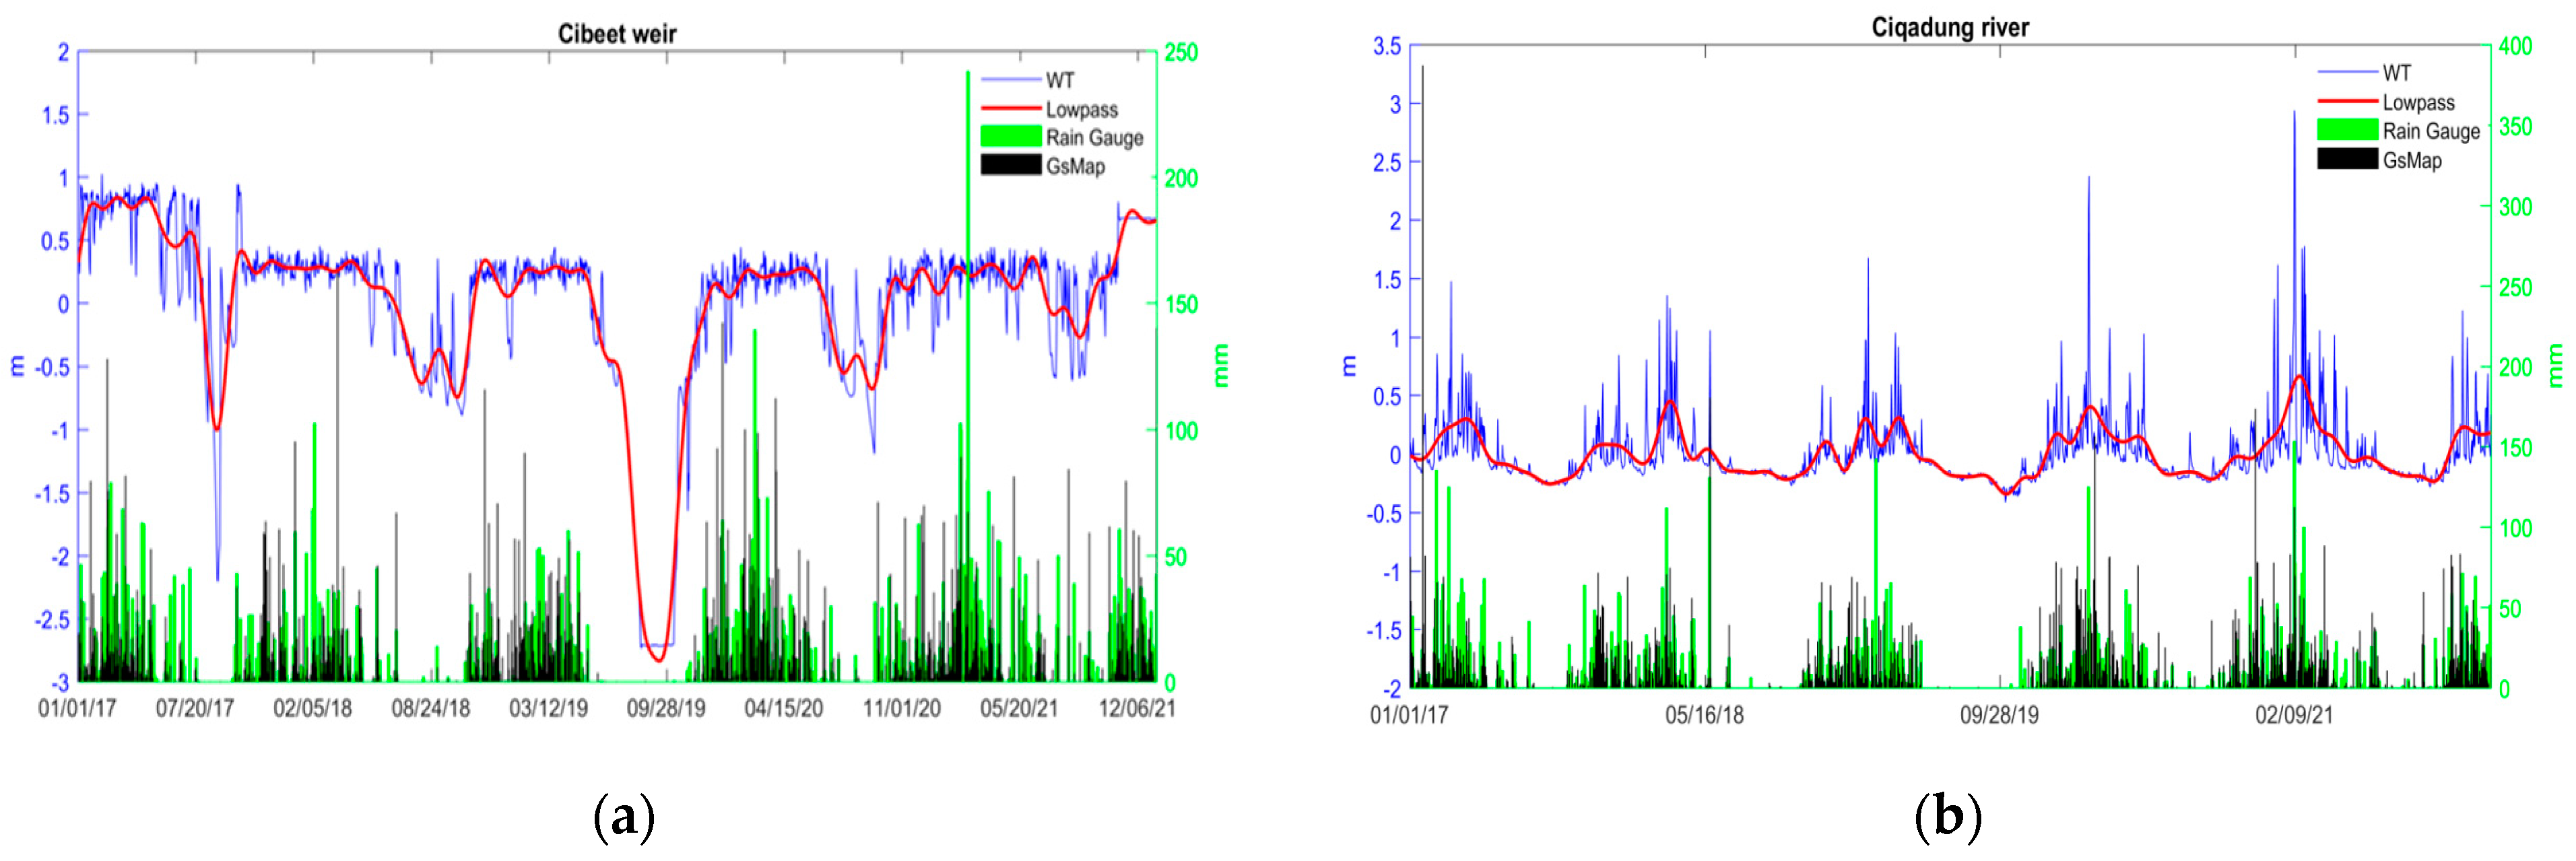
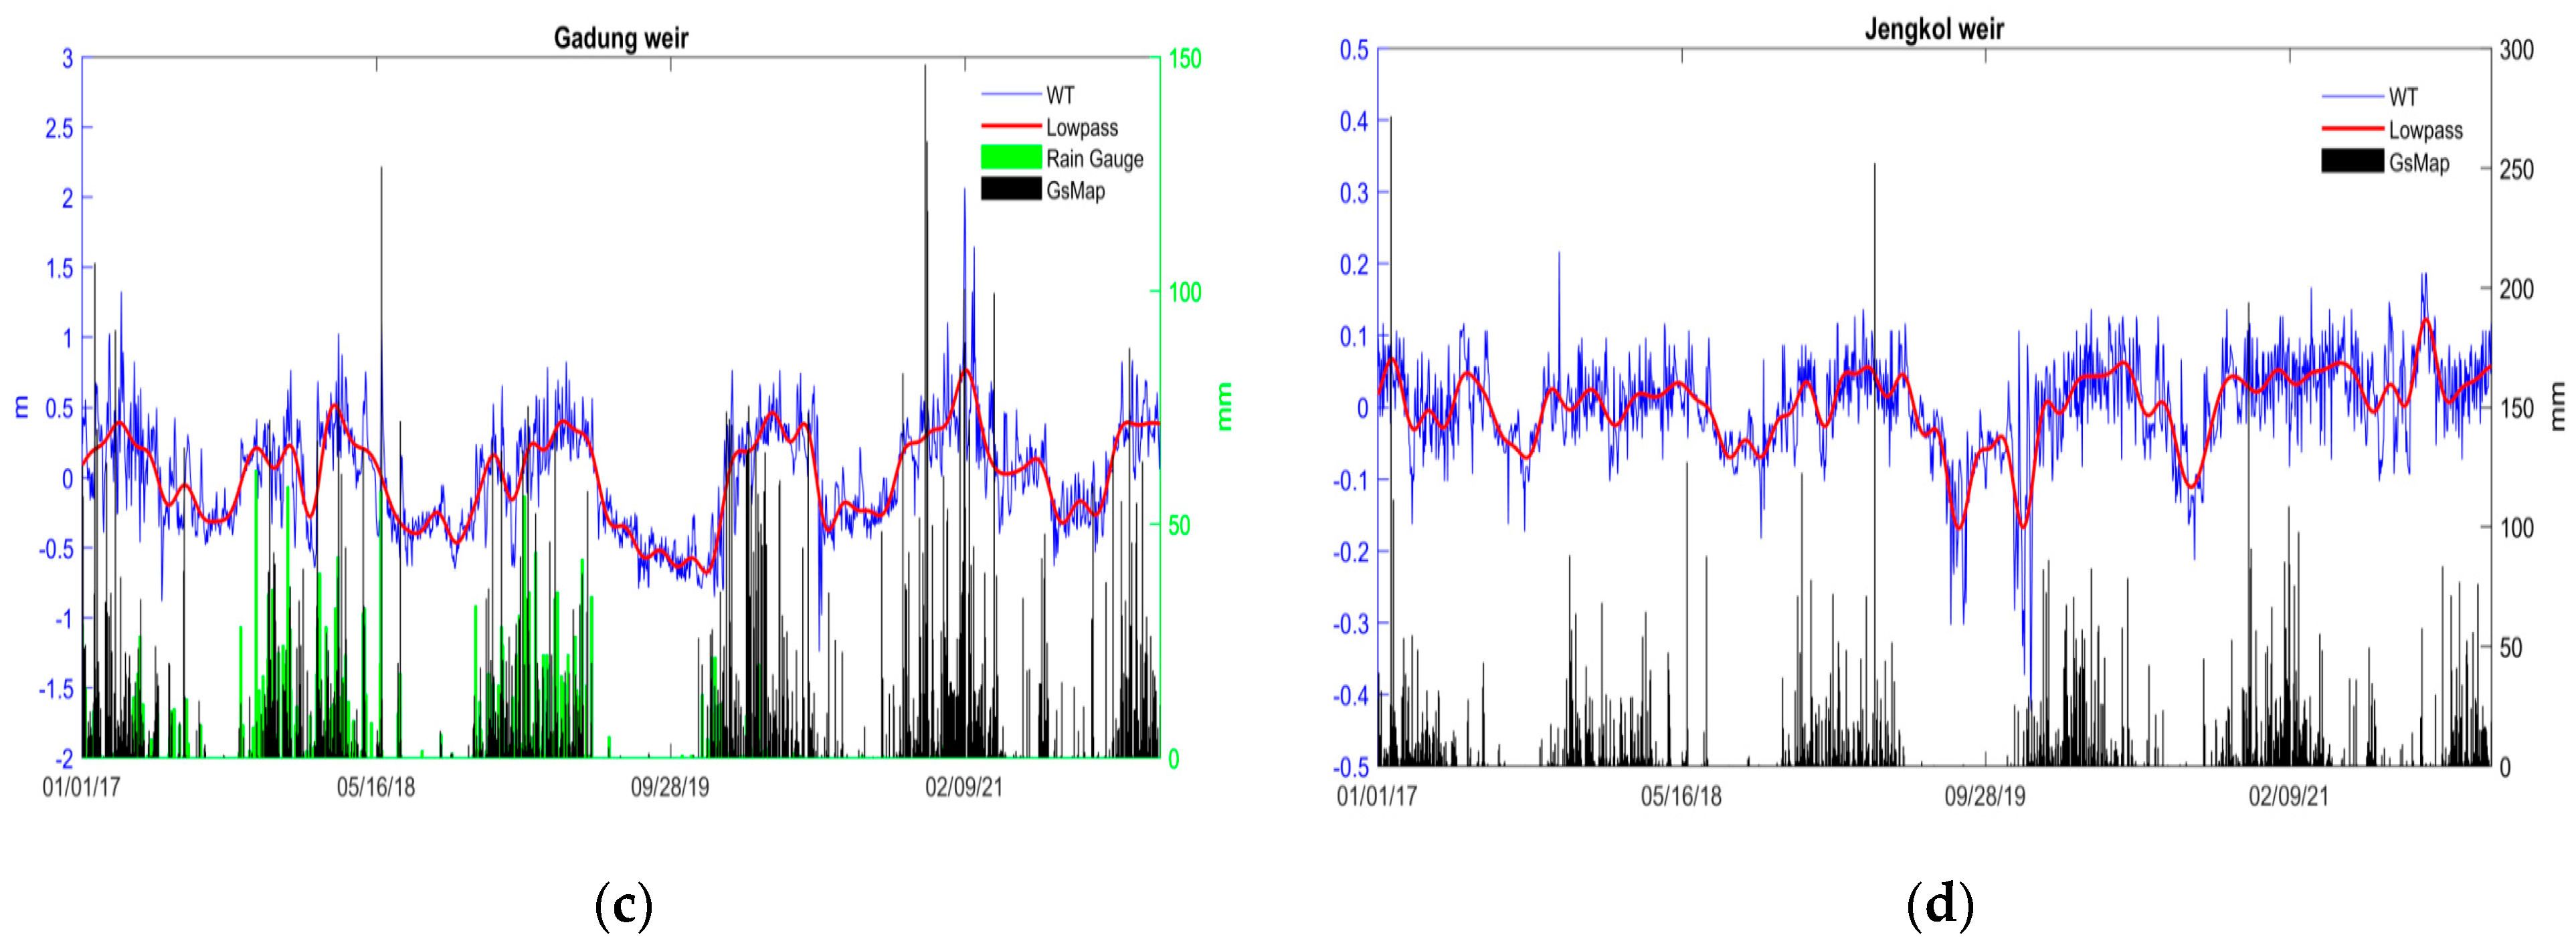
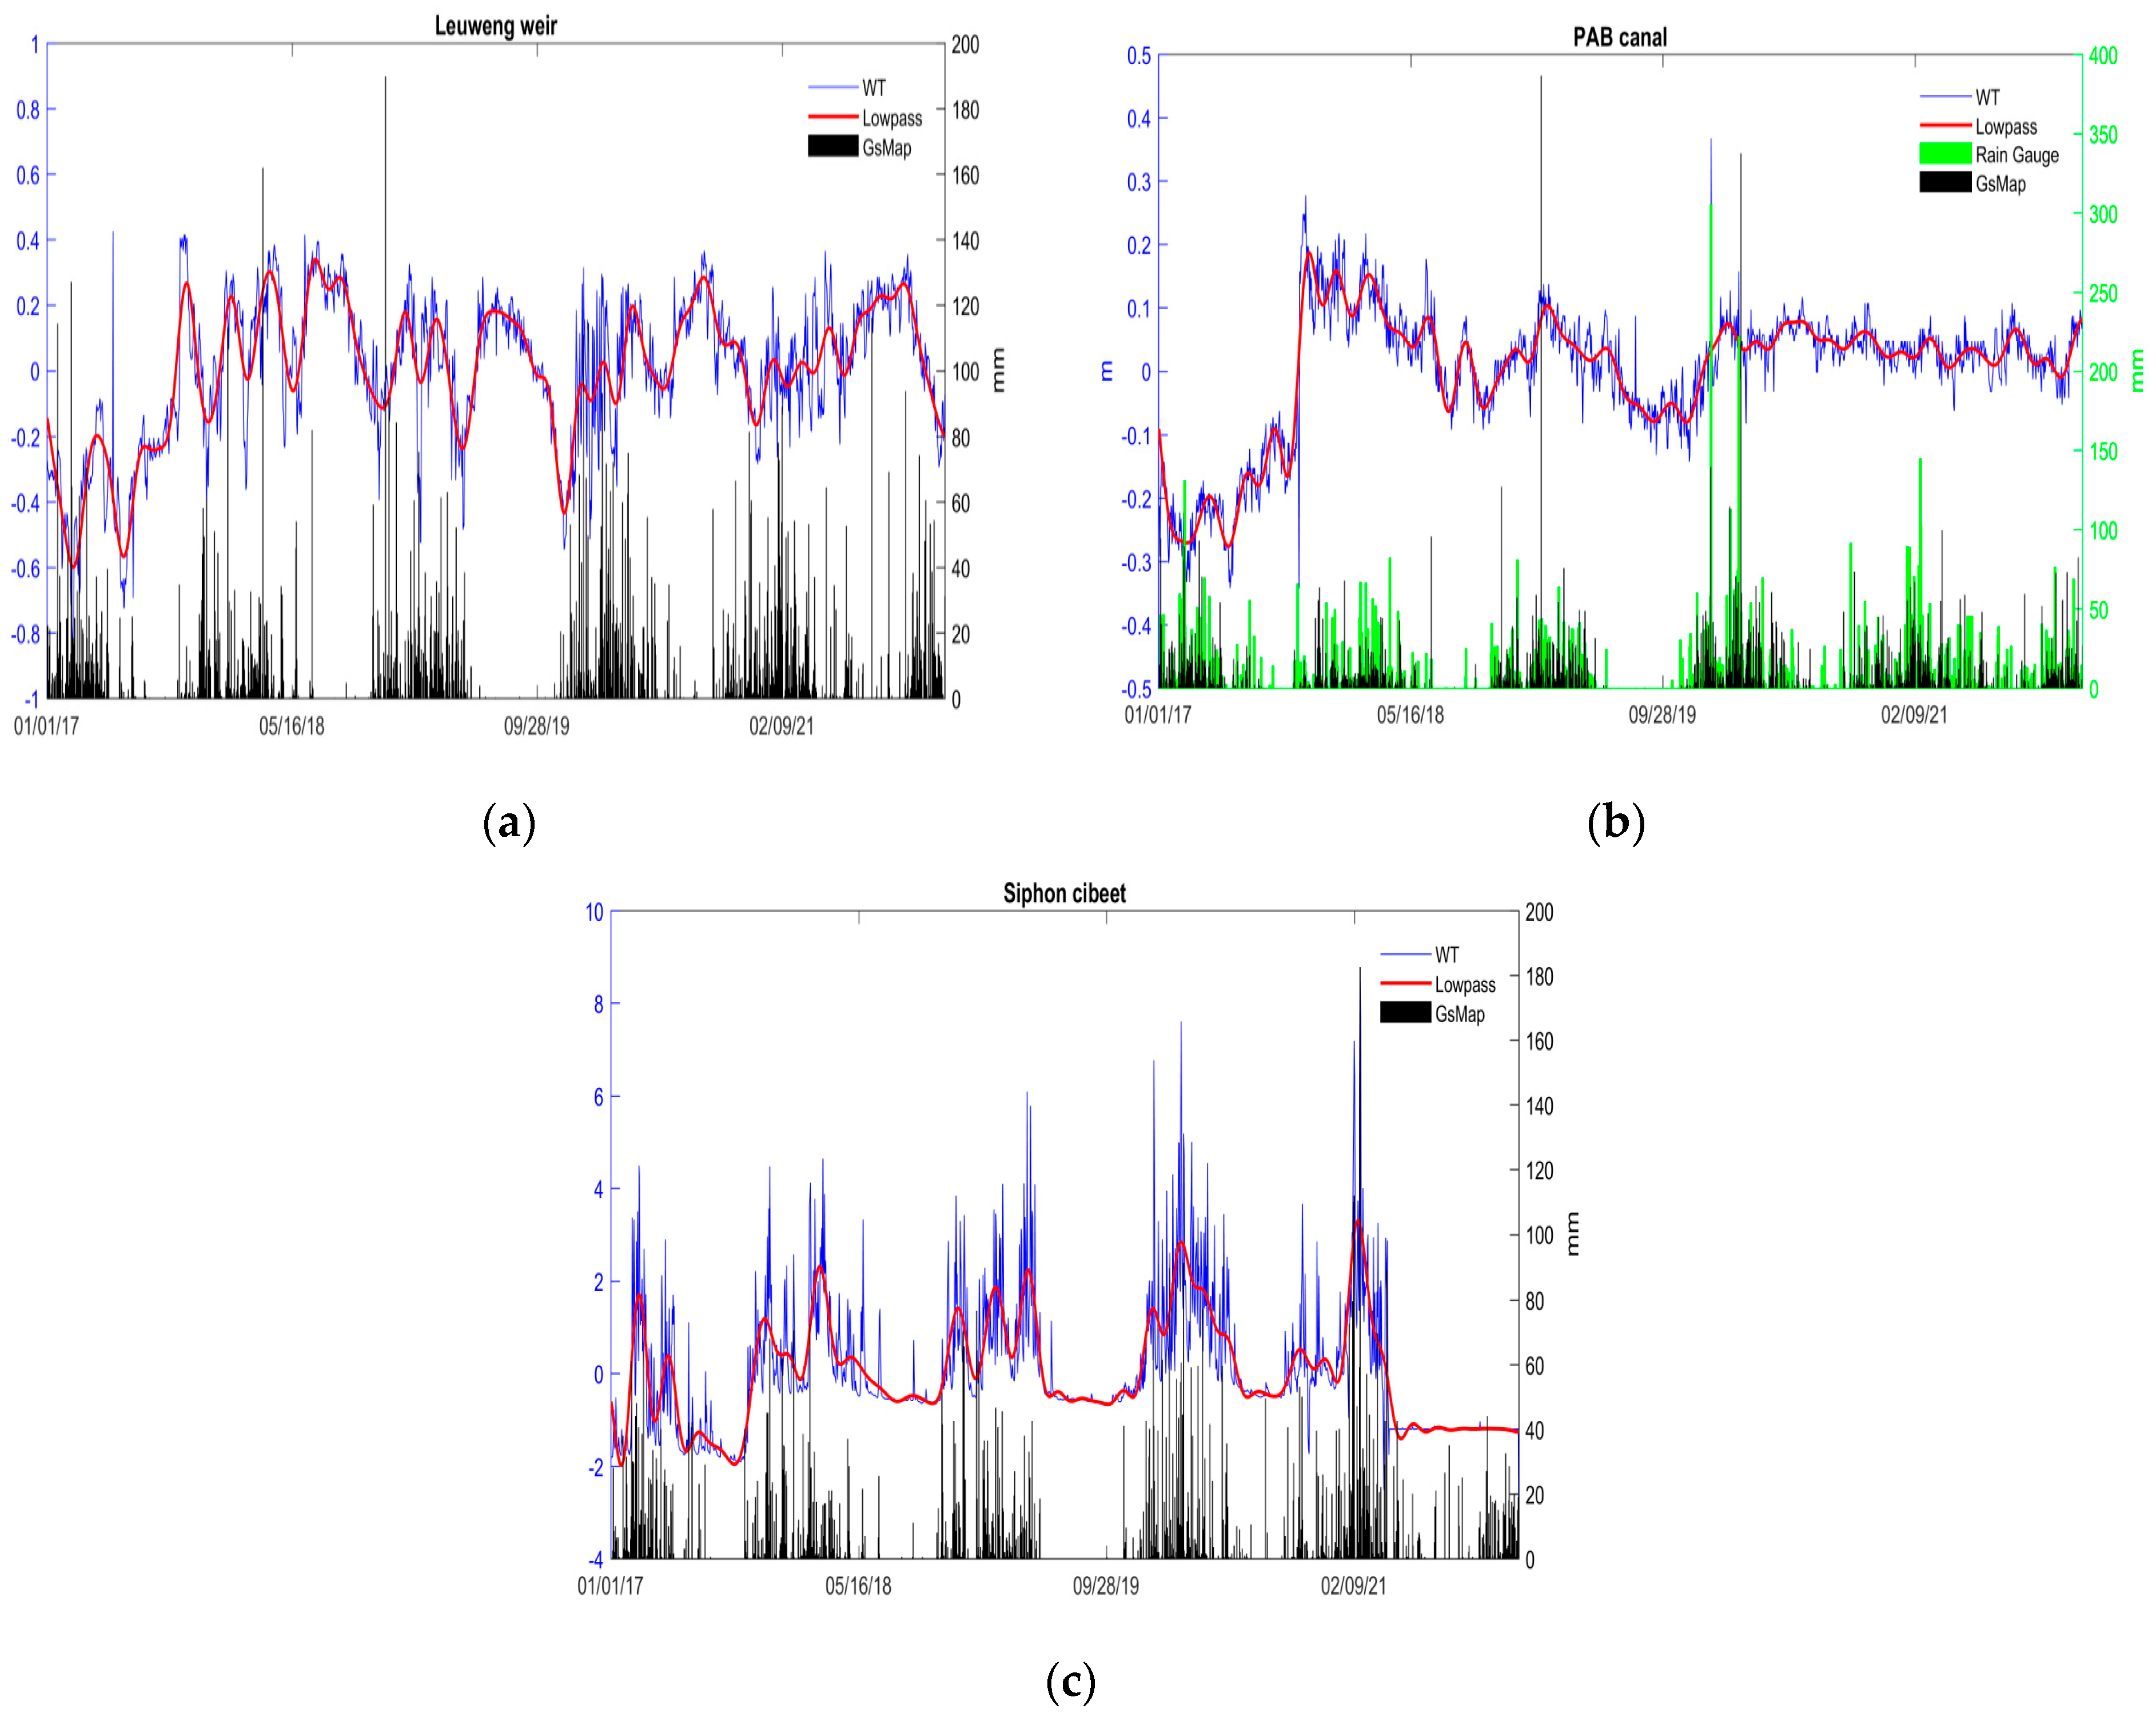
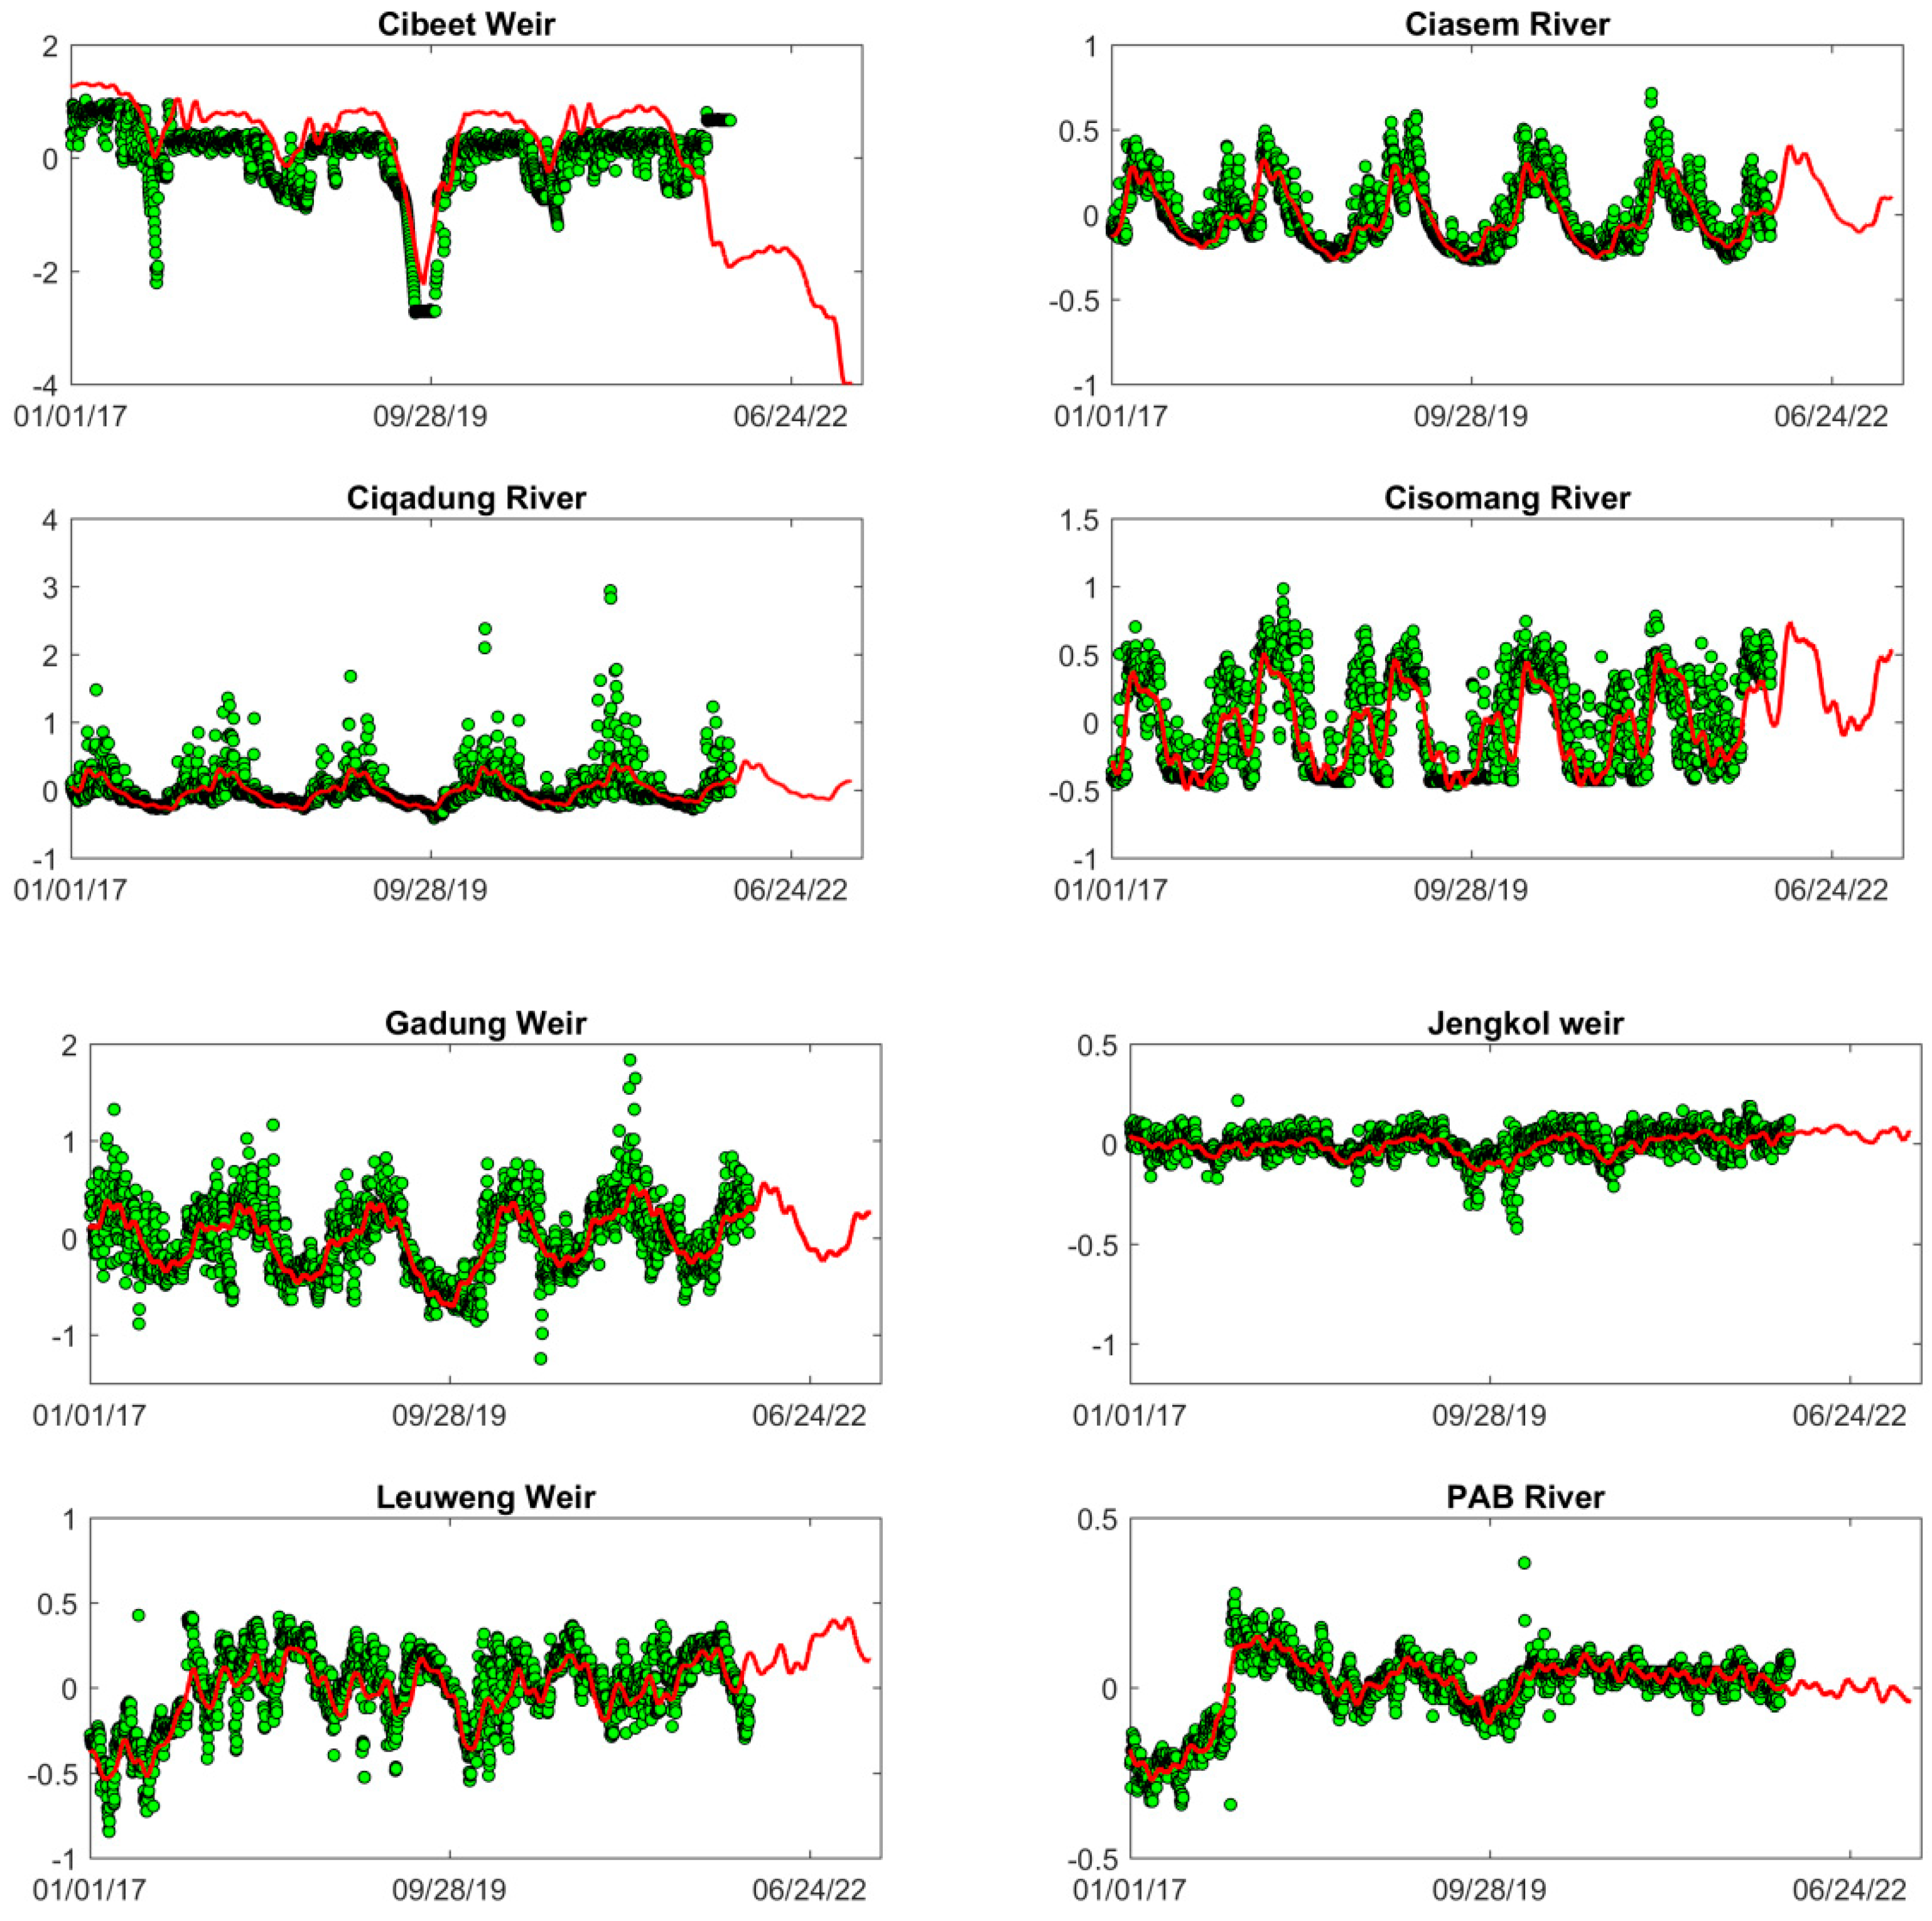
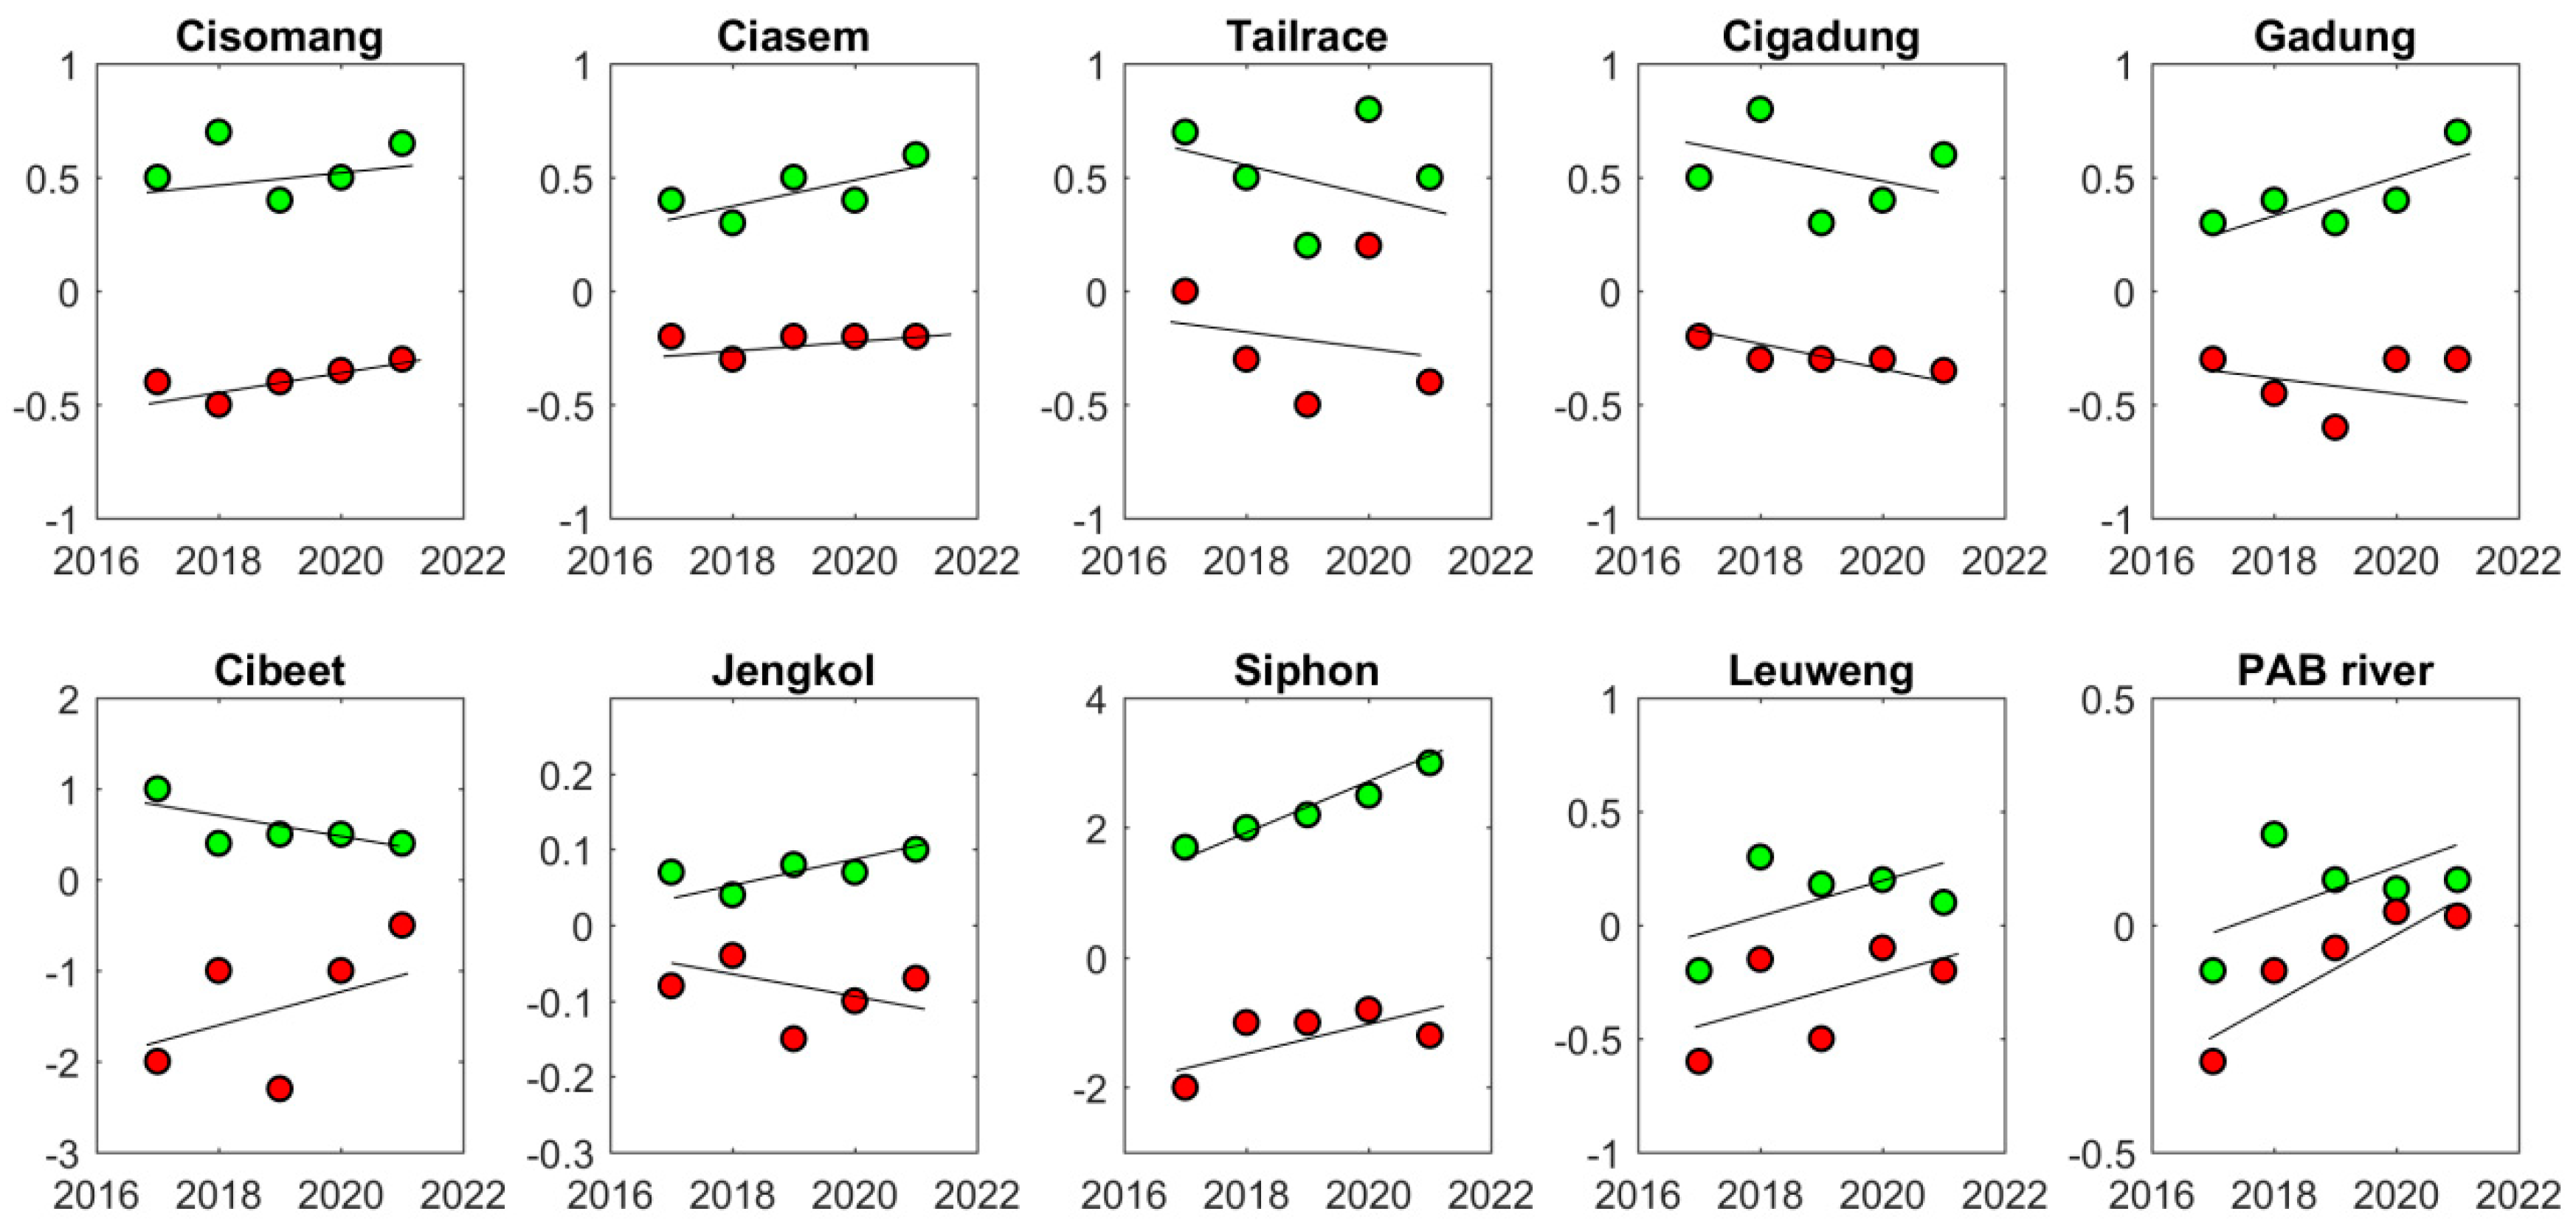
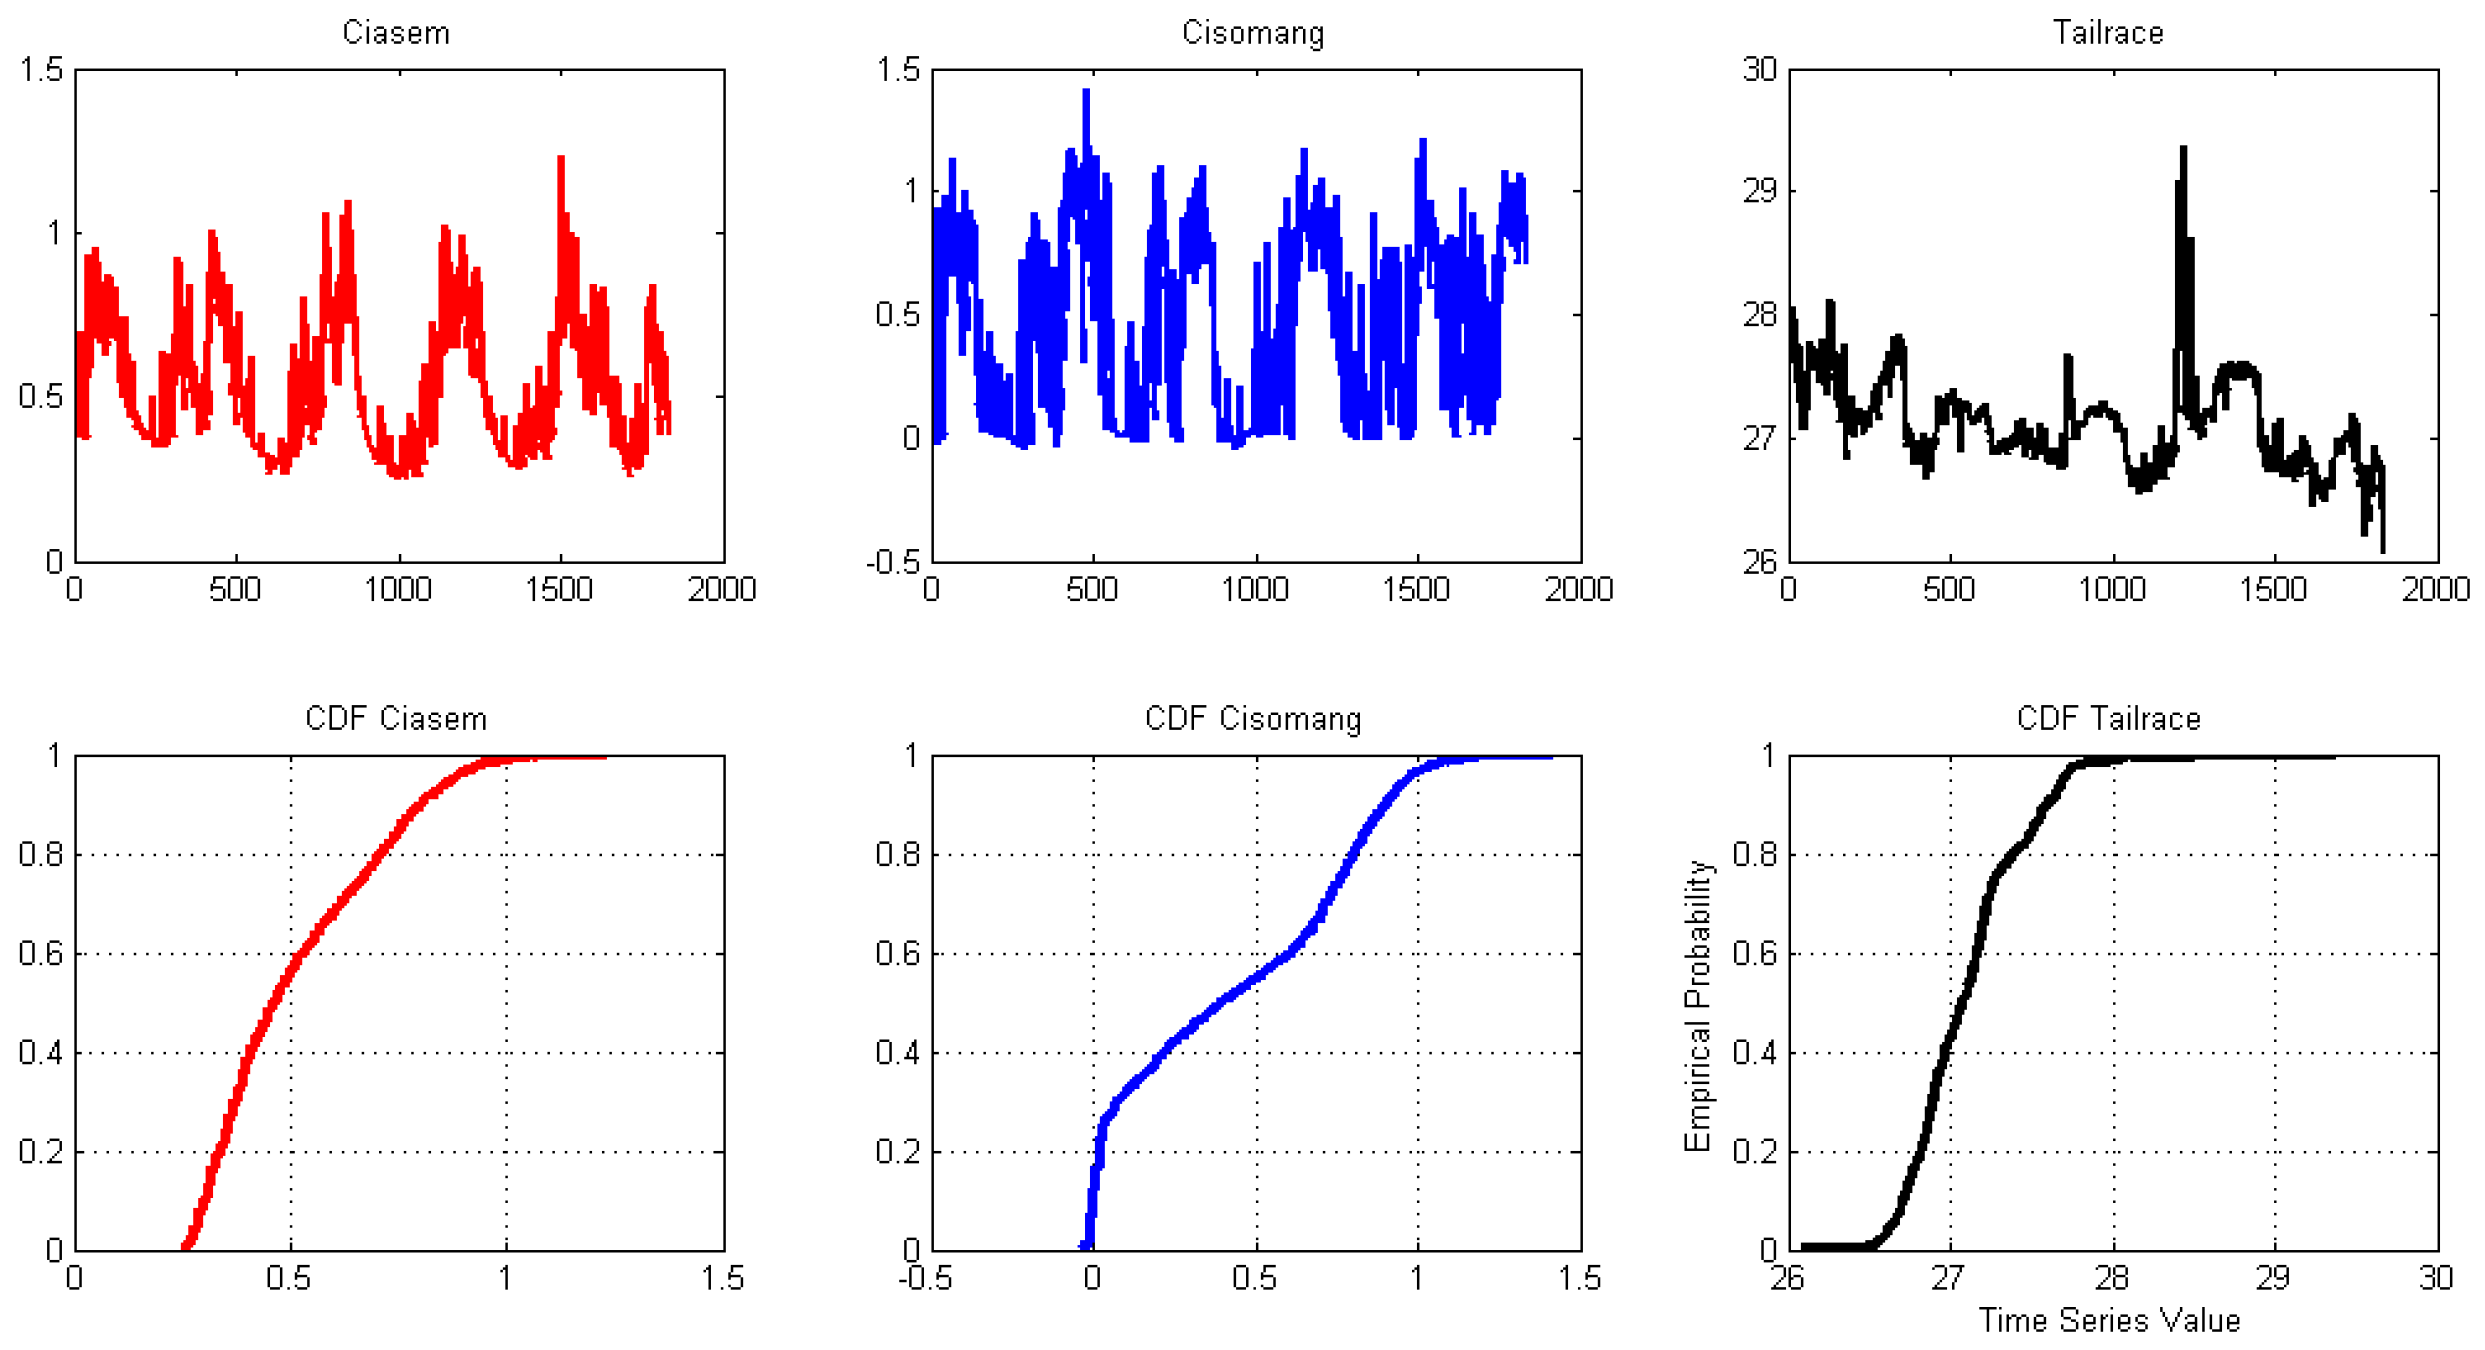
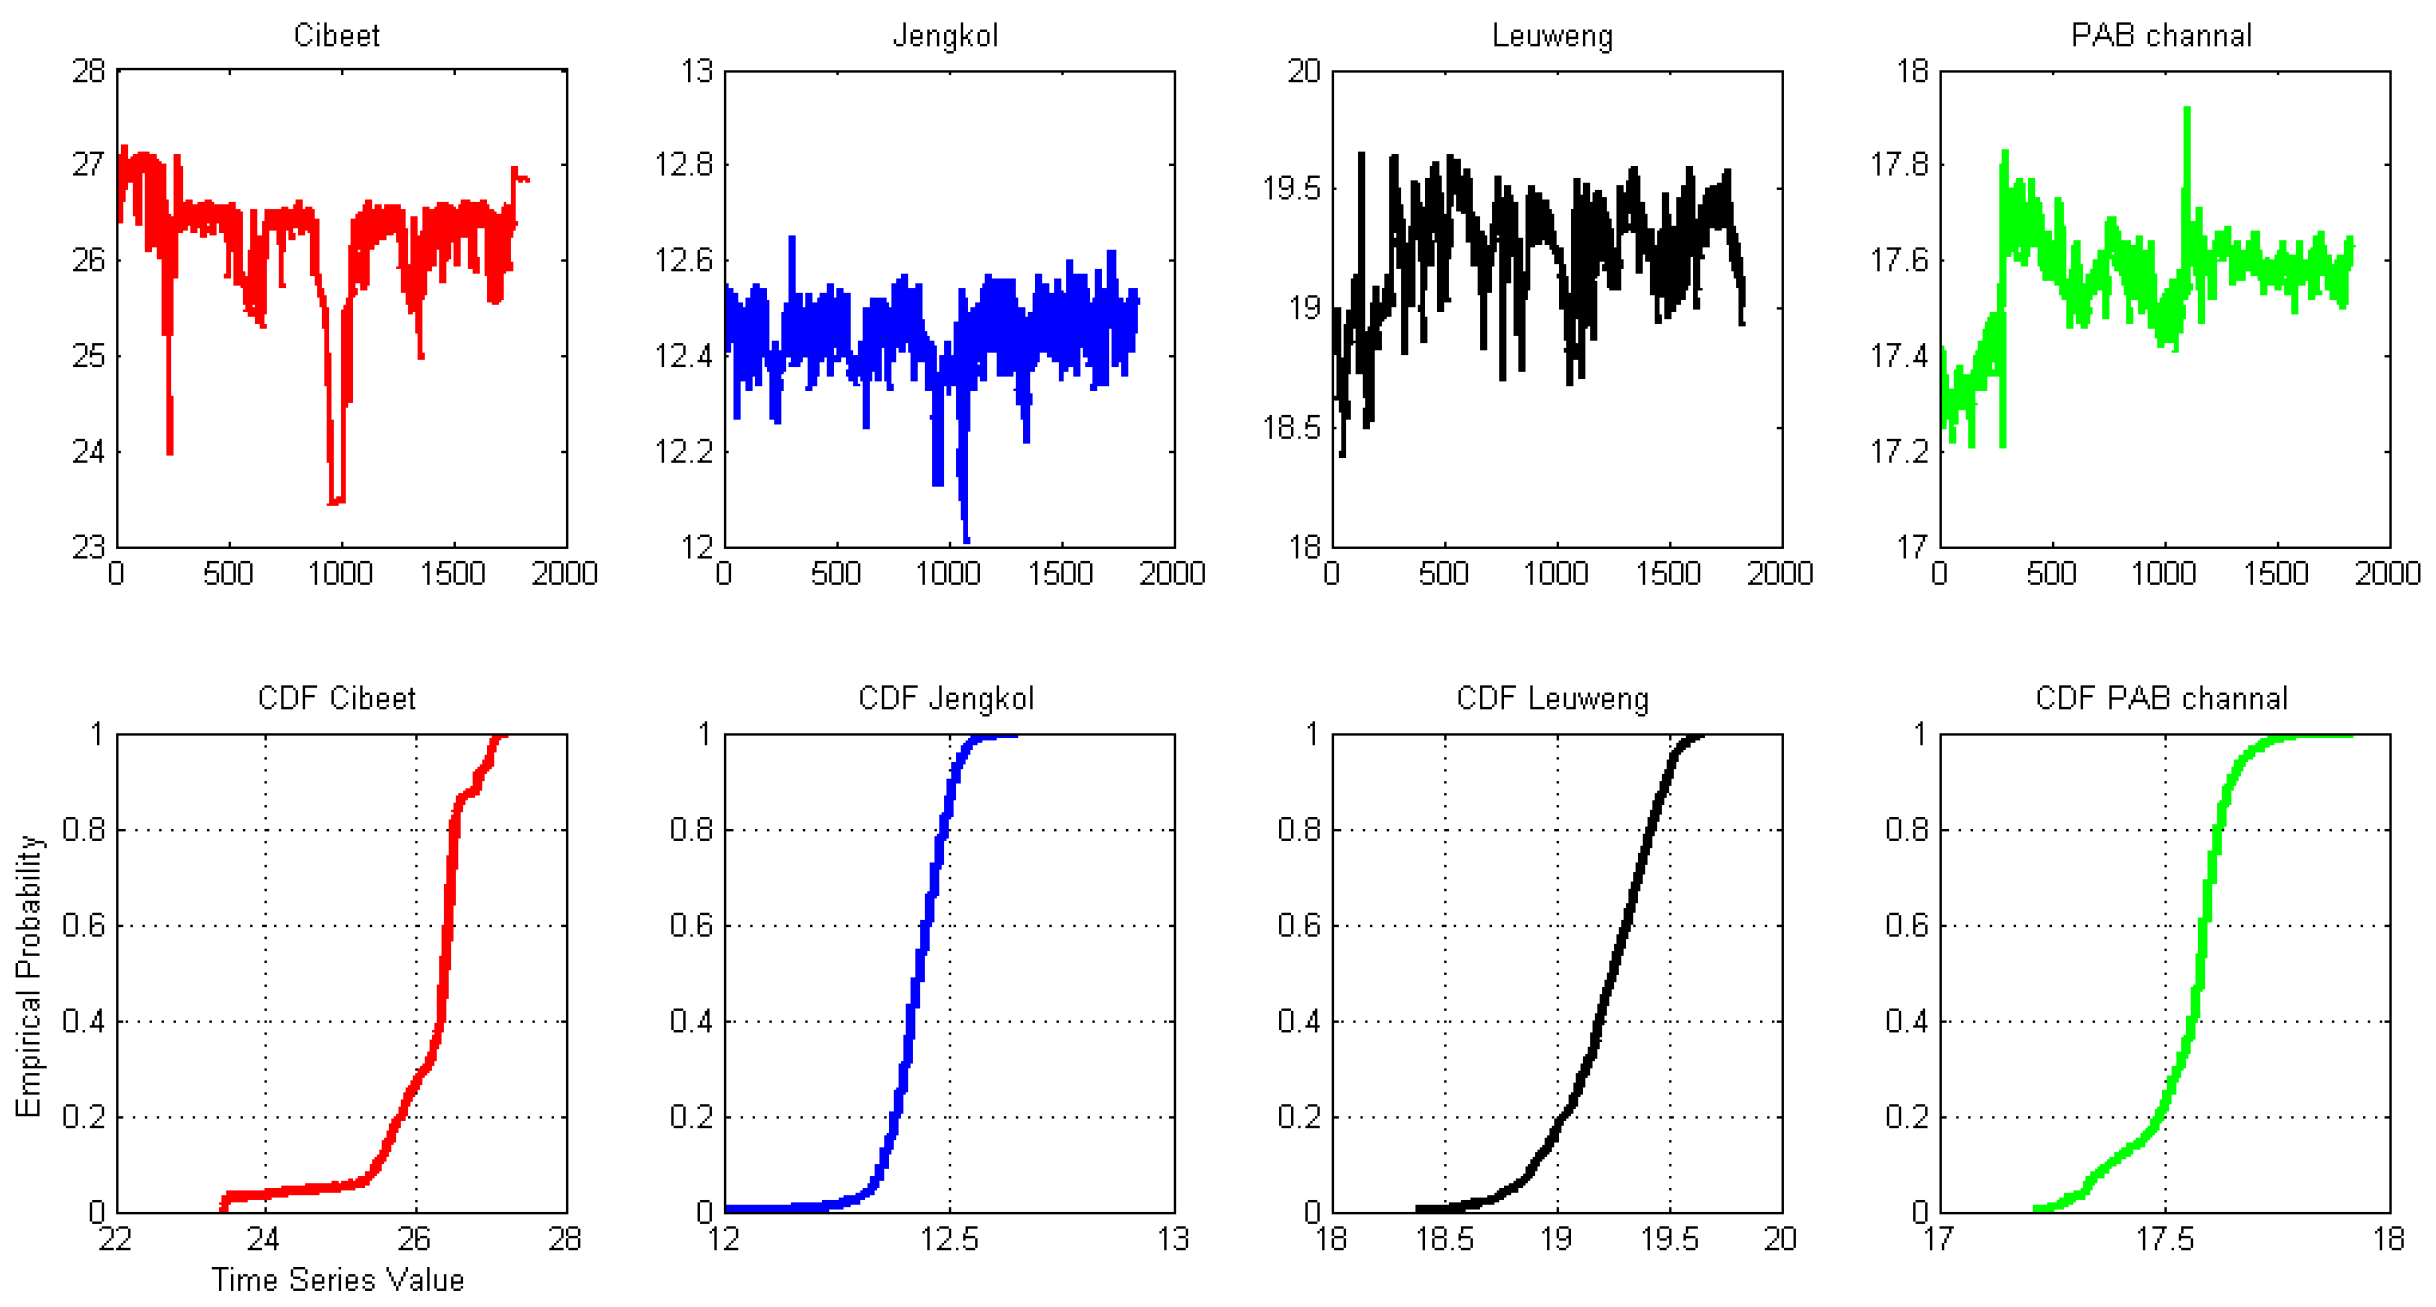
3.1. Rainfall and Water Level Variability

We start by taking into account the input of water resources, that is, rainfall. It is important to take into account the rainfall patterns and trends in the area when assessing water resources. The correlation between GSMaP and rainfall in situ data was relatively high in some areas, such as the Cibeet Weir (0.85), the Cigadung River (0.69), the PAB River (0.87), and Siphon Cibeet (0.85) (see Figure 3). In contrast, the correlation was low in other areas, such as the Cisomang River (0.21), the Gadung Weir (0.12), and the Tailrace (0.27). The regression analyses conducted using polynomials and exponentials indicate relatively low correlation values for the three locations (see Figure 4 and Figure 5), namely, the Cisomang River (0.15), the Gadung Weir (0.14), and the Tailrace (0.2), respectively. However, it should be noted that these results are based on the limited data set available, and further research may be required to obtain a more comprehensive understanding of the relationships between the variables.
Figure 4 and Figure 5 depict the relationship between GSMap rainfall and water level, as well as rain gauge data and water level. The correlation analysis was conducted using a 3rd-order polynomial correlation; however, the resulting correlation coefficient remains small. This can be attributed to the inherent differences between rainfall, which is a discrete variable, and water level, which is a continuous variable. Furthermore, it is important to consider that hydrological systems are influenced by various factors, such as drainage, evapotranspiration, topography, local climate, and water management (including the presence of dams). These factors can affect how rainfall contributes to rising water levels [25,26].
The high correlation between the GSMaP and the rain gauge occurred in the Ciasem River, the Cibeet Weir, the PAB River, Siphon Cibeet, and the Cigadung River. The correlation between the GSMaP and the rain gauge is relatively high in Indonesia in the rainy season [27,28]. The GSMaP data were also entirely accurate when we used them to observe the amount of rainfall leading to any flooding events in Jakarta, a lowland area around the Citarum watershed [29]. In another study, a researcher revealed that the GSMaP accuracy of its valuation using a gauge-based rainfall measurement crossing the Poyang Lake Basin showed that the coefficient of the monthly correlation was 0.85. So, it indicated a significant linear relationship between the product estimates and the measured rainfall observations [30].
The Citarum watershed generally has an average annual rainfall of between 1200 mm in coastal areas (the northern part of the watershed area) and 4000 mm in areas dominated by hills and mountains (central to the southern part of the watershed area). Nearly 70% of the annual rainfall occurs during the rainy season (September to November). Monsoons mainly influence seasonal rainfall distribution, and the southern mountain’s orographic effect dominates the rainfall. From the analysis of the annual isohyet data of the Citarum watershed between 2017 and 2021 (see Figure 6), the areas with the highest annual average values occur in the western and eastern side areas with a value of 4000 mm/year. A minimum value of 1200 mm and a maximum value of 2700 mm/year occurred in 2018. The average annual rainfall in the regions in terms of their topographical sequence from the upstream to the downstream was as follows: the Cisomang River (2838 mm/year), the Ciasem River (3354 mm/year), the Tailrace (2543 mm/year), the Cigadung River (2716 mm/year), the Gadung Weir (2537 mm/year), the Cibeet Weir (2447 mm/year), the Jengkol Weir (2512 mm/year), Siphon Cibeet (2444 mm/year), the Leuweung Weir (2457 mm/year), and the PAB River (2486 mm/year). Considering this information, we found out that areas near a mountain had higher rainfall than the lowlands located in a coastal area. That condition was still natural since the dynamics of the climate and the weather in the Citarum watershed were dominated by a local process, such as a land–sea breeze; as a result, the rain clouds tended to be near a mountain. However, this condition might change due to the increasing rainfall intensity. Based on the water balance simulation of some climate change projections in some tropical areas, such as the Batang Hari Watershed in Sumatra, climate change causes increased flooding events more frequently [31]. Moreover, Priyambodo et al., 2021 [29] also observed the frequent occurrence of flooding for the past two decades in the lowlands around the Citarum watershed.
Rainfall data are an essential factor affecting groundwater and surface water (water level) [32,33]. The spectrum of water level variability is depicted in Figure 7. In general, the variability of water tables from rivers and weirs in the Citarum watershed followed the monsoon patterns, except in some places serving as the control, such as those at the PAB River. The water level variability measured in Tailrace DAM Jatiluhur had the same pattern as the dam discharge. The maximum spectrum generally occurred in approximately a 360-day period, which was the same duration as the monsoon period. Only two stations, the Leuweung Weir and the Tailrace stations, did not have a spectrum peak in the monsoon period. At the stations with a dominant monsoon spectrum, the spectrum with a shorter-than-200-day period was also significant. We thought this situation occurred due to a fairly dominant oscillation system in Indonesia, such as the Madden–Jullian Oscillation (MJO). We applied a low-pass filter with a 50-day cutoff frequency since this condition represented the effects of the MJO and the Monsoon [34,35]. We assumed that the high-pass filter represented the fluctuating conditions due to various anthropogenic effects. On the other hand, the high-pass filter pattern had a significant amplitude (the graph was not shown). It showed that daily variability such as an anthropogenic manifestation could not be ignored.
The Upper Citarum area is represented by three stations, namely, Cisomang River, Ciasem River, and Tailrace Jatiluhur. The Cisomang River station showed a strong monsoon pattern; an anomalously high water level occurred in the rainy season (Figure 8a). The increasing water level occurred in the rainy season. In the dry season, the water level dropped significantly. The rain gauge did not transmit any data at the end of the 2018 dry season, so the rainfall behavior was analyzed using the GSMaP data. The range of the water level variability in the Cisomang River was about 1 m.
The anomaly in the Ciasem River followed the monsoon pattern where the water level would rise in the rainy season until the transitional season took place from January to May (Figure 8b). The anomaly in the low-pass filter increased before the water level rose and after the water level dropped. The monsoonal pattern was unclear for the Tailrace and Jatiluhur Dam stations (Figure 8c). High fluctuations occurred in the 2020 dry season. To examine the influences of El Niño and the Indian Ocean Dipole (IOD), we computed monthly averages of water levels based on the Nino index (Nino 3.4.) and the Indian Ocean Dipole index (DMI) dataset. Subsequently, we standardized the water level data to facilitate comparison with Nino 3.4. and DMI. In the upstream region, variations in water levels amenable to comparison with Nino 3.4. and DMI are primarily observed in the Ciasem and Cisomang Rivers, while in the downstream region, such variations are predominantly found in the Ciqadung River (refer to Figure 9). It is worth noting that water level data from sources other than these three rivers, such as weirs, dams, and artificial rivers, exhibit relatively constant levels due to regulatory interventions, thus deviating from natural variability.
The natural conditions during observations are weak La Nina (2017), weak El Nino (2018), normal (2019), moderate La Nina (2020), and weak La Nina (2021). During the La Nina phase (2017 (weak), 2020 (moderate)), the water level increased significantly, as depicted in Figure 9. Conversely, during periods of positive Nino34 (signifying the El Niño phase 2018 (weak)), the water levels experienced a decline. This trend mirrors the behavior of the DMI, where an increase in the DMI is associated with a tendency for water levels to decrease, while a decrease in the DMI is linked to an increase in water levels. Over the observation period, the DMI exhibited predominantly positive values.
The upstream Citarum is represented by seven stations, namely, the Cibeet Weir, Siphon Cibeet, the PAB river, the Leuwung Weir, the Jengkol Weir, the Ciqadung River, and the Gadung Weir. The water level in the Cibeet Weir shows a very dependent pattern on the season, and the water level drops in the dry season (see Figure 10a). There was no drastic decline in the 2017 and 2018 dry seasons, which were normal, while due to the impacts of a weak El Nino in 2019, there was a sharp decline. In that year, the Indian Ocean Dipole Mode (IoD) was in an extremely high condition. The water level decrease was closely related to some non-rainy conditions in the dry season. The decline occurred significantly in the 2019 dry season, where the water level decreased to about 3 m. Moreover, we also found that the rainfall measured by the rain gauge had the same pattern as that of the GSMaP satellite. In other words, rainfall data obtained from the GSMaP could fill in the gaps of the data of the rainfall obtained from the rain gauge.
This situation also occurred in the Cigadung River, where the water level anomalously increased during the rainy season (Figure 10b). The increasing water level for the low-pass occurred in the rainy season, while it remained constant in the dry season. When La Nina occurred, the water level significantly increased in the 2020 and 2021 rainy seasons. The rainfall and water levels had a similar pattern. The higher the rainfall was, the higher the water level would be. At the Gadung Weir station (see Figure 10c), a strong monsoon pattern was still apparent since the water level was anomalously high in the rainy season. The water level dropped in the dry season and increased as well as the rainfall. The range of the water level variability at the Gadung Weir was about 1.5 m. At the Jengkol Weir station, the water level did not fluctuate very significantly since the water level rose in the rainy season and dropped in the dry season (see Figure 10d). However, when there was a high IoD condition, the water level dropped prominently.
There were no monsoonal patterns at the Leuweung Weir (Figure 11a). The fluctuations tended to be random and followed a normal distribution. This situation also occurred at the PAB River, with no visible monsoonal patterns (Figure 11b). The range of the water level variability at the Leuweung Weir was about 1 m. The range of the water level variability at the PAB channel was about 0.5 m. The water level at Siphon Cibeet followed a monsoon pattern in that the water level increased in the rainy season and decreased (constantly) in the dry season (Figure 11c).
In general, there is no significant correlation between water level with the Nino 3.4. and DMI indices, except for at the Cibeet Weir under normal conditions (see Figure 12.). Specifically, a decrease in water level occurs when the Nino 3.4. index decreases and DMI increases, while an increase in water level occurs under normal conditions due to support from the downstream water supply from the Jatiluhur reservoir. During El Nino, the floodgates are opened, which is indicated by the rise of the Tailrace.

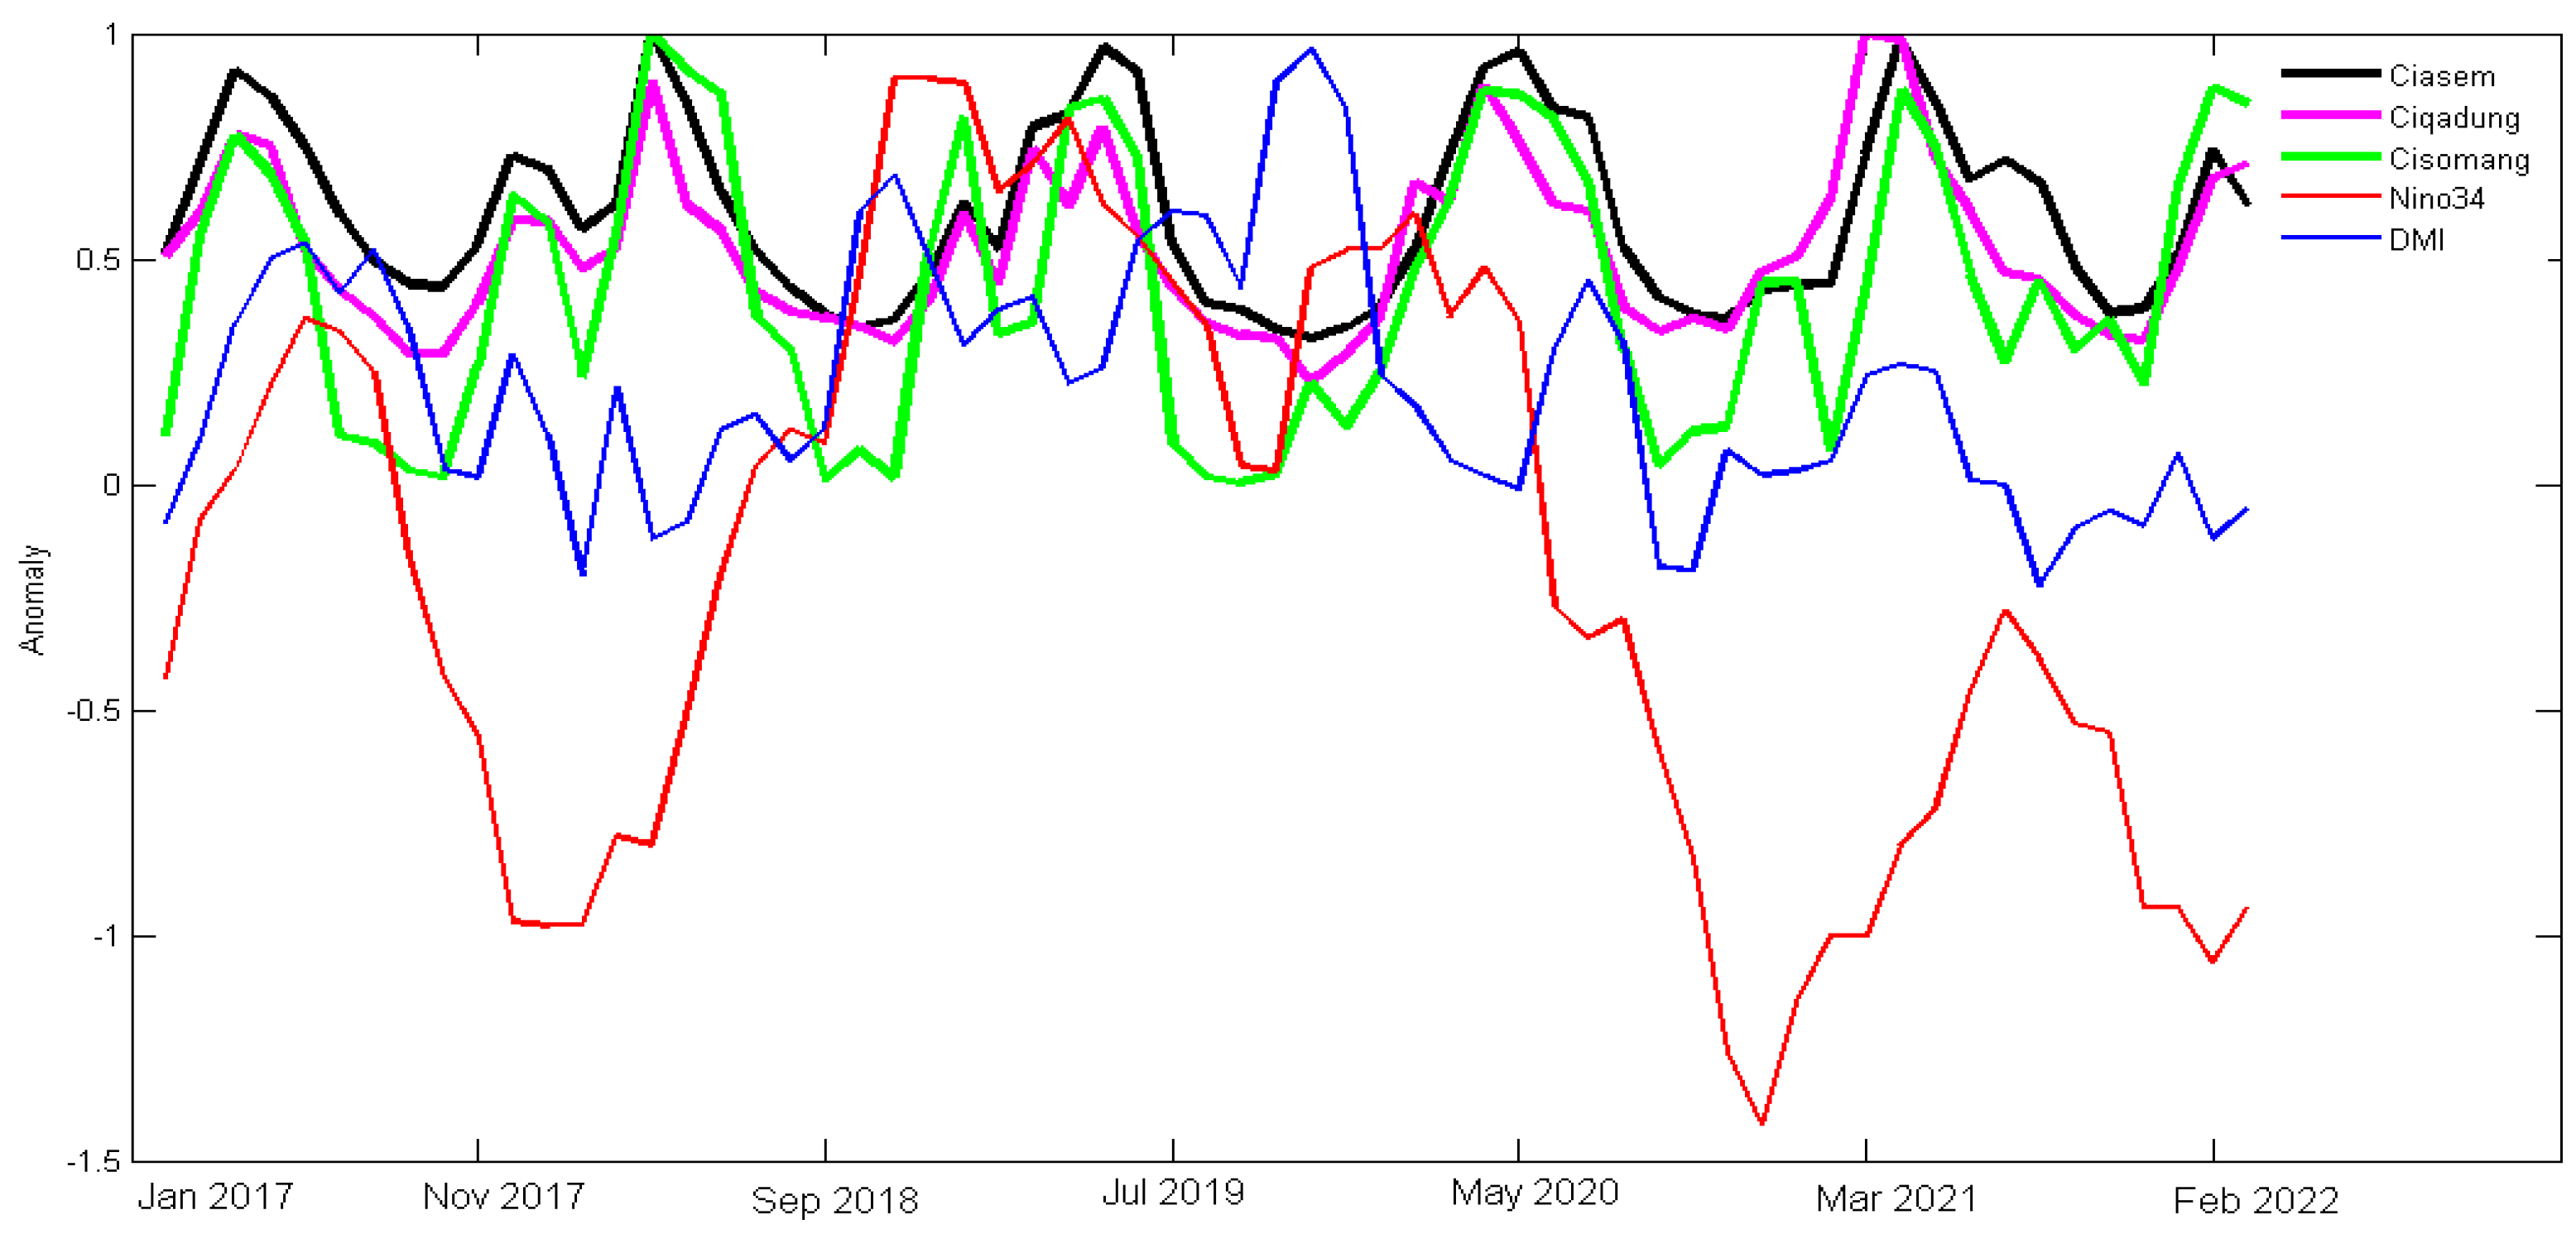
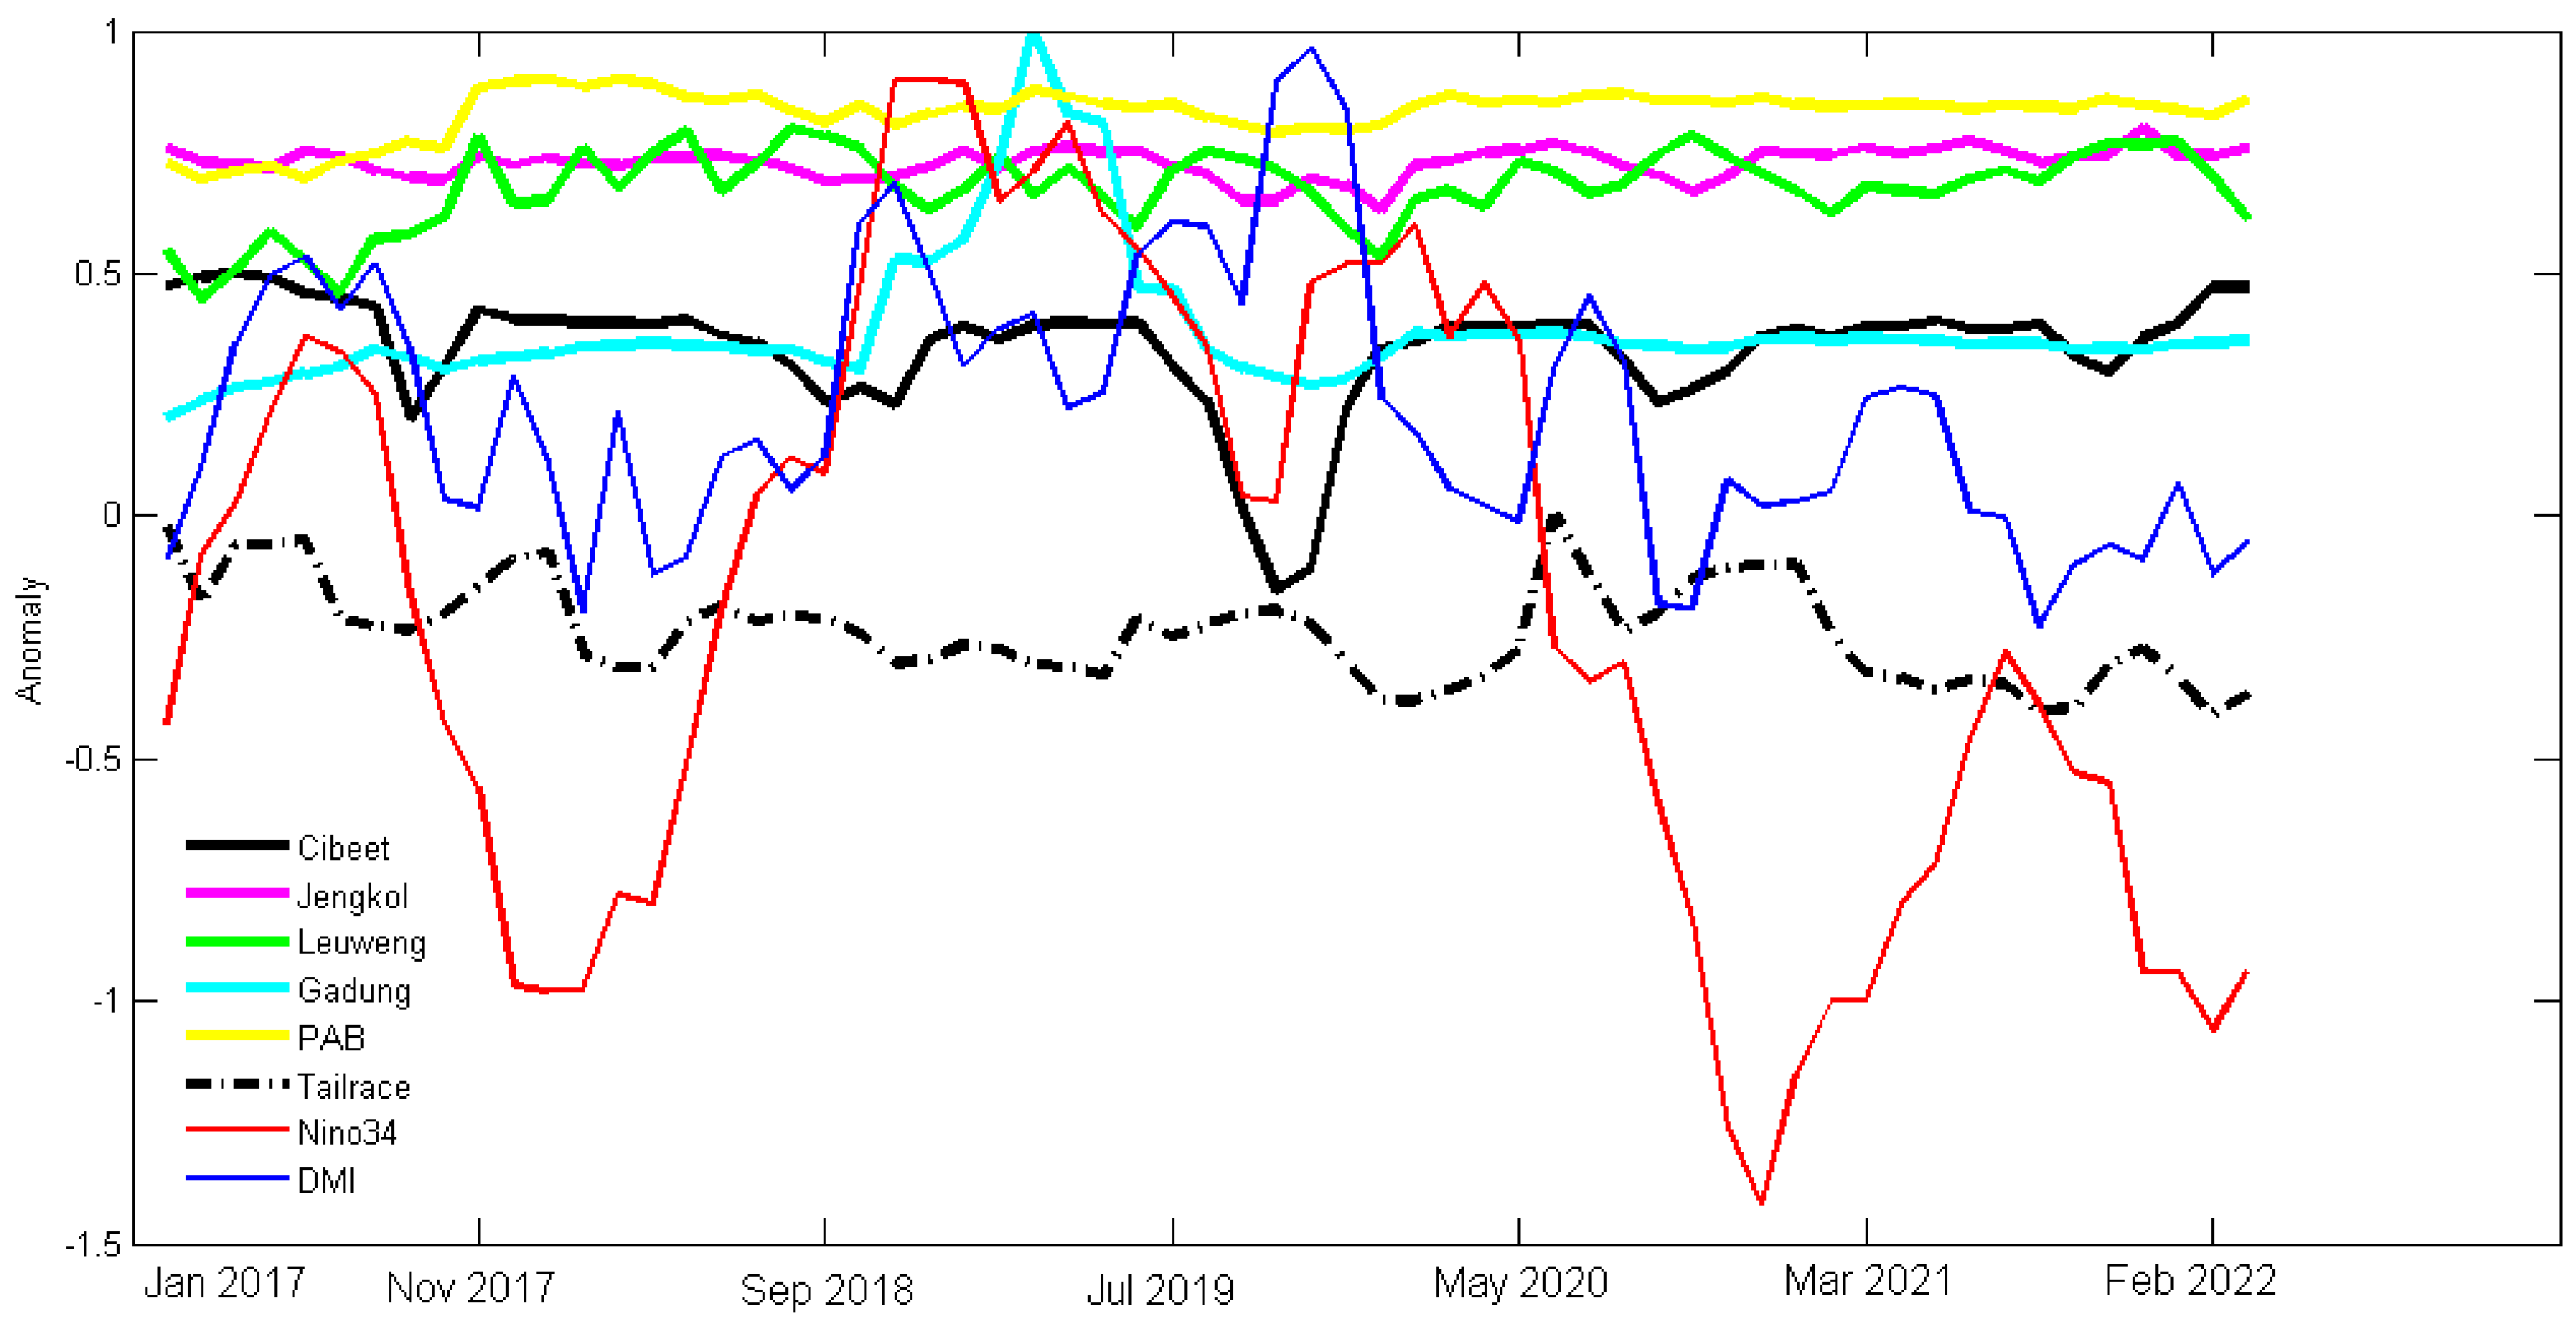
3.2. Water Resource Dynamics

Figure 13 shows the prediction employing a prophet forecasting method.
The correlation between the models and the observations had an R-squared value of over 50%. The Cibeet Weir had an 88% correlation between the model and the prediction, indicating that the water level was likely to decrease. Meanwhile, the Ciasem River had a 91% correlation, showing a monsoon pattern, a rising water level in the rainy season, and a decreasing water level in the dry season. The same case occurred at the Cigadung River in that the forecasting showed the same patterns as the measurements when the correlation was 80%. The predicted water level behavior at the Cisomang River generally had the same pattern as that of the measurement data, with an 83% R-squared value. The Gadung Weir had an 81% correlation with a monsoonal water level pattern in the future. It was predicted that the water level in the Leuweung Weir, which had an 89% correlation, would increase in the future, while it was predicted that the water level of the PAB River, which had a 97% correlation, would remain constant. Moreover, in the Tailrace, which had a 58% confidence level, it was predicted that the water level would tend to decrease.
In this study, we estimated the water resources by calculating the recharge GWL estimated from the rainfall. The latest study conducted by Suryanta et al., 2022 [36] shows that the absorption capacity of rainwater in the Citarum watershed has a high and very high dominance, so recharge calculations with rainfall are acceptable. Figure 14 depicts the results and the forecasting.
The water level in the upstream areas, such as the Cisomang River and Ciasem River, tended to rise in the rainy and the dry seasons, but in the Tailrace (the Jatiluhur Dam), as well as in the Cigadung River, the water level had a downward trend in both of the seasons (see Figure 15). In general, for the low-lying areas, the water level tended to rise in the rainy season and tended to decrease in the dry season, except for the water level in areas near an urban area such as Siphon, Leuweung, and PAB, which tended to rise in both of the seasons. In these stations, especially the PAB River, the water obtained from the Jatiluhur reservoir, channeled to Jakarta for water drinking, was close to an urban area. This increasing water level was probably due to the increasing demand for water in Jakarta (PJT2 2020). The conditions from 2017 to 2019 were normal, while the La Nina phase occurred in 2020 and 2021, resulting in intense rainfall in the Citarum watershed, thus increasing the water level. Several studies on the projections of climate change in various watersheds revealed that it affected them in that more frequent droughts and floods were marked by an increase in temperature and precipitation [37]. The water level in the Jatiluhur reservoir (Tailrace) tended to decrease, indicating that the Citarum watershed was vulnerable to climate change. The most vulnerable areas were those in the lowlands, for they indicated a downward trend in the water level.
To enhance our understanding of trend analysis, we utilize the cumulative distribution function (CDF) to analyze the distribution behavior of linearly trended data. This approach has been effectively applied in rainwater harvesting system studies [38]. In the upstream region, the CDF profile is wider with a longer tail towards the right, indicating a higher probability of obtaining extreme values or outliers, as observed in Tailrace (see Figure 16). This suggests that the data have greater variability or spread. Conversely, the downstream CDF curve appears straighter, indicating a more uniform distribution of data or smaller variability (see Figure 17). These findings indicate that the upstream area exhibits high variability and is more susceptible to changes, leading to non-linear trend analysis (see [39] for nonlinear fitting).
In this paper, we try to look at the dynamics of watersheds based on three key parameters: surface water level, rainfall, and groundwater recharge (GR). We measure the water level generally in rivers or weirs, which means we see patterns between the rise and drop of the river water table and the rise and drop of the GR. Problems become complicated if a watershed consists of many rivers (groundwater divides) because, in general, the GWL surface has a convex shape (asymmetrical) between the two rivers. Research in this direction has also received a lot of attention from previous researchers. For example, research conducted by Han et al. (2019) [40] shows a new type of inter-basin groundwater flow where the rivers directly exchange water even when a divide has developed between them. In the Oak Creek Watershed (OCW) geographic area, the relationship between surface water and groundwater shows a prominent increase in conditions in the upstream region and does not decrease in the valley due to seepage from agricultural irrigation [41].
With so many rivers in the Citarum watershed, the groundwater divides become complex, so discussing them one by one takes a lot of time. Instead, to obtain a general picture, we look at the behavior of the water table and GR relations for the average Citarum watershed area. We have shown above that the water level and GR have a similar pattern and time lag several months between the peak of the water level and GR (see Figure 18a). The cross-correlation between the water level and GR occurs around 0.7 for water level vs. GR. It is depicted in Figure 18b. For a rough approach, the water table and GR have an empirical relationship GR = 0.21 × WL − 2.7, which shows that the relationship between the water level and GR is linear. Of course, this is a very rough approach due to the fact that we only use about three years of data and a monthly average.
Investigating the estimated GWL recharge with the rainfall data and the land cover will be our priority in future research. Nevertheless, the upstream and the downstream water levels and the GWL recharge generally had a declining trend. This indicated that the Citarum watershed tended to deplete its water resources. This may be vulnerable to climate change in the near future. Climate change is believed to significantly influence the temporal patterns and quantities of annual rainfall at the regional level, affecting water resources and water availability in the future ([42,43,44]). The effects of climate change on water resources have been demonstrated by decreased rainfall in the basin while the temperature increases in the Bandama Basin [45]. There is also a decrease in the static water level that cannot be the only factor because of the influence of temperature and precipitation. In other words, monitoring various surface parameters, such as the water level and the rainfall, can provide us with an overview of the water availability in the Citarum watershed in the future.

4. Conclusions

The complex interaction of water above ground and below ground is a key parameter for understanding the hydrological cycle. In this paper, we try to look at the interactions by looking at the pattern in a time series. Our study has shown a significant correlation between GSMap and rainfall parameters obtained from rain gauges and water level measurements, especially in the upstream regions. We found that areas located near mountains receive higher amounts of rainfall compared to the lowlands situated in coastal regions. The water level spectrum pattern follows a monsoonal cycle in almost all observation points, except for the Lauweng Weir, which is the confluence of two rivers, and the PAB channel, which is the artificial river. In the upstream regions, water levels are inclined to ascend during the La Niña phase and decline during the El Niño and positive phase of IOD. Conversely, the downstream area appears to be unaffected by the El Niño, La Niña, or IOD phenomena, particularly for the PAB channel. The Citarum watershed has the highest annual average values of rainfall that occur in the western and eastern side areas, with a value of 4000 mm/year, and the minimum value of 1200 mm occurred in 2018–2019 (weak El Nino). Our analysis using machine learning methods indicates a decreasing trend in water level estimates for all stations, as well as estimates of groundwater recharging. We have demonstrated that the upstream region exhibits high variability, while the downstream region shows low variability based on our analysis with CDF. Finally, we obtained an empirical relationship between groundwater recharging and surface water level. This shows that the monitoring of various surface parameters, such as the water level and the rainfall, can provide us with an overview of the water availability in the Citarum watershed in the future.

Author Contributions

A.S. (Armi Susandi), conceptual development, paper preparation; A.D., statistical data processing and analysis; A.S. (Albertus Sulaiman), spectrum analysis, wrote the paper; M.D.R.D., data acquisition, field work; A.R.W., machine learning data processing; A.R., water level analysis; A.S. (Agus Salim), climate analysis; R.R.D., GSmaps data processing; and A.F.P., meteorological data analysis. All authors have read and agreed to the published version of the manuscript.

Funding

This research received no external funding.

Data Availability Statement

The data can be obtained by request.

Acknowledgments

We would like to thank Shigenaga from Midori Engineering who provided the data acquisition, and H. Tahakashi for their valuable input.

Conflicts of Interest

The authors declare no conflicts of interest.

References

  1. Hamada, J.-I.; Mori, S.; Kubota, H.; Yamanaka, M.D.; Haryoko, U.; Lestari, S.; Sulistyowati, R.; Syamsudin, F. Interannual rainfall variability over northwestern Java and its relation to the Indian Ocean dipole and El Niño southern oscillation events. Sola 2012, 8, 69–72. [Google Scholar] [CrossRef]
  2. Yamanaka, M.D.; Ogino, S.-Y.; Wu, P.-M.; Hamada, J.-I.; Mori, S.; Matsumoto, J.; Syamsudin, F. Maritime continent coastlines controlling Earth’s climate. Prog. Earth Planet. Sci. 2018, 5, 21–49. [Google Scholar] [CrossRef]
  3. Yamanaka, M.D. Physical climatology of Indonesian maritime continent: An outline to comprehend observational studies. Atmos. Res. 2016, 178, 231–259. [Google Scholar] [CrossRef]
  4. Boer, R.; Dasanto, B.D.; Perdinan, M. Climate Change and the Sustainable Use of Water Resources, Climate Change Management; Filho, W.L., Ed.; Springer: Berlin/Heidelberg, Germany, 2012. [Google Scholar] [CrossRef]
  5. Dimyati, M.; Rustanto, A.; Shiddiq, I.P.A.; Indratmoko, S.; Siswanto; Dimyati, R.D.; Nurlambang, T.; Zubair, A.; Fakhruddin, A.; Siddiq, A.; et al. Spatiotemporal relation of satellite-based meteorological to agricultural drought in the downstream Citarum watershed, Indonesia. Environ. Sustain. Indic. 2024, 22, 100339. [Google Scholar] [CrossRef]
  6. Muller, M. Dams have the power to slow climate change, (comment). Nature 2019, 566, 315–317. [Google Scholar] [CrossRef] [PubMed]
  7. Liersch, S.; Koch, H.; Hattermann, F.F. Management Scenarios of the Grand Ethiopian Renaissance Dam and Their Impacts under Recent and Future Climates. Water 2017, 9, 728–741. [Google Scholar] [CrossRef]
  8. Kazemi, H.; Sarukkalige, R.; Shao, Q. Evaluation of non-uniform groundwater level data using spatiotemporal modeling. Groundw. Sustain. Dev. 2021, 15, 100659. [Google Scholar] [CrossRef]
  9. Raj, A.S.; Oliver, D.H.; Srinivas, Y.; Viswanath, J. Wavelet based analysis on rainfall and water table depth forecasting using Neural Networks in Kanyakumari district, Tamil Nadu, India. Groundw. Sustain. Dev. 2017, 5, 178–186. [Google Scholar]
  10. Rivett, M.O.; Miller, A.V.M.; MacAllister, D.J.; Fallas, A.; Wanang, G.J.; Mleta, P.; Phiri, P.; Mannix, N.; Monjerezi, M.; Kalin, R.M. A conceptual model based framework for pragmatic groundwater-quality monitoring network design in the developing world: Application to the Chikwawa District, Malawi. Groundw. Sustain. Dev. 2018, 6, 213–226. [Google Scholar] [CrossRef]
  11. Patil, N.S.; Chetan, N.L.; Nataraja, M.; Suthar, S. Climate change scenarios and its effect on groundwater level in the Hiranyakeshi watershed. Groundw. Sustain. Dev. 2020, 10, 100323. [Google Scholar] [CrossRef]
  12. Hossain, M.Z.; Nikam, B.R.; Srivastav, S.K.; Gupta, P.K. Estimating groundwater resource and understanding recharge processes in the rapidly urbanizing Dhaka City, Bangladesh. Groundw. Sustain. Dev. 2021, 12, 100514. [Google Scholar] [CrossRef]
  13. Andualem, T.G.; Demeke, G.G.; Ahmed, I.; Dar, M.A.; Yibeltal, M. Groundwater recharge estimation using empirical methods from rainfall and streamflow records. J. Hydrol. Reg. Stud. 2021, 37, 100917. [Google Scholar] [CrossRef]
  14. Boer, R.; Rakhman, A.; Pulhin, J.; Schuster, S. Methodology for assessing vulnerability and climate risk of villages in Citarum Watershed, West Java, Indonesia. IOP Conf. Ser. Earth Environ. 2019, 363, 012007. [Google Scholar] [CrossRef]
  15. Rusli, S.R.; Weerts, A.H.; Taufiq, A.; Bense, V.F. Estimating water balance components and their uncertainty bounds in highly groundwater-dependent and data-scarce area: An example for the Upper Citarum basin. J. Hydrol. Reg. Stud. 2021, 37, 100911. [Google Scholar] [CrossRef]
  16. Liu, J.; Deng, J.; Chai, Y.; Yang, Y.; Zhu, B.; Li, S. Variation of the Water Level in the Yangtze River in Response to Natural and Anthropogenic Changes. Water 2019, 11, 2594–2612. [Google Scholar] [CrossRef]
  17. Fan, Z.; Wang, Z.; Li, Y.; Wang, W.; Tang, C.; Zeng, F. Water Level Fluctuation under the Impact of Lake Regulation and Ecological Implication in Huayang Lakes, China. Water 2020, 12, 702–725. [Google Scholar] [CrossRef]
  18. Rani, M.; Pande, A.; Kumar, K.; Joshi, H.; Rawat, D.S.; Kumar, D. Investigation of groundwater recharge prospect and hydrological response of groundwater augmentation measure in Upper Kosi watershed, Kumaun Himalaya, India. Groundw. Sustain. Dev. 2022, 16, 1000720. [Google Scholar] [CrossRef]
  19. Hou, A.Y.; Kakar, R.K.; Neeck, S.; Azarbarzin, A.A.; Kummerow, C.d.; Kojima, M.; Oki, R.; Nakamura, K.; Iguchi, T. The Global Precipitation Measurement Mission. Bull. Am. Meteorol. Soc. 2014, 95, 701–722. [Google Scholar] [CrossRef]
  20. Ushio, T.; Sasashige, K.; Kubota, T.; Shige, S.; Okamoto, K.; Aonashi, K.; Inoue, T.; Takahashi, N.; Iguchi, T.; Kachi, M.; et al. A Kalman Filter Approach to the Global Satellite Mapping of Precipitation (GSMaP) from Combined Passive Microwave and Infrared Radiometric Data. J. Meteorol. Soc. Jpn. 2009, 87A, 137–151. [Google Scholar] [CrossRef]
  21. Adekele, O.O.; Makinde, V.; Eruola, A.O.; Dada, O.F.; Ojo, A.O.; Aluko, T.J. Estimation of Groundwater Recharges Using Empirical Formulae in Odeda Local Government Area, Ogun State, Nigeria. Challenges 2015, 6, 271–281. [Google Scholar] [CrossRef]
  22. Islam, S.; Singh, R.K.; Khan, R.A. Methods of Estimating Groundwater Recharge. Int. J. Eng. Assoc. 2015, 5, 6–9. [Google Scholar]
  23. Bloomfield, P. Fourier Analysis of Time Series, 2nd ed.; John Wiley and Son: New York, NY, USA, 2000. [Google Scholar]
  24. Aguilera, H.; Guardiola-Albert, C.; Naranjo-Fernández, N.; Kohfahl, C. Towards flexible groundwater-level prediction for adaptive water management: Using Facebook’s Prophet forecasting approach. Hydrol. Sci. J. 2019, 64, 1504–1518. [Google Scholar] [CrossRef]
  25. Awasthi, N.; Tripathi, J.N.; Petropoulos, G.P.; Kumar, P.; Singh, A.K.; Dakhore, K.K.; Ghosh, K.; Gupta, D.K.; Srivastava, P.K.; Kalogeropoulos, K.; et al. Long-Term Spatiotemporal Investigation of Various Rainfall Intensities over Central India Using EO Datasets. Hydrology 2024, 11, 27. [Google Scholar] [CrossRef]
  26. Raghunath, H.M. Hydrology: Principles, Analysis, Design, 2nd ed.; New Age Int Limited: New Delhi, India, 2006. [Google Scholar]
  27. Fatkhuroyan, W.T.; Sukmana, A.; Kurniawan, R. Validation of Satellite Daily Rainfall Estimates Over Indonesia. Forum Geogr. 2018, 32, 2–13. [Google Scholar] [CrossRef]
  28. Sofiati, I.; Avia, L.Q. Analysis of Rainfall Data based on GSMaP and TRMM towards Observations Data in Yogyakarta. IOP Conf. Ser. Earth Environ. Sci. 2018, 166, 012031. [Google Scholar] [CrossRef]
  29. Priyambodoho, B.A.; Kure, S.; Yagi, R.; Januriyadi, N.F. Flood inundation simulations based on GSMaP data rainfall data in Jakarta, Indonesia. Prog. Earth Planet Sci. 2021, 8, 34. [Google Scholar] [CrossRef]
  30. Fu, Q.; Ruan, R.; Liu, Y. Accuracy Assessment of Global Satellite Mapping of Precipitation (GSMaP) Product over Poyang Lake Basin, China. Procedia Environ. Sci. 2011, 10, 2265–2271. [Google Scholar] [CrossRef]
  31. Yamamoto, K.; Sayama, T. Apip Impact of climate change on flood inundation in a tropical watershed in Indonesia. Prog. Earth Planet. Sci. 2021, 8, 5–13. [Google Scholar] [CrossRef]
  32. Van Gaalen, J.; Kruse, S.; Lafrenz, W.; Burroughs, S. Predicting water table response to rainfall events. Cent. Fla. Groundw. 2013, 51, 350–362. [Google Scholar] [CrossRef]
  33. Zhang, M.; Chen, Y.; Shen, Y.; Li, Y. Changes of precipitation extremes in arid Central Asia. Quat. Int. 2017, 436, 16–27. [Google Scholar] [CrossRef]
  34. Hidayat, R. Modulation of Indonesian Rainfall Variability by the Madden-Julian Oscillation. Procedia Environ. Sci. 2016, 33, 167–177. [Google Scholar] [CrossRef]
  35. Hidayat, R.; Kizu, S. Influence of the MaddenJulian Oscillation on Indonesian rainfall variability in austral summer. Int. J. Climatol. 2009, 30, 1816–1825. [Google Scholar] [CrossRef]
  36. Suryanta, J.; Nahib, I.; Turmudi, D.M.; Amhar, F.; Santikayasa, I.P.; Wahyudin, Y. Assessment of rainwater absorption zone in Citarum Watershed using GIS and AHP. IOP Conf. Ser. Earth Environ. Sci. 2022, 1109, 012055. [Google Scholar] [CrossRef]
  37. Ilbay-Yupa, M.; Ilbay, F.; Zubieta, R.; García-Mora, M.; Chasi, P. Impacts of Climate Change on the Precipitation and Streamflow Regimes in Equatorial Regions: Guayas Watershed. Water 2021, 13, 3138. [Google Scholar] [CrossRef]
  38. Di Chiano, M.G.; Marchioni, M.; Raimondi, A.; Sanfilippo, U.; Becciu, G. Probabilistic Approach to Tank Design in Rainwater Harvesting Systems. Hydrology 2023, 10, 59. [Google Scholar] [CrossRef]
  39. Zheng, Z.; Yan, Z.; Chen, J.; Han, J.; Xia, J.; Zhang, X.; Cai, S.; Liu, X. Evolving Threshold of Flood-Leading Precipitation in a User-Oriented Forecast System Based on the TIGGE Dataset. Front. Earth Sci. 2021, 9, 2021. [Google Scholar] [CrossRef]
  40. Han, P.F.; Wang, X.S.; Wan, L.; Jiang, X.W.; Hu, F.S. The exact groundwater divide on water table between two rivers: A fundamental model investigation. Water 2019, 11, 685. [Google Scholar] [CrossRef]
  41. Ochoa, C.G.; Jarvis, W.T.; Hall, J. A Hydrogeologic Framework for Understanding Surface Water and Groundwater Interactions in a Watershed System in the Willamette Basin in Western Oregon, USA. Geosciences 2022, 12, 109. [Google Scholar] [CrossRef]
  42. Abaurrea, J.; Asin, J.; Cebrian, A.C. Trend analysis of water quality series based on regression models with correlated errors. J. Hydrol. 2011, 400, 341–352. [Google Scholar] [CrossRef]
  43. Irwandi, H.; Rosid, M.S.; Mart, T. The effects of ENSO, climate change and human activities on the water level of Lake Toba, Indonesia: A critical literature review. Geosci. Lett. 2021, 8, 21. [Google Scholar] [CrossRef]
  44. Saha, G.C. Climate Change Induced Precipitation Effects on Water Resources in the Peace Region of British Columbia, Canada. Climate 2015, 3, 264–282. [Google Scholar] [CrossRef]
  45. Kouakou, E.; Koné, B.; N’Go, A.; Cissé, G.; Speranza, C.I. Ground water sensitivity to climate variability in the white Bandama basin, Ivory Coast. SpringerPlus 2014, 3, 226. [Google Scholar] [CrossRef] [PubMed]
Figure 1. The study area is the Citarum watershed in the North part of West Java province, Indonesia.
Hydrology 11 00073 g001
Figure 2. SESAME instruments installed at (a) Cigadung Weir, (b) Jengkol Weir, (c) Cibeet Weir, and (d) Leuweung Weir.
Hydrology 11 00073 g002
Figure 3. Correlation rainfall between GSMaP and rain gauge instrument data.
Hydrology 11 00073 g003
Figure 4. Correlation between GSMaP rainfall and water level.
Hydrology 11 00073 g004
Figure 5. Correlation between rainfall from rain gauge and water level.
Hydrology 11 00073 g005
Figure 6. Isohyet map of the Citarum watershed from 2017 to 2021 based on GSMaP data. The upstream area is in the south and the downstream area in the north.
Hydrology 11 00073 g006
Figure 7. The spectrum of water levels in the Citarum watershed is analyzed using normalized power spectrum amplitudes. Notably, we have observed distinct spectrum patterns at two specific locations: (g) Leuweng Weir, the confluence of two rivers; and (h) PAB Channel, an artificial river constructed to transport drinking water from the Jatiluhur reservoir to Jakarta. In-depth explanation and analysis of these observations are provided in the main text.
Hydrology 11 00073 g007
Figure 8. (a) A low-pass filter of water level and rainfall was obtained from a rain gauge instrument and GSMaP data at Cisomang River, (b) a low-pass filter of water level and rainfall obtained from a rain gauge instrument and GSMaP data at Ciasem River, and (c) a low-pass filter of water level and rainfall was obtained from a rain gauge instrument and GSMaP data at Tailrace.
Hydrology 11 00073 g008
Figure 9. Time series of Nino 3.4., DMI, and water level of Ciasem River, Cisomang River, and Ciqadung River. Anomaly of water level in meter and anomaly of Nino 3.4. and DMI in °C.
Hydrology 11 00073 g009
Figure 10. (a) A low-pass filter of water level and rainfall was obtained from a rain gauge instrument and GSMaP data in Cibeet Weir, (b) a low-pass filter of water level and rainfall was obtained from the rain gauge instrument and GSMaP data at Cigadung River, (c) a low-pass filter of water level and rainfall was obtained from a rain gauge instrument and GSMaP data at Gadung Weir, and (d) a low-pass filter of water level and rainfall was obtained from GSMaP data at Jengkol Weir.
Hydrology 11 00073 g010aHydrology 11 00073 g010b
Figure 11. (a) A low-pass filter of water level and rainfall was obtained from GSMaP data at Leuweung Weir, (b) a low-pass filter of water level and rainfall was obtained from a rain gauge instrument and GSMaP data at PAB River, and (c) a low-pass filter of water level and rainfall was obtained from GSMaP data at Siphon Cibeet.
Hydrology 11 00073 g011
Figure 12. Time series of Nino 3.4., DMI, and water level of Cibeet Weir (black), Jengkol Weir (magenta), Leuweng Weir (green), Gadung Weir (canyon), PAB channel (yellow), and Tailrace (dot black). Anomaly of water level in meter and anomaly of Nino 3.4. and DMI in °C.
Hydrology 11 00073 g012
Figure 13. Prediction of water level based on data-driven method at Citarum watershed. The green dot is the data, and the red line is the prediction with training data and verification 75%:25%.
Hydrology 11 00073 g013
Figure 14. Prediction of GWL recharging based on data-driven method at Citarum watershed. Black represents training data, blue represents validation, and yellow represents testing; the blue curve is firm as the prediction, while the area of the curve is the deviation of the estimation error.
Hydrology 11 00073 g014aHydrology 11 00073 g014b
Figure 15. Trend analysis of water level at Citarum watershed. The green dot is the wet season, and the red dot is the dry season.
Hydrology 11 00073 g015
Figure 16. Cumulative distribution function (CDF) of water level at upstream region. Upper section is the water level, the lower section is the CDF. Red color is the Ciasem river, blue color is the Cisomang river and the black colour is the Tailrace.
Hydrology 11 00073 g016
Figure 17. Cumulative distribution function (CDF) of water level at downstream region. Upper section is the water level, the lower section is the CDF. Red colour is the Cibeet Weir, Blue color is the Jengkol Weir, Black colour is the Leuweung Weir and Green colour is the PAB channal.
Hydrology 11 00073 g017
Figure 18. (a) The monthly time series of water level and GR at the Citarum watershed; (b) cross correlation and empirical relationship between water level monitoring and GR (y = 0.21x − 2.7).
Hydrology 11 00073 g018
Table 1. Adjustment of GSMaP_NRT data to the location of the SESAME rain gauges.
No.StationsLatitudeLongitude
SESAMEGSMaP_NRTSESAMEGSMaP_NRT
1Cisomang River−6.6924541−6.65107.418107.45
2Ciasem River−6.2494061−6.25106.9326106.95
3Tailrace−6.5210651−6.55107.3893107.35
4Cibeet Weir−6.3910927−6.35107.2209107.25
5Siphon Cibeet−6.3462995−6.35107.2273107.25
6LeuweungWeir−6.3380958−6.35107.3651107.35
7Jengkol Weir−6.3541052−6.35107.6628107.65
8PAB River−6.6241547−6.65107.6747107.65
9Gadung Weir−6.3955554−6.35107.8273107.85
10Cigadung River−6.4328435−6.45107.8265107.85
Disclaimer/Publisher’s Note: The statements, opinions and data contained in all publications are solely those of the individual author(s) and contributor(s) and not of MDPI and/or the editor(s). MDPI and/or the editor(s) disclaim responsibility for any injury to people or property resulting from any ideas, methods, instructions or products referred to in the content.

