Article

Temporal Dynamics and Integrative Characterization of Streptococcus uberis Biofilm Development

by
Melina Vanesa Moliva
1,
María Florencia Cerioli
1,
Ignacio Velzi
2,
María Alejandra Molina
2,
Carina Maricel Pereyra
3,
Ayelen Nigra
1,
Andrea Lorena Cristofolini
4,
Cecilia Inés Merkis
4,
Pablo Bogino
1 and
Elina Beatriz Reinoso
1,*
1
Institute of Environmental Biotechnology and Health (INBIAS-CONICET), Department of Microbiology and Immunology, National University of Río Cuarto, Route 36 Km 601, Río Cuarto X5804ZAB, Argentina
2
Institute of Research in Energy Technologies and Advanced Materials (IITEMA, CONICET-UNRC), Department of Chemistry, National University of Río Cuarto, Route 36 Km 601, Río Cuarto X5804ZAB, Argentina
3
Institute for Agroindustrial and Health Development (IDAS, CONICET-UNRC), Department of Microbiology and Immunology, National University of Río Cuarto, Route 36 Km 601, Río Cuarto X5804ZAB, Argentina
4
Faculty of Agronomy and Veterinary Medicine, National University of Río Cuarto, Route 36 Km 601, Río Cuarto X5804ZAB, Argentina
*
Author to whom correspondence should be addressed.
Bacteria 2026, 5(1), 6; https://doi.org/10.3390/bacteria5010006
Submission received: 30 October 2025 / Revised: 21 November 2025 / Accepted: 31 December 2025 / Published: 15 January 2026

Abstract

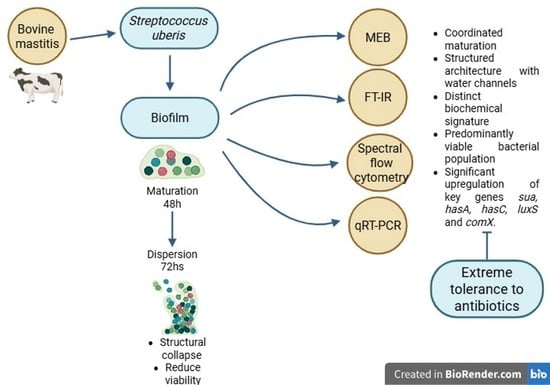
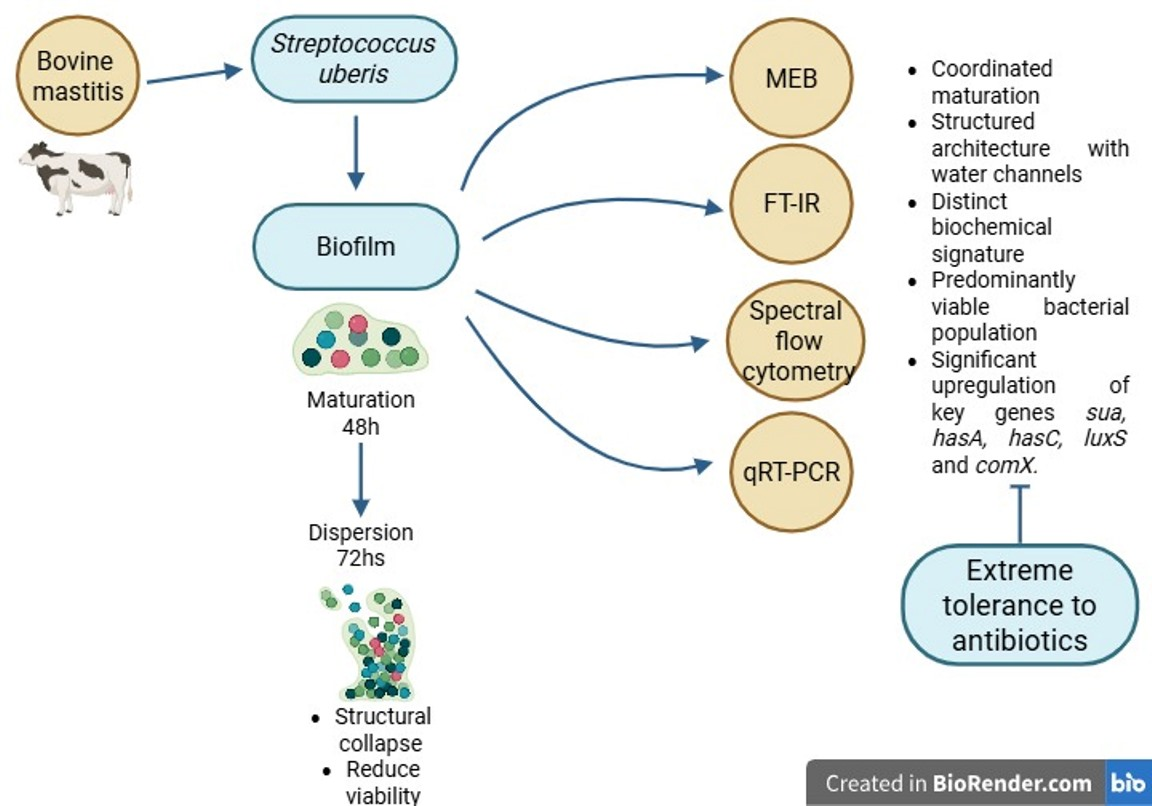
Streptococcus uberis is a bovine mastitis pathogen with a demonstrated ability to form biofilms. However, the dynamics of this process remain poorly characterized. This study aimed to comprehensively characterize biofilm formation in four S. uberis strains that differed in their biofilm-forming capacity, from weak to strong producers, and in the presence of key virulence-associated genes, such as sua, hasA and hasC. To achieve this, we integrated structural, biochemical, physiological and transcriptional analyses using scanning electron microscopy (SEM), Fourier-transform infrared spectroscopy (FT-IR), spectral flow cytometry and qRT-PCR. The multi-faceted analysis revealed a coordinated maturation peak at 48 h, characterized by a structured architecture with water channels, a distinct biochemical signature rich in polysaccharides and proteins, and a predominantly viable bacterial population. This peak coincided with a marked upregulation of key virulence-associated genes, with sua expression increasing 2.5-fold and hasA increasing 3-fold at 48 h. This mature biofilm conferred high tolerance to antibiotics, with eradication concentrations (>256 µg/mL) exceeding planktonic MICs, although tetracycline was notably effective. At 72 h, the biofilm entered a dispersion phase characterized by structural collapse and reduced viability. These findings establish S. uberis biofilm maturation as a highly coordinated process, providing new insights into the biofilm lifecycle of this important pathogen and identifying key temporal and molecular targets for future interventions.

Graphical Abstract

1. Introduction

Streptococcus uberis is a predominant environmental pathogen responsible for bovine mastitis, a disease with major economic implications for the dairy industry. While the implementation of mastitis control plans has successfully reduced the incidence of contagious pathogens, their effect on environmental streptococci like S. uberis has been limited, underscoring the need for novel control strategies [1,2].
A key virulence factor that complicates the treatment of many bacterial infections is biofilm formation. Different species of streptococci have been described to be able to form biofilm [3,4,5]. A biofilm develops when bacteria can adhere to a substrate or to cells embedded in a polymeric extracellular matrix [6] and is crucial in the antimicrobial resistance process [7]. Chronic mastitis cases often fail to respond to antibiotics due to biofilm-mediated tolerance [8]; therefore, defining S. uberis biofilm maturation and dispersal may help identify targets to reduce treatment failure.
The capacity of S. uberis to form biofilms in vitro is well-established; our previous work confirmed that biofilm formation initiates within 2–5 h of incubation, peaks at 48 h, and is strain-dependent [9]. In addition, we also identified a diverse genetic background among biofilm-forming isolates, including the presence of putative virulence genes such as sua (involved in adhesion and internalization) and the hasABC operon (responsible for hyaluronic acid capsule synthesis) [10].
However, little information is available about gene expression patterns involved in biofilm formation and the structure of S. uberis at different times. The functional dynamics of biofilm development in S. uberis, encompassing its structural evolution, biochemical composition, and the temporal gene expression patterns that drive it, are poorly understood. Genes associated with virulence (sua, hasA, hasC), quorum sensing (luxS), and genetic competence (comX) are hypothesized to play important, yet uncharacterized, roles in the biofilm lifecycle. Among virulence genes, sua is involved in adherence and internalization [11], and consequently, it could be implicated in biofilm formation. Similarly, the hasABC genes, responsible for producing hyaluronic acid capsules that confer resistance to phagocytosis [12], may also contribute to biofilm architecture. Furthermore, the expression dynamics of luxS and comX in S. uberis biofilms are entirely unexplored, despite their established involvement in biofilm regulation in other bacterial species [13]. There are no reports of either the expression of genes related to the detection of quorum sensing in S. uberis biofilm producers or the role of the luxS gene in this pathogen.
Therefore, a fragmented, single-method approach is insufficient to decipher the complex and multifactorial nature of biofilm development. To address this, we employed an integrated multi-methodological strategy to characterize biofilm formation in four S. uberis strains. This study synergistically combines structural analysis by scanning electron microscopy (SEM), biochemical profiling by Fourier-Transform Infrared Spectroscopy (FT-IR), assessment of physiological status by spectral flow cytometry, and evaluation of relative expression of key genes (sua, hasA, hasC, luxS, comX) by qRT-PCR at different growth stages under both planktonic and biofilm conditions. Furthermore, this multi-faceted characterization was integrated with an assessment of antimicrobial susceptibility, determining MBIC, MBEC, and planktonic MIC values. By correlating architecture, composition, viability, and gene regulation, this work provides an understanding of S. uberis biofilm pathogenesis, with the aim of identifying potential novel therapeutic targets for potential future therapeutic interventions.

2. Materials and Methods

2.1. Strains

Four S. uberis strains (SU319, SU216, SU50, and SU150) used in this study were selected as representative isolates from a larger collection previously characterized by our group [9]. This selection was based on their distinct and well-differentiated biofilm-forming phenotypes and their diverse genetic backgrounds. SU50 and SU150 are strong biofilm producers carrying hasA, whereas SU216 and SU319 are moderate producers with distinct hasA/hasC profiles (hasA/hasC and hasA/hasC+, respectively) (Table 1) [9,10]. All isolates were collected from bovine milk samples from cows with subclinical mastitis.

2.2. Growth Conditions

Planktonic growth conditions were performed with 0.1 mL of the bacterial cell suspension of each strain. Then, they were transferred to 10 mL of Tripticase Soy Broth (TSB) (Britania) supplemented with 0.25% of glucose and incubated at 37 °C during 24, 48 and 72 h with shaking. Biofilm growth conditions were carried out by microtiter plate assay according to [9], with minor modifications. Each strain was first grown overnight in 2 mL of CTS broth at 37 °C. The cultures were then adjusted to an OD600 equivalent to approximately 1 × 10⁶ CFU/mL and a 1:100 dilution was inoculated into sterile flat-bottom 96-well polystyrene microtiter plates. Plates were incubated under static conditions at 37 °C for 48 h to allow biofilm development.

2.3. Scanning Electron Microscopy

Biofilms were grown on 11 × 11 mm glass coverslips placed inside polystyrene flat-bottom 24-well microtiter plates. S. uberis strains were cultured in TSB and diluted 1:100 before incubation for 24, 48, or 72 h. After incubation, biofilms were gently washed twice with 100 μL PBS to remove planktonic cells. Samples were fixed with 2.5% glutaraldehyde for 3 h at 4 °C, dehydrated with graded ethanol at 10, 30, 50, 70 and 100% (v/v) and dried by critical point using a DCP-1 Critical Point Dryer (Denton Vacuum, Moorestown, NJ, USA). Samples were mounted on aluminum studs and examined by SEM x ray emission spectroscopy (SEM-EDS) using a FEI Quanta200 (Hillsboro, OR, USA).
To visualize topographical differences between early and mature biofilm regions, multiple fields of each sample were imaged at different magnifications. Images at 24, 48 and 72 h were captured from distinct areas of the same coverslip to reflect spatial heterogeneity typical of biofilm development.
In addition, samples were gold sputtered according to standard procedures and three-dimensional morphology was examined using a scanning electron microscopy (JEOL, JSM 6480 LV model, JEOL Ltd., Tokyo, Japan).

2.4. Fourier Transform Infrared Spectroscopy

Fourier Transform Infrared Spectroscopy (FT-IR) was used to compare the biochemical composition of S. uberis strains collected from biofilm and planktonic cultures at 24, 48, and 72 h. Spectra were recorded using potassium bromide (KBr) pellets in the 600–4000 cm−1 range with a resolution of 4 cm−1 on a PerkinElmer Spectrum Two spectrophotometer at room temperature. Baseline correction and vector normalization were applied across the full 600–4000 cm−1 range to minimize variations associated with sample preparation and cell density. Differential spectra were obtained by subtracting the normalized FT-IR spectra of planktonic cells from those of biofilm samples, thereby highlighting biochemical features enriched during biofilm development. Interpretation of the differential profiles was guided by characteristic vibrational bands corresponding to major biomolecular groups, including polysaccharides (900–1150 cm−1), proteins (1200–1700 cm−1), and lipids (2800–2970 cm−1).

2.5. Flow Cytometry Analysis of Cell Viability

Biofilm and planktonic cells were harvested at 24, 48, and 72 h, washed, and stained using a commercial viability kit based on SYTO9 and Propidium Iodide (PI) according to the manufacturer’s instructions [14]. Briefly, cells were resuspended in 500 µL of PBS and stained with a 1:1 mixture of SYTO9 and IP. The dyes were added to obtain final concentrations of 1 μM SYTO9 and 20 μM PI, followed by incubation in the dark for 15 min.
Samples were acquired on a spectral flow cytometer (Cytek Northern Lights™-CLC, Cytek Biosciences, Fremont, CA, USA) equipped with 405 nm, 488 nm, and 640 nm lasers, detecting 38 fluorescence channels and three light scatter channels (forward scatter-FSC and side scatter-SSC). A minimum of 100,000 events per sample were collected, maintaining an event abort rate below 10%. Spectral unmixing was performed using SpectroFlo® CLC software v3.2.1 (Cytek Biosciences, Fremont, CA, USA) to account for the inherent autofluorescence of each bacterial strain.
Data were analyzed in FlowJo V10 (FlowJo LLC, Ashland, OR, USA) using the following gating strategy: events were first gated on a FSC-H vs. FSC-A plot to select single cells, followed by gating on the bacterial population in a SSC-A vs. FSC-A plot. Finally, the fluorescence was analyzed on a plot of SYTO9 vs. PI to distinguish viable (SYTO9+/PI-), dead (PI+), and autofluorescent cell populations (SYTO9-/PI-). Statistical analysis was performed using GraphPad Prism version 9.0 (GraphPad Software).

2.6. Gene Expression Analysis

Total RNA was extracted from 24, 48 and 72 h from biofilm and planktonic cultures using TRIzolTM Reagent (InvitrogenTM, Dublin, Ireland) according to the manufacturer’s instructions. Sample integrity and protein contamination was evaluated by A260/280 ratio. For each sample, 1 µg of RNA was treated with DNaseI (Thermo Scientific, Vilnius, Lithuania) to eliminate possible DNA residues. Reverse transcription was performed with the High-Capacity cDNA Reverse Transcription Kit (Applied Biosystems™, Foster City, CA, USA) and RNase OUT Recombinant Ribonuclease inhibitor (Invitrogen, Thermo Fisher Scientific, Waltham, MA, USA) according to the manufacturer’s protocols.
Quantitative reverse transcription PCR (qRT-PCR) of sua, hasA/C, luxS and comX genes was performed using Brilliant III Ultra-Fast SYBR® Green QPCR Master Mix with Low ROX (Agilent Technologies, Santa Clara, CA, USA) and 2 µL of a 1/5 dilution of the resulting cDNAs. Reactions were performed in an Agilent Mx3000P equipment coupled with the MxPro™ QPCR 2007 Stratagene Software v4.10, (La Jolla, CA, USA). Thermal cycling conditions were: 3 min pre-denaturing at 95 °C, followed by 40 cycles at 95 °C for 5 s, 60 °C for 20 s. For dissociation curves, 1 cycle of 95 °C for 1 min, 55 °C for 30 s and 95 °C for 30 s was used. Standard curves from dilution series of pooled cDNAs were constructed for each gene and efficiency of qPCR reactions were calculated. Relative quantification of genes expression under biofilm growth was performed using planktonic growth as the calibration condition. The glyceraldehyde-3-phosphate dehydrogenase (gapC) and recA genes were evaluated as normalization genes, gapC gene and was selected since it displayed minimum variation in expression across all samples. The comparative threshold cycle method (2−ΔΔCt) [15] was used to calculate the fold changes in gene expression levels. Each sample was assayed in two independent assays by duplicated. Non-reverse-transcribed controls were also included in each experiment resulting in no detectable amplification. Table 2 shows the gene primer sequences used, amplicon sizes expected and references.

2.7. Antimicrobial Susceptibility and Biofilm Eradication Assays

2.7.1. Minimum Inhibitory Concentration Determination

The minimum inhibitory concentration (MIC) was determined against planktonic cells using the broth microdilution method according to CLSI guidelines, with modifications [20]. The following antibiotics were tested: ampicillin (AMP), erythromycin (EM), chloramphenicol (CHL), gentamicin (GEN), penicillin (PEN), and tetracycline (TET).
Briefly, bacterial suspensions in the exponential growth phase were adjusted to 1 × 10⁶ CFU/mL in Tryptic Soy Broth (TSB) and added to 96-well plates containing two-fold serial dilutions of each antibiotic (concentration range: 0.03125 to 64 µg/mL). Plates were incubated at 37 °C for 24 h. The MIC was defined as the lowest antibiotic concentration that completely inhibited visible growth.

2.7.2. Minimum Biofilm Inhibitory Concentration and Minimum Biofilm Eradication Concentration Assays

Biofilm susceptibility was assessed as previously described [21,22] with minor modifications. For the MBIC, antibiotics were added simultaneously with the bacterial inoculum (1 × 10⁶ CFU/mL) and biofilms were allowed to form for 24 h at 37 °C under static conditions. The MBIC was defined as the lowest concentration that inhibited ≥ 90% of biofilm formation compared to the antibiotic-free control.
For the MBEC, pre-formed 24 h biofilms were exposed to serial antibiotic dilutions for an additional 24 h. After treatment, biofilms were washed, fixed and stained with crystal violet. Then, the absorbance of retained dye was measured at 560 nm. Biofilm eradication was expressed as the percentage reduction in absorbance relative to untreated controls. The MBEC60 and MBEC80 were defined as the lowest concentrations achieving 60% and 80% biofilm eradication, respectively, as quantified by crystal violet staining [9].

2.8. Statistical Analysis

All data were analyzed with InfoStat software, version 2018 (UNC, Córdoba, Argentina). qRT-PCR values were expressed as mean ± standard error of the mean (SEM). Expression levels of genes assayed under different growth conditions and at different incubation times respect to the control were analyzed. One-way analysis of variance (ANOVA) and Tukey’s multiple comparison tests were used to evaluate the data. A statistically significant difference was considered with the value of p < 0.05. Charts were created with GraphPad Prism 5.

3. Results and Discussion

3.1. Biofilm Formation In Vitro by Scanning Electron Microscopy

S. uberis is an environmental pathogen involved in bovine mastitis. This bacterium can form biofilms in vitro, a trait that is widely recognized as a key virulence factor in other bacterial pathogens due to its contribution to antibiotic resistance and immune evasion.
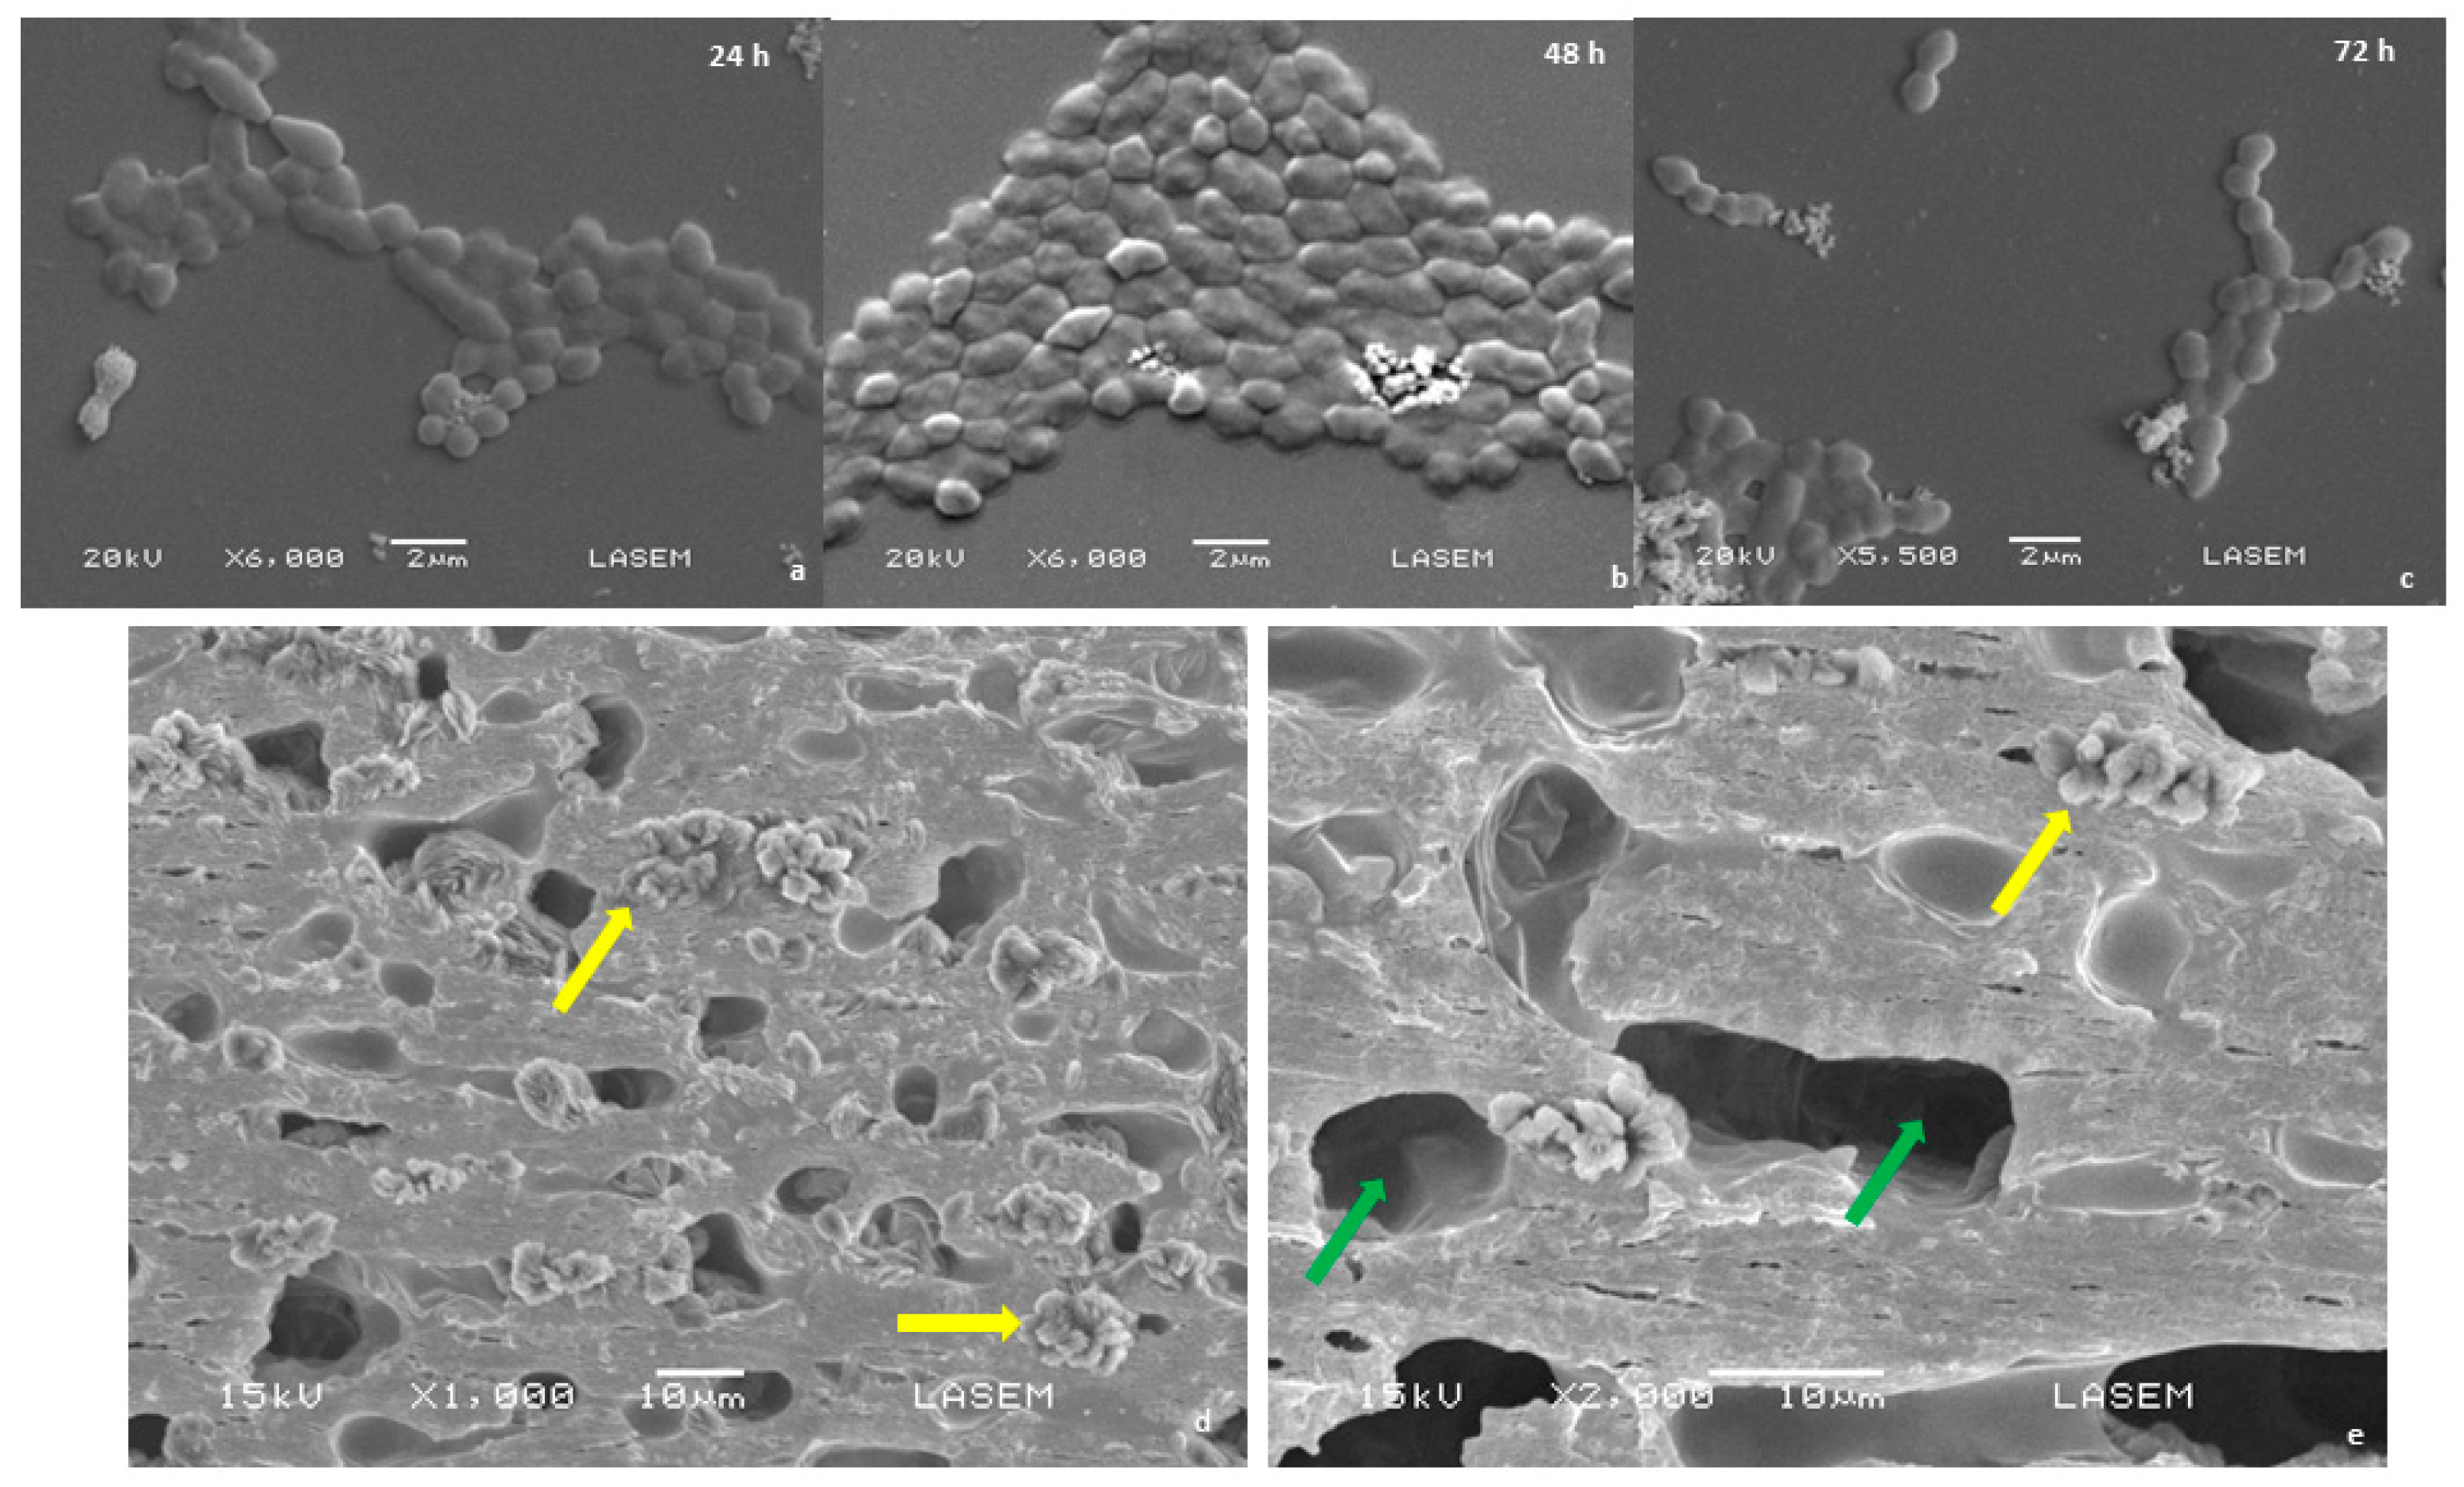
Scanning electron microscopy confirmed the ability of S. uberis to form structured biofilms on glass surfaces. In agreement with our previous quantitative analyses [9], which showed that biofilm development begins within the first 2 h and reaches its maximum at 48 h, SEM revealed clear temporal changes in biofilm architecture. At 24 h, cells were attached to the coverslip, forming small, discrete microcolonies characteristic of early-stage biofilm development (Figure 1a). By 48 h, a denser and more compact structure was observed, with abundant dividing cells and visible extracellular matrix material, consistent with a mature biofilm (Figure 1b). At 72 h, the biofilm displayed signs of structural collapse and cell dispersal, indicative of the late dispersion phase (Figure 1c).
To further resolve the three-dimensional architecture of these mature biofilms, three-dimensional SEM reconstruction at 48 h was employed. This analysis revealed complex structural features not apparent in conventional SEM, including multicellular aggregates and intricate networks of dark cavities and water channels traversing the biofilm substratum (Figure 1d,e).

3.2. Fourier Transform Infrared Spectroscopy Assay

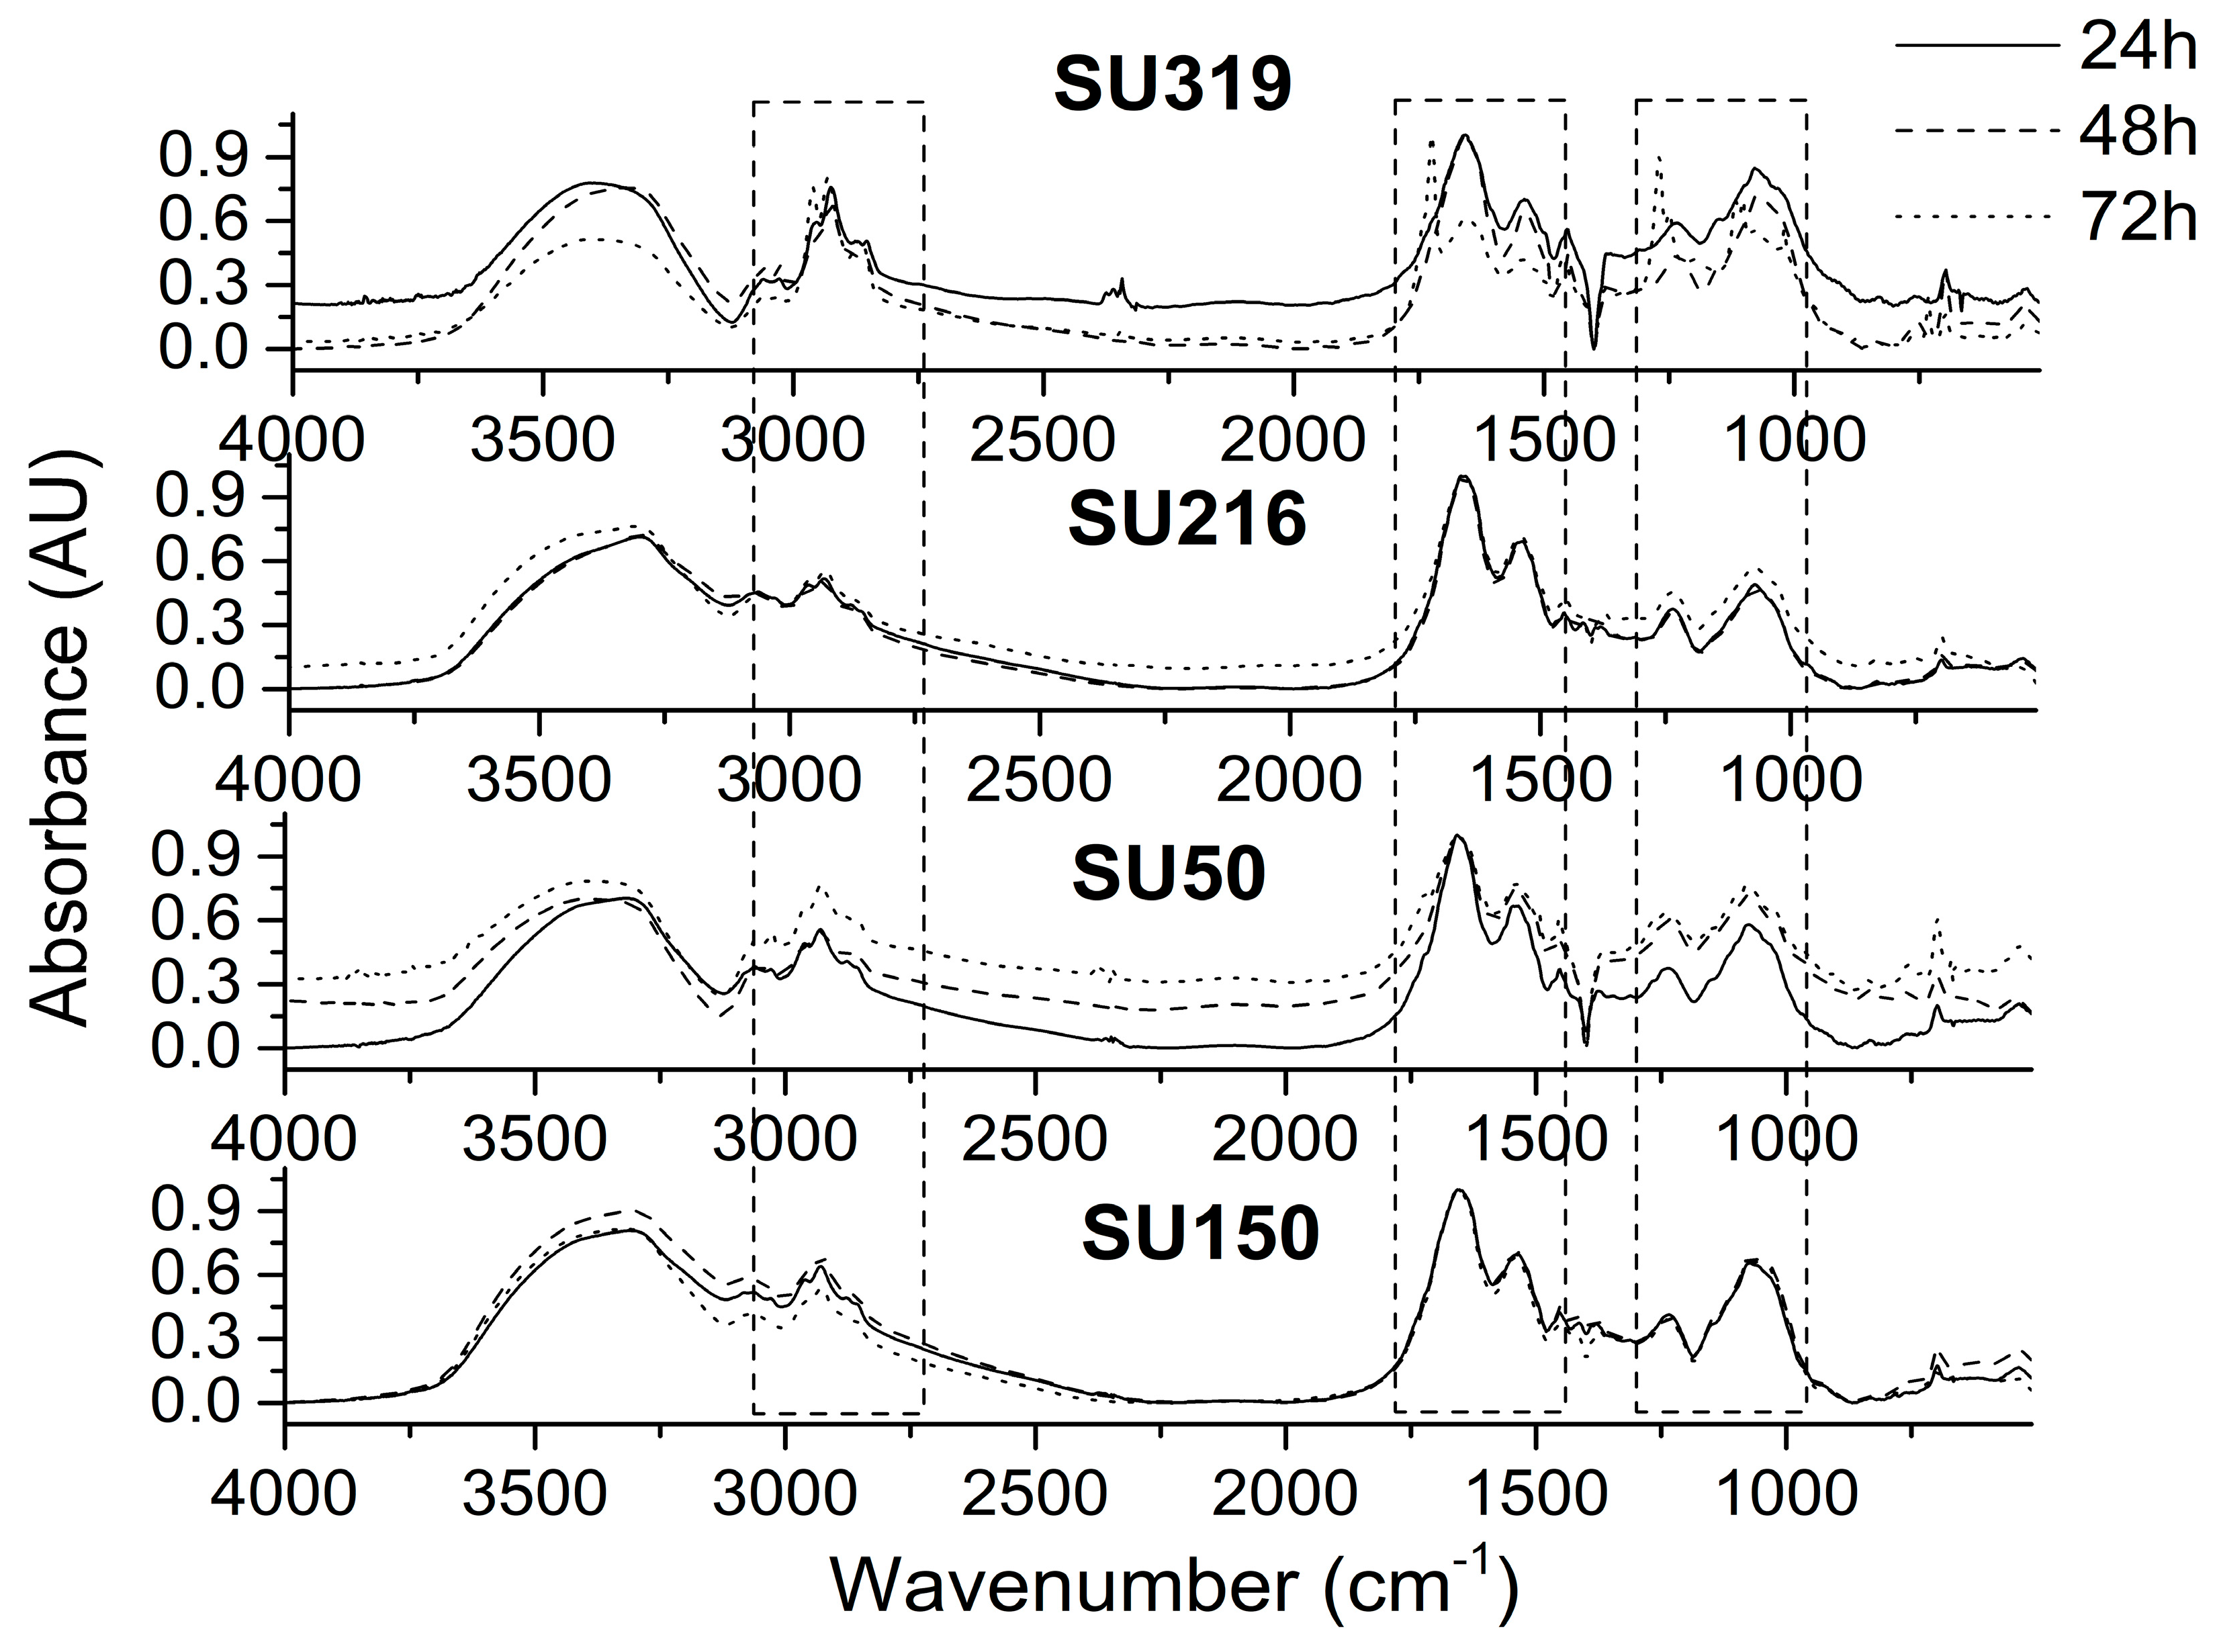
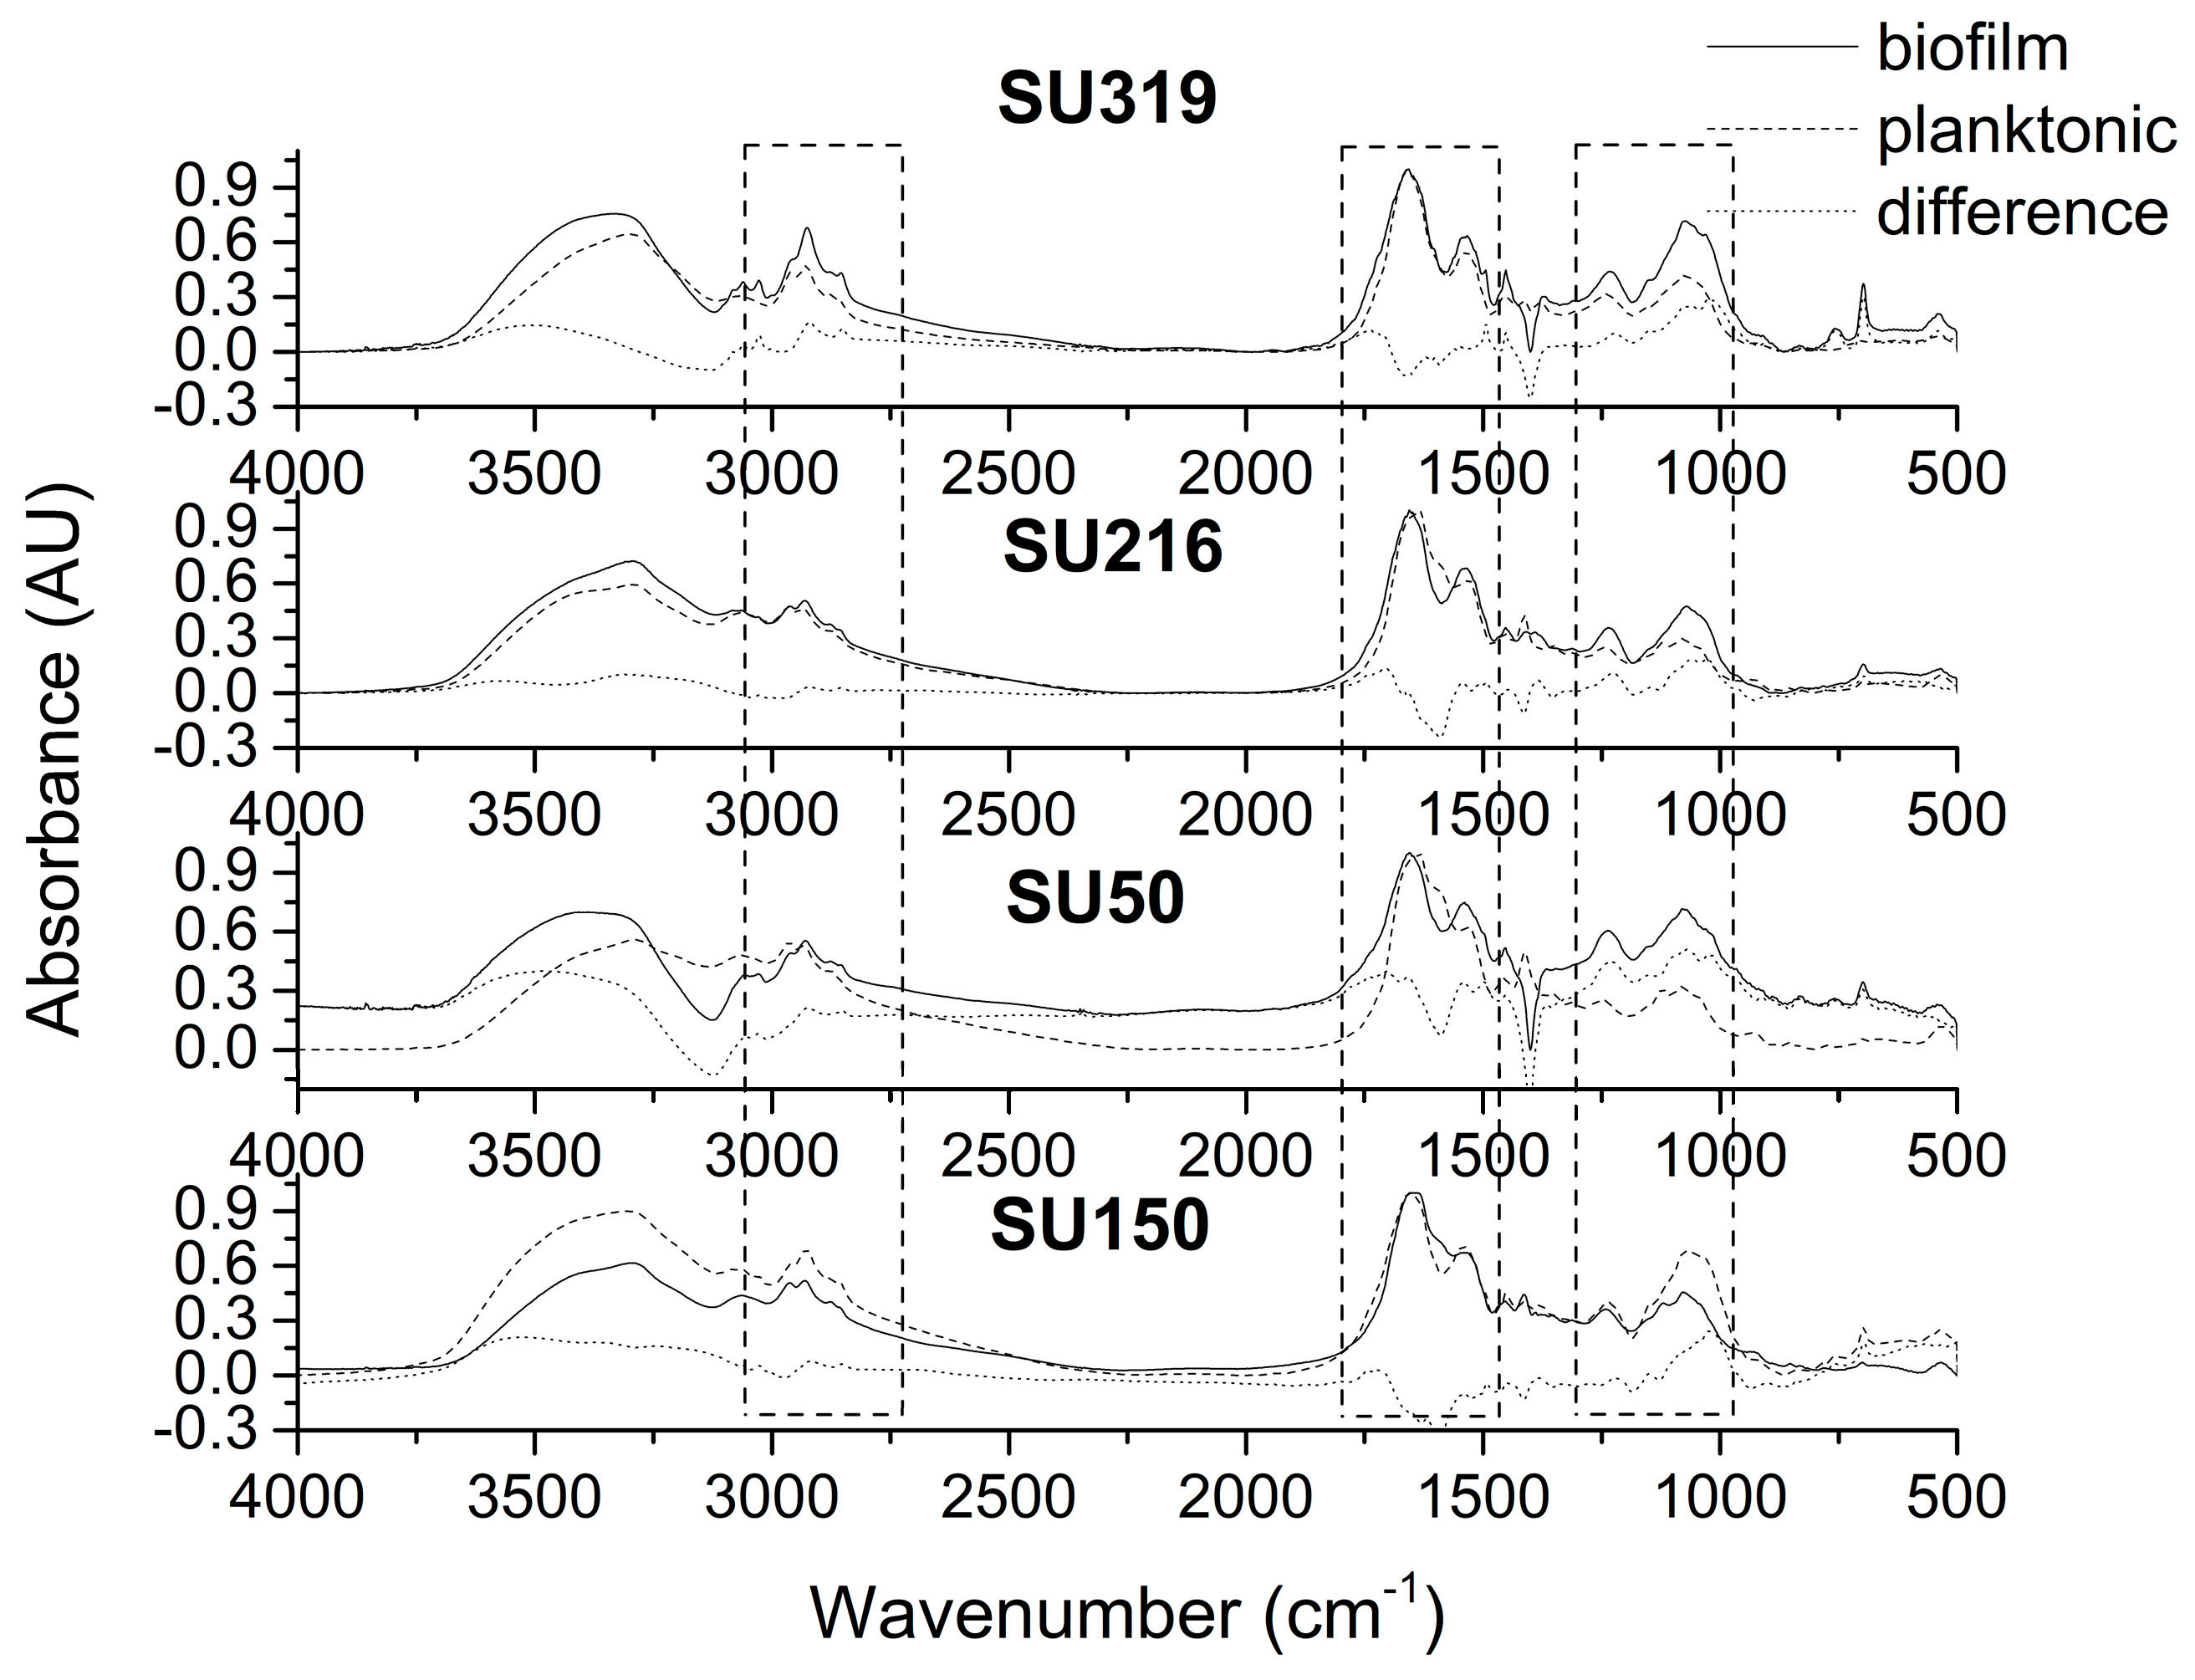
Having characterized the biofilm architecture by SEM, its biochemical composition was further analyzed using FT-IR. Spectra were acquired from 600 to 4000 cm−1, comparing biofilm samples against planktonic cultures at 24, 48, and 72 h. Temporal analysis revealed strain-specific accumulation patterns of key macromolecules (Figure 2). SU319 showed progressive increases in protein and lipid-associated peaks, particularly at 72 h. SU50 displayed a similar protein profile but lower lipid content. Notably, SU150 exhibited marked changes in protein composition, while SU216 was distinguished by intense peaks in the 1000–1200 cm−1 region, indicative of abundant polysaccharides.
Direct comparison between biofilm and planktonic cells at 48 h, the peak of biofilm maturation, confirmed these differences (Figure 3). Difference spectra revealed increased intensity in the 800–1100 cm−1 region (carbohydrate functional groups) in biofilms across all strains. Additionally, spectral shifts at ~1626 cm−1 and 1696 cm−1 suggested potential changes in protein secondary structure, possibly reflecting the production of specific biofilm-associated adhesins.
These FT-IR findings were consistent with the structural features observed by SEM. The biochemical complexity detected spectroscopically, particularly the polysaccharide signatures, correlates with the extensive extracellular matrix and the structured multicellular aggregates with potential water channels observed in SEM at 48 h. The temporal biochemical evolution revealed by FT-IR aligns with the biofilm maturation dynamics seen microscopically, where 48 h represented the peak of structural complexity before a decline in cellular integrity at 72 h.
FT-IR analysis revealed a complex and strain-specific biochemical composition in S. uberis biofilms. This application aligns with the recognized utility of FT-IR for monitoring intricate microbial interactions and examining biofilm infrastructure, as highlighted in recent reviews [23]. Distinctive temporal patterns in macromolecular accumulation were detected: strain SU216 displayed an intense polysaccharide signal, while SU150 exhibited marked changes in protein composition. The direct comparison at 48 h confirmed an overall carbohydrate enrichment in the biofilms and suggested alterations in protein secondary structure. These biochemical findings correlate with the structural architecture previously observed by SEM, explaining at the molecular level biofilm maturation and its potential contribution to mastitis persistence. The robust polysaccharide matrix could act as a physical barrier against antibiotics and host defenses in the mammary gland, while the detected adhesins could facilitate tissue colonization.

3.3. Viability and Membrane Integrity of Biofilm Cells Assessed by Spectral Flow Cytometry

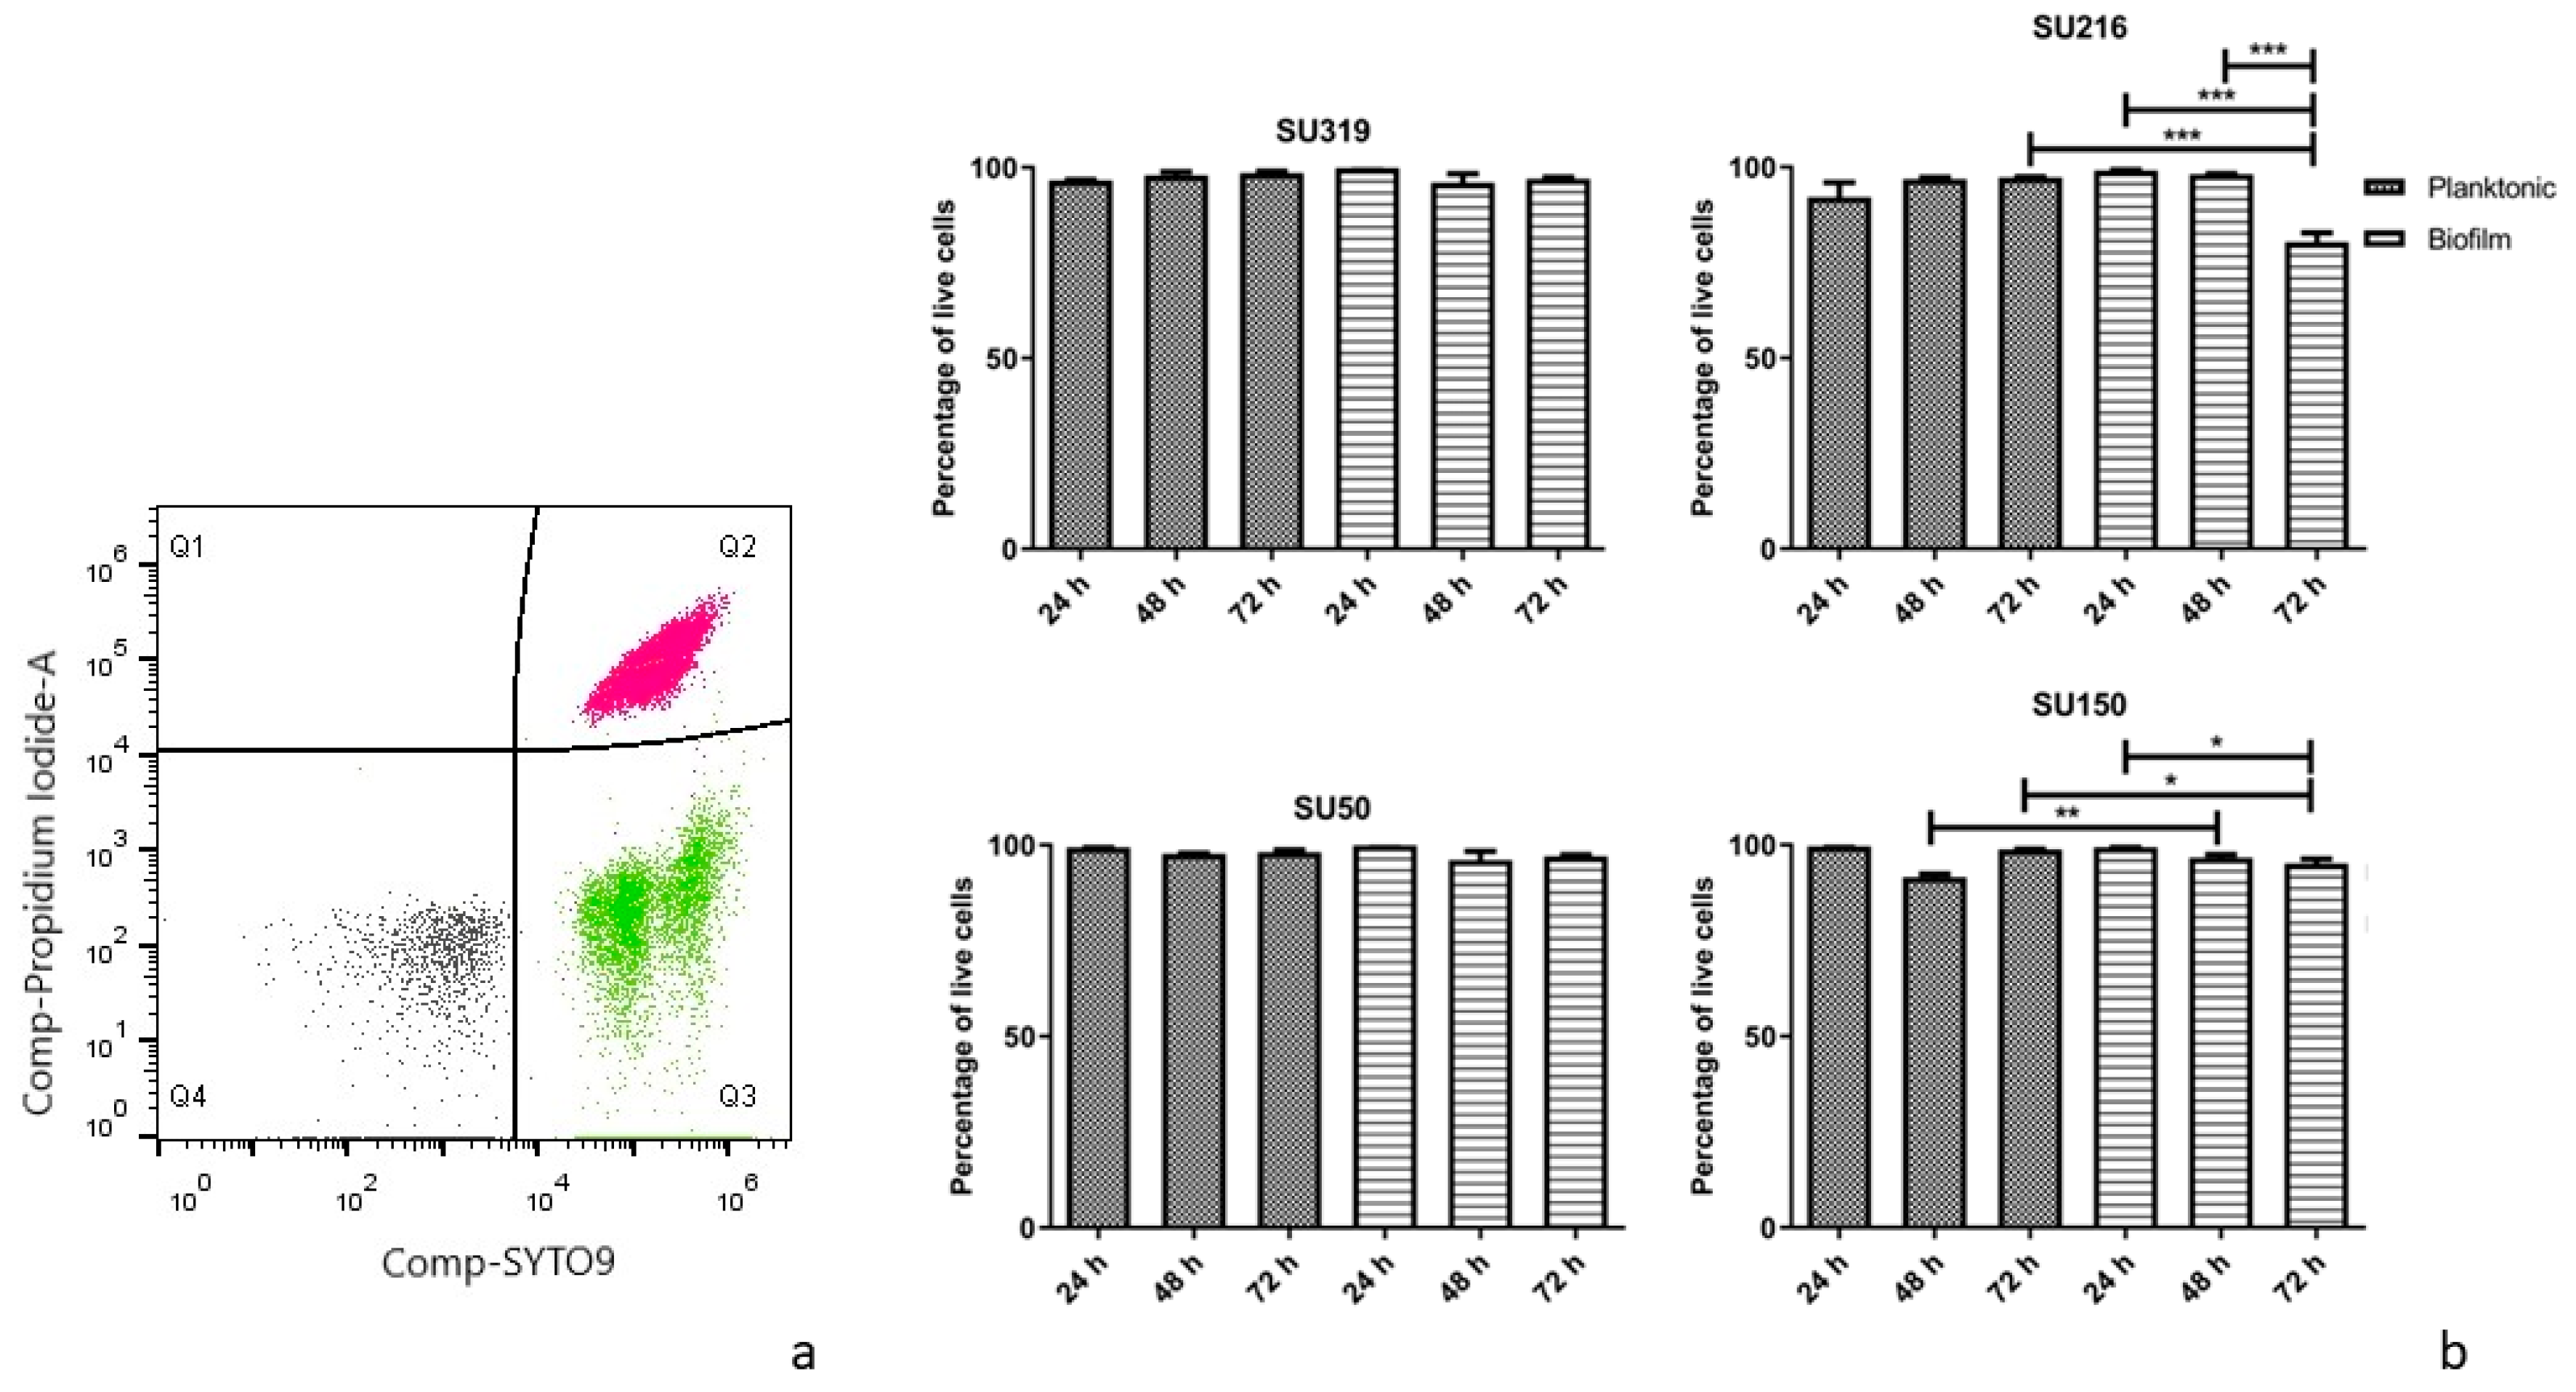
Flow cytometry (FCM) is a powerful technique to analyze multiple parameters of large cell populations and is widely used to study the generation, maintenance, and propagation of microbial biofilms [24]. In this study, we employed spectral flow cytometry to determine the physiological status of cells within the biochemically complex biofilm matrix. Flow cytometry analysis with SYTO9 and Propidium Iodide (PI) allowed us to clearly distinguish populations: autofluorescent cells (Q4: SYTO9-/PI-), viable cells (Q3: SYTO9+/PI-), and dead cells (Q2: SYTO9+/PI+), as illustrated in the representative gating strategy (Figure 4a). Using this approach, the percentage of live cells in the four S. uberis strains over time was quantified. The percentage of live cells in the biofilm was significantly higher compared to planktonic growth at 24, 48, and 72 h (Figure 4b).
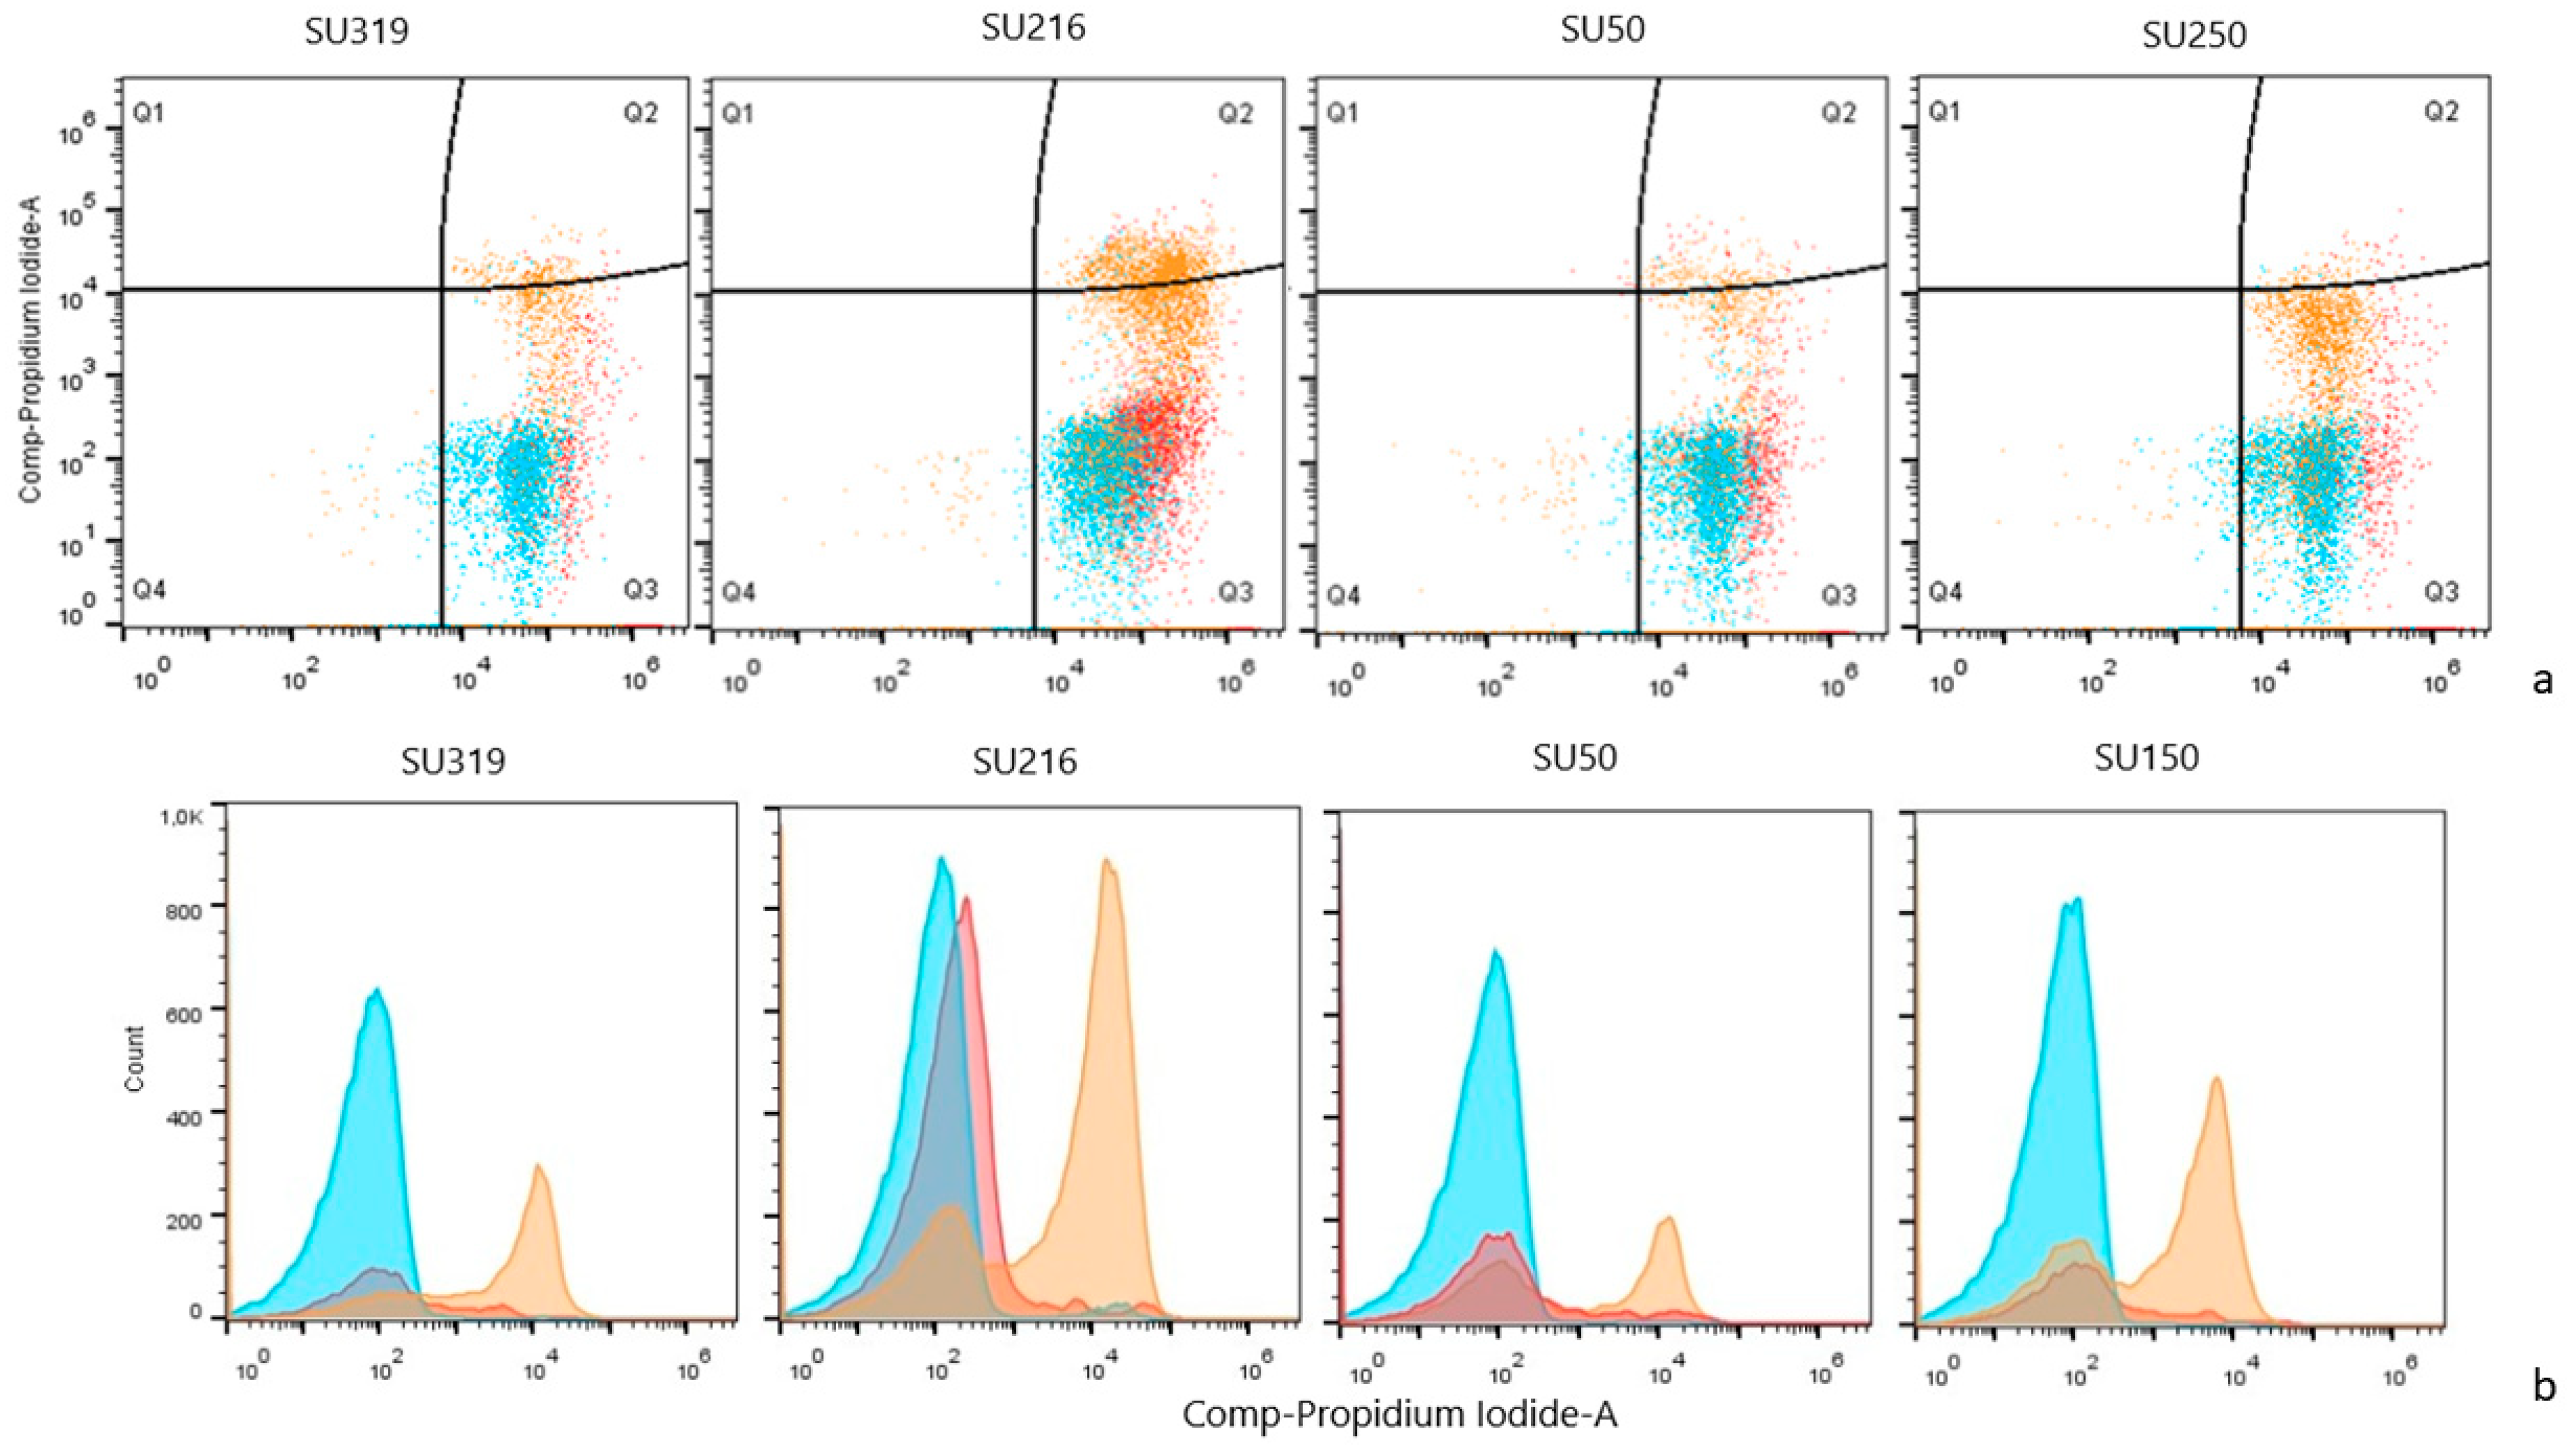
A consistent temporal pattern was observed across all S. uberis strains. Biofilms incubated for 72 h showed an increase in the dead cell population (Q2), concurrent with a decrease in viable cells (Q3), when compared to the 24 and 48 h time points (Figure 5a).
Beyond these population shifts, a progressive rightward shift in the geometric mean fluorescence intensity (gMFI) of PI was consistently observed over time (Figure 5b). This increase in PI fluorescence intensity indicates an enhancement in membrane permeability across the bacterial population. These findings support the hypothesis that a substantial subpopulation of cells enters a state of physiological stress prior to cell death at 72 h. This stress state, characterized by compromised membrane integrity and increased PI uptake, is a known mechanism contributing to high stress tolerance, as demonstrated by increased antibiotic resistance in biofilms [25] and the chronicity of infections [26], such as the persistent bovine mastitis caused by this pathogen [2,27].

3.4. Expression Levels of Biofilm-Associated Genes (sua, hasA, hasC, luxS and comX)

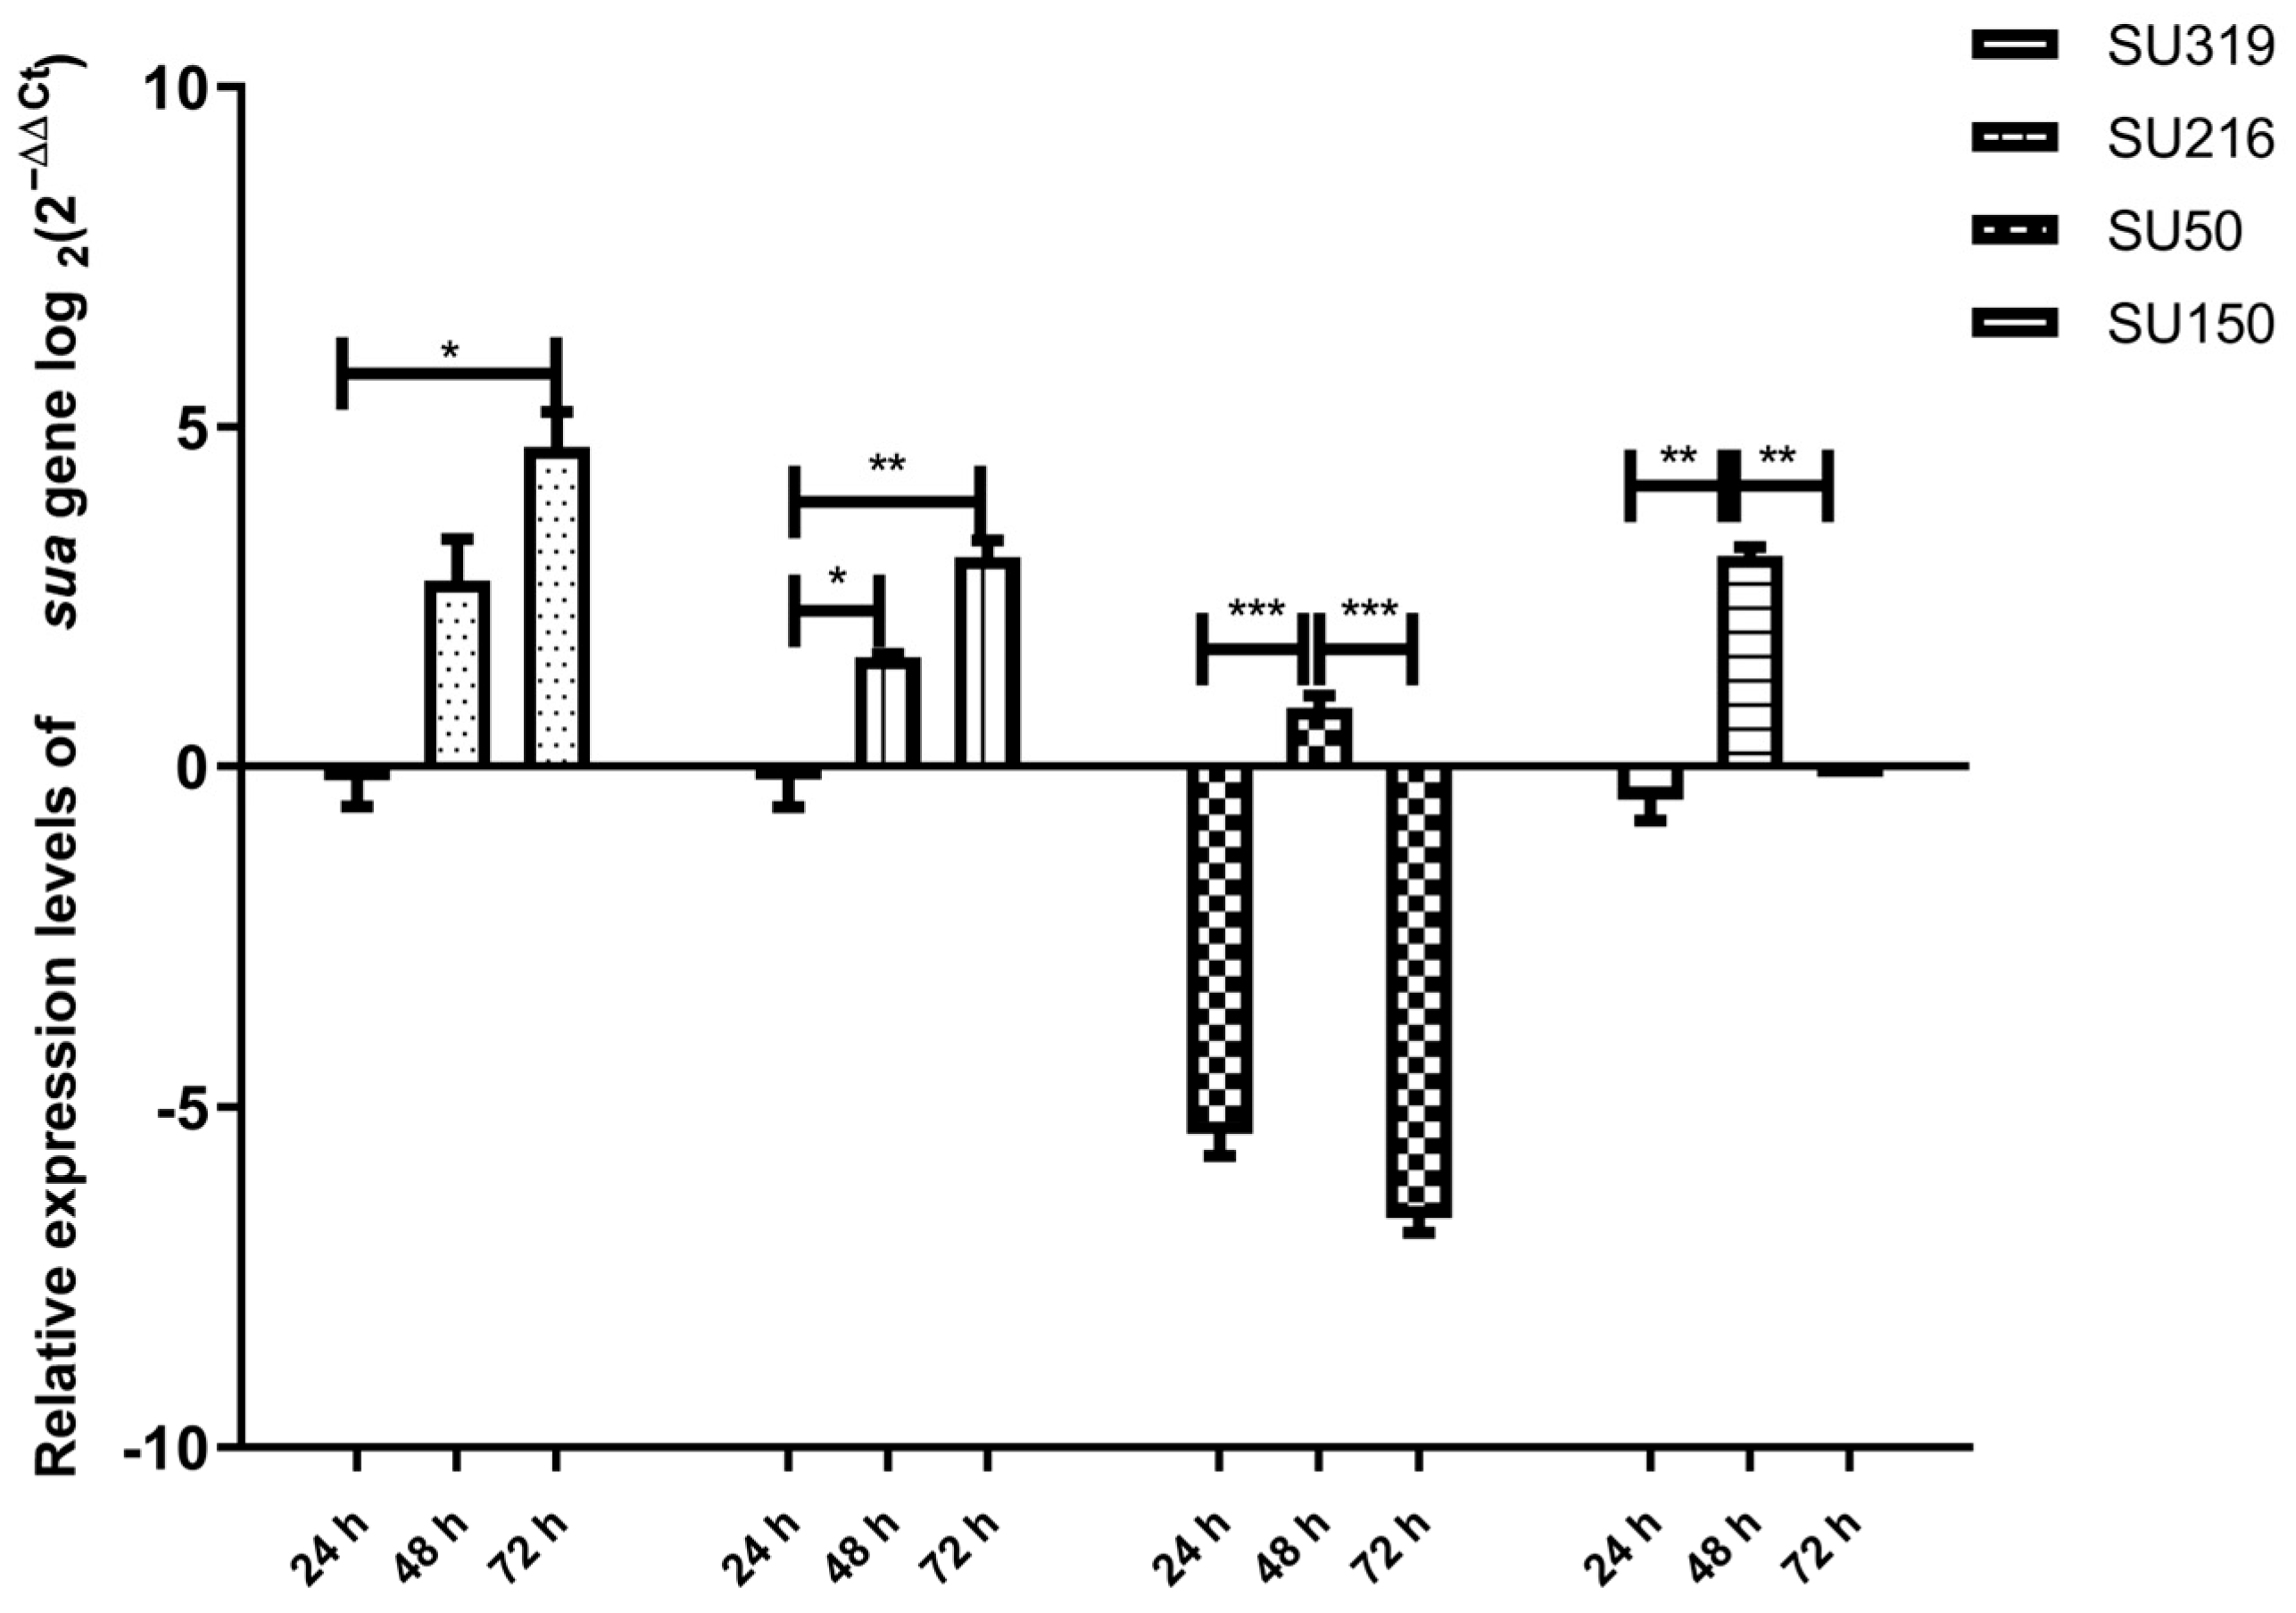
To investigate the molecular basis of biofilm formation, we analyzed the expression of putative biofilm-associated genes (sua, hasA, hasC, luxS, and comX) in S. uberis strains under biofilm conditions compared to planktonic growth. The sua gene, involved in adherence and previously found in 81.3% of the S. uberis isolates [9], in S. uberis under biofilm conditions compared to planktonic growth, was downregulated in the early phase of biofilm formation (24 h) but showed a statistically significant increase in expression at 48 h in all tested strains (Figure 6). This pattern coincides with the maximum biofilm production observed at 48 h, suggesting that sua may facilitate the cellular cohesion and microcolony formation that characterizes a mature biofilm.
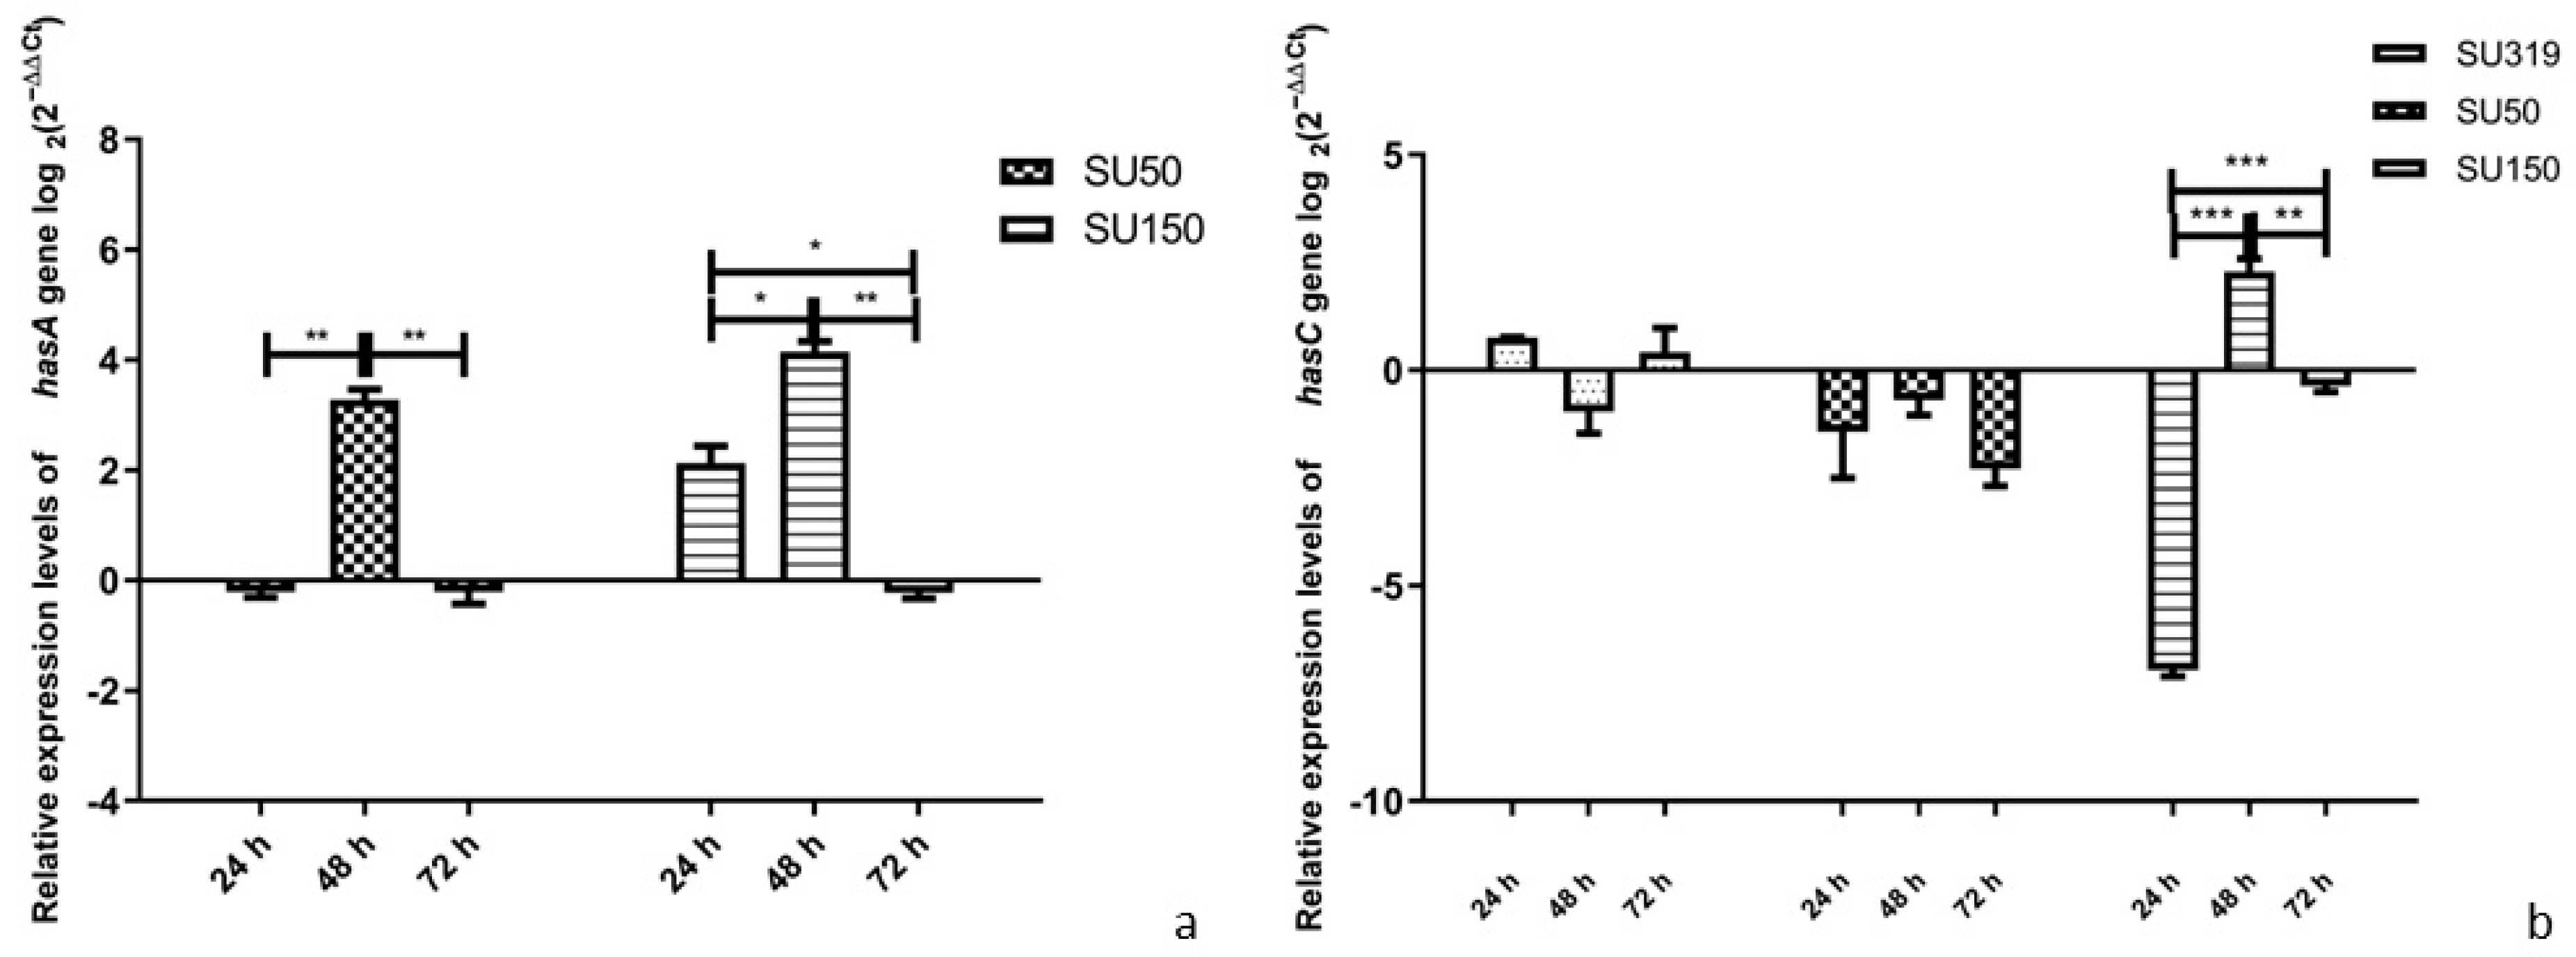
Subsequently, the expression of the hasA and hasC genes was studied in the context of their previously determined genetic background [10]. As anticipated from the genotyping data, strains SU319 (hasA/hasC+) and SU216 (hasA/hasC) showed no detectable expression of the hasA gene, confirming the specificity of our assay. In contrast, the hasA+ strains SU50 and SU150 showed a significant upregulation of this gene at 48 h in biofilm conditions (Figure 7a).
A similar strain-dependent pattern was observed for hasC. Strain SU216 (hasA/hasC), as expected, showed no expression. Notably, among the hasC+ strains (SU319, SU50, SU150), a significant overexpression at 48 h was specifically observed in SU150 (Figure 7b). These results indicate that for the strains that possess these genes, expression is subject to additional, strain-specific regulation during biofilm maturation, highlighting the complexity of this process in S. uberis.
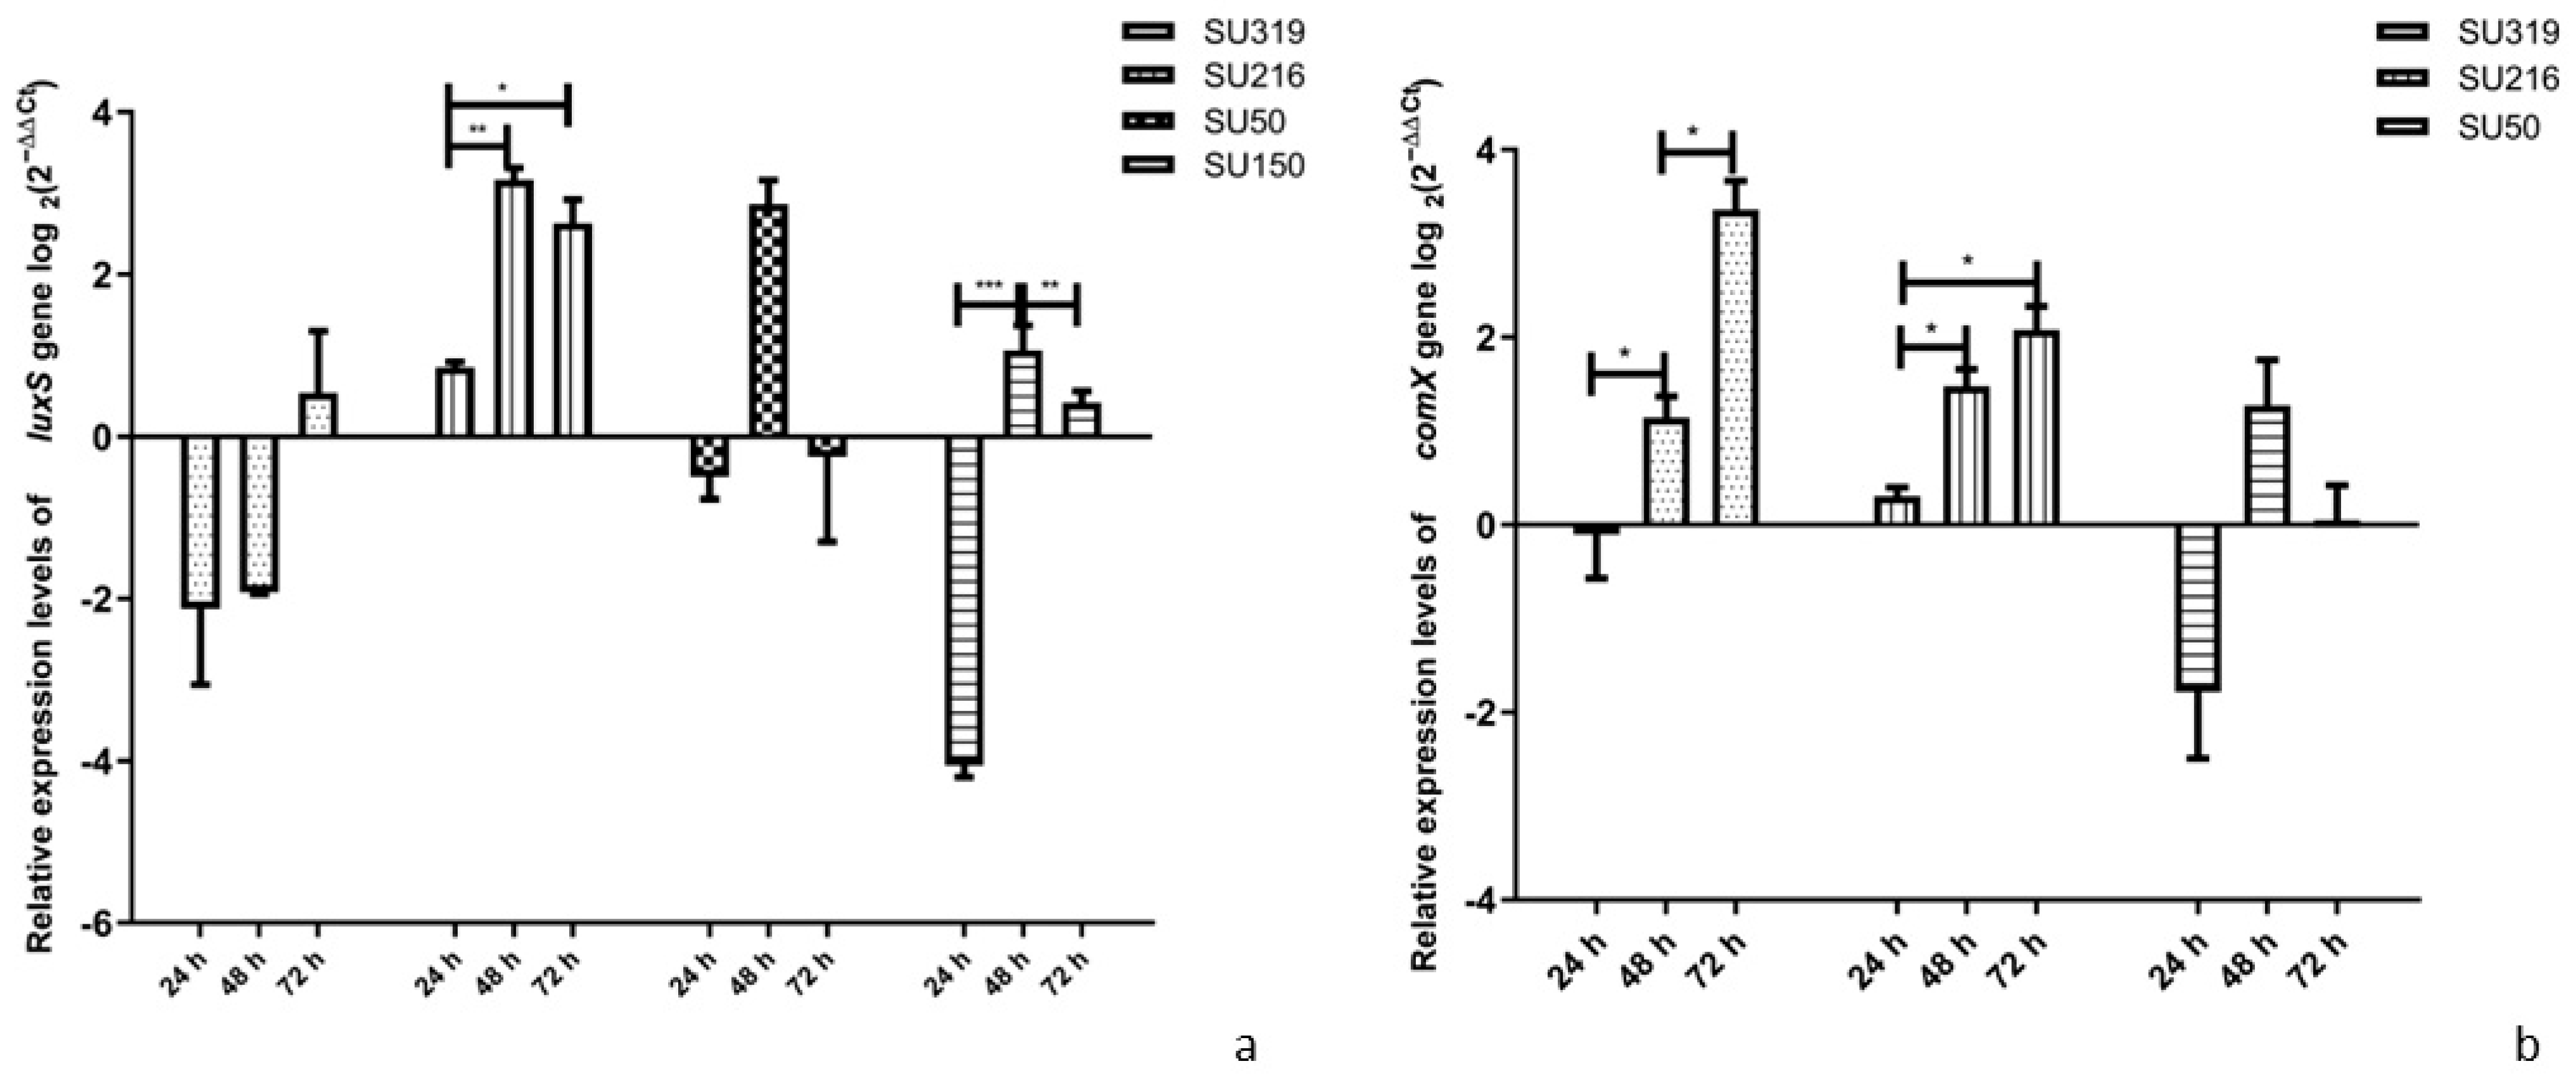
Furthermore, the expression of luxS and comX genes was evaluated. Analysis of luxS expression revealed distinct, strain-specific temporal profiles (Figure 8a). Strains SU216, SU50, and SU150 showed peak luxS expression at 48 h, coinciding with maximal biofilm production. In contrast, SU319 exhibited a delayed expression profile, with repression during the initial 48 h followed by significant upregulation at 72 h. This suggests that the role of luxS in biofilm development may be strain-dependent, participating in maturation for most strains but potentially in later dispersal or stress response in SU319.
The function of LuxS in bacteria is complex. While it is established as an S-ribosylhomocysteinase in the AI-2 pathway [28], its impact on biofilm formation is different across species. Studies carried out by Tikhomirova [29] reported that a Streptococcus pneumoniae luxS- mutant showed a reduced ability to adhere to human respiratory epithelial cells, but biofilm formation was not affected under in vitro conditions. Similarly, a study found no significant differences in biofilm formation between Klebsiella pneumoniae wild-type and its ΔluxS mutant [30]. In contrast, other studies have demonstrated that luxS deletion in S. pneumoniae leads to decreased biofilm formation and virulence, as well as alterations in genetic competence and fratricide [31,32].
Results of this study align with this spectrum of behaviors, revealing that S. uberis strains utilize LuxS-mediated signaling in distinct temporal patterns, which underscores the existence of strain-specific regulatory mechanisms governing quorum sensing and biofilm dynamics in this pathogen.
Following our previous work that identified comEA in S. uberis [10], we extended the characterization of the competence system by confirming the presence of comX via conventional PCR in all studied strains.
The expression of comX showed a strain-dependent temporal pattern (Figure 8b). Low expression levels were observed at 24 h for all strains. Strong biofilm-forming strains like SU50 displayed a transient induction peak at 48 h, followed by downregulation at 72 h. In contrast, moderate biofilm producers showed prolonged induction, reaching maximum expression levels only at 72 h. Although S. uberis is not considered naturally competent, our findings suggest ComX may play a role in biofilm biology beyond genetic transformation. The transient peak of comX expression at 48 h in strong biofilm formers coincides with biofilm maturation, similar to reports in S. mutans where the competence system regulates biofilm architecture [33]. However, the inverse relationship observed in S. pneumoniae, where ComX deficiency enhances biofilm formation [34], highlights the species-specific nature of this regulation. The strain-specific expression patterns detected in our study suggest that ComX may be involved in biofilm development in S. uberis, potentially coordinating subpopulation-specific behaviors within the mature biofilm community.
Results of the present study differ from those reported in S. aureus isolated from bovine mastitis, where the highest biofilm production occurs at 24 h. Expression levels of different genes associated with adherence and biofilm production during internalization in MAC-T cells in S. aureus were evaluated by [35], showing that all the strains evaluated overexpressed icaA and icaD adhesion genes, suggesting a possible role in biofilm production during early bacterial-cell interactions. Similarly, Atshan [36] evaluated the expression levels of different genes involved in adherence during biofilm formation in MRSA. The results showed fluctuating levels of expression of icaABCD genes over time, showing a negative regulation in the initial adherence stage at 12 h, an increase during the medium adherence stage at 24 h, followed by a minor negative regulation at 48 h. Another study reported that the expression of the ica genes would be necessary for the formation of biofilm in the early stages at 8 h of growth, suggesting that polysaccharide production mediated by the icaADBC operon genes is a necessary mechanism involved in biofilm formation and may contribute to the early stages of bacterial growth [37].
Crucially, the gene expression data are strongly supported by the biochemical profiles obtained through FT-IR spectroscopy. Most notably, the significant upregulation of adhesion genes sua and hasA observed in strain SU150 at 48 h aligns with the marked changes in protein composition detected spectroscopically. Conversely, the strong polysaccharide signature in SU216’s biofilm provides a biochemical explanation for its robust biofilm formation despite its lack of the hasA/hasC genes, strongly suggesting the involvement of alternative polysaccharide synthesis mechanisms.

3.5. Antibiotic Susceptibility of Planktonic and Biofilm

Susceptibility profiles to six antibiotics revealed a marked increase in resistance during biofilm growth compared to planktonic growth (Table 3). All strains were highly susceptible to most antibiotics in the planktonic state, with MIC values ≤ 1 µg/mL. However, concentrations required to inhibit biofilm formation (MBIC) were substantially higher than the planktonic MICs. For the highly susceptible strains (SU319, SU50, SU150), this increase reached 32- to 64-fold for most antibiotics. In contrast, strain SU216, which displayed higher baseline MICs, showed a more variable but still marked increase in MBIC values.
Most strikingly, eradication of pre-formed biofilms required exceptionally high antibiotic levels, with MBEC80 values frequently exceeding 256 µg/mL, the highest concentration tested. Notable strain-specific profiles were observed. While SU319 and SU50 were highly susceptible in planktonic growth, their biofilms were largely impervious to eradication. Strain SU216 displayed inherently higher planktonic MICs to penicillin (1 µg/mL), gentamicin (2 µg/mL), and erythromycin (4 µg/mL). Nevertheless, its biofilm phenotype showed extreme tolerance, mirroring the other strains.
A remarkable finding was the activity of tetracycline, which consistently achieved complete biofilm eradication (MBEC80) at significantly lower concentrations (4–32 µg/mL) compared to the other antibiotics in three of the four tested strains.
The results demonstrate the significant tolerance that S. uberis biofilms confer against antimicrobial agents. The marked increase in MBIC and MBEC values, compared to planktonic MICs, underscores a fundamental shift in bacterial physiology. This enhanced protection is multifactorial, arising not from classical genetic resistance but from the biofilm structure itself, which can limit antibiotic diffusion, create gradients of physiological heterogeneity, and harbor persistent cells [38].
Furthermore, the strain-specific susceptibility profiles highlight a critical consideration for clinical management. The SU216 strain exhibited higher planktonic MICs, suggesting that intrinsic resistance mechanisms may be exacerbated by the biofilm. This variability confirms that antimicrobial susceptibility can differ significantly among strains and that biofilm growth can mask underlying intrinsic resistance, complicating treatment decisions [39]. In addition, tetracycline consistently achieved complete biofilm eradication (MBEC80) at concentrations 8 to 64 times lower than those required by other antibiotics. This efficacy suggests that tetracycline can evade common protective mechanisms of the S. uberis biofilm, possibly through greater penetration or inherent activity against slow-growing or persistent cells.

4. Conclusions

An integrated multi-method approach reveals the complete lifecycle of S. uberis biofilms. While epidemiological studies often require large numbers of isolates, the present study was designed to provide an in-depth, mechanistic understanding of S. uberis biofilm development. Results demonstrate that the maturation peak at 48 h represents a coordinated phenotypic switch, characterized by the development of a complex three-dimensional architecture with water channels (SEM), a distinct biochemical signature rich in polysaccharides and biofilm-specific proteins (FT-IR), and the peak expression of key adhesion genes such as sua and hasA (qPCR). Spectral flow cytometry confirms that this robust structure is composed of a highly viable bacterial population, thereby establishing a protected and resilient niche within the host. This mature state of the biofilm explains the high antibiotic tolerance observed, where MBEC values were elevated compared to planktonic MICs. The polysaccharide matrix and the physiological state of the cells within the biofilm could act as a barrier; this finding would provide a biological basis for resistance to chronic S. uberis infections.
The transition to the 72 h time point represents the dispersal or degeneration phase. This phase is not a passive decline but an active process characterized by structural collapse (SEM), decreased adhesion gene expression, and a crucial shift in population physiology. Spectral flow cytometry data are revealing, showing a progression from viability to physiological stress, evidenced by increased membrane permeability and IP uptake, before cell death. This subpopulation of stressed cells may be crucial for the spread of new infections and contribute to chronicity.
The current study provides valuable insights into the developmental cycle of S. uberis biofilms and its potential implications for bovine mastitis. Our integrated analysis suggests that the highly viable and structured 48 h biofilm could constitute a defensive strategy, which could be related to the high antibiotic tolerance observed. Furthermore, the subsequent dispersal phase, while indicating biofilm collapse, appears to involve a subpopulation of stressed cells that could play a role in disease recurrence or bacterial dissemination. Although this study provides a detailed in vitro characterization of the S. uberis biofilm developmental cycle, these findings may not fully replicate the complex conditions of the bovine mammary gland. Factors such as host immune interactions, milk composition, and shear forces within the udder environment are not captured in static microtiter plate models. Future studies should validate these observations using bovine mammary epithelial cell models or in vivo infection systems to better understand how these biofilm dynamics translate to clinical mastitis.
Future therapeutic strategies should focus on disrupting the polysaccharide matrix or interfering with the key adhesion mechanisms identified in this study, which could represent a promising strategy to effectively combat persistent bovine mastitis infections caused by S. uberis.

Author Contributions

Conceptualization, E.B.R.; methodology, E.B.R., M.V.M., I.V., M.A.M., M.F.C., A.N., C.I.M., P.B., C.M.P. and A.L.C.; software, A.N.; validation, E.B.R.; formal analysis, M.V.M. and A.N.; investigation, E.B.R.; resources, E.B.R. and P.B.; data curation, E.B.R.; writing—original draft preparation, E.B.R., M.F.C. and M.A.M.; writing—review and editing, E.B.R., M.F.C., M.A.M. and M.V.M.; visualization, E.B.R.; supervision, E.B.R.; project administration, E.B.R.; funding acquisition, E.B.R. All authors have read and agreed to the published version of the manuscript.

Funding

This research was funded by Agencia Nacional de Promoción Científica y Tecnológica FONCyT, grant number PICT-2020-00230, PICT-2018-02410.

Institutional Review Board Statement

Not applicable.

Informed Consent Statement

Not applicable.

Data Availability Statement

The raw data supporting the conclusions of this article will be made available by the authors upon request, without undue reservation.

Conflicts of Interest

The authors declare no conflicts of interest.

References

  1. Leelahapongsathon, K.; Schukken, Y.H.; Srithanasuwan, A.; Suriyasathaporn, W. Molecular epidemiology of Streptococcus uberis intramammary infections: Persistent and transient patterns of infection in a dairy herd. J. Dairy Sci. 2020, 103, 3565–3576. [Google Scholar] [CrossRef] [Scilit]
  2. Reinoso, E.B. Bovine Mastitis Caused by Streptococcus uberis: Virulence Factors and Biofilm. J. Microb. Biochem. Technol. 2017, 9, 237–243. [Google Scholar]
  3. Loo, C.Y.; Corliss, D.A.; Ganeshkumar, N. Streptococcus gordonii biofilm formation: Identification of genes that code for biofilm phenotypes. J. Bacteriol. 2000, 182, 1374–1382. [Google Scholar] [CrossRef] [Scilit]
  4. Yoshida, A.; Kuramitsu, H.K. Multiple Streptococcus mutans genes are involved in biofilm formation. Appl. Environ. Microbiol. 2002, 68, 6283–6291. [Google Scholar] [CrossRef] [Scilit]
  5. Gilmore, K.S.; Srinivas, P.; Akins, D.R.; Hatter, K.L.; Gilmore, M.S. Growth, development, and gene expression in a persistent Streptococcus gordonii biofilm. Infect. Immun. 2003, 71, 4759–4766. [Google Scholar] [CrossRef] [Scilit] [PubMed]
  6. Pinto, R.M.; Lopes-De-Campos, D.; Martins, M.C.L.; Van Dijck, P.; Nunes, C.; Reis, S. Impact of nanosystems in Staphylococcus aureus biofilm treatment. FEMS Microbiol. Rev. 2019, 43, 622–641. [Google Scholar] [CrossRef] [Scilit] [PubMed]
  7. Luo, Y.; Yang, Q.; Zhang, D.; Yan, W. Mechanisms and control strategies of antibiotic resistance in pathological biofilms. J. Microbiol. Biotechnol. 2021, 31, 1–7. [Google Scholar] [CrossRef] [Scilit]
  8. Pedersen, R.R.; Krömker, V.; Bjarnsholt, T.; Dahl-Pedersen, K.; Buhl, R.; Jørgensen, E. Biofilm research in bovine mastitis. Front. Vet. Sci. 2021, 8, 656810. [Google Scholar] [CrossRef] [Scilit] [PubMed]
  9. Moliva, M.V.; Cerioli, F.; Reinoso, E.B. Evaluation of environmental and nutritional factors and sua gene on in vitro biofilm formation of Streptococcus uberis isolates. Microb. Pathog. 2017, 107, 144–148. [Google Scholar] [CrossRef] [Scilit]
  10. Moliva, M.V.; Lasagno, M.C.; Porporatto, C.; Reinoso, E.B. Biofilm formation ability and genotypic analysis of Streptococcus uberis isolated from bovine mastitis. Int. J. Vet. Dairy Sci. 2017, 1, 1–5. [Google Scholar]
  11. Almeida, R.A.; Luther, D.A.; Patel, D.; Oliver, S.P. Predicted antigenic regions of Streptococcus uberis adhesion molecule (SUAM) are involved in adherence to and internalization into mammary epithelial cells. Vet. Microbiol. 2011, 148, 323–328. [Google Scholar] [CrossRef] [Scilit]
  12. Ward, P.N.; Field, T.R.; Ditcham, W.G.F.; Maguin, E.; Leigh, J.A. Identification and disruption of two discrete loci encoding hyaluronic acid capsule biosynthesis genes hasA, hasB, and hasC in Streptococcus uberis. Infect. Immun. 2001, 69, 392–399. [Google Scholar] [CrossRef] [Scilit] [PubMed]
  13. Trappetti, C.; van der Maten, E.; Amin, Z.; Potter, A.J.; Chen, A.Y.; van Mourik, P.M.; Lawrence, A.J.; Paton, A.W.; Paton, J.C. Site of isolation determines biofilm formation and virulence phenotypes of Streptococcus pneumoniae serotype 3 clinical isolates. Infect. Immun. 2013, 81, 505–513. [Google Scholar] [CrossRef] [Scilit]
  14. Stocks, S.M. Mechanism and use of the commercially available viability stain, BacLight. Cytom. A 2004, 61, 189–195. [Google Scholar] [CrossRef] [Scilit]
  15. Livak, K.J.; Schmittgen, T.D. Analysis of relative gene expression data using real-time quantitative PCR and the 2−ΔΔCT method. Methods 2001, 25, 402–408. [Google Scholar] [CrossRef] [Scilit]
  16. Fontaine, M.C.; Perez-Casal, J.; Song, X.-M.; Shelford, J.; Willson, P.J.; Potter, A.A. Immunisation of dairy cattle with re-combinant Streptococcus uberis GapC or a chimeric CAMP antigen confers protection against heterologous bacterial challenge. Vaccine 2002, 20, 2278–2286. [Google Scholar] [CrossRef] [Scilit] [PubMed]
  17. Field, T.R.; Ward, P.N.; Pedersen, L.H.; Leigh, J.A. The hyaluronic acid capsule of Streptococcus uberis is not required for the development of infection and clinical mastitis. Infect. Immun. 2003, 71, 132–139. [Google Scholar] [CrossRef] [Scilit]
  18. Almeida, R.A.; Luther, D.A.; Park, H.M.; Oliver, S.P. Identification, isolation, and partial characterization of a novel Streptococcus uberis adhesion molecule (SUAM). Vet. Microbiol. 2006, 115, 183–191. [Google Scholar] [CrossRef] [Scilit]
  19. Crowley, R.C.; Leigh, J.A.; Ward, P.N.; Lappin-Scott, H.M.; Bowler, L.D. Differential protein expression in Streptococcus uberis under planktonic and biofilm growth conditions. Appl. Environ. Microbiol. 2011, 77, 382–384. [Google Scholar] [CrossRef] [Scilit]
  20. CLSI Standard M07; Methods for Dilution Antimicrobial Susceptibility Tests for Bacteria That Grow Aerobically (12th ed.). Clinical and Laboratory Standards Institute: Wayne, PA, USA, 2024.
  21. Kwiecinski, J.; Eick, S.; Wójcik, K. Effects of tea tree (Melaleuca alternifolia) oil on Staphylococcus aureus in biofilms and stationary growth phase. Int. J. Antimicrob. Agents 2009, 33, 343–347. [Google Scholar] [CrossRef] [Scilit] [PubMed]
  22. Al-Shabib, N.A.; Husain, F.; Ahmad, I.; Khan, M.S.; Khan, R.A.; Khan, J.M. Rutin inhibits mono- and multi-species biofilm formation by food-borne drug-resistant Escherichia coli and Staphylococcus aureus. Food Control 2017, 79, 325–332. [Google Scholar] [CrossRef] [Scilit]
  23. Kassem, A.; Abbas, L.; Coutinho, O.; Opara, S.; Najaf, H.; Kasperek, D.; Pokhrel, K.; Li, X.; Tiquia-Arashiro, S. Applications of Fourier transform-infrared spectroscopy in microbial cell biology and environmental microbiology: Advances, challenges, and future perspectives. Front. Microbiol. 2023, 14, 1304081. [Google Scholar]
  24. Barajas, M. Microbial Biofilm Dynamics: Contemporary Approaches, Models and Analytical Tools, 1st ed.; Shukla, A.K., Monteiro, D.R., Eds.; CRC Press: Boca Raton, FL, USA, 2025; pp. 1–232. [Google Scholar] [CrossRef] [Scilit]
  25. Costa, Y.; Cebrián, G.; Rojo, F. The role of stress responses in biofilm formation and antibiotic resistance. Trends Microbiol. 2019, 27, 495–507. [Google Scholar]
  26. Melchior, M.B.; van Osch, M.H.; Lam, T.J.; Vernooij, J.C.; Gaastra, W.; Fink-Gremmels, J. Extended biofilm susceptibility assay for Staphylococcus aureus bovine mastitis isolates: Evidence for association between genetic makeup and biofilm susceptibility. J. Dairy Sci. 2011, 94, 5926–5937. [Google Scholar] [CrossRef] [Scilit]
  27. Schönborn, S.; Wente, N.; Paduch, J.H.; Krömker, V. In vitro ability of mastitis-causing pathogens to form biofilms. J. Dairy Res. 2017, 84, 198–201. [Google Scholar] [CrossRef] [Scilit]
  28. Schauder, S.; Bassler, B.L. The languages of bacteria. Genes Dev. 2001, 15, 1468–1480. [Google Scholar] [CrossRef] [Scilit]
  29. Tikhomirova, A.; Brazel, E.B.; McLean, K.T.; Agnew, H.N.; Paton, J.C.; Trappetti, C. The role of luxS in the middle ear Streptococcus pneumoniae isolate 947. Pathogens 2022, 11, 216. [Google Scholar] [CrossRef] [Scilit] [PubMed]
  30. Chen, L.; Wilksch, J.J.; Liu, H.; Zhang, X.; Torres, V.V.L.; Bi, W.; Mandela, E.; Cao, J.; Li, J.; Lithgow, T.; et al. Investigation of LuxS-mediated quorum sensing in Klebsiella pneumoniae. J. Med. Microbiol. 2020, 69, 402–413. [Google Scholar] [CrossRef] [Scilit] [PubMed]
  31. Trappetti, C.; Potter, A.J.; Paton, A.W.; Oggioni, M.R.; Paton, J.C. LuxS mediates iron-dependent biofilm formation, competence, and fratricide in Streptococcus pneumoniae. Infect. Immun. 2011, 79, 4550–4558. [Google Scholar] [CrossRef] [Scilit]
  32. Vidal, J.E.; Ludewick, H.P.; Kunkel, R.M.; Zähner, D.; Klugman, K.P. The LuxS-dependent quorum-sensing system regulates early biofilm formation by Streptococcus pneumoniae strain D39. Infect. Immun. 2011, 79, 4050–4060. [Google Scholar] [CrossRef] [Scilit]
  33. Li, Y.-H.; Tang, N.; Aspiras, M.B.; Lau, P.C.Y.; Lee, J.H.; Ellen, R.P.; Cvitkovitch, D.G. A quorum-sensing signaling system essential for genetic competence in Streptococcus mutans is involved in biofilm formation. J. Bacteriol. 2002, 184, 2699–2708. [Google Scholar] [CrossRef] [Scilit]
  34. Špacapan, M.; Danevčič, T.; Štefanič, P.; Porter, M.; Stanley-Wall, N.R.; Mandić-Mulec, I. The ComX quorum-sensing peptide of Bacillus subtilis affects biofilm formation negatively and sporulation positively. Microorganisms 2020, 8, 1131. [Google Scholar] [CrossRef] [Scilit]
  35. Pereyra, E.A.; Picech, F.; Renna, M.S.; Baravalle, C.; Andreotti, C.S.; Russi, R.; Calvinho, L.F.; Diez, C.; Dallard, B.E. Detection of Staphylococcus aureus adhesion and biofilm-producing genes and their expression during internalization in bovine mammary epithelial cells. Vet. Microbiol. 2016, 183, 69–77. [Google Scholar] [CrossRef] [Scilit]
  36. Atshan, S.S.; Shamsudin, M.N.; Karunanidhi, A.; van Belkum, A.; Lung, L.T.T.; Sekawi, Z.; Nathan, J.J.; Ling, K.H.; Seng, J.S.C.; Ali, A.M.; et al. Quantitative PCR analysis of genes expressed during biofilm development of methicillin-resistant Staphylococcus aureus (MRSA). Infect. Genet. Evol. 2013, 18, 106–112. [Google Scholar] [CrossRef] [Scilit] [PubMed]
  37. Marques, V.F.; Santos, H.A.; Santos, T.H.; Melo, D.A.; Coelho, S.M.O.; Coelho, I.S.; Souza, M.M.S. Expression of icaA and icaD genes in biofilm formation in Staphylococcus aureus isolates from bovine subclinical mastitis. Pesq. Vet. Bras. 2021, 41, e06645. [Google Scholar] [CrossRef] [Scilit]
  38. Stewart, P.S.; Costerton, J.W. Antibiotic resistance of bacteria in biofilms. Lancet 2001, 358, 135–138. [Google Scholar] [CrossRef] [Scilit] [PubMed]
  39. Høiby, N.; Bjarnsholt, T.; Givskov, M.; Molin, S.; Ciofu, O. Antibiotic resistance of bacterial biofilms. Int. J. Antimicrob. Agents 2010, 35, 322–332. [Google Scholar] [CrossRef] [Scilit] [PubMed]
Figure 1. Biofilm architecture of Streptococcus uberis SU50 analyzed by scanning electron microscopy. (ac) Conventional SEM images at 24 h (a), 48 h (b), and 72 h. Yellow arrows indicate extracellular matrix. (d,e) Three-dimensional SEM reconstructions at 48 h, showing bacterial aggregates and water channels (green arrows). Scale bars: 2 μm (ac); 10 μm (d,e).
Bacteria 05 00006 g001
Figure 2. FT-IR spectral analysis of Streptococcus uberis biofilm development. Temporal spectral profiles at 24, 48, and 72 h, highlighting strain-specific accumulation of macromolecules. Square dash in the figure indicates the main biochemical regions: 1000–1200 cm−1 (polysaccharides), 1450–1750 cm−1 (proteins), and 2750–3000 cm−1 (lipids).
Bacteria 05 00006 g002
Figure 3. Difference spectra of Streptococcus uberis (biofilm vs. planktonic) at 48 h. The spectra show enhanced carbohydrate signals (800–1100 cm−1) and protein secondary structure changes (~1626 cm−1 and 1696 cm−1). Dashed boxes indicate spectral regions associated with functional groups related to polysaccharides, proteins, and lipids.
Bacteria 05 00006 g003
Figure 4. Flow cytometry analysis of Streptococcus uberis biofilms at different incubation times. (a) Representative dot plots gating strategy used to discriminate autofluorescent cells (gray), viable cells (SYTO9+/PI-, green), and dead cells (PI+, magenta). (b) Percentage of live cells in S. uberis strains during biofilm development compared to planktonic growth at 24, 48, and 72 h. Data represent the mean ± SEM of three independent replicates (n = 3). Asterisks indicate statistically significant differences (* p < 0.05; ** p < 0.01; *** p < 0.001).
Bacteria 05 00006 g004
Figure 5. (a) Representative overlay dot plots illustrating the progressive rightward shift in PI fluorescence intensity (geometric mean fluorescence intensity, gMFI) across time points, indicating an increase in membrane permeability and physiological stress preceding cell death. (b) Representative density plots showing the temporal dynamics of cell populations in biofilms incubated for 24 h (red), 48 h (blue), and 72 h (orange).
Bacteria 05 00006 g005
Figure 6. Relative expression levels of the sua gene in S. uberis strains at 24, 48 and 72 h of biofilm formation. The bars represent the expression in the biofilm in comparison with the planktonic growth at different times. The data represents the mean ± SEM of 2 replicates (n = 2). Asterisks denote statistical differences in expression, as normalized by the gapC reference gene. * p < 0.05; ** p < 0.01 and *** p < 0.001.
Bacteria 05 00006 g006
Figure 7. Relative expression levels of (a) hasA and (b) hasC genes in Streptococcus uberis strains at 24, 48 and 72 h. The bars represent expression in biofilm relative to planktonic growth. Data represent the mean ± SEM of two replicates (n = 2). Asterisks denote statistical differences normalized to the gapC reference gene. * p < 0.05; ** p < 0.01; *** p < 0.001.
Bacteria 05 00006 g007
Figure 8. Relative expression levels of (a) luxS and comX (b) genes in Streptococcus uberis strains at 24, 48 and 72 h. (b) Relative expression levels of genes in S. uberis strains at 24, 48 and 72 h. The bars represent expression in biofilm relative to planktonic growth. Data represent the mean ± SEM of two replicates (n = 2). Asterisks denote statistical differences normalized to the gapC reference gene. * p < 0.05; ** p < 0.01; *** p < 0.001.
Bacteria 05 00006 g008
Table 1. Presence of virulence, competence, and quorum-sensing genes, and biofilm-forming ability in the Streptococcus uberis strains analyzed.
StrainVirulence GenesCompetence and Quorum Sensing GenesBiofilm Production
suahasAhasCcomXluxS
SU319+-+++Moderate
SU216+--++Moderate
SU50+++++Strong
SU150+++-+Strong
(+) presence, (-) absence.
Table 2. Sequences of primers used for real-time qRT-PCR assays.
GenePrimer SequenceAmplicon Size (bp)Annealing
Temperature
Reference
comXF: 5′-GCGGAGTCTTGTCCTTTGTC-3′
R: 5′-ATGACTTTGCCACCACTTCC-3′
288 bp50° CThis study
gapCF: 5′-GTCACCAGTGTAAGCGTGGA-3′
R: 5′-GCTCCTGGTGGAGATGATGT-3′
200 bp55° C[16]
hasAF: 5′-CCCATTTCCGACTGAAGAAA-3′
R: 5′-AGCTTCGGTCCCCAACTTAT-3′
235 bp50° C[12]
hasCF: 5′-TGCTTGGTGACGATTTGATG-3′
R: 5′-GTCCAATGATAGCAAGGTCAC-3′
300 bp58° C[17]
luxSF: 5′-TTTGATGTTCGCTTGGTTCA-3′
R: 5′-AGTTTTGCCCATTCTTTTGC-3′
317 bp51° CThis study
suaF: 5′-CGGAGCACTTGGGTTTGTTT-3′
R: 5′-AGGCATTGGTCCACACGATA-3′
244 bp58° C[18]
recAF:5′-CTGGAGAACAAGGTTTGGATG-3′
R: 5′-GAGGAACAAGAGCCGCAACA-3′
120 bp55° C[19]
Table 3. Comparative antibiotic susceptibility of planktonic and biofilm Streptococcus uberis strains. MIC, MBIC, and MBEC80 values (µg/mL) were determined for six antibiotics.
StrainAntibioticMIC (μg/mL)MBIC (μg/mL)MBEC60 (μg/mL)MBEC80 (μg/mL)
SU319Penicillin0.0312528256
Gentamicin0.0312518>256
Erythromycin0.0312514>256
Ampicillin0.031251464–128
Chloramphenicol0.031251464–128
Tetracycline0.251432
SU216Penicillin122>256
Gentamicin228>256
Erythromycin444>256
Ampicillin0.0312548>256
Chloramphenicol0.062522>256
Tetracycline0.031251216
SU50Penicillin0.0312522>256
Gentamicin0.0312528>256
Erythromycin0.0312522>256
Ampicillin0.062522>256
Chloramphenicol0.0312528>256
Tetracycline0.0312522>256
SU150Penicillin0.062522>256
Gentamicin0.062528>256
Erythromycin0.0625228
Ampicillin0.031252864
Chloramphenicol0.0312522>256
Tetracycline0.03125224
MIC: Minimum Inhibitory Concentration; MBIC: Minimum Biofilm Inhibitory Concentration; MBEC: Minimum Biofilm Eradication Concentration.
Disclaimer/Publisher’s Note: The statements, opinions and data contained in all publications are solely those of the individual author(s) and contributor(s) and not of MDPI and/or the editor(s). MDPI and/or the editor(s) disclaim responsibility for any injury to people or property resulting from any ideas, methods, instructions or products referred to in the content.