Article

Glucose Levels Impact the Morphology and Cell Type Composition of Human Cerebral Organoids

1
Department of Chemical and Biomolecular Engineering, North Carolina State University, Raleigh, NC 27606, USA
2
Golden LEAF Biomanufacturing Training and Education Center, North Carolina State University, Raleigh, NC 27606, USA
*
Author to whom correspondence should be addressed.
Organoids 2026, 5(2), 11; https://doi.org/10.3390/organoids5020011
Submission received: 31 January 2026 / Revised: 13 March 2026 / Accepted: 3 April 2026 / Published: 5 April 2026

Abstract

Human cerebral organoids, derived from pluripotent stem cells, are powerful models for studying human brain development. The understanding of how morphogens can be used to guide patterning and differentiation has matured rapidly; however, the influence of basal media components on organoid development remains unclear. Standard organoid media frequently contain non-physiological concentrations of nutrients, including glucose, a central regulator of cellular metabolism and signaling. Here, we examine how glucose availability shapes cerebral organoid growth, morphology, and cell type composition by comparing conventional hyperglycemic media to media with glucose levels more closely resembling normoglycemic conditions. We find that organoids derived from multiple human pluripotent stem cell lines can grow in low glucose, but they exhibit altered growth rates, structural features, and lineage distributions. In H9 embryonic stem cell-derived organoids, inhibition of the mammalian target of rapamycin pathway under low glucose restores neurodevelopmental cell types otherwise diminished in these conditions. These findings highlight glucose as a key determinant of organoid lineage specification and cellular signaling. Importantly, however, glucose modulation does not reduce variability across organoids or cell lines, underscoring the need to better understand and control sources of heterogeneity to improve organoid models.

1. Introduction

Human cerebral organoids (hCOs) are derived from embryonic stem cells (ESCs) or induced pluripotent stem cells (iPSCs) and can recapitulate some of the complex architectures of the human tissue in vivo [1,2]. As they provide a human-specific platform for in vitro studies, there is a strong motivation to continue enhancing their capabilities. Media formulations in particular have profound effects on hCO derivation. A major focus in the field has been identifying combinations of morphogens to mimic and capture different regions and cell types of the brain [3,4,5,6,7,8,9,10,11,12].
Basal media components also govern cell differentiation, but their role is understudied. These components are largely derived from traditional formulations created decades ago for immortalized cell lines; as such, media used for hCO generation have non-physiological concentrations of several media components, particularly glucose. Studies comparing hCOs grown ex vivo to those transplanted into a mouse brain hint at the non-physiological aspects of culture media altering cell type composition and contributing to low fidelity and reproducibility in hCO cultures [13]. Organoids mimicking other tissues have also shown that media glucose concentrations of 25 mM or higher can promote phenotypes including impaired differentiation, disrupted tissue structure, and increased inflammation [14,15,16]. Similarly, a previous study of 3D embryoid bodies suggests that glucose concentration in the media affects growth and morphology [17]. Indeed, studies in 2D cultures have found that modifying nutrient concentrations in the media to match physiological levels might improve neuronal differentiation, maturation and function [18,19].
We focus here on the potential role of glucose since it is the primary source of carbon and energy [20,21,22]. Moreover, it interacts with other metabolic and cell signaling pathways to contribute to cell fate decisions [23,24,25,26,27]. hCOs have been used to study the role of glucose in disease states such as diabetes [28] and ischemia [29]. However, its role during standard hCO development is often overlooked. Importantly, typical hCO protocols supply hyperglycemic quantities of glucose to pluripotent stem cells [17,30] and raise practical questions about the physiological relevance of conclusions drawn from these conditions and if current conditions should be modified.
In this study, we investigated the morphological and cell type differences between standard high- (13–17 mM) versus low-glucose (~3.5 mM) conditions for hESC- and iPSC-derived hCOs through their early stages of development. It is important to note that, while the low glucose levels used in this study were chosen to reflect those expected under physiological conditions, the precise in vivo concentrations are not known [31]. In addition, the low-glucose conditions reflect a low metabolizable glucose state, since L-glucose was added to match the osmolarity of high-glucose conditions. We demonstrate that low-glucose conditions can support hCO growth for ~10 days, although the growth rates, which correlate with glucose consumption patterns, are expectedly slower than high-glucose conditions. Interestingly, even at low concentrations, glucose in the media does not appear to be fully consumed between media changes. Nevertheless, we observe that for multiple cell lines, low glucose leads to loss of neurodevelopmental cell types. However, for H9 ESC-derived hCOs, the slower growth rate and lost cell types in low-glucose conditions can be partially rescued by inhibiting the mTOR signaling pathway. Additionally, we find that each PSC line used in this study has a unique phenotypic response to glucose levels during hCO generation, drawing attention to the inherent variability of hCO models.

2. Materials and Methods

2.1. Human Pluripotent Stem Cell (hPSC) Culture

Eight hPSC lines were procured from the following sources: H9—WiCell; GM26077, GM25256, and GM23279—Coriell Institute for Medical Research; SF6987, BT2657, BW3595, and BT2657—the Human Embryonic/Induced Pluripotent Stem Cell Core at Yale School of Medicine Research. Additional information about the cell lines can be found in Table S1. All cell lines were maintained on growth factor-reduced Matrigel (Corning Inc., Corning, NY, USA) coated 6-well plates (COSTAR, Corning Inc., Corning, NY, USA) in mTeSR Plus (StemCell Technologies, Vancouver, BC, Canada). Cells were passaged every 3–5 days as necessary using 0.5 mM EDTA (Invitrogen, Carlsbad, CA, USA).

2.2. hCO Culture

Whole-brain hCOs were generated and maintained by modifying the protocol in [32]. hPSCs were allowed to reach 80–90% confluency before they were dissociated into a single-cell suspension using Accutase (BioLegend, San Diego, CA, USA) and re-plated in low-adhesion U-bottom 96-well plates (Corning COSTAR, Fisher Scientific, Waltham, MA, USA) at 10,000–13,000 cells/well. DMEM/F12 was used as the basal media for hCO generation. DMEM/F12 without glucose and L-glutamine (Biowest Inc., Bradenton, FL, USA) was first supplemented with 2.5 mM Glutamax (Gibco, Waltham, MA, USA). For high- and low-glucose conditions, glucose (Gibco, Waltham, MA, USA) was added to DMEM/F12 at 17.5 mM and 3.77 mM, respectively. For the low-glucose media, L-glucose (MilliporeSigma, Burlington, MA, USA) was added to a concentration of 13.73 mM to control for osmolarity. For the hPSC growth stage (days 0–6) and the neural induction stage (days 6–11), the media consisted of ~76% and ~97% v/v DMEM/F12, respectively. The other media components for the hPSC growth stage included 19% KnockOut Serum Replacement (KOSR—Gibco, Waltham, MA, USA), 3% Fetal Bovine Serum (FBS—Avantor, Radnor, PA, USA), 1% GlutaMAX (Gibco, Waltham, MA, USA), 1% MEM-Non-Essential Amino Acids (Cytiva, Marlborough, MA, USA), and 100 μM 2-mercaptoethanol (Amresco, Solon, OH, USA). 50 μM Y-27632 (StemCell Technologies, Vancouver, BC, Canada) and 4 ng/mL bFGF (Invitrogen, Carlsbad, CA, USA) were added until Day 4. Glucose concentrations for KOSR and FBS were measured using the Cedex® Bio Analyzer (Roche Diagnostics, Rotkreuz, Switzerland) to calculate the final glucose concentration in the media. For the neural induction stage, the media also consisted of 1% GlutaMAX, 1% MEM-Non-Essential Amino Acids, 1% N2 Supplement (Gibco, Waltham, MA, USA), and 1 μg/mL Heparin (Sigma Aldrich, Burlington, MA, USA). Partial media changes were performed every two days, with a complete media change on Day 6 to switch media types.

2.3. hCO Size Measurement

Images for size measurement were taken using an epifluorescence microscope with a documentation camera with a 4X objective (Nikon Instruments, Tokyo, Japan). Quantifications were performed manually in FIJI [33]. The sizes of hCOs presented in each graph were normalized to the corresponding average size in low glucose on Day 2. The numbers of hCOs measured for each experiment can be found in Table S2.

2.4. Glucose Uptake Measurement

hCOs were grown as described above. During media changes every other day, a pre-defined volume of media was removed from each well (75 μL on Day 2, 100 μL on Day 4, and 175 μL on Days 6 and 8) and spent media from 10 hCOs (8 for GM25256) were pooled into 1 sample. Three such samples were collected for each condition, time point, and cell line. Samples were centrifuged at 300× g for 5 min to remove cell debris, and identical volumes of supernatant were frozen at −80 °C until analysis. Fresh media were similarly stored in triplicates and used as controls for the measurement. Glucose concentrations were measured on the Cedex® Bio Analyzer (Roche Diagnostics, Rotkreuz, Switzerland) using the Glucose Bio kit. A pre-defined volume of fresh media was added to each well during each media change (150 μL on Days 2 and 4, 200 μL on Days 6 and 8). Volume fractions of spent and fresh media on each day were used to calculate the resulting glucose concentration after media changes, i.e., the glucose availability on that day. Consumption rates are calculated on a per day basis.

2.5. Phenotype Characterization

Brightfield images of hCOs were captured at 4X magnification on an epifluorescence microscope with a documentation camera (Nikon Instruments, Tokyo, Japan) every other day from Day 2 to Day 10. hCOs were scored for 2 features—presence of an organized epithelial layer and cyst-like appearance. Three levels of scores were used for each feature: 0—complete absence of the feature; 0.5—partially developed/visible feature; 1—fully developed/clearly visible feature. All the hCO images were manually scored. For graphical representation, the epithelial layer was displayed on the x-axis and cyst-like features were displayed on the y-axis. Each axis had 3 bins corresponding to the 3 scoring levels forming a 3 × 3 grid. Thus, each grid cell corresponds to one pair of coordinates or one type of hCO. Morphology distribution in both glucose conditions at each time point was represented as a bubble plot, with the size of the bubble indicating the relative abundance of hCOs within a grid cell. Bubble sizes in each plot were scaled to the highest frequency within that plot. For each axis, +0.05 and −0.05 from the actual coordinates were used to stagger the scores to keep bubbles within the same grid cell visually separated. Relative positions of bubbles within each grid cell have no physical meaning. Comparison should be made across grid cells as a whole.

2.6. Histology and Immunofluorescence

Tissues were fixed in 4% paraformaldehyde for 20 min at 4 °C followed by washing in 1X PBS (Gibco, USA) three times for 10 min each. Tissues were allowed to equilibrate in 30% sucrose overnight and then embedded in 10%/7.5% sucrose/gelatin. Embedded tissues were frozen in an isopentane and dry ice bath at −30 to −50 °C and stored at −80 °C. Prior to analysis, they were cryosectioned into 20–30 μm slices using a CryoStar NX50 cryostat (ThermoFisher, Waltham, MA, USA; Epredia, Kalamazoo, MI, USA). For immunostaining, sections were selected to include at least one central section for each hCO, along with a non-central section. The sections were blocked and permeabilized in 1% Triton X-100 and 5% normal donkey serum (Jackson Immunoresearch Labs, West Grove, PA, USA) in 1X PBS. hCO sections were then incubated with primary antibodies in 10% Triton X-100, 1% normal donkey serum in UltraPure water (Invitrogen, Carlsbad, CA, USA) and 10X PBS overnight at 4 °C at the following dilutions: SOX2 (goat, R&D Systems, Minneapolis, MN, USA, 1:200), PAX6 (rabbit, abcam, Cambridge, UK, 1:100), Ki67 (rabbit, abcam, Cambridge, UK, 1:150), TUJ1 (mouse, MilliporeSigma, Burlington, MA, USA, 1:500), and phospho-vimentin (mouse, MBL International, Schaumburg, IL, USA, 1:200). Following primary antibodies, sections were incubated with secondary antibodies—donkey Alexa Fluor 488, 546, and 647 conjugates (Invitrogen, Carlsbad, CA, USA, 1:250) in 10% Triton X-100, 1% normal donkey serum in UltraPure water, and 10X PBS for 2 h at room temperature, and the nuclei were stained with DAPI (Invitrogen, Carlsbad, CA, USA). Slides were mounted using ProLong Antifade Diamond (Invitrogen, Carlsbad, CA, USA). Images were taken with a Nikon A1R confocal microscope (Nikon Instruments, Tokyo, Japan).

2.7. Image Analysis and Quantification

All images within a batch for each cell line were captured using identical microscope settings for each channel and identically processed in FIJI [33] to create a maximum intensity z-projection, subtract background, and adjust channel intensities. A CellProfiler-automated pipeline was used to identify nuclei (DAPI) and quantify other cell type markers as a fraction of DAPI counts in each image. For nuclear markers (SOX2, PAX6, and Ki67), DAPI+ regions that showed overlapping signal for these markers were selected. For cytoplasmic markers (TUJ1 and phospho-vimentin), DAPI+ regions that were enclosed by signals for these markers were selected. Representative pipelines used in CellProfiler are available in the Supplementary Materials. The values of parameters within the pipeline were independently selected to optimize quantification for each batch of a cell line. The number of hCOs measured in these experiments can be found in Table S4.

2.8. Inhibitor Treatment

H9 ESCs were chosen for inhibitor treatment due to their relatively greater reproducibility in high and low glucose. Rapamycin (MedChemExpress, Monmouth Junction, NJ, USA) was reconstituted in DMSO (FisherScientific, Waltham, MA, USA) and was used at a final concentration of 20 nM in the media during hCO generation and replenished at every subsequent media change. Identical volumes of DMSO were added at each stage for vehicle control. Size measurement, phenotype characterization, and cell type marker quantification were performed as mentioned above.

2.9. ROS Measurement

hCOs were incubated with 100 μM 2′,7′-dichlorodihydrofluorescein diacetate (DCFH-DA) (Sigma-Aldrich, Burlington, MA, USA) in DMEM/F12 (Biowest, Bradenton, FL, USA) at 37 °C for 1 h. hCOs were washed twice in PBS before lysing using 1% Triton in PBS on ice for 30 min. The lysate was centrifuged at 10,000× g for 10 min at 4 °C and the supernatant was used for further measurements. Fluorescence of each sample was measured at an excitation wavelength of 485 nm and an emission wavelength of 530 nm using a TECAN (Zurich, Switzerland) plate reader. Total protein concentration of each sample was obtained using the BCA assay (Invitrogen, Carlsbad, CA, USA) according to the manufacturer’s instructions. ROS levels were calculated by dividing the fluorescence measurements by the total protein concentration. For each time point, all ROS values were then normalized to the average ROS in high glucose.

3. Results

3.1. Glucose Affects hCO Growth Rate

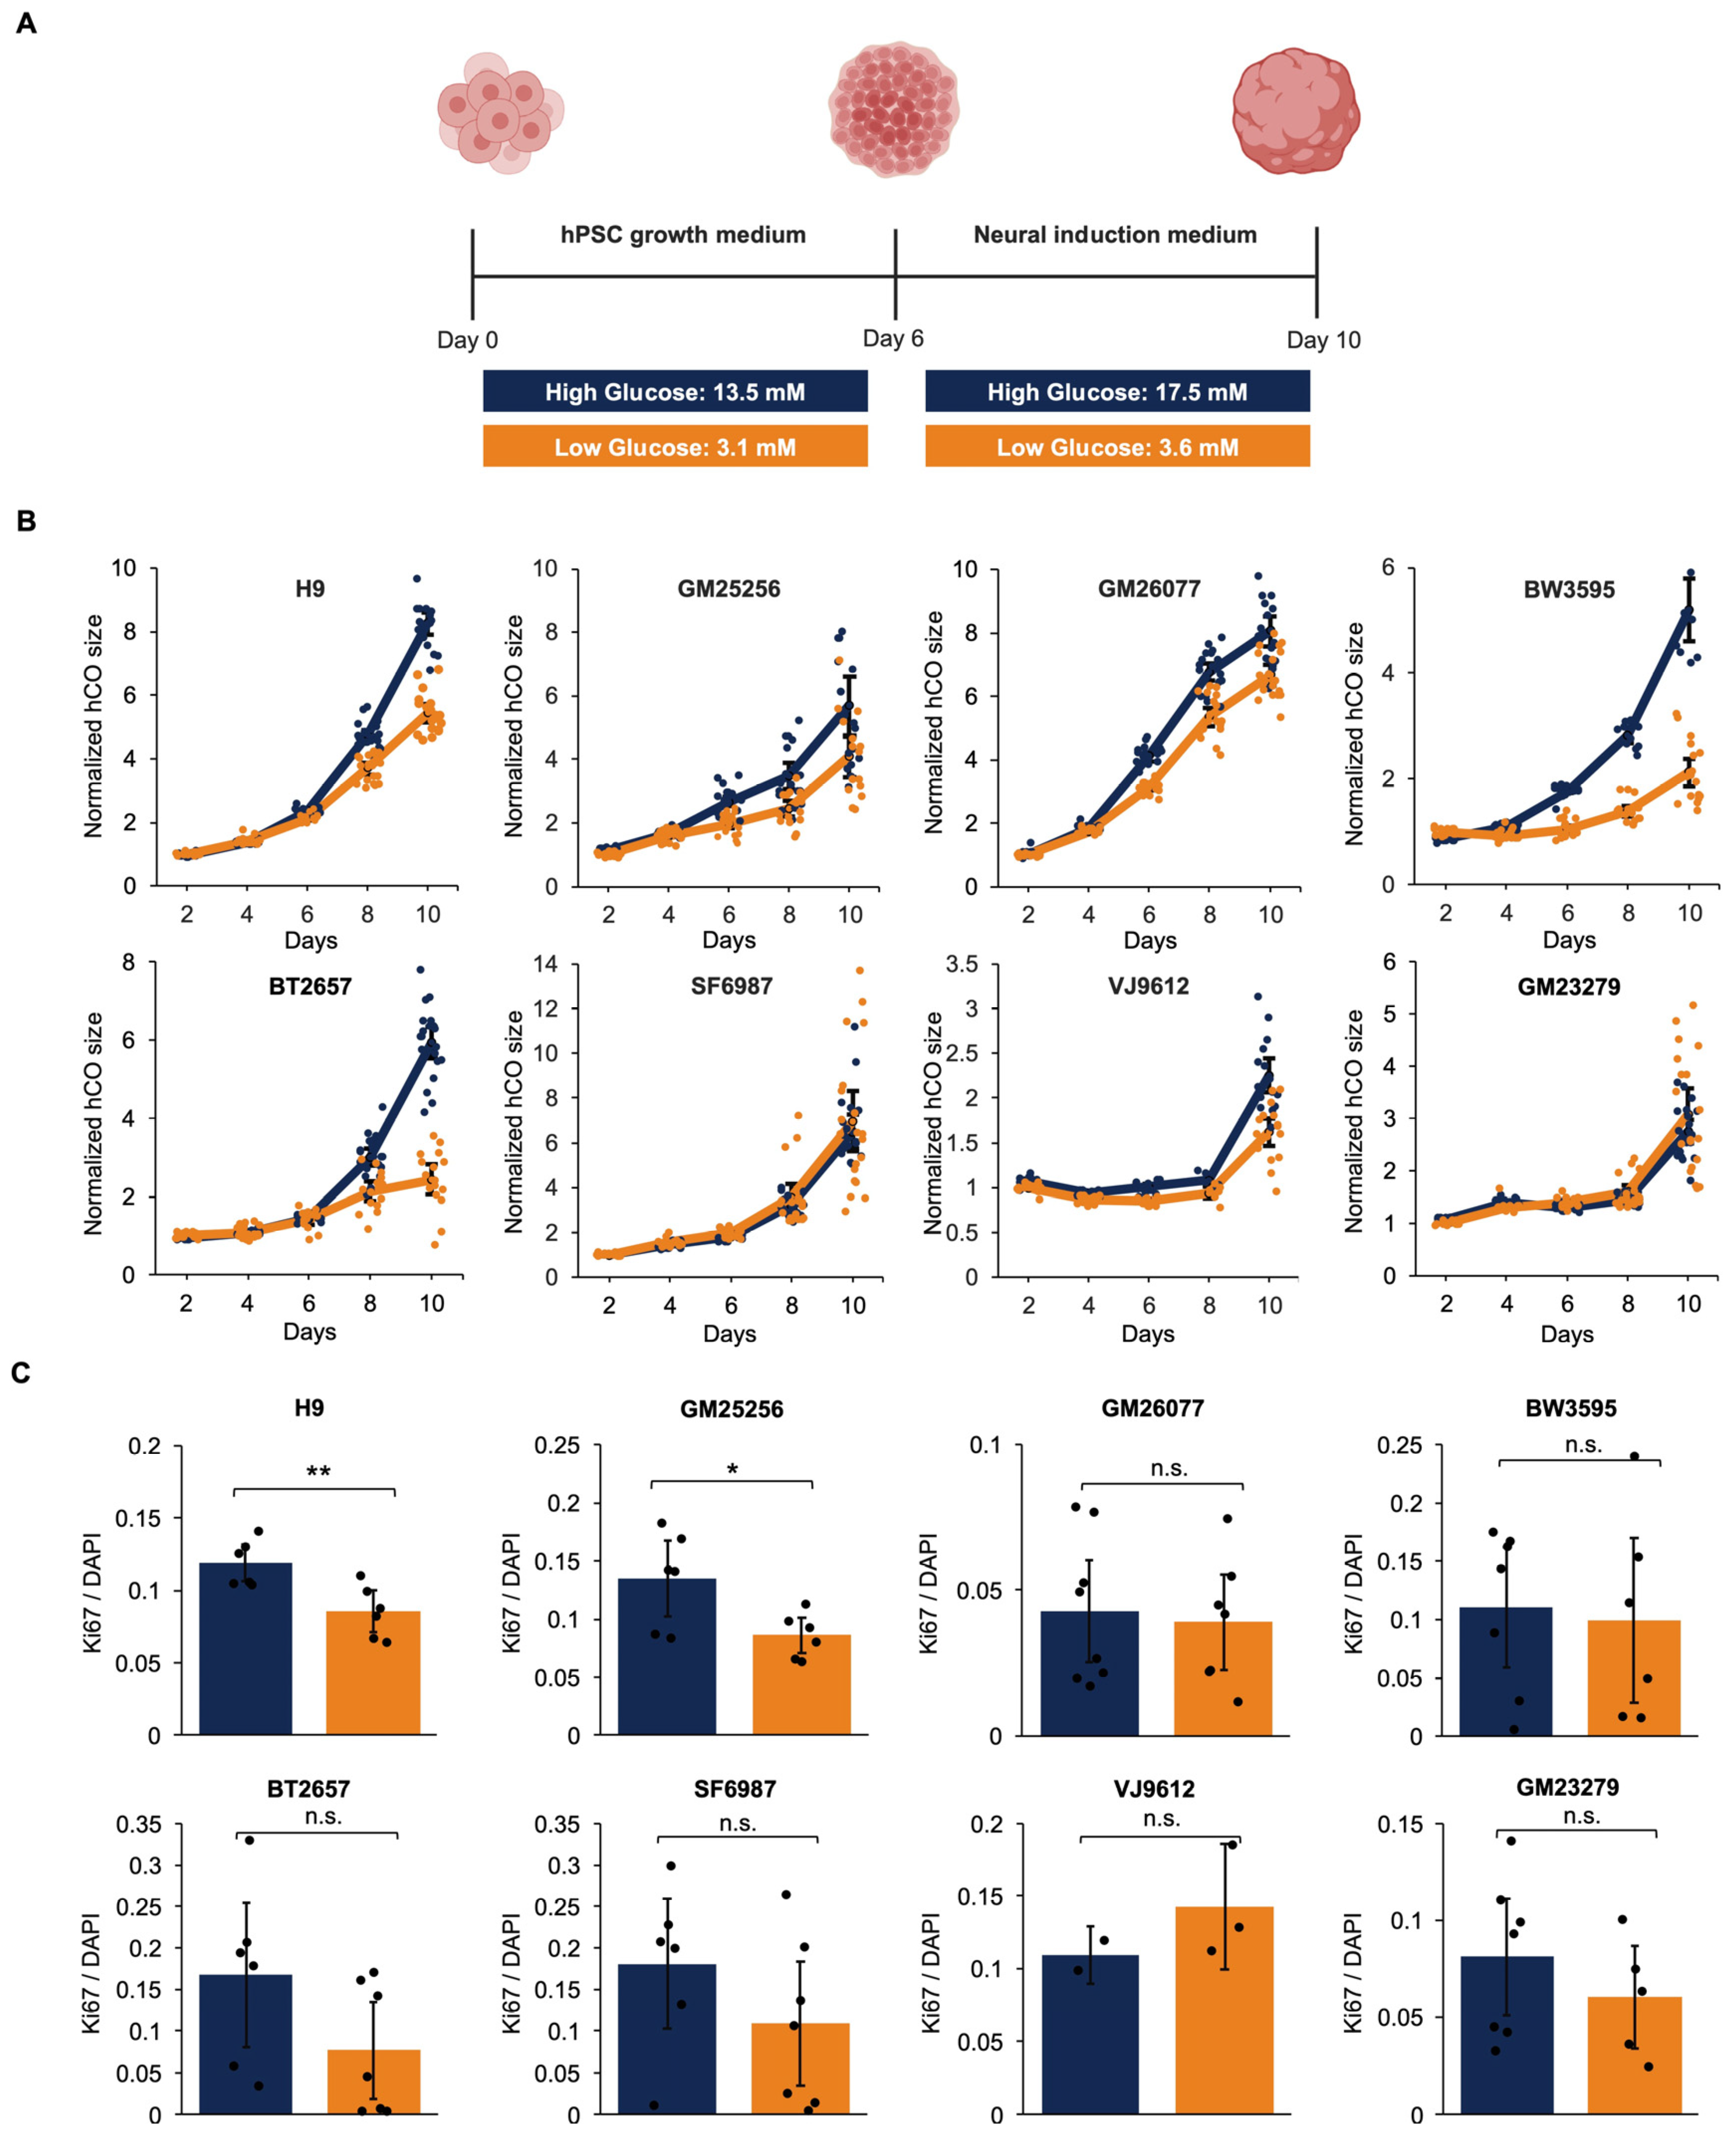
To assess the impact of glucose levels on early hCO growth, we observed whole-brain hCOs generated with the Lancaster protocol for 10 days [32]. These hCOs are derived from eight distinct hPSC cell lines. Two stages of early development are covered in this time frame—hPSC growth/embryoid body formation and neural induction. To mimic conditions close to those expected in vivo, we used 3.1–3.6 mM glucose in the media for 10 days (Figure 1A). This concentration range is based on the typical glucose concentrations that human embryos are exposed to in utero [34] and the levels used in in vitro embryo cultures [31]. Up to 10 days in culture, we observed that low-glucose conditions support hCO growth. It is important to note that the specific magnitudes of growth rates in both high- and low-glucose conditions are cell line- and batch-dependent (Figure 1B; Figure S1). The sizes of hCOs in high- vs. low-glucose conditions on Day 4 were comparable. However, after 10 days, a majority of batches (~75%) yielded smaller hCOs in low-glucose conditions. Interestingly, while the final hCO sizes were smaller, the fraction of proliferative cells (marked by Ki67) in the hCOs on Day 10 was significantly lower in only ~25% of low-glucose hCO cultures (Figure 1C).

3.2. Glucose Conditions and Growth Stage Influence Morphological Heterogeneity in hCOs

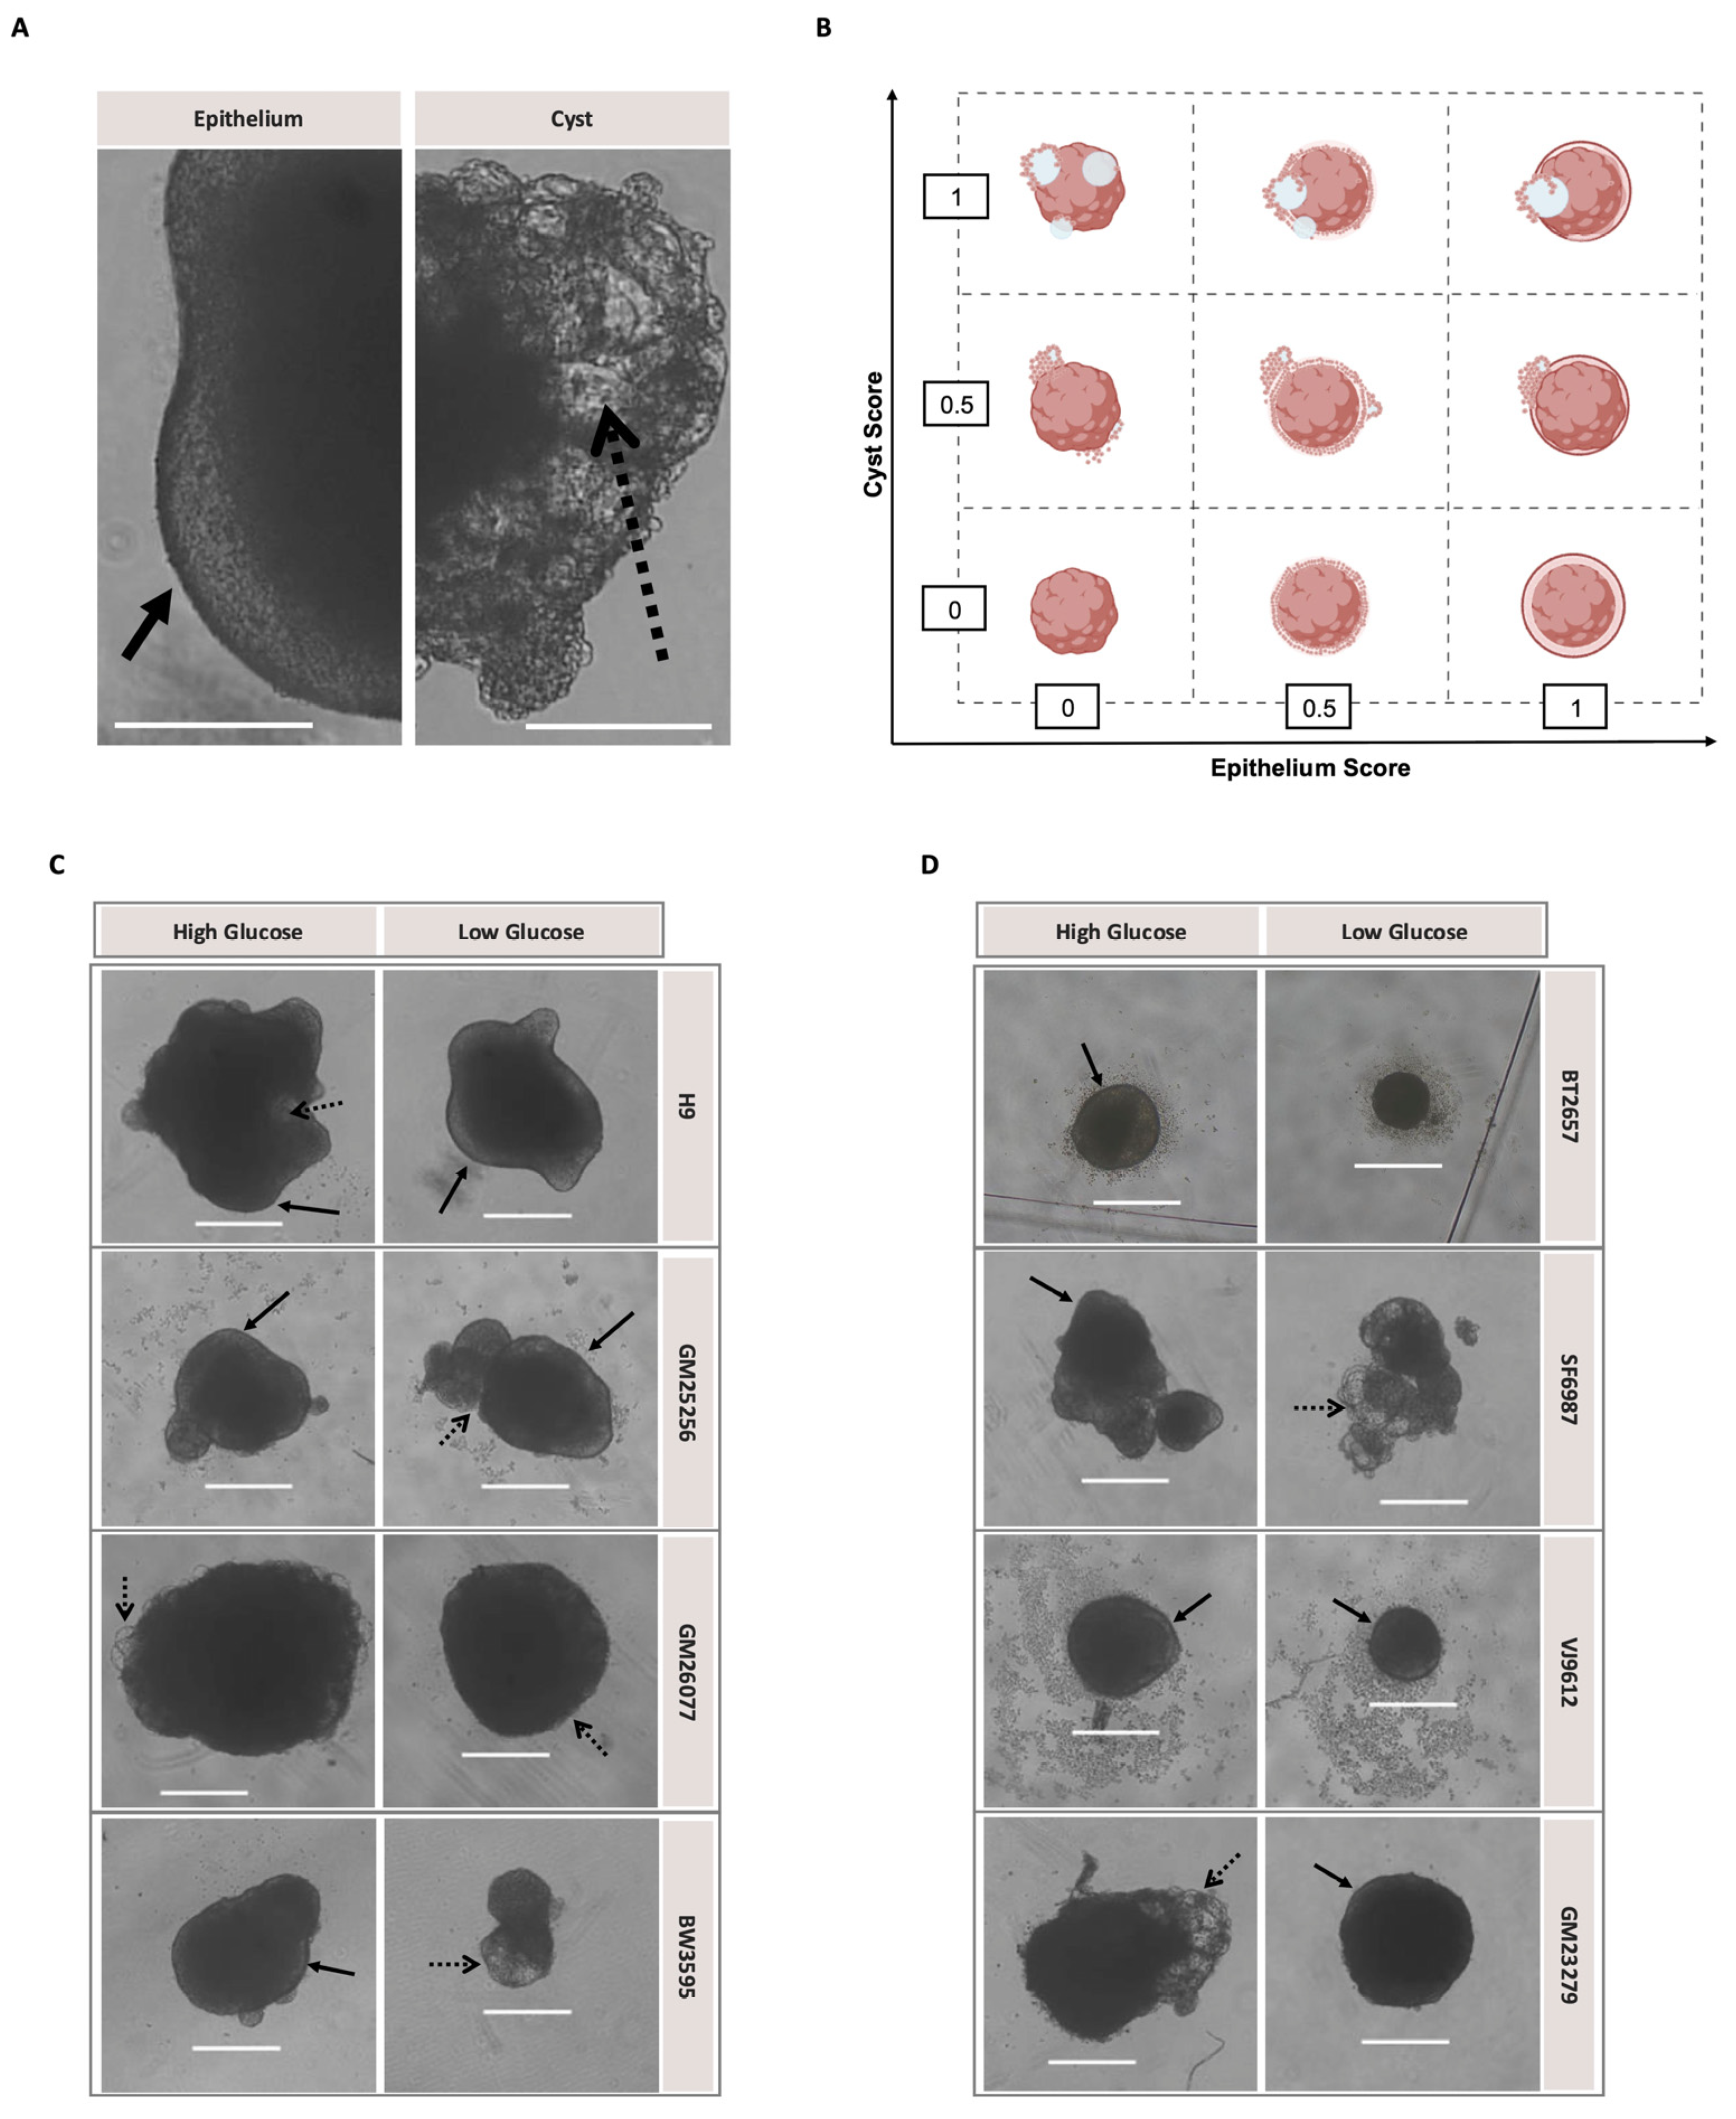
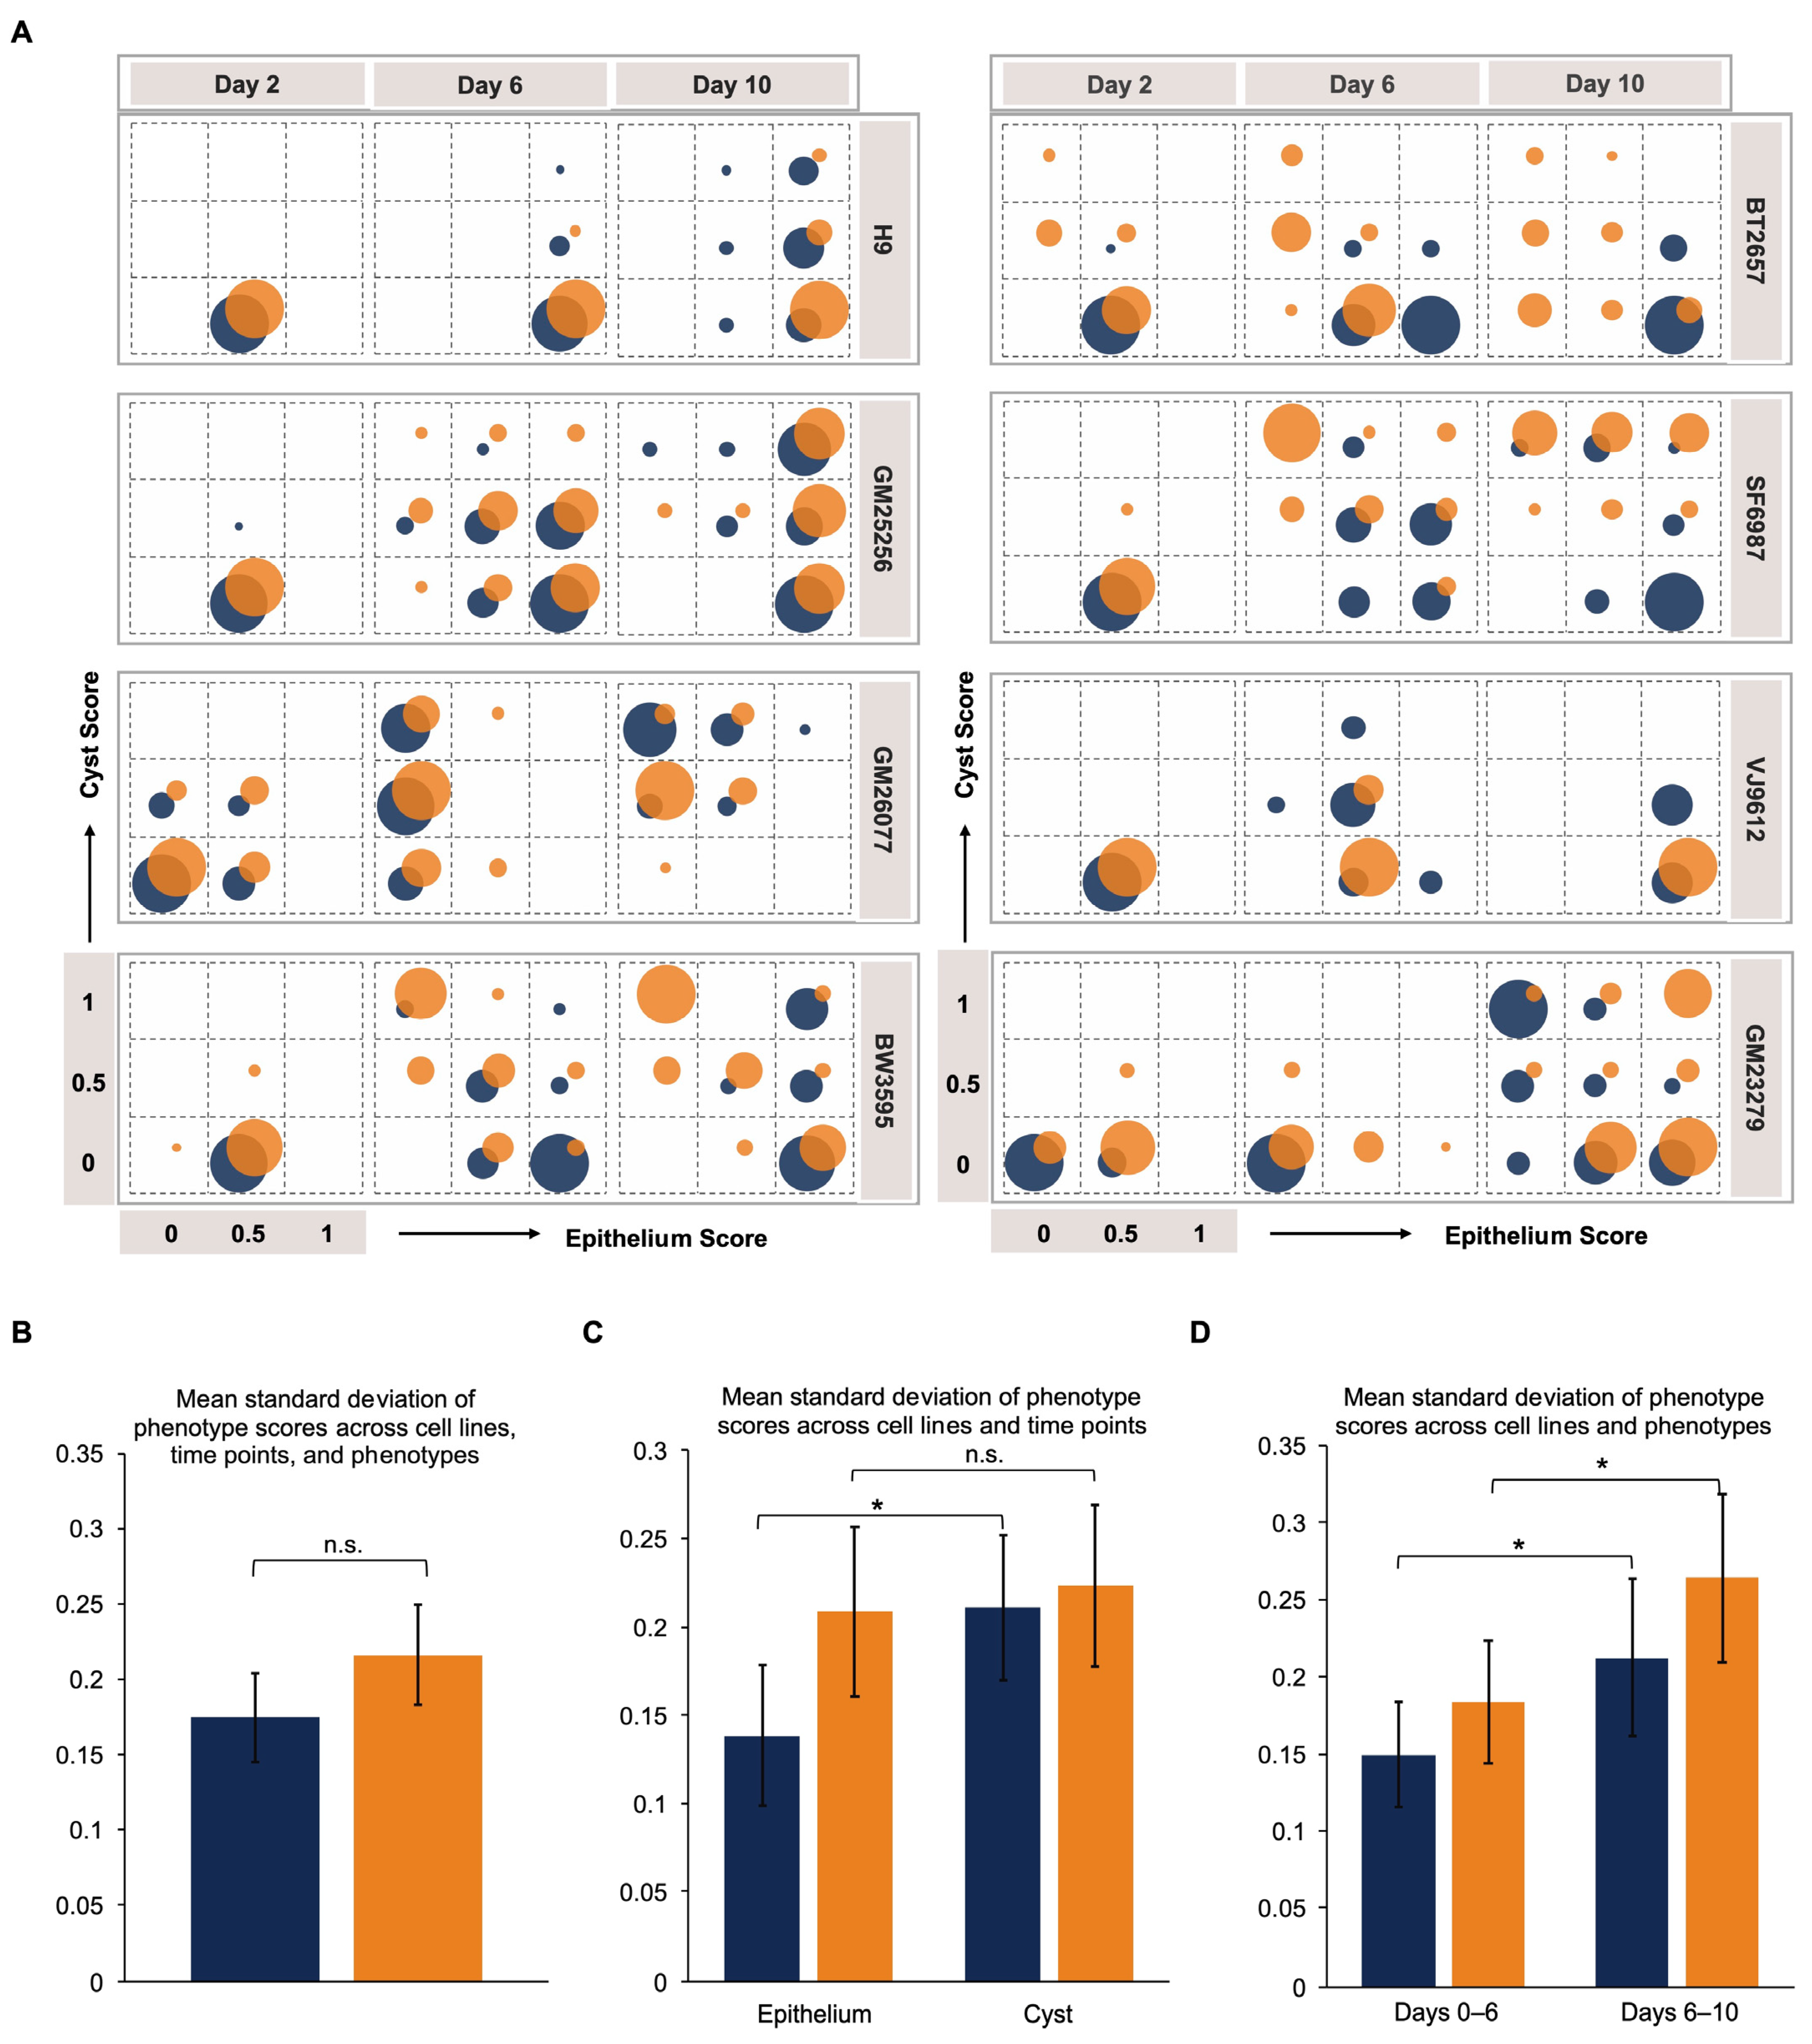
Phenotypic variability is commonly observed within and between cell lines [35]. Here we observed morphological diversity in hCOs derived from different cell lines along with diversity in glucose-induced effects. Eleven types of hCO morphologies were observed over 10 days. Dimensionality reduction identified two dominant morphological features—epithelial layer and cyst formation (Figure 2A). hCOs were scored for these two features to enable quantitative comparison (Figure 2B). The expectation based on standard hCO protocols is that with time, hCOs should start showing a prominent epithelium layer [32]. However, we observe that one of the eight cell lines (GM26077) showed limited epithelial layer formation in typical cultures conditions, while three additional cell lines had a reduction in this phenotype in low glucose (BW3595, BT2657, GM23279) (Figure 2C,D, Figure 3A and Figure S2). In addition to the phenotypes themselves, we explored whether the magnitude of the variabilities in morphologies exhibit noticeable differences between conditions. The variabilities are represented by the standard deviation of the phenotype scores (Figures S3 and S4). Across time, cell lines, and features, the variability between high- and low-glucose conditions is comparable (Figure 3B). Comparison between the two features demonstrates that in high glucose, cyst formation is more variable than epithelial layer formation. However, the variability between the two features is similar in low glucose and slightly higher than that in high glucose (Figure 3C). Notably, morphological variability for both glucose conditions increased in the neural induction stage after Day 6 compared to the hPSC growth stage (Figure 3D).

3.3. Glucose Consumption Increases in the Neural Induction Stage

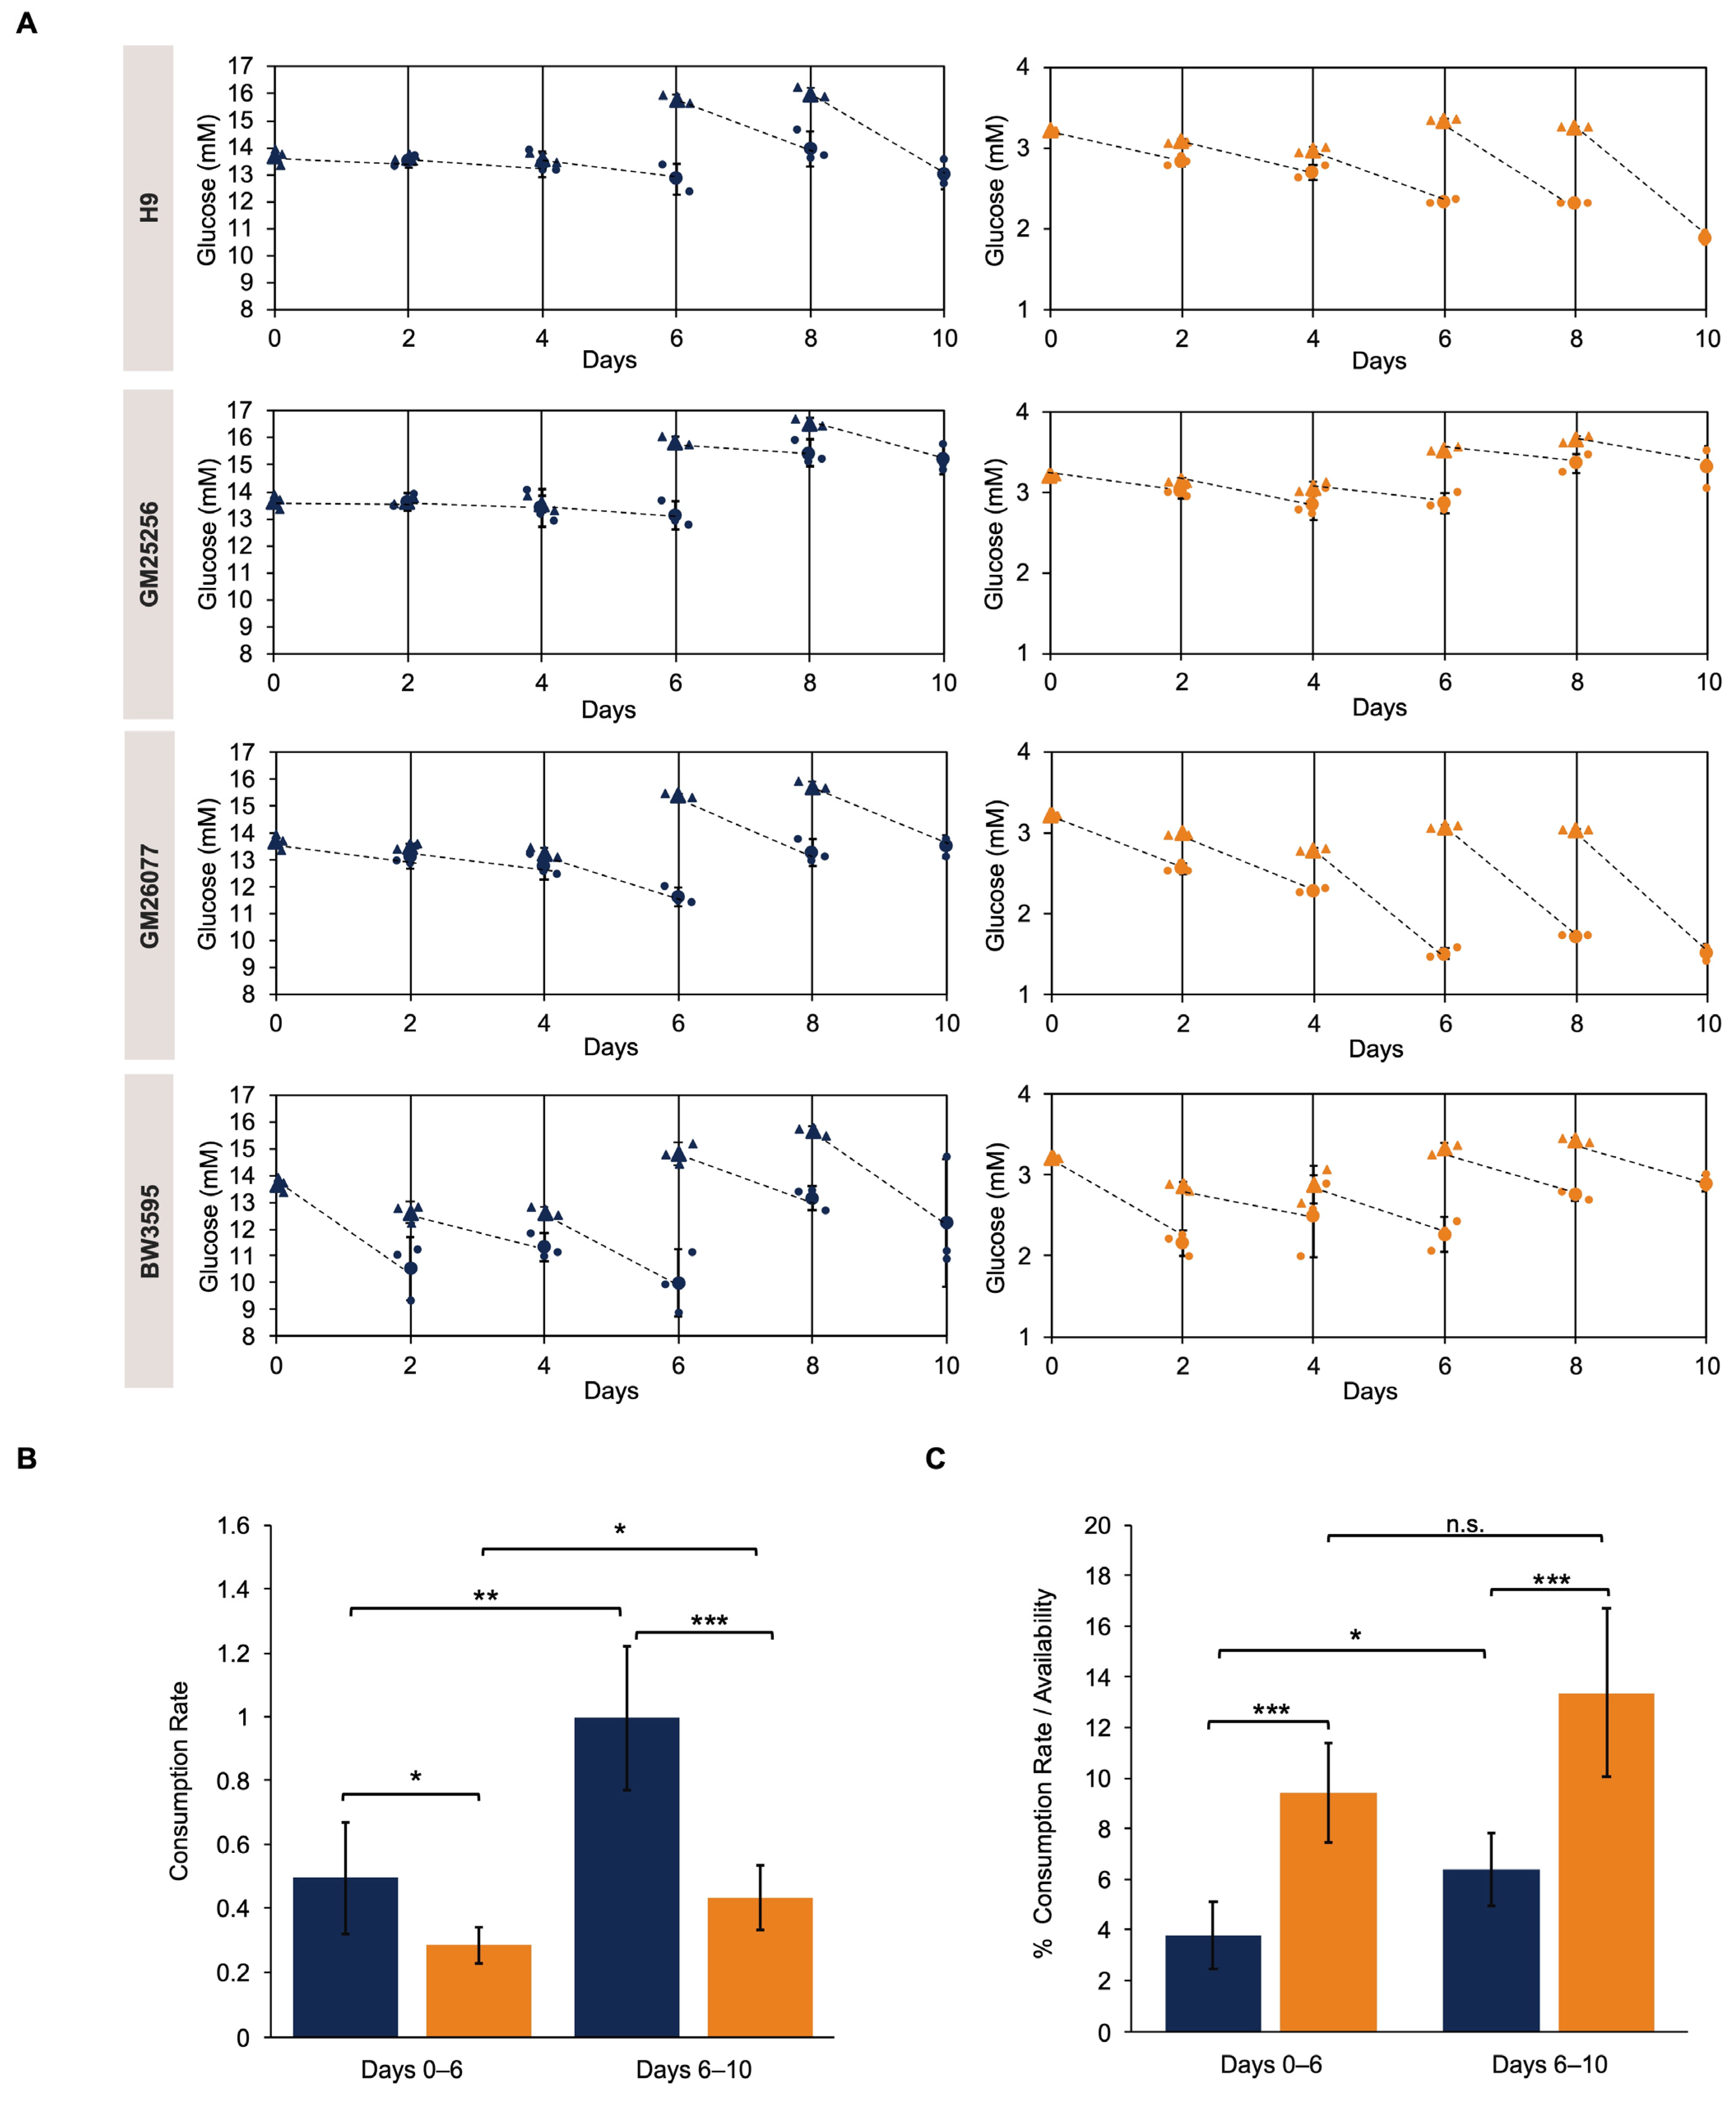
We next asked how glucose concentrations might be driving hCO phenotypes. Potential osmotic effects were controlled for through the use of L-glucose to maintain equivalent osmotic pressure in all conditions. Therefore, we hypothesized that differences in glucose consumption rates between cell lines contribute to the observed morphological variation. Additionally, there is a possibility that hCOs might be completely deprived of glucose between media changes if their consumption rates are high enough. To address this, we selected four cell lines that captured different derivation methods as well as phenotypic responses (Table S1), generated hCOs, and measured their glucose consumption over time. At each media change, spent media was collected, and their glucose levels were measured. Glucose consumption over time exhibited some common as well as cell line specific patterns (Figure 4A). We observed that even under low-glucose conditions, hCOs were never entirely deprived of glucose, with at least ~1 mM remaining at all times. In high-glucose conditions, hCOs consumed more total glucose (Figure 4B); however, the fraction of available glucose consumed was higher under low-glucose conditions (Figure 4C). Furthermore, glucose consumption increased during the neural induction stage compared to the hPSC growth stage, under both high- and low-glucose conditions, likely due to the presence of more cells at this stage (Figure 4B,C).

3.4. Low-Glucose Conditions Result in the Loss of Neurodevelopmental Cell Types in a Cell Line-Dependent Manner

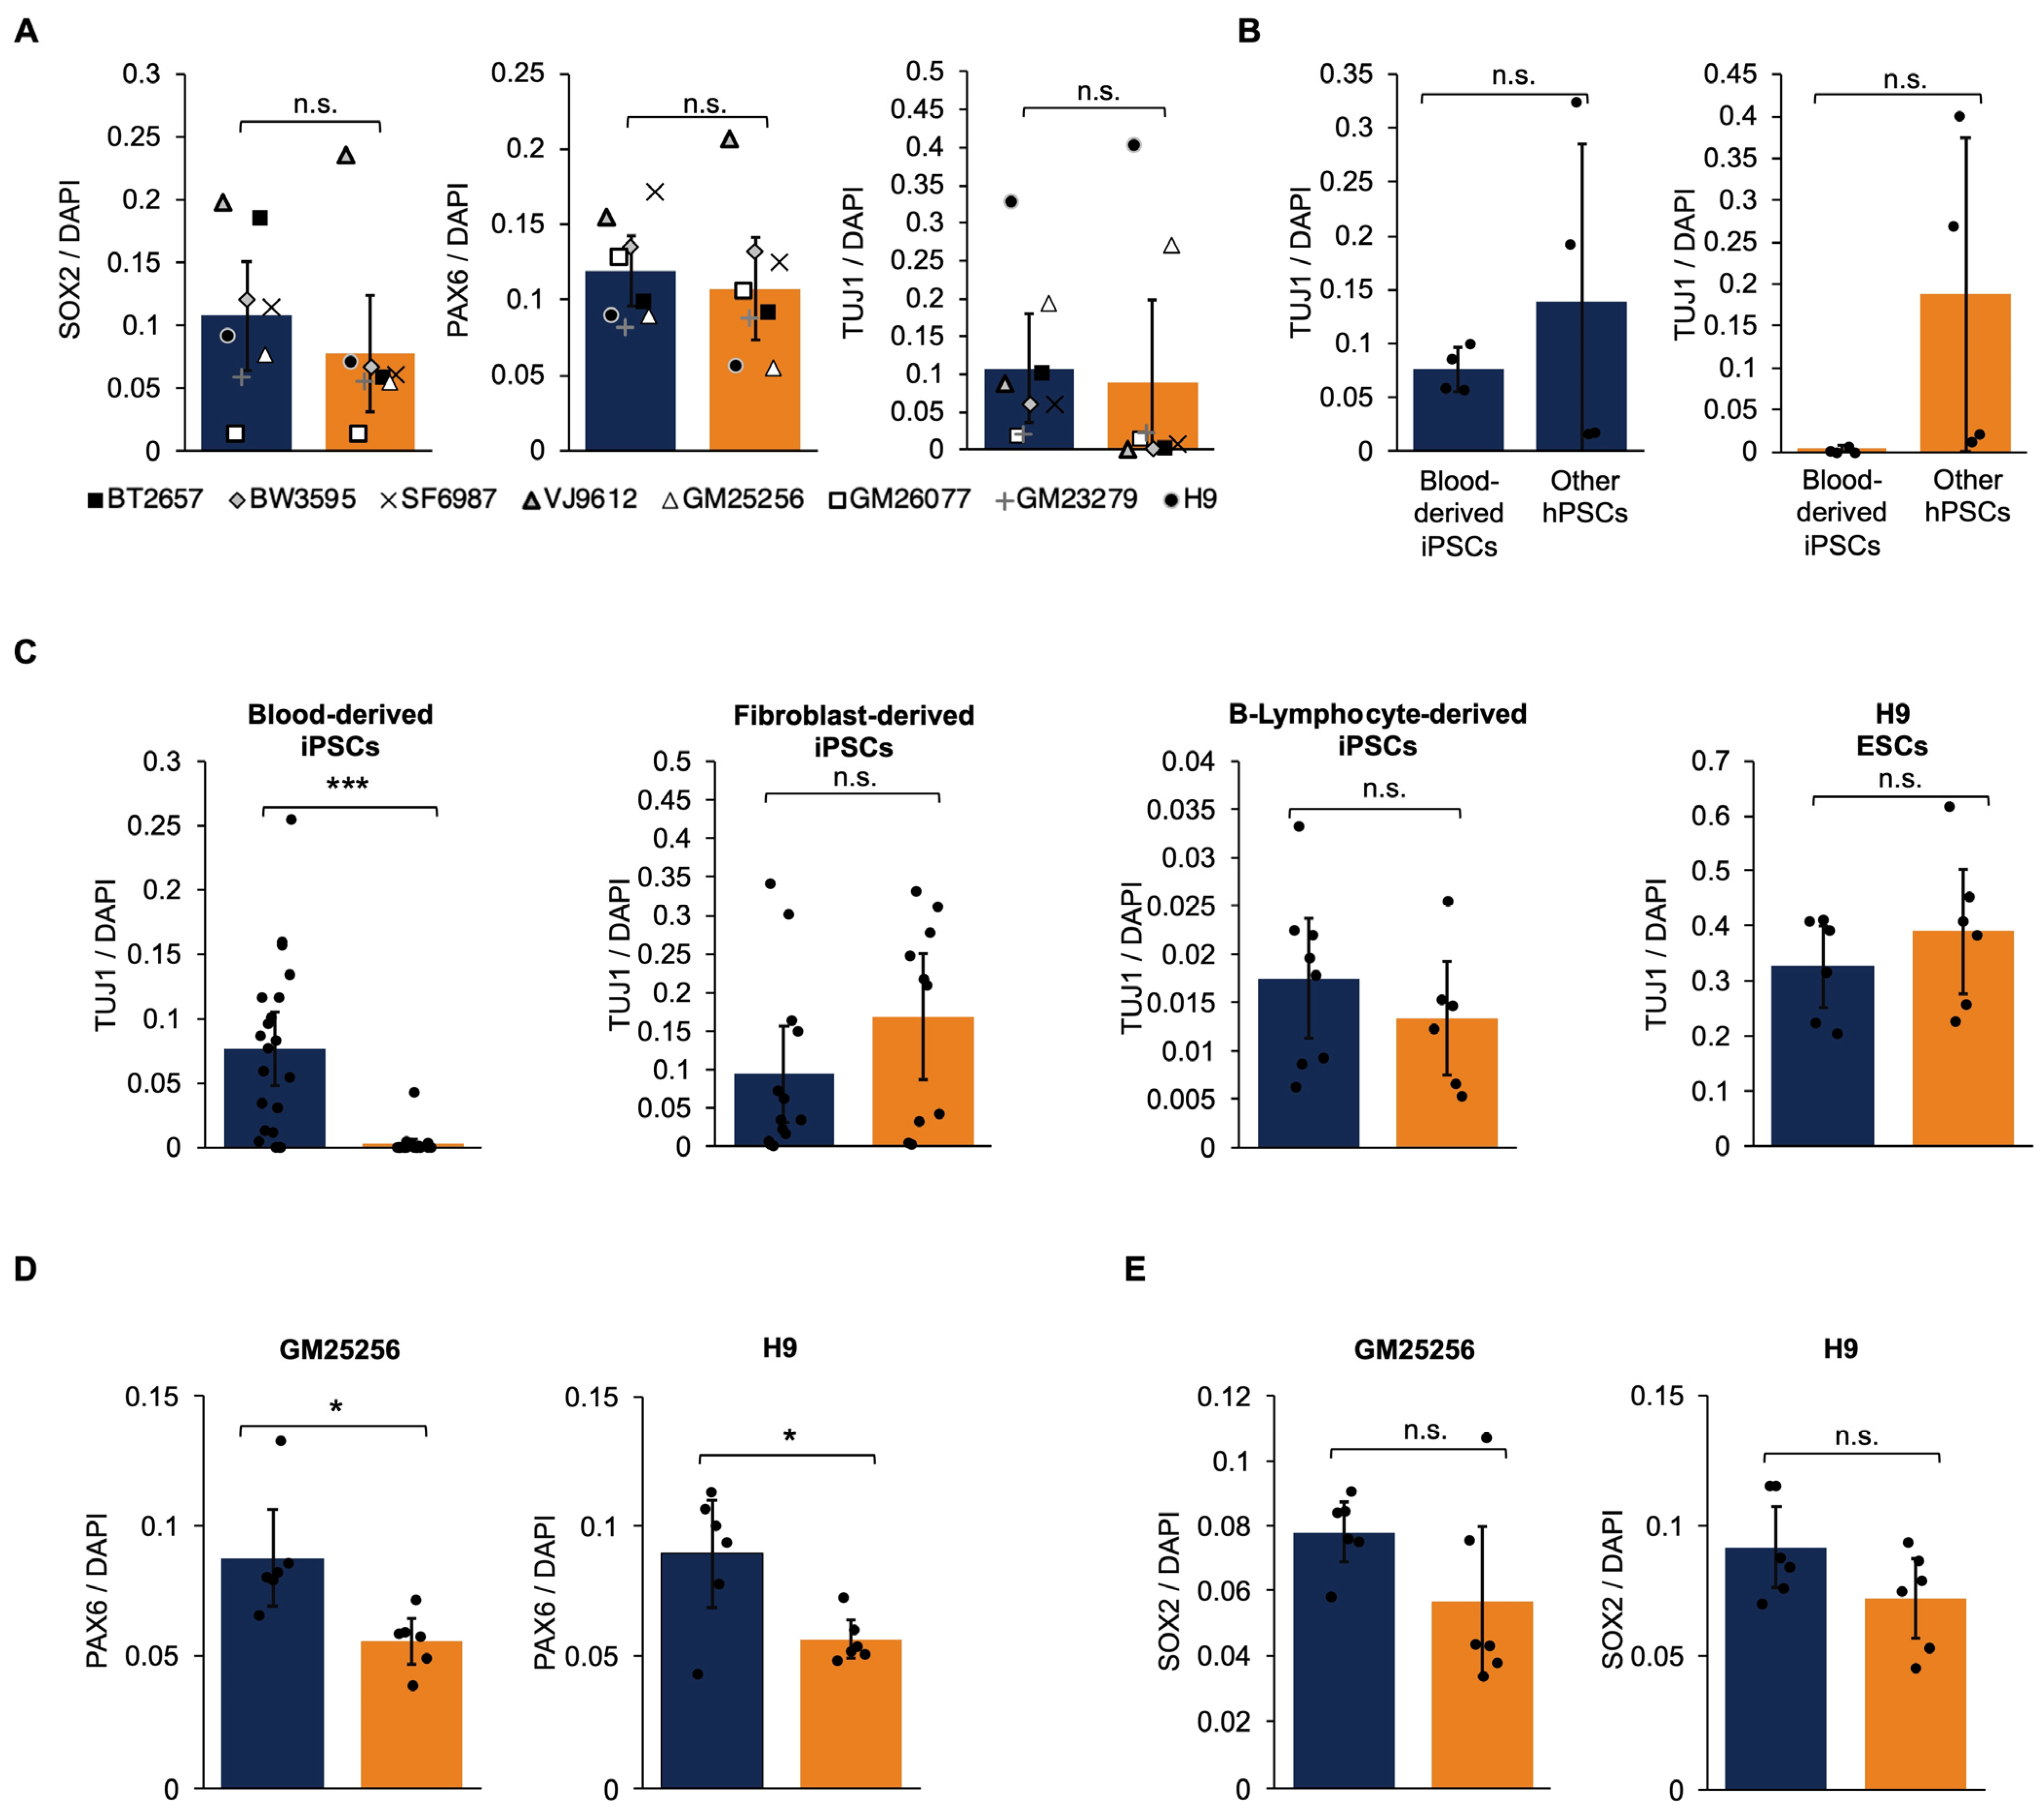
Alterations in cellular metabolism, exhibited here by variable glucose consumption, are known to impact differentiation patterns in hCO models [36]. Therefore, to investigate potential variations in differentiation and cell type composition, we quantified fractions of common neurodevelopmental cell types in 11 day old hCOs: SOX2+ neural precursors, PAX6+ neural ectodermal cells, phospho-vimentin+ mitotic radial glia, and TUJ1+ neurons. Averaging all cell lines, the fraction of SOX2+, PAX6+, and TUJ1+ neurons was not affected by low glucose (Figure 5A). However, we also found that hCOs generated from the four iPSCs reprogrammed from blood cells (BT2657, BW3595, SF6987, VJ9612) exhibited lower fractions of TUJ1 than all other lines in low glucose (Figure 5B and Figure S5). In these blood-derived cell lines, low-glucose conditions lead to fewer fractions of neurons, with 14 out of 22 hCOs showing no TUJ1+ expression compared to high-glucose conditions where only 2 of 21 hCOs showed no TUJ1+ expression (Figure 5C). For BT2657, the SOX2+ neural precursor subpopulation was also sparse in low-glucose conditions (Figures S6 and S7). In two cell lines (GM25256 and H9), an intermediate neurodevelopmental cell type,PAX6+ neuroectodermal cells were found to be significantly reduced (Figure 5D and Figures S8 and S9). However, on the contrary, expression of an earlier developmental cell type, SOX2+ neural precursors, remained unchanged between glucose conditions (Figure 5E and Figures S6 and S7). Notably, the GM26077 iPSC line showed lower SOX2 expression, at least ~60% lower than other cell lines, in both high- and low-glucose conditions (Figures S6 and S7). Emergence of phospho-vimentin+ mitotic radial glia was unaffected by glucose availability and consumption across cell lines, with the exception of GM25256 (Figure S10). These results suggest that low-glucose conditions might be suppressing differentiation at an intermediate stage between neural precursors and post-mitotic neurons, and they underscore the potential influence of genotype, donor cell type prior to reprogramming, and glucose levels on varying cell type compositions and developmental trajectories of hCOs.

3.5. Effect of Rapamycin Treatment Is Dependent on Glucose Availability

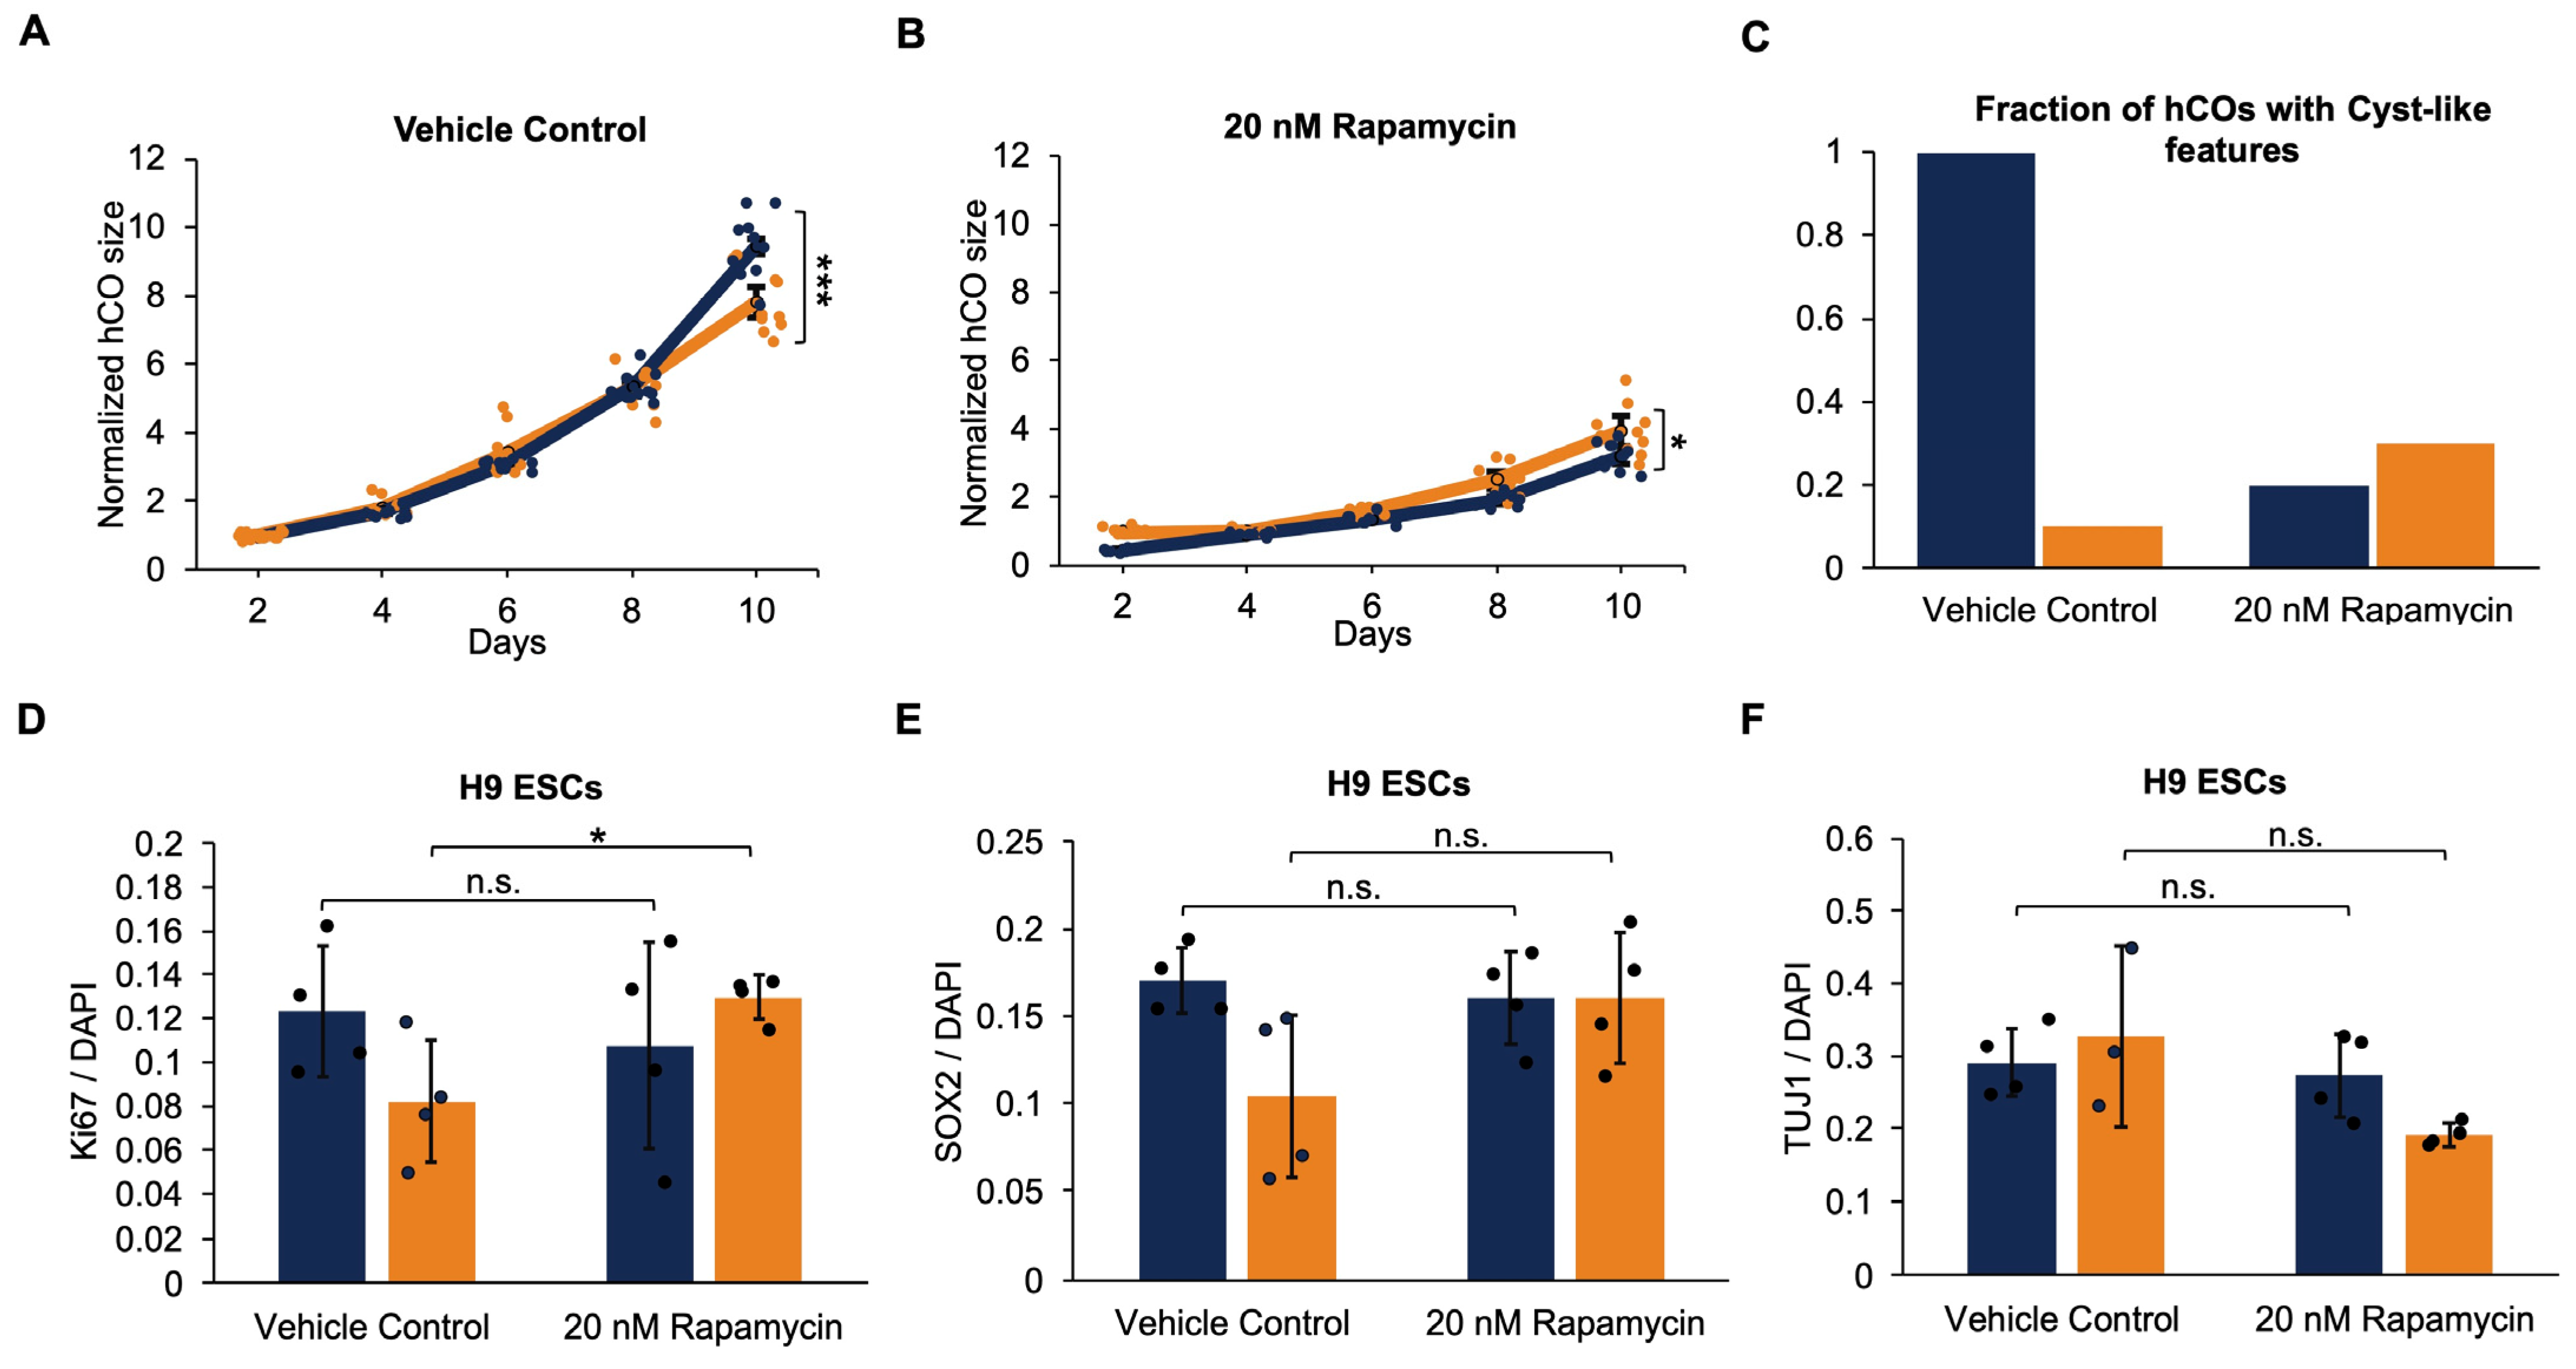
Glucose deficiency has been linked to the inhibition of the mammalian target of rapamycin (mTOR) cellular signaling pathway [37]. To investigate the role of this pathway in glucose-driven morphological and cell type composition changes, we inhibit mTOR using rapamycin in H9-ESC-derived hCOs. H9 hCOs were chosen for this experiment due to their greatest batch-to-batch consistency in growth and morphology in our hands. Over 10 days, hCOs exposed to rapamycin showed slower growth compared to hCOs exposed to vehicle control (DMSO), in both high- and low-glucose conditions (Figure 6A,B), consistent with previous studies showing a negative effect of rapamycin on cell growth [38]. Interestingly, in the presence of rapamycin, low-glucose conditions produced larger hCOs compared to high-glucose conditions, opposite to the trend observed in vehicle control (Figure 6A,B). Additionally, the tendency of hCOs in high glucose to develop cyst-like features was reduced in the presence of rapamycin (Figure 6C and Figure S11A), making it comparable to the morphology under low-glucose conditions. Interestingly, immunofluorescence analysis demonstrated that abundance of Ki67+ proliferative cells in low glucose increased in the presence of rapamycin (Figure 6D). For SOX2+ neural precursors, only some hCOs showed an increase in abundance with rapamycin in low glucose (Figure 6E). Conversely, the fraction of TUJ1+ neurons reduced under low glucose with rapamycin treatment (Figure 6F), albeit the change was not statistically significant. The fractions of all cell types in high-glucose conditions remained unaffected by addition of rapamycin (Figure 6D–F and Figure S11B,C). These results suggest mTOR signaling and glucose levels may have a complex relationship in regulating hCO development and differentiation.

4. Discussion

The goal of this study was to investigate early hCO development in normoglycemic media compared to standard hyperglycemic media; however, there are limitations to the physiological relevance of low-glucose conditions. Firstly, we supplemented the low-glucose media with L-glucose, a non-metabolizable isomer of glucose, to control for osmolarity-associated differences in glucose uptake. Since L-glucose is not commonly produced in the human body, it introduces a non-physiological element to the culture environment. Additionally, due to the lack of vasculature, physiological transport of glucose is not recapitulated in organoids. This could further be diverting glucose uptake from in vivo patterns. Therefore, the low-glucose conditions of this study only capture normoglycemic glucose availability.
We examined whole-brain hCOs derived from eight human pluripotent stem cell lines and tracked glucose-induced changes in growth, morphology, and cell type composition over 10 days. We observe that differences between high- and low-glucose conditions were more pronounced beyond Day 6 across cell lines. Since the culture conditions were switched from a proliferation supporting medium to a neural fate induction medium on Day 6, it is possible that the new media components interacted with glucose differently to drive a greater change in phenotype, particularly morphology. Simultaneously, by Day 6, hCOs were larger, and glucose consumption rates would therefore be expected to increase. So, it might be that low-glucose conditions require more frequent media changes to maintain a minimal level for productive hCO development. Indeed, we observed more substantial depletion of glucose during the latter periods of our experiments (days 6–10, Figure 4A). While there is still some basal level of glucose present at all times, it may be that glucose concentrations are required to be above a minimal level for cells to effectively consume it.
Here, we focused on two prominent morphological features—neuroepithelium and cysts—which have both been previously noted in hCO cultures. While neuroepithelium is deemed as a desired or expected feature for hCOs, tissues with cyst-like features are considered undesirable or failed hCOs [32,39]. GM26077 and GM23279 iPSC-derived hCOs showed limited neuroepithelium formation but cyst-like features emerged even in typical, high-glucose conditions, suggesting the stem cells may not be suitably primed for hCO cultures. A recent study showed that presence of cysts features can also indicate direction towards mesenchymal fate instead of neural fate [40]. The role of glucose in driving this cyst-like phenotype remains unclear, but low-glucose conditions led to loss of neurodevelopmental cell types in multiple cell lines. Some cell lines such as BT2657, BW3595, and SF6987 showed more than 40% increases in cyst-like features and a lack of TUJ1+ neurons in low-glucose conditions. However, conversely, H9-derived ESCs showed a ~70% decrease in cyst-like features in low-glucose conditions, accompanied with no loss of TUJ1+ neurons; they showed significant reduction in PAX6+ neural ectodermal cell populations. Interestingly, prior studies investigating murine neural stem cells show that impaired proliferation [41] and differentiation to neurons [18,42,43], as well as neural tube formation defects [44], are observed in high-glucose (~25 mM) conditions compared to low-glucose (~2–5 mM) conditions. Human cell-based models of neurodevelopment have also shown inhibition of differentiation at hyperglycemic glucose concentrations > 25 mM [26,28,45]. These mixed findings suggest hCO development may be non-linearly affected by glucose levels and exhibit variation based upon the source and derivation of each cell line.
Importantly, our study focused only on early hCO development stages up to 10 days in culture. It is possible that emergence of cell types that appear lost is delayed. Extension of this study to long-term cultures beyond Day 10 would reveal effects of glucose availability on neurogenesis and neuronal maturation. However, it is important to note that later developmental stages introduce more complexity due to increasing organoid sizes. More frequent media changes might be necessary, along with use of bioreactors to ensure glucose transport is not the limiting factor. Furthermore, media in the maturation stages often have more signaling molecules and metabolites that could interact with glucose to drive differentiation [2,32,46].
Previous work has considered the role of glucose in in vitro neurodevelopment in combination with other cell culture media constituents. Prior research with human neural stem cells demonstrated that lowering both glucose and insulin to physiological concentrations supports neurosphere formation and differentiation to cortical fate [47]. Bardy and colleagues developed a novel Brain-Phys medium for human iPSC-derived neurons and showed that physiological media conditions improve electrophysiological properties [19]. Based on these investigations, we speculate that while reducing glucose alone may impair neural fate induction and differentiation, concurrently modulating other interacting metabolites (e.g., amino acids, lipids) and signaling molecules (e.g., insulin) could improve hCO models.
Glucose availability has been linked to shifts in mitochondrial function and reactive oxygen species (ROS) production [48,49]. In this study, measurement of ROS levels in H9 hCOs showed an initial reduction in low glucose on Day 6; however, levels were comparable on Day 11 (Figure S12). Since differentiation was induced on Day 6, the low-glucose ROS levels might be reflecting a shift from glycolysis to oxidative phosphorylation [50]. Previous studies have also demonstrated that high-glucose conditions in vitro can mask disease phenotypes such as mTOR complex 1 overactivation that can be rescued under low-glucose conditions [51,52,53]. Glucose metabolism is linked to mTOR (mammalian target of rapamycin) signaling, which is a regulator of cell survival, growth, and proliferation [54,55]. Under glucose deprivation conditions, increased AMP/ATP ratios are sensed by AMPK, leading to inhibition of mTOR complex 1 (mTORC1) [37,56], which leads to suppression of cell proliferation [55]. To evaluate the mechanistic role of mTOR in glucose-driven neural differentiation, we exposed hCOs in both high- and low-glucose conditions to 20 nM rapamycin, an mTOR inhibitor. We observed an expected reduction in hCO size but unexpectedly observed larger hCOs in low compared to high glucose, suggesting potential synergistic or antagonistic interactions between lower glucose levels and mTOR inhibition [57].
In high-glucose conditions, the neurodevelopmental marker expression was not downregulated in the presence of rapamycin. It is possible that while fractions of cell types remain unchanged, cellular morphologies and architecture might be affected by rapamycin [58,59]. In low-glucose conditions, we noted possible impact on abundance of neurodevelopmental cell types. However, the results remained inconclusive due to high hCO-to-hCO variability and lack of statistical significance. Further studies with higher sample size, across different cell lines, could improve the interpretability of the results. The observed phenotypes could also result from other media metabolites and signaling molecules. While they are not directly modified in this study, it is possible that their uptake and function was indirectly impacted by a change in glucose availability.
We noted high variability in observations, between and within cell lines, irrespective of glucose levels. The cell line-to-cell line variability could depend on various factors including source cell type, sex, iPSC reprogramming methods, passage number, and initial metabolic state [60]. While we captured trends by grouping cell lines by source, overall results did not point to a universal effect of change in glucose availability. Expanding this study to include additional cell lines, increasing sample size, and controlling for sources of variation could help draw meaningful conclusions about glucose-driven phenotypes in hCO development. We also observed hCO-to-hCO variability within cell lines, which might be mitigated by testing more batches of cultures [58]. Moreover, variation has also been found to be dependent on the differentiation protocol [61]. In particular, the Lancaster unguided differentiation protocol used here has been shown to have high hCO-to-hCO variability [62]. A similar study using guided programs like the dual-SMAD inhibition protocol for cortical organoids could reveal broader phenotypes controlled by glucose availability [46,63].

5. Conclusions

This study underscores that hCO growth, morphology, and cell type composition can differ widely between cell lines. It also draws attention to the role glucose plays as a morphogen in hCO models. The findings point to the importance of exploring additional metabolic components in the culture media, as these may offer new opportunities for enhancing hCO models and for unraveling how metabolism intersects with signaling pathways.

Supplementary Materials

The following supporting information can be downloaded at: https://www.mdpi.com/article/10.3390/organoids5020011/s1, Figure S1: hCO growth over 10 days; Figure S2: Frequency bubble plots displaying hCO phenotype scores on days 4 and 8; Figure S3: Standard deviation of epithelium phenotype scores; Figure S4: Standard deviation of cyst phenotype scores; Figure S5: Representative images displaying expression of TUJ1+ neurons in hCOs; Figure S6: Representative images displaying expression of SOX2+ neural precursors in hCOs; Figure S7: Quantified abundance of SOX2+ neural precursors in hCOs; Figure S8: Representative images displaying expression of PAX6+ neuroectodermal cells in hCOs; Figure S9: Quantified abundance of PAX6+ neuroectodermal cells in hCOs; Figure S10: Quantified abundance of phosphor-vimentin+ mitotic radial glia in hCOs; Figure S11: Phenotype and Cell-type composition analysis for H9 ESC-derived hCOs exposed to 20 nM rapamycin; Figure S12: ROS measurements in H9 ESC-derived hCOs at Day 6 and Day 11; Table S1: Information on the hPSC cell lines; Table S2: The number of hCOs measured for size analysis; Table S3: The number of hCOs measured for phenotype analysis; Table S4: The number of hCOs measured for neurodevelopmental marker quantification; Table S5: The number of hCOs measure din the inhibitor treatment experiment. Excel File S1: Datasets used to generate graphs. Representative CellProfiler image analysis pipelines for nuclear and non-nuclear cell-type markers.

Author Contributions

Conceptualization: G.R.K., B.M.R. and A.J.K.; Methodology: G.R.K.; Investigation: G.R.K. and A.J.K.; Visualization: G.R.K.; Supervision: A.J.K.; Writing—original draft: G.R.K. and A.J.K.; Writing—review and editing: G.R.K., B.M.R. and A.J.K. All authors have read and agreed to the published version of the manuscript.

Funding

This work was supported by the National Institutes of Health (NIH) [DP1DA044359] and Foundation for Angelman Syndrome Therapeutics [FT2021-002]. Additional support was provided through the Goodnight Distinguished Scholar in Innovation in Biotechnology and Biomolecular Engineering award.

Institutional Review Board Statement

Not applicable.

Informed Consent Statement

Not applicable.

Data Availability Statement

The original contributions presented in this study are included in the article/Supplementary Materials. Further inquiries can be directed to the corresponding author.

Acknowledgments

We thank Christopher Cummings, Suleiman Sweilem, and Laurie Overton at the Golden LEAF Biomanufacturing Training and Education Center (BTEC), North Carolina State University, for access to the Cedex® Bio Analyzer (Roche Diagnostics) and performing the glucose measurements on spent media. We thank Mahe Jabeen and John Britt for valuable insights on cellular metabolism. We thank Maria Theresa Fadri, Z. Begum Yagci, Leandra Caywood, Tyler J. Johnson, and Rachel Polak for helpful discussions and feedback.

Conflicts of Interest

The authors declare that the research was conducted in the absence of any commercial or financial relationships that could be construed as a potential conflict of interest.

Abbreviations

The following abbreviations are used in this manuscript:
mTORMammalian target of rapamycin
hCOHuman cerebral organoid
ESCEmbryonic stem cell
iPSCInduced pluripotent stem cell
SOX2SRY-box transcription factor 2
PAX6Paired box protein 6
Ki67Antigen Kiel 67
TUJ1Beta-III tubulin

References

  1. Lancaster, M.A.; Renner, M.; Martin, C.-A.; Wenzel, D.; Bicknell, L.S.; Hurles, M.E.; Homfray, T.; Penninger, J.M.; Jackson, A.P.; Knoblich, J.A. Cerebral organoids model human brain development and microcephaly. Nature 2013, 501, 373–379. [Google Scholar] [CrossRef] [PubMed]
  2. Velasco, S.; Kedaigle, A.J.; Simmons, S.K.; Nash, A.; Rocha, M.; Quadrato, G.; Paulsen, B.; Nguyen, L.; Adiconis, X.; Regev, A.; et al. Individual brain organoids reproducibly form cell diversity of the human cerebral cortex. Nature 2019, 570, 523–527. [Google Scholar] [CrossRef] [PubMed]
  3. Pellegrini, L.; Bonfio, C.; Chadwick, J.; Begum, F.; Skehel, M.; Lancaster, M.A. Human CNS barrier-forming organoids with cerebrospinal fluid production. Science 2020, 369, eaaz5626. [Google Scholar] [CrossRef] [PubMed]
  4. Mariani, J.; Simonini, M.V.; Palejev, D.; Tomasini, L.; Coppola, G.; Szekely, A.M.; Horvath, T.L.; Vaccarino, F.M. Modeling human cortical development in vitro using induced pluripotent stem cells. Proc. Natl. Acad. Sci. USA 2012, 109, 12770–12775. [Google Scholar] [CrossRef]
  5. Qian, X.; Nguyen, H.N.; Song, M.M.; Hadiono, C.; Ogden, S.C.; Hammack, C.; Yao, B.; Hamersky, G.R.; Jacob, F.; Zhong, C.; et al. Brain-region-specific organoids using mini-bioreactors for modeling ZIKV exposure. Cell 2016, 165, 1238–1254. [Google Scholar] [CrossRef]
  6. Valiulahi, P.; Vidyawan, V.; Puspita, L.; Oh, Y.; Juwono, V.B.; Sittipo, P.; Friedlander, G.; Yahalomi, D.; Sohn, J.-W.; Lee, Y.K.; et al. Generation of caudal-type serotonin neurons and hindbrain-fate organoids from hPSCs. Stem Cell Rep. 2021, 16, 1938–1952. [Google Scholar] [CrossRef]
  7. Eura, N.; Matsui, T.K.; Luginbühl, J.; Matsubayashi, M.; Nanaura, H.; Shiota, T.; Kinugawa, K.; Iguchi, N.; Kiriyama, T.; Zheng, C.; et al. Brainstem organoids from human pluripotent stem cells. Front. Neurosci. 2020, 14, 538. [Google Scholar] [CrossRef]
  8. Cederquist, G.Y.; Asciolla, J.J.; Tchieu, J.; Walsh, R.M.; Cornacchia, D.; Resh, M.D.; Studer, L. Specification of positional identity in forebrain organoids. Nat. Biotechnol. 2019, 37, 436–444. [Google Scholar] [CrossRef]
  9. Fiorenzano, A.; Sozzi, E.; Birtele, M.; Kajtez, J.; Giacomoni, J.; Nilsson, F.; Bruzelius, A.; Sharma, Y.; Zhang, Y.; Mattsson, B.; et al. Single-cell transcriptomics captures features of human midbrain development and dopamine neuron diversity in brain organoids. Nat. Commun. 2021, 12, 7302. [Google Scholar] [CrossRef]
  10. Smits, L.M.; Reinhardt, L.; Reinhardt, P.; Glatza, M.; Monzel, A.S.; Stanslowsky, N.; Rosato-Siri, M.D.; Zanon, A.; Antony, P.M.; Bellmann, J.; et al. Modeling Parkinson’s disease in midbrain-like organoids. NPJ Park. Dis. 2019, 5, 5. [Google Scholar] [CrossRef]
  11. Sloan, S.A.; Andersen, J.; Pașca, A.M.; Birey, F.; Pașca, S.P. Generation and assembly of human brain region–specific three-dimensional cultures. Nat. Protoc. 2018, 13, 2062–2085. [Google Scholar] [CrossRef] [PubMed]
  12. Amin, N.D.; Kelley, K.W.; Kaganovsky, K.; Onesto, M.; Hao, J.; Miura, Y.; McQueen, J.P.; Reis, N.; Narazaki, G.; Li, T.; et al. Generating human neural diversity with a multiplexed morphogen screen in organoids. Cell Stem Cell 2024, 31, 1831–1846. [Google Scholar] [CrossRef] [PubMed]
  13. Bhaduri, A.; Andrews, M.G.; Mancia Leon, W.; Jung, D.; Shin, D.; Allen, D.; Jung, D.; Schmunk, G.; Haeussler, M.; Salma, J.; et al. Cell stress in cortical organoids impairs molecular subtype specification. Nature 2020, 578, 142–148. [Google Scholar] [CrossRef] [PubMed]
  14. Spennati, G.; Regier, M.C.; Ward, H.H.; Das, V.; Karihaloo, A.; Freedman, B.S. Elevated glucose in kidney organoids induces tissue-intrinsic inflammation driving epithelial detachment. bioRxiv 2025. [Google Scholar] [CrossRef]
  15. Filippello, A.; Di Mauro, S.; Scamporrino, A.; Malaguarnera, R.; Torrisi, S.A.; Leggio, G.M.; Di Pino, A.; Scicali, R.; Purrello, F.; Piro, S. High glucose exposure impairs L-cell differentiation in intestinal organoids: Molecular mechanisms and clinical implications. Int. J. Mol. Sci. 2021, 22, 6660. [Google Scholar] [CrossRef]
  16. Qian, Z.; Yang, D.; Li, Y.; Dong, R.; Da, J.; Chen, Y.; Zha, Y. Analysis of high glucose injury using human induced pluripotent stem cell-derived kidney organoids. BMC Nephrol. 2026, 27, 53. [Google Scholar] [CrossRef]
  17. Khoo, M.L.; McQuade, L.R.; Smith, M.S.; Lees, J.G.; Sidhu, K.S.; Tuch, B.E. Growth and differentiation of embryoid bodies derived from human embryonic stem cells: Effect of glucose and basic fibroblast growth factor. Biol. Reprod. 2005, 73, 1147–1156. [Google Scholar] [CrossRef]
  18. Chen, X.; Shen, W.-B.; Yang, P.; Dong, D.; Sun, W.; Yang, P. High glucose inhibits neural stem cell differentiation through oxidative stress and endoplasmic reticulum stress. Stem Cells Dev. 2018, 27, 745–755. [Google Scholar] [CrossRef]
  19. Bardy, C.; Van Den Hurk, M.; Eames, T.; Marchand, C.; Hernandez, R.V.; Kellogg, M.; Gorris, M.; Galet, B.; Palomares, V.; Brown, J.; et al. Neuronal medium that supports basic synaptic functions and activity of human neurons in vitro. Proc. Natl. Acad. Sci. USA 2015, 112, E2725–E2734. [Google Scholar] [CrossRef]
  20. Ito, K.; Suda, T. Metabolic requirements for the maintenance of self-renewing stem cells. Nat. Rev. Mol. Cell Biol. 2014, 15, 243–256. [Google Scholar] [CrossRef]
  21. Gu, W.; Gaeta, X.; Sahakyan, A.; Chan, A.B.; Hong, C.S.; Kim, R.; Braas, D.; Plath, K.; Lowry, W.E.; Christofk, H.R. Glycolytic metabolism plays a functional role in regulating human pluripotent stem cell state. Cell Stem Cell 2016, 19, 476–490. [Google Scholar] [CrossRef] [PubMed]
  22. Tsogtbaatar, E.; Landin, C.; Minter-Dykhouse, K.; Folmes, C.D. Energy metabolism regulates stem cell pluripotency. Front. Cell Dev. Biol. 2020, 8, 87. [Google Scholar] [CrossRef] [PubMed]
  23. Yu, J.S.; Cui, W. Proliferation, survival and metabolism: The role of PI3K/AKT/mTOR signalling in pluripotency and cell fate determination. Development 2016, 143, 3050–3060. [Google Scholar] [CrossRef] [PubMed]
  24. Moussaieff, A.; Rouleau, M.; Kitsberg, D.; Cohen, M.; Levy, G.; Barasch, D.; Nemirovski, A.; Shen-Orr, S.; Laevsky, I.; Amit, M.; et al. Glycolysis-mediated changes in acetyl-CoA and histone acetylation control the early differentiation of embryonic stem cells. Cell Metab. 2015, 21, 392–402. [Google Scholar] [CrossRef]
  25. Martínez-Reyes, I.; Chandel, N.S. Mitochondrial TCA cycle metabolites control physiology and disease. Nat. Commun. 2020, 11, 102. [Google Scholar] [CrossRef]
  26. Kandilya, D.; Shyamasundar, S.; Singh, D.K.; Banik, A.; Hande, M.P.; Stünkel, W.; Chong, Y.S.; Dheen, S.T. High glucose alters the DNA methylation pattern of neurodevelopment associated genes in human neural progenitor cells in vitro. Sci. Rep. 2020, 10, 15676. [Google Scholar] [CrossRef]
  27. Lu, V.; Roy, I.J.; Teitell, M.A. Nutrients in the fate of pluripotent stem cells. Cell Metab. 2021, 33, 2108–2121. [Google Scholar] [CrossRef]
  28. Yan, H.; Chen, S.; Abdulla, A.; Li, Z.; Zhuang, T.Y.; Zhang, M.; Wu, L.; Zhang, Y.; Ding, X.; Jiang, L. Folic acid ameliorates high glucose–induced neurotoxicity in human forebrain organoids: Insights from proteomics. Food Front. 2025, 6, 388–401. [Google Scholar] [CrossRef]
  29. Iwasa, N.; Matsui, T.K.; Iguchi, N.; Kinugawa, K.; Morikawa, N.; Sakaguchi, Y.M.; Shiota, T.; Kobashigawa, S.; Nakanishi, M.; Matsubayashi, M.; et al. Gene expression profiles of human cerebral organoids identify PPAR pathway and PKM2 as key markers for oxygen-glucose deprivation and reoxygenation. Front. Cell Neurosci. 2021, 15, 605030. [Google Scholar] [CrossRef]
  30. Gruetter, R.; Novotny, E.J.; Boulware, S.D.; Rothman, D.L.; Mason, G.F.; Shulman, G.I.; Shulman, R.G.; Tamborlane, W.V. Direct measurement of brain glucose concentrations in humans by 13C NMR spectroscopy. Proc. Natl. Acad. Sci. USA 1992, 89, 1109–1112. [Google Scholar] [CrossRef]
  31. Barnes, F.L.; Crombie, A.; Gardner, D.K.; Kausche, A.; Lacham-Kaplan, O.; Suikkari, A.-M.; Tiglias, J.; Wood, C.; Trounson, A.O. Blastocyst development and birth after in-vitro maturation of human primary oocytes, intracytoplasmic sperm injection and assisted hatching. Hum. Reprod. 1995, 10, 3243–3247. [Google Scholar] [CrossRef]
  32. Lancaster, M.A.; Knoblich, J.A. Generation of cerebral organoids from human pluripotent stem cells. Nat. Protoc. 2014, 9, 2329–2340. [Google Scholar] [CrossRef] [PubMed]
  33. Schindelin, J.; Arganda-Carreras, I.; Frise, E.; Kaynig, V.; Longair, M.; Pietzsch, T.; Preibisch, S.; Rueden, C.; Saalfeld, S.; Schmid, B. Fiji: An open-source platform for biological-image analysis. Nat. Methods 2012, 9, 676–682. [Google Scholar] [CrossRef] [PubMed]
  34. Holme, A.M.; Roland, M.C.P.; Lorentzen, B.; Michelsen, T.M.; Henriksen, T. Placental glucose transfer: A human in vivo study. PLoS ONE 2015, 10, e0117084. [Google Scholar] [CrossRef] [PubMed]
  35. Jensen, K.B.; Little, M.H. Organoids are not organs: Sources of variation and misinformation in organoid biology. Stem Cell Rep. 2023, 18, 1255–1270. [Google Scholar] [CrossRef]
  36. Morales, A.; Andrews, M.G. Approaches to investigating metabolism in human neurodevelopment using organoids: Insights from intestinal and cancer studies. Development 2022, 149, dev200506. [Google Scholar] [CrossRef]
  37. Lin, S.-C.; Hardie, D.G. AMPK: Sensing glucose as well as cellular energy status. Cell Metab. 2018, 27, 299–313. [Google Scholar] [CrossRef]
  38. Deb, B.K.; Li, T.L.; Blair, J.D.; Hockemeyer, D.; Bateup, H.S. STAT3 regulates the generation of astroglia in human brain organoids with high mTORC1 activity. bioRxiv 2023. [Google Scholar] [CrossRef]
  39. Deininger, L.; Jung-Klawitter, S.; Mikut, R.; Richter, P.; Fischer, M.; Karimian-Jazi, K.; Breckwoldt, M.O.; Bendszus, M.; Heiland, S.; Kleesiek, J.; et al. An AI-based segmentation and analysis pipeline for high-field MR monitoring of cerebral organoids. Sci. Rep. 2023, 13, 21231. [Google Scholar] [CrossRef]
  40. Boerstler, T.; Kachkin, D.; Gerasimova, E.; Zagha, N.; Furlanetto, F.; Nayebzade, N.; Zappia, L.; Boisvert, M.; Farrell, M.; Ploetz, S.; et al. Deciphering Brain Organoids Heterogeneity by Identifying Key Quality Determinants. Commun Biol. 2025, 8, 1412. [Google Scholar] [CrossRef]
  41. Fusco, S.; Leone, L.; Barbati, S.A.; Samengo, D.; Piacentini, R.; Maulucci, G.; Toietta, G.; Spinelli, M.; McBurney, M.; Pani, G.; et al. A CREB-Sirt1-Hes1 circuitry mediates neural stem cell response to glucose availability. Cell Rep. 2016, 14, 1195–1205. [Google Scholar] [CrossRef] [PubMed]
  42. Horie, N.; Moriya, T.; Mitome, M.; Kitagawa, N.; Nagata, I.; Shinohara, K. Lowered glucose suppressed the proliferation and increased the differentiation of murine neural stem cells in vitro. FEBS Lett. 2004, 571, 237–242. [Google Scholar] [CrossRef] [PubMed]
  43. Yang, P.; Shen, W.; Reece, E.A.; Chen, X.; Yang, P. High glucose suppresses embryonic stem cell differentiation into neural lineage cells. Biochem. Biophys. Res. Commun. 2016, 472, 306–312. [Google Scholar] [CrossRef] [PubMed]
  44. Yu, J.; Wu, Y.; Yang, P. High glucose-induced oxidative stress represses sirtuin deacetylase expression and increases histone acetylation leading to neural tube defects. J. Neurochem. 2016, 137, 371–383. [Google Scholar] [CrossRef]
  45. Peng, S.; Wu, Y.; Zheng, Y. High glucose causes developmental abnormalities in neuroepithelial cysts with actin and HK1 distribution changes. Front. Cell Dev. Biol. 2023, 10, 1021284. [Google Scholar] [CrossRef]
  46. Paşca, A.M.; Sloan, S.A.; Clarke, L.E.; Tian, Y.; Makinson, C.D.; Huber, N.; Kim, C.H.; Park, J.-Y.; O’Rourke, N.A.; Nguyen, K.D.; et al. Functional cortical neurons and astrocytes from human pluripotent stem cells in 3D culture. Nat. Methods 2015, 12, 671–678. [Google Scholar] [CrossRef]
  47. Mor, M.E.; Harvey, A.; Familari, M.; St Clair-Glover, M.; Viventi, S.; de Iongh, R.U.; Cameron, F.J.; Dottori, M. Neural differentiation medium for human pluripotent stem cells to model physiological glucose levels in human brain. Brain Res. Bull. 2021, 173, 141–149. [Google Scholar] [CrossRef]
  48. Lu, Y.; Zhang, G.; Shen, C.; Uygun, K.; Yarmush, M.L.; Meng, Q. A novel 3D liver organoid system for elucidation of hepatic glucose metabolism. Biotechnol. Bioeng. 2012, 109, 595–604. [Google Scholar] [CrossRef]
  49. Tao, T.; Deng, P.; Wang, Y.; Zhang, X.; Guo, Y.; Chen, W.; Qin, J. Microengineered multi-organoid system from hiPSCs to recapitulate human liver-islet axis in normal and type 2 diabetes. Adv. Sci. 2022, 9, 2103495. [Google Scholar] [CrossRef]
  50. Zheng, X.; Boyer, L.; Jin, M.; Mertens, J.; Kim, Y.; Ma, L.; Hamm, M.; Gage, F.H.; Hunter, T. Metabolic reprogramming during neuronal differentiation from aerobic glycolysis to neuronal oxidative phosphorylation. eLife 2016, 5, e13374. [Google Scholar] [CrossRef]
  51. Guzmán, T.J.; Klöpper, N.; Gurrola-Díaz, C.M.; Düfer, M. Inhibition of mTOR prevents glucotoxicity-mediated increase of SA-beta-gal, p16INK4a, and insulin hypersecretion, without restoring electrical features of mouse pancreatic islets. Biogerontology 2024, 25, 819–836. [Google Scholar] [CrossRef] [PubMed]
  52. Rocktäschel, P.; Sen, A.; Cader, M.Z. High glucose concentrations mask cellular phenotypes in a stem cell model of tuberous sclerosis complex. Epilepsy Behav. 2019, 101, 106581. [Google Scholar] [CrossRef] [PubMed]
  53. Nie, S.-D.; Li, X.; Tang, C.-E.; Min, F.-Y.; Shi, X.-J.; Wu, L.-Y.; Zhou, S.-L.; Chen, Z.; Wu, J.; Song, T.; et al. High glucose forces a positive feedback loop connecting ErbB4 expression and mTOR/S6K pathway to aggravate the formation of tau hyperphosphorylation in differentiated SH-SY5Y cells. Neurobiol. Aging 2018, 67, 171–180. [Google Scholar] [CrossRef] [PubMed]
  54. Laplante, M.; Sabatini, D.M. mTOR signaling at a glance. J. Cell Sci. 2009, 122, 3589–3594. [Google Scholar] [CrossRef]
  55. Condon, K.J.; Sabatini, D.M. Nutrient regulation of mTORC1 at a glance. J. Cell Sci. 2019, 132, jcs222570. [Google Scholar] [CrossRef]
  56. Leprivier, G.; Rotblat, B. How does mTOR sense glucose starvation? AMPK is the usual suspect. Cell Death Discov. 2020, 6, 27. [Google Scholar] [CrossRef]
  57. Kittipongdaja, W.; Wu, X.; Garner, J.; Liu, X.; Komas, S.M.; Hwang, S.T.; Schieke, S.M. Rapamycin suppresses tumor growth and alters the metabolic phenotype in T-cell lymphoma. J. Investig. Dermatol. 2015, 135, 2301–2308. [Google Scholar] [CrossRef]
  58. Andrews, M.G.; Subramanian, L.; Kriegstein, A.R. mTOR signaling regulates the morphology and migration of outer radial glia in developing human cortex. Elife 2020, 9, e58737. [Google Scholar] [CrossRef]
  59. Zhao, W.; Xie, C.; Zhang, X.; Liu, J.; Liu, J.; Xia, Z. Advances in the mTOR signaling pathway and its inhibitor rapamycin in epilepsy. Brain Behav. 2023, 13, e2995. [Google Scholar] [CrossRef]
  60. Panopoulos, A.D.; Yanes, O.; Ruiz, S.; Kida, Y.S.; Diep, D.; Tautenhahn, R.; Herrerías, A.; Batchelder, E.M.; Plongthongkum, N.; Lutz, M.; et al. The metabolome of induced pluripotent stem cells reveals metabolic changes occurring in somatic cell reprogramming. Cell Res. 2012, 22, 168–177. [Google Scholar] [CrossRef]
  61. Naas, J.; Balmana, M.; Holcik, L.; Novatchkova, M.; Dobnikar, L.; Krausgruber, T.; Ladstätter, S.; Bock, C.; von Haeseler, A.; Esk, C.; et al. Quantitative profiling of human brain organoid cell diversity across four protocols and multiple cell lines. Cell Rep 2025, 44, 116168. [Google Scholar] [CrossRef]
  62. Quadrato, G.; Nguyen, T.; Macosko, E.Z.; Sherwood, J.L.; Min Yang, S.; Berger, D.R.; Maria, N.; Scholvin, J.; Goldman, M.; Kinney, J.P.; et al. Cell diversity and network dynamics in photosensitive human brain organoids. Nature 2017, 545, 48–53. [Google Scholar] [CrossRef]
  63. Rosebrock, D.; Arora, S.; Mutukula, N.; Volkman, R.; Gralinska, E.; Balaskas, A.; Hernández, A.A.; Buschow, R.; Brändl, B.; Müller, F.-J.; et al. Enhanced cortical neural stem cell identity through short SMAD and WNT inhibition in human cerebral organoids facilitates emergence of outer radial glial cells. Nat. Cell Biol. 2022, 24, 981–995. [Google Scholar] [CrossRef]
Figure 1. Glucose affects hCO growth rate. (A) hCO growth protocol in high- and low-glucose conditions. (B) hCO growth over 10 days in high-glucose (blue) and low-glucose (orange) conditions for hCOs generated from different cell lines. hCO sizes on the y-axis are normalized to the mean size of low-glucose hCOs on Day 2. Solid lines connect the mean hCO size between time points, dots represent individual hCO sizes, and error bars represent 95% confidence intervals. The numbers of hCOs measured can be found in Table S2. (C) Mean fraction of proliferating Ki67+ cells relative to DAPI (nuclei) for high- (blue) vs. low-glucose (orange) conditions. Error bars represent 95% confidence intervals. Black dots represent individual hCOs used for immunofluorescence quantification. The numbers of hCOs measured are in Table S4. Samples were compared using a two-sample t-test assuming unequal variances. * p < 0.05, ** p < 0.01, n.s. non-significant.
Organoids 05 00011 g001
Figure 2. Morphological heterogeneity in hCOs. (A) Brightfield microscopy imaging displaying the dominant phenotypes in hCOs. The epithelium phenotype is marked by an organized outer edge of the hCO (solid black arrow) and the cyst phenotype marked by bubble-like morphology (dotted black arrow). Scale bars are 250 μm. (B) Scheme to score hCOs for the two phenotypes. Three levels of epithelium (x-axis) and cyst (y-axis) phenotype scores were assigned: 0—absence of feature; 0.5—partially visible/partially developed feature; 1—clearly visible feature. (C,D) Brightfield images of hCOs on Day 10 showing epithelium (solid black arrows) and cyst (dotted black arrows) phenotypes. All scale bars are 500 μm.
Organoids 05 00011 g002
Figure 3. Glucose conditions and growth stage influence morphological heterogeneity in hCOs. (A) Frequency bubble plots displaying hCO phenotype score evolution between Day 2 and Day 10 of growth for high-(blue) and low-(orange) glucose conditions for different cell lines. Three levels of epithelium (x-axis) and cyst (y-axis) phenotype scores were assigned: 0—absence of feature; 0.5—partially visible/partially developed feature; 1—clearly visible feature (Figure S2). (BD) The mean standard deviation of phenotype scores comparing high (blue) vs. low (orange) glucose. Standard deviations were calculated independently for each phenotype, time point, and cell line and means of those standard deviations were calculated for the indicated subsets of conditions (Figures S3 and S4). All error bars represent 95% confidence intervals. The numbers of hCOs measured are in Table S3. All conditions were compared using a two-sample t-test assuming unequal variances. * p < 0.05, n.s. non-significant.
Organoids 05 00011 g003
Figure 4. Glucose consumption increases in the neural induction stage. (A) Change in media glucose concentration over time in high-glucose (blue) vs. low-glucose (orange) conditions. Triangles represent glucose concentration available to hCOs after partial media change. Circles represent glucose concentration in spent media. Dotted lines indicate the drop in mean glucose concentration between media changes. (B) Mean glucose consumption rate (change in concentration (mM)/time (days)) and (C) mean glucose consumption rate/initial glucose availability (n = 38 hCOs) across cell lines in high-glucose (blue) vs. low-glucose (orange) conditions in hPSC growth stage (Day 0–6) and neural induction stage (Day 6–10). All error bars represent 95% confidence intervals. All conditions were compared using a two-sample t-test assuming unequal variances. * p < 0.05, ** p < 0.01, *** p < 0.001, n.s. non-significant.
Organoids 05 00011 g004
Figure 5. Low-glucose conditions result in the loss of neurodevelopmental cell types in a cell line-dependent manner. (A) Mean fraction of SOX2+ neural precursor cells, PAX6+ neuroectodermal cells, and TUJ1+ neurons relative to DAPI across all cell lines in high (blue) vs. low (orange) conditions. Each marker represents the mean fraction within each cell line and error bars represent 95% confidence intervals. (B) Mean fraction of TUJ1+ neurons relative to DAPI in blood-derived iPSCs compared to the other PSCs in high-glucose and low-glucose conditions. Each black dot represents an individual cell line and error bars represent 95% confidence intervals. (C) Mean fraction of TUJ1+ neurons relative to DAPI (nuclei) in hCOs derived from different pluripotent cell lines grouped by their source, comparing high-glucose (blue) vs. low-glucose (orange) conditions. (D) Mean fraction of PAX6+ neuroectodermal cells and (E) SOX2+ neural precursors relative to DAPI (nuclei) in hCOs derived from GM25256 and H9 PSCs comparing high-glucose (blue) vs. low-glucose (orange) conditions. All fraction quantifications are based on immunofluorescence images. All black dots represent individual hCOs (CE). The number of hCOs measured are in Table S4. All conditions were compared using a two-sample t-test assuming unequal variances. * p < 0.05, *** p < 0.001, n.s. non-significant.
Organoids 05 00011 g005
Figure 6. Effect of rapamycin treatment is dependent on glucose availability. H9 ESC-derived hCO growth over 10 days in high- (blue) and low-glucose (orange) conditions for hCOs exposed to (A) vehicle control (DMSO) and (B) 20 nM Rapamycin. hCO sizes on the y-axis are normalized to the corresponding average size of low-glucose hCOs on Day 2. Solid lines connect the average hCO size between time points and dots represent individual hCO sizes. hCO sizes on Day 10 were compared using a two-sample t-test assuming unequal variances. (C) Fraction of hCOs with cyst-like phenotypes after 10 days in high (blue) vs. low (orange) glucose upon exposure to vehicle control (DMSO) and 20 nM Rapamycin, calculated based on Figure S11A. Mean fraction of (D) proliferating Ki67+ cells, (E) SOX2+ neural precursors, and (F) TUJ1+ neurons relative to DAPI (nuclei) in hCOs in high-glucose (blue) vs. low-glucose (orange) conditions upon exposure to vehicle control (DMSO) and 20 nM Rapamycin. All marker quantifications are based on immunofluorescence images. All black dots represent individual hCOs and all error bars represent 95% confidence intervals. The numbers of hCOs measured can be found in Table S5. All conditions were compared using a two-sample t-test assuming unequal variances. * p < 0.05, *** p < 0.001, n.s. non-significant.
Organoids 05 00011 g006
Disclaimer/Publisher’s Note: The statements, opinions and data contained in all publications are solely those of the individual author(s) and contributor(s) and not of MDPI and/or the editor(s). MDPI and/or the editor(s) disclaim responsibility for any injury to people or property resulting from any ideas, methods, instructions or products referred to in the content.