3.1. As Cast
The actual chemical composition (at.%) of the as-cast alloy (NT1.1–AC), which was measured using EDS, was (4.4 ± 1)Al–(4.7 ± 0.5)Cr–(4.8 ± 0.3)Ge–(0.9 ± 0.2)Hf–(7 ± 0.3)Mo–(33.5 ± 1.4)Nb–(20.3 ± 2.4)Si–(4.4 ± 0.6)Sn–(19.3 ± 0.4)Ti–(0.9 ± 0.6)W, wherein the parentheses the average concentration and standard deviation value of each element are given. The chemical composition of NT1.1–AC corresponded to that of an RCCA. The alloy can also be classified as an RM(Nb)IC alloy (Nb silicide-based alloy), in other words, the alloy NT1.1–AC was an RCCA/RM(Nb)IC (see Abbreviations).
Similarly, with the alloy NT1.2–AC [
46], between the bottom and top of the cast button/ingot of the NT1.1–AC, there was severe macrosegregation of Si (MACSi = C
maxSi − C
minSi = 6.5 at.% versus 6 at.% for NT1.2–AC). Note that high MACSi (≥7 at.%) has been reported for RM(Nb)ICs with the simultaneous addition of Sn with Al, Cr, Hf and Ti (see Table 6 in [
47]), and for the Hf and RM free RCCA/RM(Nb)IC alloy OHS1 (MACSi = 6.8 at.%, see the
Appendix A for chemical composition) [
48] but not for alloys with the simultaneous addition of Ge with Al, Cr, Hf and Ti [
49]. The available data for MACSi in metallic UHTMs with Si addition would suggest that Sn and its synergy with other solutes in NT1.1–AC brought about the severe MACSi.
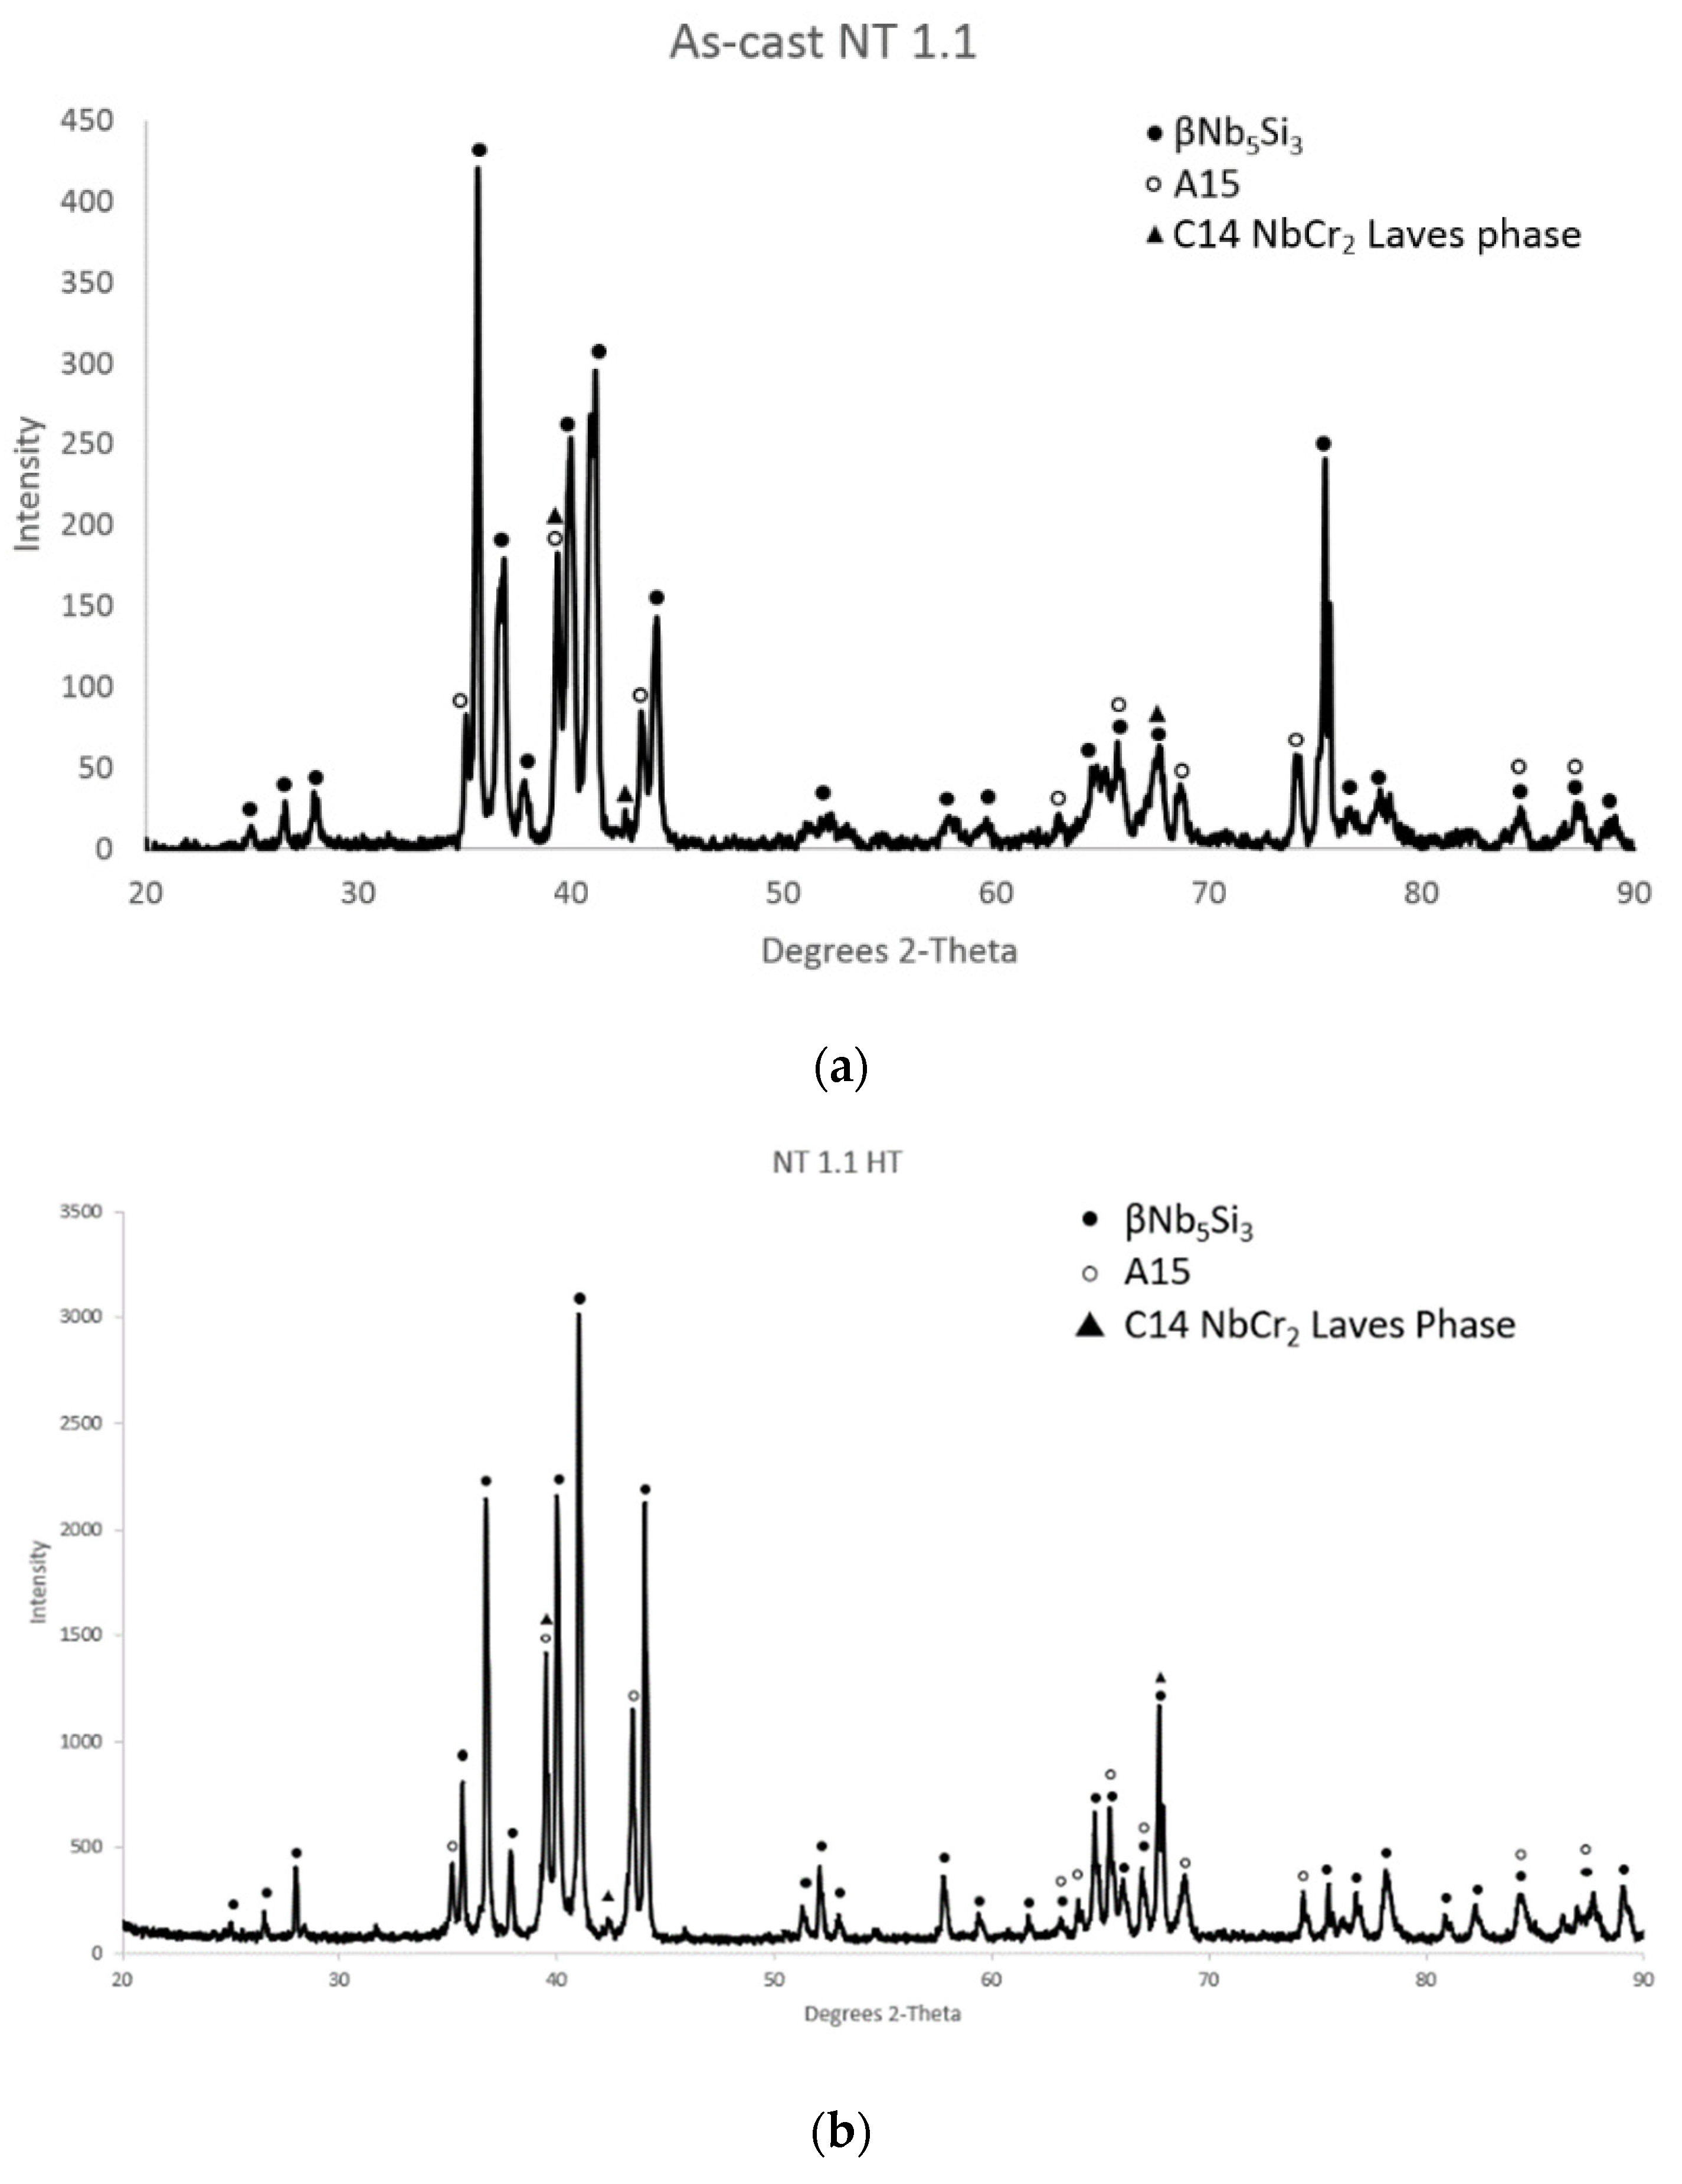
The as-cast microstructure consisted of the βNb
5Si
3 silicide, and the C14–NbCr
2-based Laves and A15–Nb
3X (X = Al, Ge, Si, Sn) phases (
Figure 1a). The Laves and A15 phases formed in-between the silicide grains (
Figure 2a,b) and often were part of a eutectic (
Figure 2c,d). The eutectic was observed in all parts of the button/ingot and consisted of the Laves and A15 phases, where the A15 exhibited different contrast owing to differences in its <X> =Al + Ge + Si + Sn, Ti, Ge + Sn and Mo + W contents and Sn/Ge ratio (see caption of
Figure 2). The average chemical composition of the silicide, Laves, A15-Nb
3X (low <X> and Ti content) phases and the eutectic in NT1.1–AC is shown in
Table 1. The βNb
5Si
3 silicide was the primary phase that formed at a very high volume fraction (
Table 2), and solidification followed with the formation of A15–Nb
3X or the eutectic. The “architecture” of the as-cast microstructure was the same in NT1.1–AC and NT1.2–AC (compare Figure 2a with Figure 3a in [
46]), and suggested that alloy(s) with composition(s) comparable to those of NT1.1 and NT1.2 [
46] would be suitable for directional solidification (DS) processing (see
Section 4). Owing to their chemical composition, the aforementioned phases and the eutectic in NT1.1–AC were “complex concentrated” (CC, “compositionally complex”).
The C14–NbCr
2-based Laves phase had <Cr> =Al + Cr + Ge + Si + Sn = 60.2 at.%, in agreement with the chemical composition of C14–NbCr
2-based Laves phases in RM(Nb)ICs (or Nb silicide-based alloys) [
44] and close to the <Cr> content (=57.5 at.%) of the C14–NbCr
2-based Laves phase in NT1.2–AC [
46]. However, compared with the Laves phase in NT1.2–AC, it was richer in Al + Cr (Al + Cr = 51.4 at.% versus 45.9 at.%) and Mo + W (7.3 at.% versus 3.8 at.%). Also, note that the average chemical composition of the Laves phase in
Figure 2d (phase identified with the number 2) was in agreement with the data for the Laves phase in
Table 1. The silicide had <Si > =Al + Ge + Si + Sn = 35.8 at.%, in agreement with [
50], and its Nb/(Ti + Hf) ratio was 2.17, which is indicative of tetragonal silicide [
51], in agreement with the XRD data (
Figure 1a). Whereas in NT1.2–AC there was strong partitioning of Ti in the silicide that resulted to Ti-rich Nb
5Si
3 [
46], in NT1.1–AC, the partitioning of Ti was strong only in A15–Nb
3X (
Figure 2c,d). The partitioning of Ge in the silicide was stronger than that of Sn, in agreement with the silicide in NT1.2–AC [
46] and with data for RM(Nb)ICs, RCCAs and RMICs/RCCAs with simultaneous Ge and Sn additions (see [
12,
46]).
Unlike the NT1.2–AC [
46] and many RM(Nb)ICs with eutectics that contain bcc Nb
ss solid solution and βNb
5Si
3 [
45], the silicide did not participate in the eutectic in NT1.1–AC. The eutectic had <Si> = Al + Ge + Si + Sn = 25.9 at.%, close to the upper value (=24.3 at.%) of the <Si> content in eutectics with Nb
ss and βNb
5Si
3 [
45]. Furthermore, the Mo content of the eutectic in NT1.1–AC decreased as its Si content increased, a trend that is similar to that in eutectics with Nb
ss and βNb
5Si
3 that are formed in RM(Nb)ICs (see Figure 11 in [
45]).
The partitioning of Ti in the A15–Nb
3X that resulted in the formation of Ti-rich A15–Nb
3X, which was observed in this work (
Figure 2d), has also been reported for the alloys OHS1 (see Table 1 in [
48]) and JZ4 and JZ5 (see Tables S1 and S2 in the Supplemental Materials in [
52]). For the alloy compositions, see
Table A1 in
Appendix A. In all four alloys, i.e., NT1.1, OHS1, JZ4 and JZ5, the Ge and Sn were simultaneously present with Al, Cr, Nb, Si and Ti. In the alloys NT1.1, JZ4 and JZ5, the aforementioned elements were also simultaneously present with Hf, Mo and W, but only the alloys NT1.1 and JZ5 had comparable chemical compositions. In the latter two alloys, even though different phases were present in their microstructures, namely the Nb
5Si
3, C14–NbCr
2-based Laves, A15–Nb
3X low <X> and A15–Nb
3X high <X> (and Ti-rich) in NT1.1–AC, and the Nb
5Si
3, Ti-rich Nb
5Si
3, A15–Nb
3X low <X>, A15–Nb
3X high <X> (and Ti-rich) and TM
5Sn
2X (X = Al, Ge, Si) in JZ5–AC [
52], the X/Ti ratios and the Mo + W and Ge + Sn contents of the A15–Nb
3X were essentially the same (e.g., the A15–Nb
3X low <X> had <X> =21.3 at.%, Ti = 19.8 at.%, Mo + W = 21.5 at.%, Ge + Sn = 11 at.% and <X> /Ti = 1.08 in NT1.1–AC, and <X> = 21.6 at.%, Ti = 19.4 at.%, Mo + W = 21 at.%, Ge + Sn = 12.4 at.% and <X> /Ti = 1.11 in JZ5–AC). This is new data and supports the synergy and entanglement of phases in metallic UHTMs; see Section 4 in [
12].
There was synergy and intricateness (see Section 4 and Appendix A in [
12]) of solutes and parameters in different phases and between phases, and entanglement of the latter (for a discussion of the concepts of synergy and entanglement, see [
12]). Note that Al and Si stabilise the C14–NbCr
2 Laves phase [
53,
54,
55,
56,
57,
58,
59]. Below, we shall consider each phase and the eutectic separately. We start with the C14–NbCr
2-based Laves phase in NT1.1–AC.
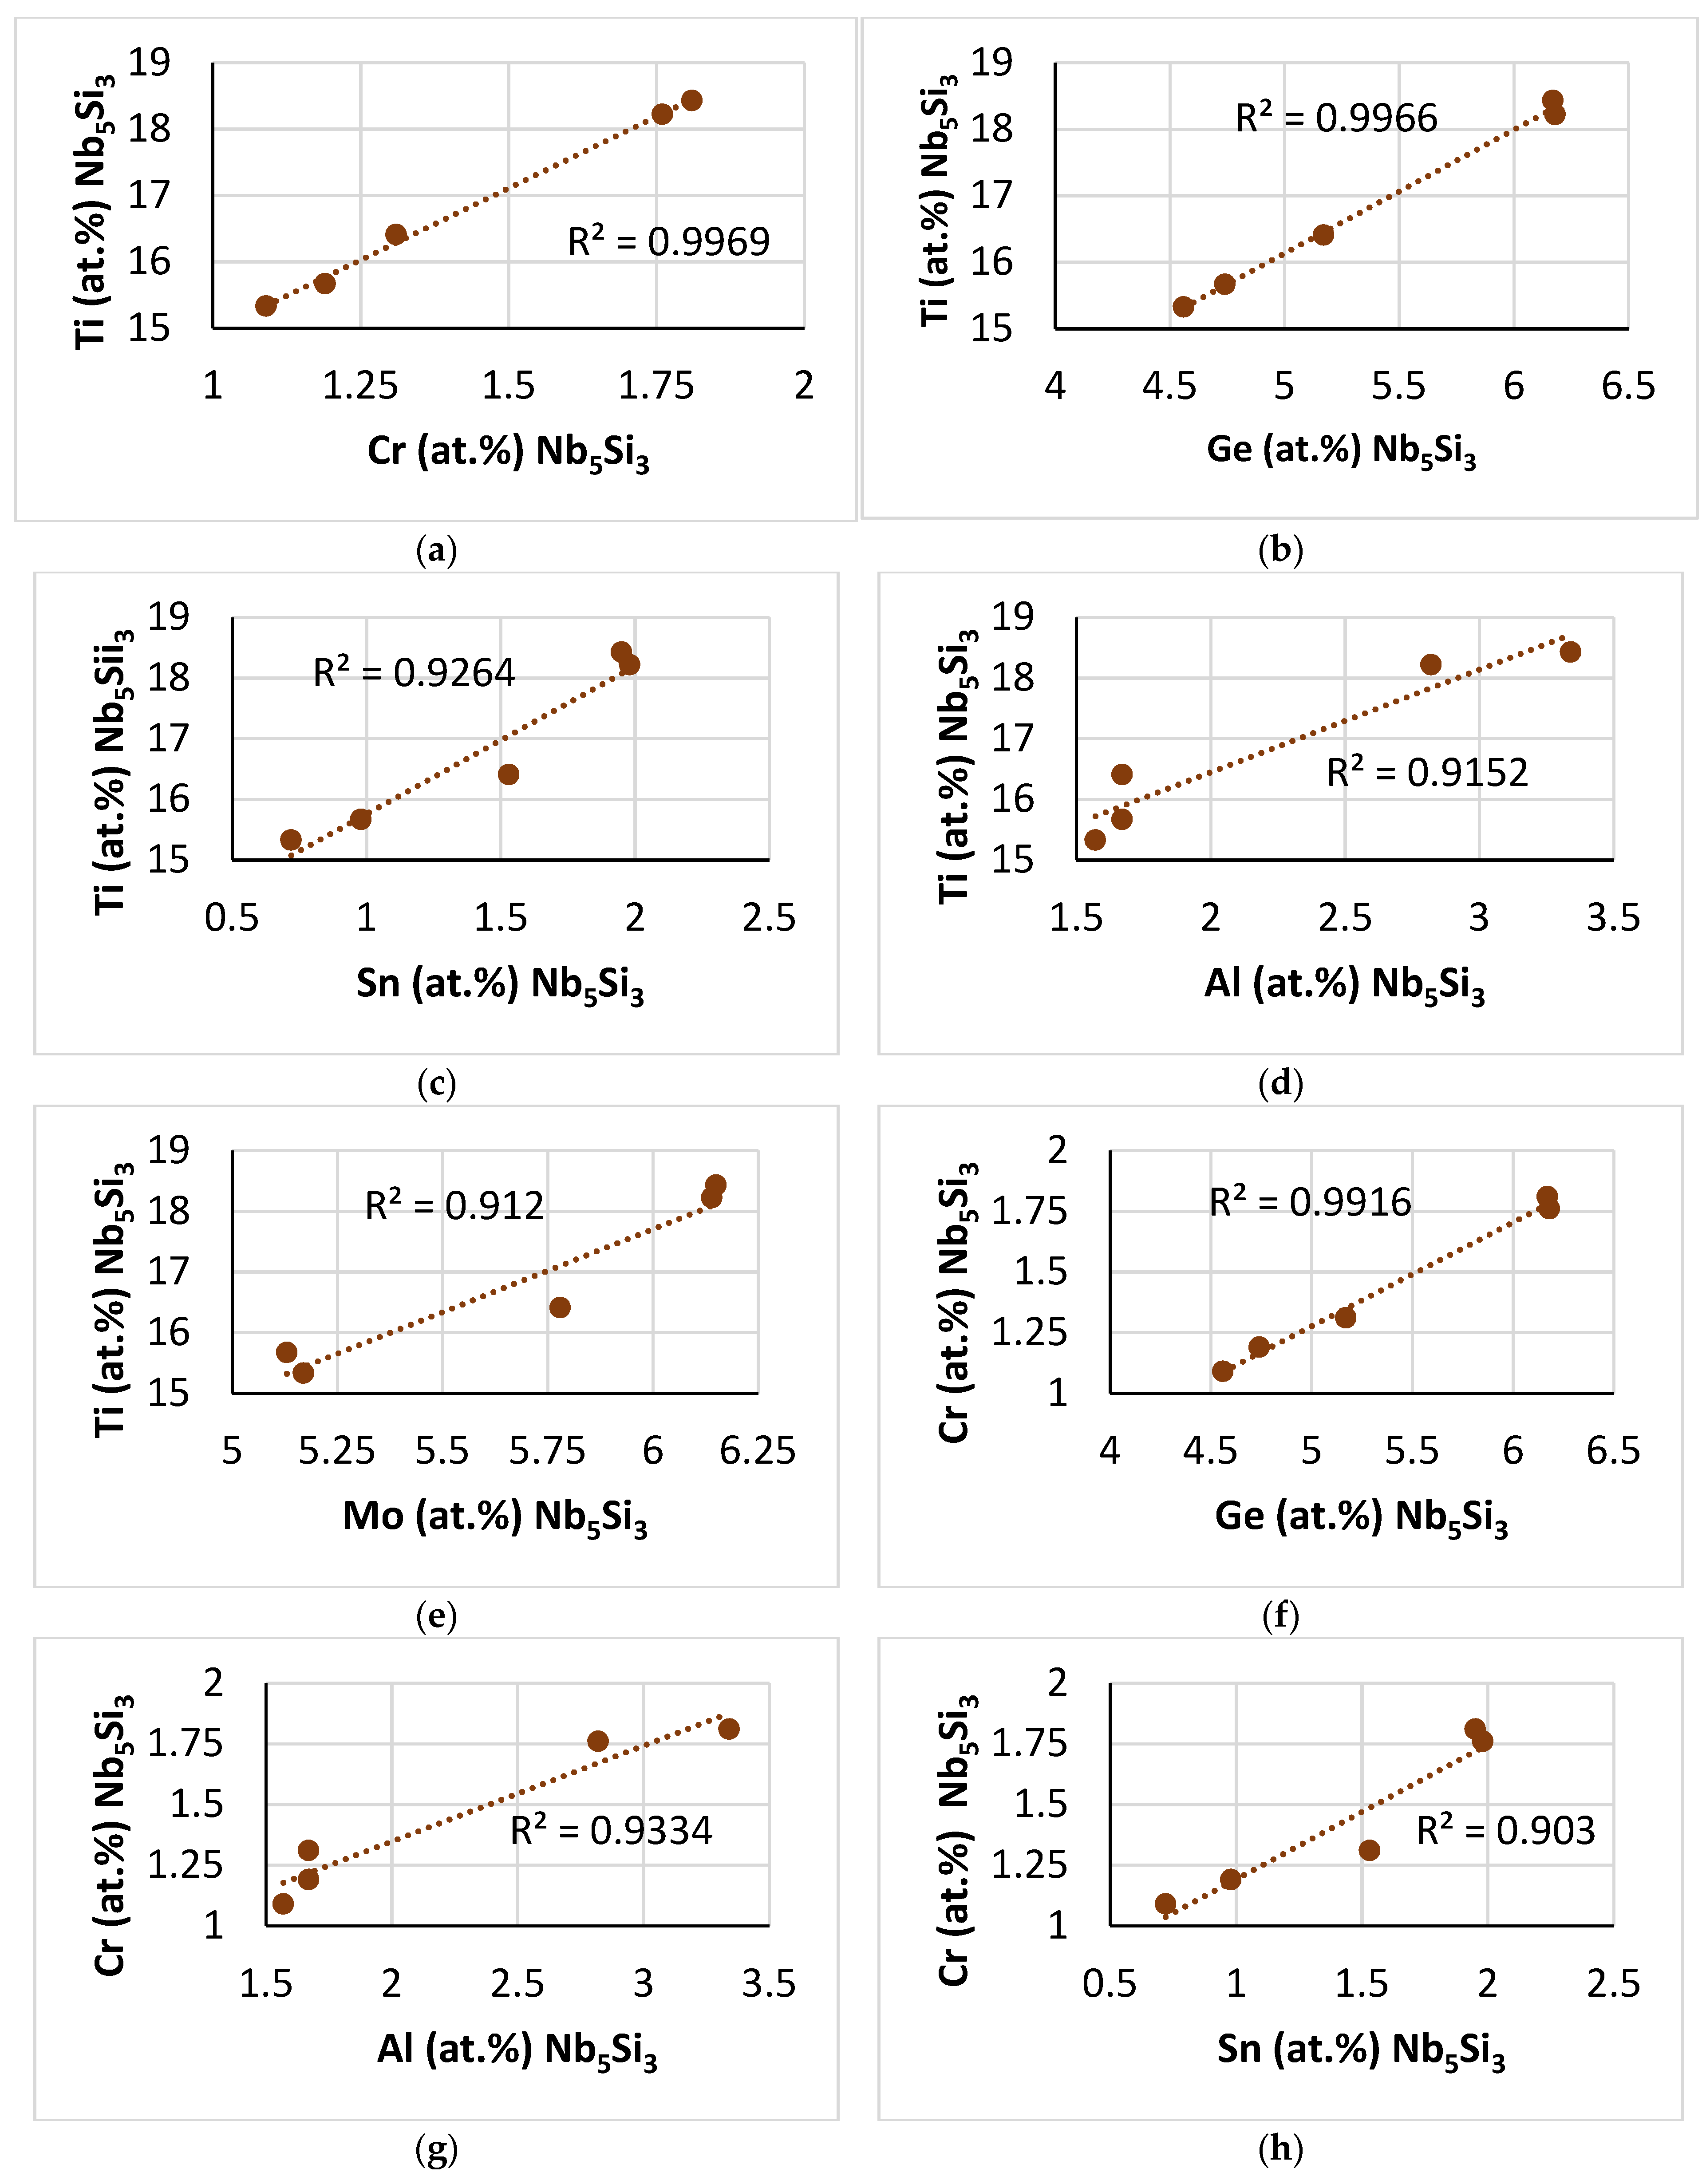
Figure 3 shows relationships between Ti and Al, Cr, Ge, Hf, Mo, Si and Sn. (Note the low concentrations and narrow ranges of the Ge and Hf contents in
Figure 3d,g that is included to show the trends of Ti versus Ge and Ti versus Hf.) The Ti concentration of the Laves phase decreased as its Cr, Ge, Si and Hf contents increased, as shown in
Figure 3a,d,e,g, and increased as its Al, Sn and Mo contents increased, as shown in
Figure 3b,c,h. Also, the Ti concentration in the Laves phase decreased as its <Cr> = Al + Cr + Ge + Si + Sn content increased (
Figure 3f). Note that the trends shown in
Figure 3d,e are opposite to those shown for the Laves phase in the alloy NT1.2–AC [
46], owing to the Laves phase being in synergy and entanglement with different phases in the two alloys.
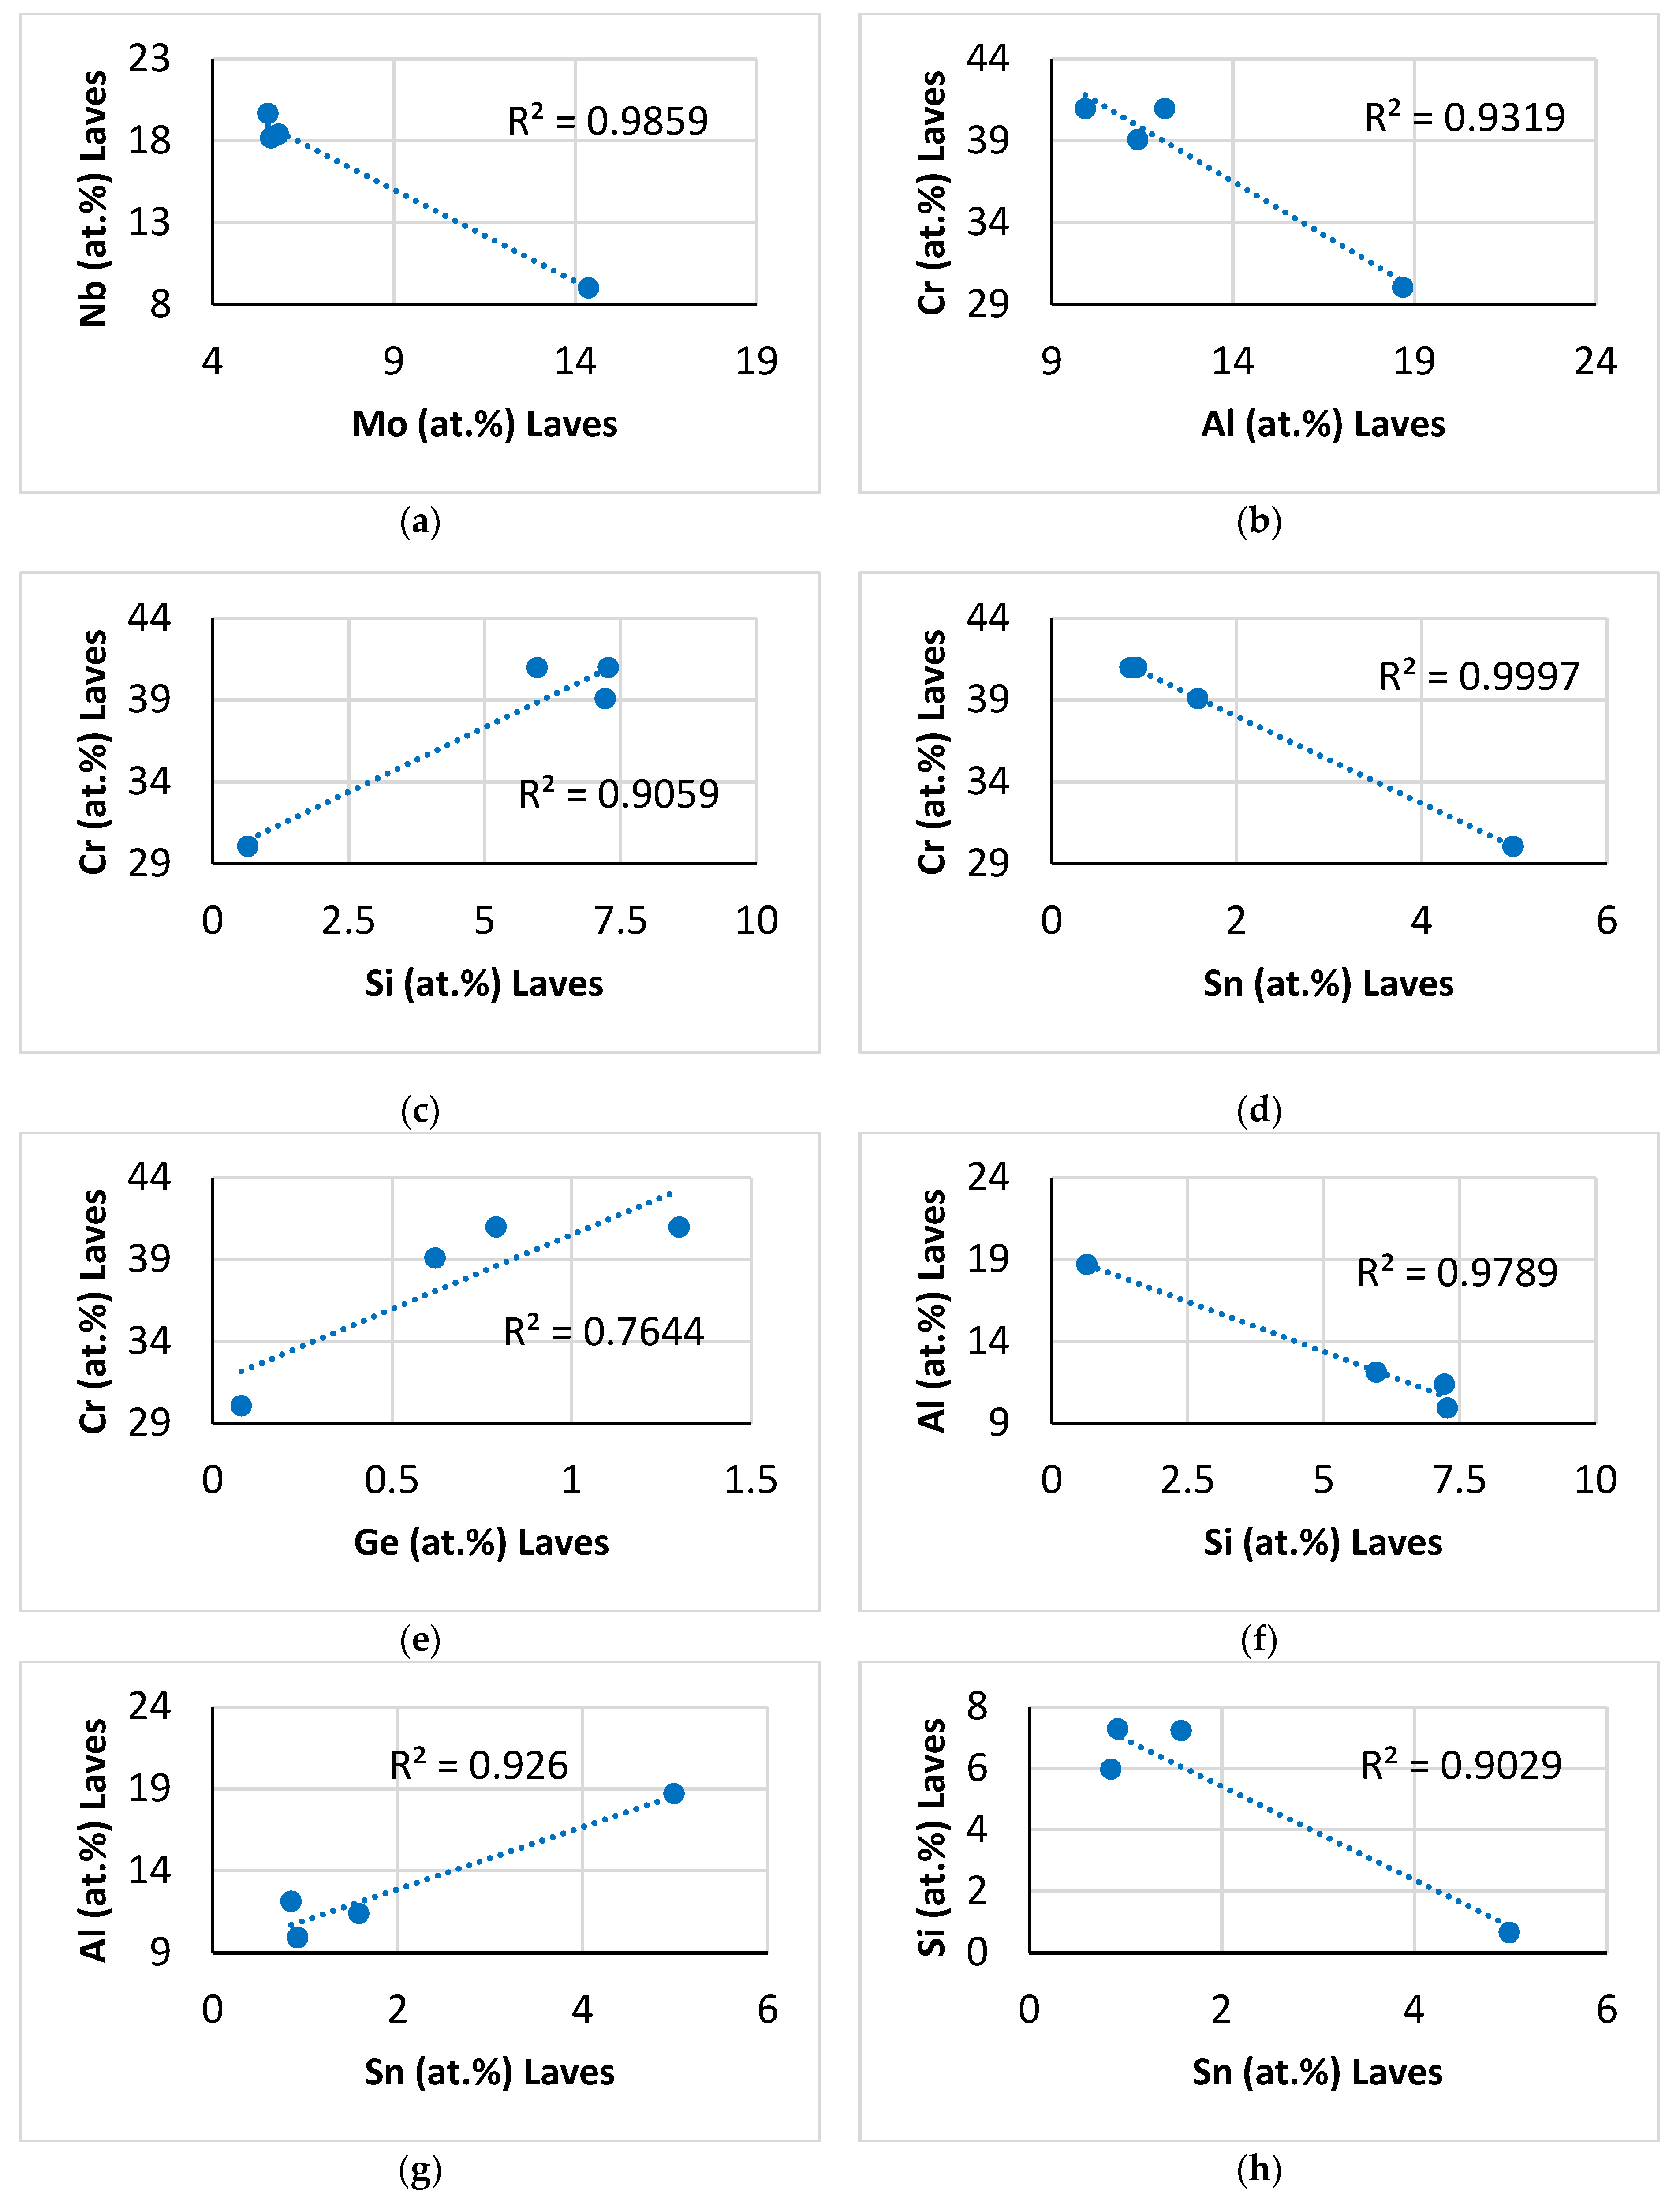
Other relationships between solutes in the C14–NbCr
2-based Laves phase are shown in
Figure 4. As the Mo concentration of the Laves phase increased, that of Nb decreased (
Figure 4a), but the Ti content increased (
Figure 3h). The increase in the Cr concentration was accompanied by a decrease in the Al and Sn contents (
Figure 4b,d) and an increase in the Si and Ge contents (
Figure 4c,e), whereas the Si and Sn concentrations in the Laves phase, respectively, decreased and increased with increasing Al content (
Figure 4f,g). The concentration of Sn deceased as the Laves phase became richer in Si (
Figure 4h).
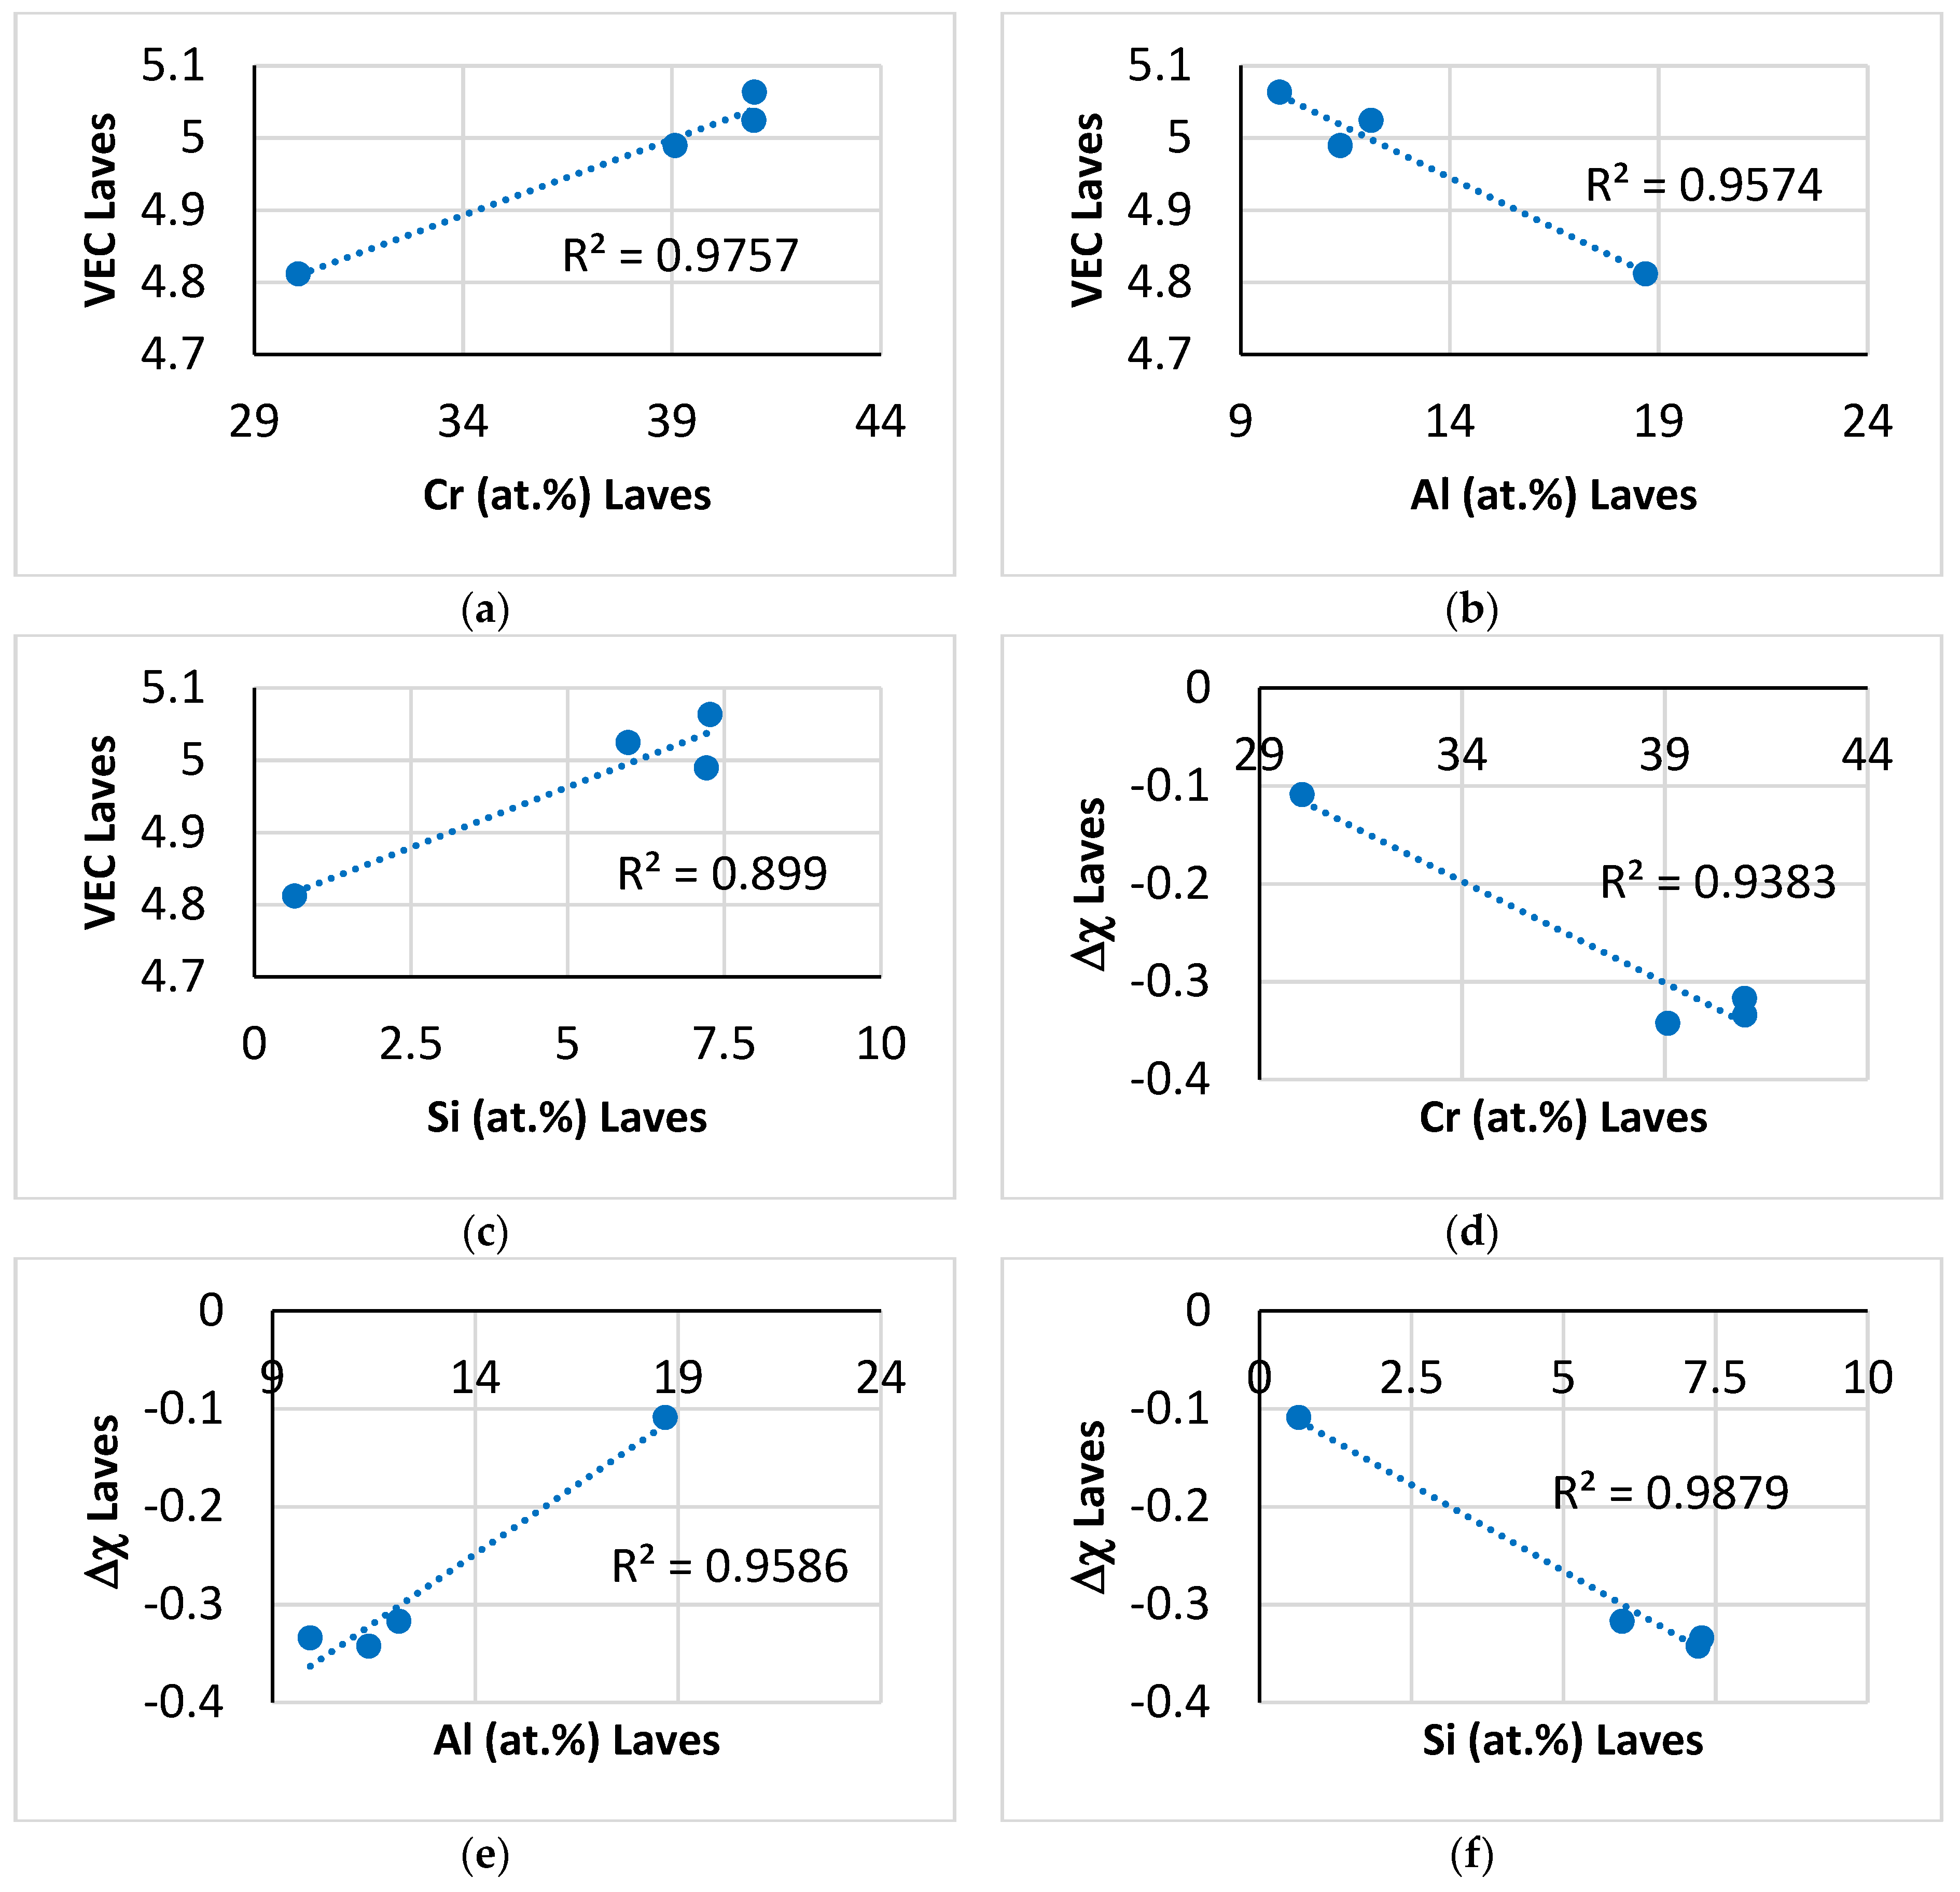
Relationships between the parameters VEC and Δχ of the C14–NbCr
2-based Laves phase with its Al, Cr and Si solutes are shown in
Figure 5. The aforementioned parameters were calculated as described in [
44]. The parameter VEC increased as the Cr and Si contents increased (
Figure 5a,c) and decreased with increasing Al content (
Figure 5b), whereas the parameter Δχ exhibited the opposite trends with the same solutes (
Figure 5d–f). Finally, the relationship between the parameters VEC and Δχ of the Laves phase is shown in
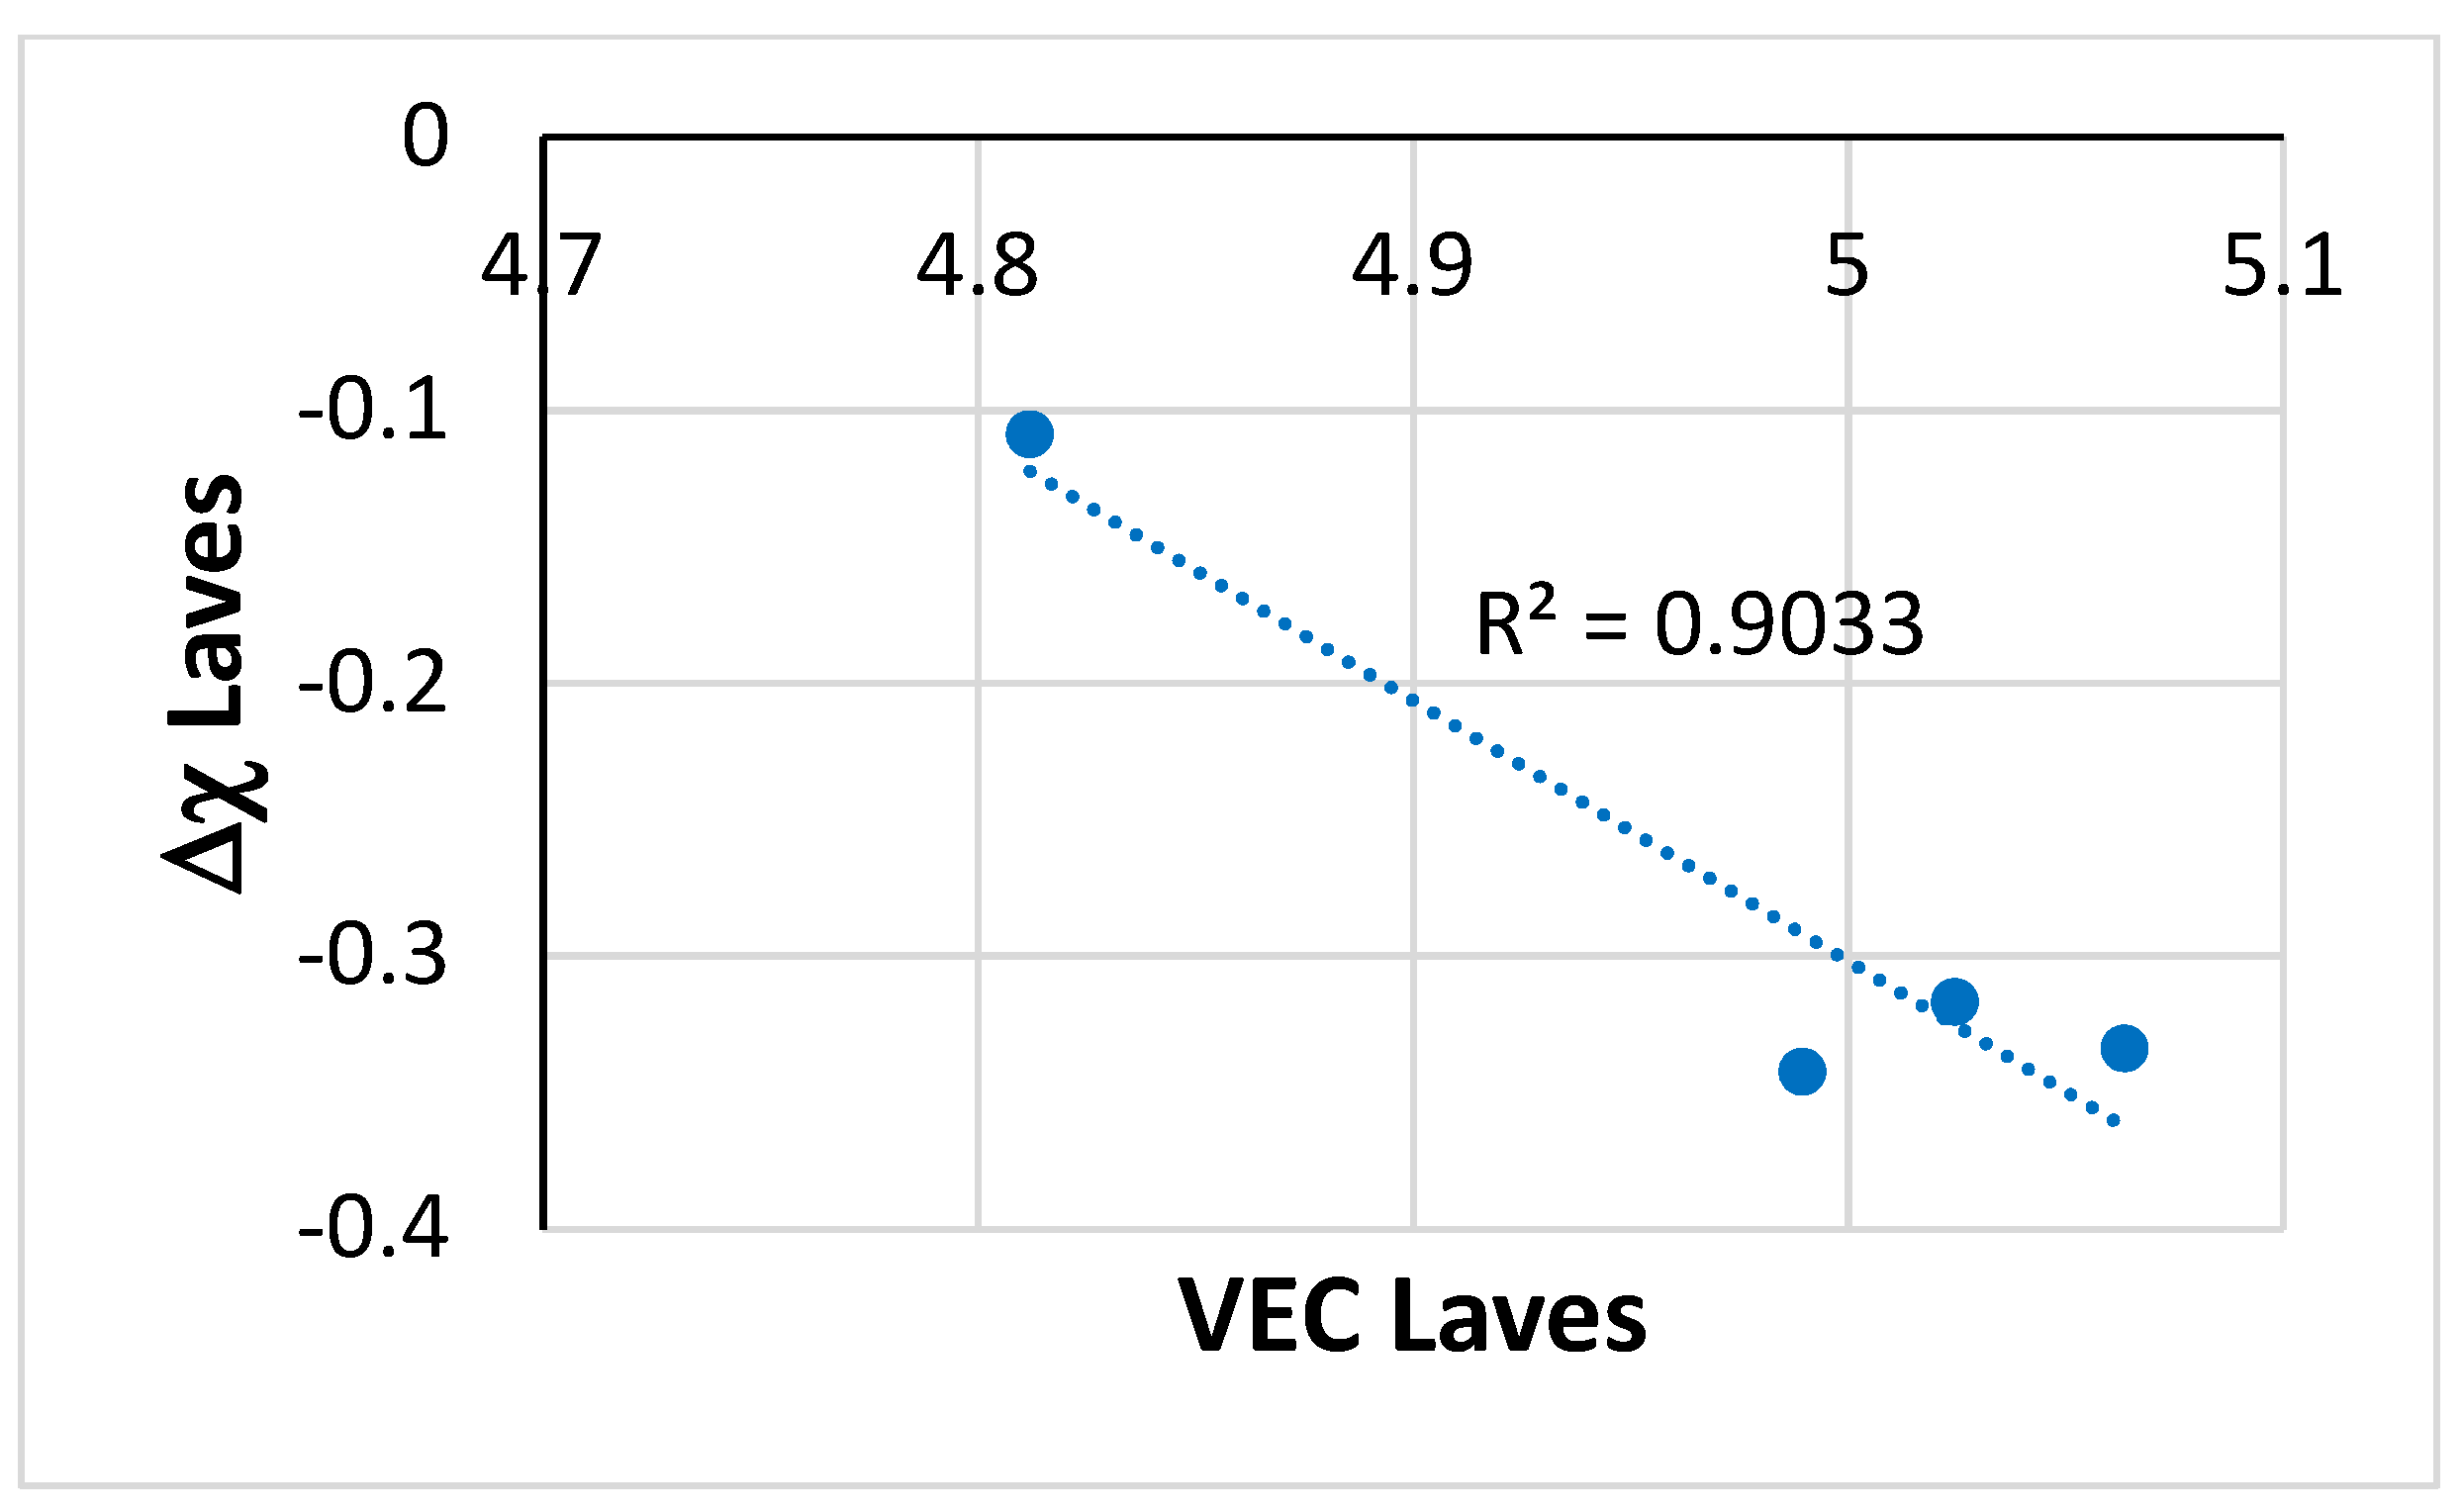
Figure 6. The absolute value of Δχ (i.e., |Δχ|) increased with increasing VEC.
This paper presents for the first time new data for relationships between solutes in the C14–NbCr
2-based Laves phase in a metallic UHTM, namely
Figure 3b,g,h (compare with [
46]), and
Figure 4a–c,f–h (see [
60]), and between parameters and solutes, namely
Figure 5b,c,e,f (see [
44]). The aforementioned new data complement the data for relationships between solutes and between parameters and solutes in the C14–NbCr
2-based Laves phase that our research group presented for RMICs, also for the first time since 2018 (see [
44,
60]).
Next, we consider the silicide. Relationships between solutes in the βNb
5Si
3 are shown in
Figure 7. The increase in the Ti concentration in the silicide was accompanied by increases in the concentrations of Cr, Ge, Sn, Al and Mo (
Figure 7a–e); in other words, we could say that Ti “pulled in” with it in the silicide the aforementioned elements (see [
46]). The same can be said for Cr, which also “pulled in” with it in the silicide the Ge, Al and Sn (
Figure 7f–h) that substituted Si in the silicide [
61].
Figure 7 is another example of the synergy and intricateness of solutes in an intermetallic, namely the βNb
5Si
3, in a RCCA/RMIC.
Relationships between the parameters VEC and Δχ of the βNb
5Si
3 and solutes in NT1.1–AC are shown in
Figure 8 and
Figure 9. The aforementioned parameters were calculated as described in [
61]. With increasing Al, Cr, Ge, Mo, Sn and Ti concentrations in the silicide, the parameters VEC and Δχ, respectively, decreased (
Figure 8) and increased (
Figure 9).
Figure 8 and
Figure 9 are new examples of the synergy of parameters and solutes in an intermetallic, namely the βNb
5Si
3, in a RCCA/RMIC.
The relationship between the parameters VEC and Δχ of the βNb
5Si
3 in NT1.1–AC is shown in
Figure 10.
Figure 10b, which includes data for the binary (unalloyed) βNb
5Si
3, should be compared with the data for the
B-free silicide in Figure 6 in [
60]. The comparison shows that the same trend was followed for the alloyed silicide in NT1.1–AC. This paper presents for the first time new data for relationships between solutes in the βNb
5Si
3, namely
Figure 7e–h (see [
60,
61]) and between parameters of βNb
5Si
3 and solutes, namely
Figure 8a–c,e,f and
Figure 9a–c,e,f (see [
45,
60,
61]). The aforementioned new data complement the data for relationships between solutes and between parameters and solutes in the Nb
5Si
3 silicide that our research group presented for RMICs, also for the first time since 2018 (see [
61]).
To the authors’ knowledge, this is also the first time that such comprehensive data for the βNb
5Si
3 has been presented for the solutes (
Figure 7) and parameters (
Figure 8,
Figure 9 and
Figure 10) for a M
5Si
3 silicide in a RCCA/RMIC. These data supplement the new data for the βNb
5Si
3 that was reported for the alloy NT1.2 in [
46]. The two sets of data together with the data in [
60,
61] have enhanced the capabilities of the alloy design methodology NICE [
62] for the development of metallic UHTMs and confirm that the “alloy design landscape”, which was discussed in Section 4 in [
12], is a “landscape”
in statu nascendi (in a state of being born).
Relationships between solutes in A15–Nb
3X are shown in
Figure 11. As the A15–Nb
3X became richer in Sn its Nb and Mo contents decreased (
Figure 11b,d) and its Al, Ge and Ti concentrations increased (
Figure 11f,g,i). Also, the concentrations of Mo and Nb in A15–Nb
3X decreased with increasing Ge content (
Figure 11a,c,e), but the concentration of Ti increased (
Figure 11j). The increase in the Al content of the A15–Nb
3X was accompanied by a decrease in its Cr concentration (
Figure 11h).
Relationships between the parameters VEC and Δχ of the A15–Nb
3X with Ge, Mo, Nb and Sn are shown in
Figure 12 and
Figure 13, respectively. The aforementioned parameters were calculated as described in [
44]. The parameters VEC and Δχ increased with increasing Mo and Nb concentrations (
Figure 12a,b and
Figure 13a,b) and decreased with increasing Ge and Sn concentrations (
Figure 11c,d and
Figure 13c,d).
The relationship between the parameters VEC and Δχ of the A15–Nb
3X is shown in
Figure 14. This paper presents for the first time new data for relationships between solutes in the A15–Nb
3X, namely
Figure 11, (see [
44,
47]) and between parameters of A15–Nb
3X and solutes, namely
Figure 12 and
Figure 13 (see [
44,
47,
60]). The aforementioned new data complements the data for relationships between solutes and between parameters and solutes in the A15–Nb
3X that our research group presented for RMICs, also for the first time since 2018 (see [
44,
60]).
To the authors’ knowledge, this is the first time that such comprehensive data for the A15–Nb
3X have been presented for the solutes (
Figure 11) and parameters (
Figure 12,
Figure 13 and
Figure 14) for an A15 compound in a RCCA/RMIC. These data supplement the data for A15 compounds in [
44]. The two sets of data together with the data in [
47,
60] have increased the capabilities of the alloy design methodology NICE for the design [
62] and development of metallic UHTMs [
12].
Relationships between solutes and between solutes and the parameters VEC and Δχ of the eutectic are shown in
Figure 15. The said parameters were calculated as discussed in [
45,
63]. The Al and Cr concentrations in the eutectic increased as its Ti content decreased (
Figure 15a,b), which increased the VEC parameter (
Figure 15c). The parameter Δχ of the eutectic decreased as its <Si> = Al + Ge + Si + Sn content increased (
Figure 15d).
This paper presents for the first time new data for relationships between solutes and between parameters and solutes for a eutectic of the A15–Nb
3X and C14–NbCr
2 based Laves phase, namely
Figure 15, in a metallic UHTM. The aforementioned new data complements the data for relationships between solutes and between parameters and solutes in eutectics with bcc (A2) solid solution (Nb
ss) and βNb
5Si
3 that our research group presented for RMICs, also for the first time since 2018 (see [
45]). To the authors’ knowledge, this is the first time that such data for a eutectic of the A15–Nb
3X- and C14–NbCr
2-based Laves phase in a RCCA/RMIC have been presented in the literature and supplements the data for eutectics in RM(Nb)ICs and RCCAs/RMICs (see [
45,
60]).
The map of the parameters VEC and Δχ of the phases in NT1.1–AC is shown in
Figure 16. The map shows clear correlations (R
2 > 0.87) between phases (see figure caption) and confirms their synergy and entanglement (see Section 4 in [
12]) in the microstructure of NT1.1–AC. The synergy of solutes and phases, as well as their entanglement, is further supported by relationships between solutes in different phases, examples of which are shown in
Figure 17. The latter shows that as the Al and Ti concentrations in the A15–Nb
3X increased those of Al and Ti in βNb
5Si
3 decreased (
Figure 17a,b), that a decrease in the Al content of the silicide was accompanied by an increase in the Cr concentration in the A15–Nb
3X (
Figure 17c), and that the Al concentration in the C14–NbCr
2-based Laves phase increased with that in the A15–Nb
3X high <X> (
Figure 17d), whereas as Ti and Cr concentrations in the A15–Nb
3X high <X> increased, those in the C14–NbCr
2-based Laves phase decreased (
Figure 17e,f).
As we discussed earlier, the βNb
5Si
3 was the primary phase, and solidification continued with the A15–Nb
3X and the eutectic of the A15–Nb
3X- and C14–NbCr
2-based Laves phases. As the concentration of Ti increased in the silicide, so did the concentrations of Al (
Figure 7d), Cr (
Figure 7g), Sn (
Figure 7h) and Ge (
Figure 7f), the parameters VEC and Δχ of the silicide, respectively, deceased and increased (
Figure 8c,d) and (
Figure 9d,e) with Ge and Sn contents, whereas in the A15, the concentrations of Ti (
Figure 17a) and Al (
Figure 17b) decreased, as did the concentrations of Sn (
Figure 11f,i), of Ge (
Figure 11g) and the parameters VEC and Δχ of the A15–Nb
3X (
Figure 12c,d and
Figure 13c,d, respectively), but the Cr content increased (
Figure 11h). The aforementioned trends in relationships between solute concentrations and between parameters and solute concentrations are examples of the synergy of solutes and parameters in the βNb
5Si
3 and A15–Nb
3X intermetallics, and of the synergy and entanglement of the two phases (abovementioned figures and
Figure 16).
Also, there was synergy and entanglement between the C14–NbCr
2-based Laves and the A15–Nb
3X high <X> phases (
Figure 16 and
Figure 17d–f). In the Laves phase, an increase in the Ti concentration was accompanied by (i) an increase in the Al content (
Figure 3b), and a decrease and increase, respectively, in the parameters VEC (
Figure 5b) and Δχ (
Figure 5e) and (ii) a decrease in the Cr content (
Figure 3a) and an increase and decrease, respectively, in the parameters VEC (
Figure 5a) and Δχ (
Figure 5d). The decrease in Cr in the Laves phase was linked (iii) with an increase in the Si content (
Figure 4c) and with an increase and decrease, respectively, in the parameters VEC (
Figure 5c) and Δχ (
Figure 5f), with an increase in the Ge (
Figure 4e) concentration and decrease in the Sn content (
Figure 4d).
To the authors’ knowledge, this is the first time that correlations between C14–NbCr
2 Laves, A15–Nb
3X, βNb
5Si
3 and eutectic of A15–Nb
3X and C14–NbCr
2 Laves in a RCCA/RMIC are shown in a phase map based on the parameters VEC and Δχ (
Figure 16). Note that correlations between bcc (A2) solid solution, C14–NbCr
2-based Laves phase and βNb
5Si
3 silicide were also shown for the first time recently in [
46] in a phase map based on the same parameters (see Figure 13 in [
46]) for a RCCA/RMIC of comparable chemical composition. The maps in
Figure 16 of this work and Figure 13 in [
46] complement parameter maps of phases in metallic UHTMs and improve the design of metallic UHTM materials or material systems [
12,
46,
60,
62,
64]. The aforementioned phase maps, together with parameter maps of alloys [
60,
63] and of bond coat alloys for environmental coatings [
64], add to the capabilities of the alloy design methodology NICE [
62] and “synergistic metallurgy” (see Section 7 in [
12]) regarding the development of metallic UHTMs.
3.2. Heat Treated
After the heat treatments for 100 h and 200 h at 1500 °C, the microstructure of NT1.1–HT consisted of the βNb
5Si
3 silicide and A15–Nb
3X compound, as shown in
Figure 1b, which shows the diffractogram after the 200 h heat treatment. The actual chemical composition of NT1.1–HT200, which was measured using EDS, was (4.1 ± 0.7)Al–(4.5 ± 0.3)Cr–(4.9 ± 0.3)Ge–(0.9 ± 0.2)Hf–(7.2 ± 0.3) Mo–(33.8 ± 0.9)Nb–(19.9 ± 1.6)Si–(4.4 ± 0.5)Sn–(19.4 ± 0.2)Ti–(0.9 ± 0.4)W and was close to that of the as-cast alloy. The chemical composition of NT1.1–HT200 corresponded to that of a RCCA/RMIC, as was the case for the NT1.1–AC.
The presence of the Laves phase that was suggested by the XRD data was not confirmed by a detailed study of the microstructure using EDS. In other words, both the Laves phase and the eutectic that were observed in NT1.1–AC were not stable after the two heat treatments. The typical microstructure of NT1.1–HT200 is shown in
Figure 18, which shows that Ti-rich silicide also formed (
Table 3) in between A15–Nb
3X grains. The volume fraction of the Ti-rich silicide was low (
Table 2). In
Table 2 and
Table 3, the data of NT1.1–HT200 are for the bulk, i.e., for phases uncontaminated with oxygen.
The βNb
5Si
3 silicide (Nb/(Ti + Hf) = 1.77), Ti-rich silicide (Nb/(Ti + Hf) = 1.22) and the A15–Nb
3X compound were the stable phases in NT1.1–HT. Similarly with NT1.2–HT, Ti-rich silicide was formed but instead of the bcc (A2) solid solution that was stable in the alloy NT1.2, the A15–Nb
3X was stable in the alloy NT1.1. The stable intermetallics in NT1.1 were “complex concentrated” (CC, or “compositionally complex”), as was the case with the silicides in NT1.2 [
46]. The Nb/(Ti + Hf) ratios of the silicide corresponded to those of tetragonal Nb
5Si
3 [
51], in agreement with the XRD data. No Ti-rich A15–Nb
3X was observed in NT1.1–HT after both heat treatments.
Compared with the βNb
5Si
3 in NT1.1–AC (
Table 1), the βNb
5Si
3 in NT1.1–HT200 was richer in Al, Cr, Ge, Sn and Ti and poorer in Hf, Mo, Nb, Si and W (
Table 3) and the Ti-rich silicide was richer in Al, Cr, Ge and Ti and poorer in Hf, Mo, Nb, Si, Sn and W. Essentially, the silicide was W-free. Compared with the A15–Nb
3X in NT1.1–AC (
Table 1), there were notable changes in the concentrations of Mo and Nb, that, respectively, decreased and increased, as well as a decrease in the Ti content of the A15–Nb
3X in NT1.1–HT200 (
Table 3). Below, we shall consider each phase separately.
Relationships between solutes in A15–Nb
3X are shown in
Figure 19. The concentrations of Si and Ge increased with Ti content (
Figure 19b,c), whereas those of Cr, Sn and Mo decreased (
Figure 19a,d,h). With increasing Si concentration, the Ge content increased (
Figure 19e) while those of Sn, Mo and W decreased (
Figure 19f,k,l). With increasing Ge concentrations, the Sn and Mo contents decreased (
Figure 19g,i) and that of Ti increased (
Figure 19c). Correlations of solutes with Al were less strong (R
2 < 0.7). The Al concentration in the A15–Nb
3X decreased as its Ge, Si and Ti concentrations increased, whereas it increased with increasing Mo and Sn concentrations.
Figure 19a,b,e,f,h,k,l gives for the first time new data for the A15–Nb
3X, and
Figure 19c,i is in agreement with data for NT1.1–AC (
Figure 11e,j). However, the trends shown in
Figure 19d,g,j are opposite those in NT1.1–AC (
Figure 11i,g), owing to changes in the chemical composition of phases that occurred after the heat treatment and the absence of the Laves phase and the eutectic in NT1.1–HT.
Relationships between the parameters VEC, Δχ and solutes in A15–Nb
3X in NT1.1–HT are shown in
Figure 20. Both the Δχ and VEC parameters increased with Mo content (
Figure 20a,b), as was the case in NT1.1–AC (
Figure 12b and
Figure 13b), and decreased with increasing <X> = Al + Ge + Si + Sn concentration (
Figure 20c,d).
Figure 20c,d gives for the first time new data about relationships of the parameters Δχ and VEC with <X> of A15–Nb
3X. The parameter VEC increased with increasing Δχ (
Figure 20e), the same trend as in NT1.1–AC (
Figure 14).
Relationships between solutes in the silicide in NT1.1–HT are shown in
Figure 21. Increasing the Al concentration in the silicide increased the concentrations of Ti, Si and Ge (
Figure 21a,d,f) and decreased the concentrations of Mo, Cr and Sn (
Figure 21b,c,e,l). An increase in the Ge content of the silicide decreased its Cr, Mo and Sn concentrations (
Figure 21g–i) and increased the concentration of Si (
Figure 21j), and the latter increase was accompanied by an increase in the Sn content (
Figure 21k).
Figure 21b,d–f,h–k gives for the first time new data for the Nb
5Si
3 and
Figure 21a shows the same trend as
Figure 7d. However,
Figure 21c,g,l shows opposite trends compared with
Figure 7g,f,e, owing to the changes in the chemical composition of phases that occurred after the heat treatment and the absence of the Laves phase and eutectic.
Relationships between the parameters VEC and Δχ and solutes in Nb
5Si
3 are shown in
Figure 22. The parameter VEC decreased with increasing Ge and Ti concentrations in the silicide, in agreement with the data for NT1.1–AC (
Figure 8), but not for the parameter Δχ, which also decreased with increasing Ge and Ti concentrations in the silicide (see
Figure 9). Compared with the Ti-rich silicide, the VEC of βNb
5Si
3 changed very little as the Ge content of the silicide increased (
Figure 22b).
VEC versus Δχ maps of the βNb
5Si
3 are shown in
Figure 23.
Figure 23b, which includes data for the binary (unalloyed) βNb
5Si
3, should be compared with the data for the
B-free silicide in Figure 6 in [
60]. The comparison shows that the same trend was followed for the silicide in NT1.1–HT, as was the case for NT1.1–AC (
Figure 10b). However, owing to the changes in the chemical composition of the βNb
5Si
3 after heat treatment, the trend in the VEC versus Δχ map of the βNb
5Si
3,
excluding data for the unalloyed Nb
5Si
3, which is shown in
Figure 23a, was opposite that shown in
Figure 10a for the βNb
5Si
3 in NT1.1–AC.
The VEC versus Δχ map of the stable phases in NT1.1–HT is shown in
Figure 24a. The map shown in
Figure 16 “evolved” to that in
Figure 24a after the heat treatment. We can show the “evolution” of microstructure at a particular temperature using a VEC, Δχ, time diagram (see
Figure 24b). The latter is specific to T = 1500 °C, and shows (i) that the silicide “evolved” to Ti-rich silicide and βNb
5Si
3, (ii) that the Laves phase and eutectic were not stable and (iii) that the A15–Nb
3X high <X> also was not stable. To the authors’ knowledge, this is the first time that the “evolution” of microstructure is shown for a RCCA/RMIC using VEC versus Δχ maps and a VEC, Δχ, time diagram. This “evolution” links the metallic UHTM with risk (IRIS) and environment–material interactions (CEMI) and enhances the capabilities of “synergistic” metallurgy regarding alloy development; see Section 7 in [
12] and
Section 4 below.
The nano-hardness and Young’s modulus of the stable phases in NT1.1–HT were studied using nanoindentation. EDS was used to determine the chemical composition of each phase as close as possible to the nanoindentation points. In nanoindentation, from the unloading curve the stiffness,
S, the phase can be measured. The stiffness is correlated with the reduced modulus
Er with the following equation:
where
P is the load, h is the displacement and
A is the projected surface area of the indentation. The reduced modulus
Er accounts for the effects of a non-rigid indenter during loading and is given by the following equation:
where
Es and
νs are Young’s modulus and Poisson’s ratio of the phase and
Ei,
νi are the parameters for the indenter [
65]. A rearrangement of the last equation gives the actual modulus,
Es, of the phase as follows:
The values of
Ei and
νi were specified in the TriboScope manual [
66] as 1140 GPa and 0.07, respectively. The
Es was calculated for two different values of
νs, namely 0.320 for the A15–Nb
3X (the average of the Poisson ratio values for A15 Nb
3Al, Nb
3Ge, Nb
3Si, Nb
3Sn [
67]), and 0.263 for the silicide [
68].
The nano-hardness and Young’s modulus data for the microstructure in
Figure 18 are shown in
Figure 25. The average Young’s modulus and nano-hardness values, respectively, for the two phases in NT1.1–HT200 were
Es = 232.6 ± 5.4 GPa (range of 219.4 to 244.8 GPa), nanoH = 17.2 ± 0.5 GPa (range of 16.5 to 18.1 GPA) for the βNb
5Si
3, and
Es = 204.5 ± 7.3 GPa (range of 181.2 to 217 GPa), nanoH = 14.7 ± 0.4 GPa (range of 13.4 to 15.3 GPa) for the A15–Nb
3X. The Ti-rich silicide had
Es = 258.7 GPa and nanoH = 20.5 GPa. In NT1.1–HT200, the difference in the properties of the βNb
5Si
3 and the Ti-rich silicide was significant. Compared with the data for the alloy NT1.2 [
46], Young’s modulus of the βNb
5Si
3 was slightly lower and the nano-hardness was essentially the same (
Es = 250.3 GPa, nanoH = 17.6 GPa), but for the Ti-rich silicide, Young’s modulus was significantly lower (
Es = 281.5 GPa) and the nano-hardness slightly lower (nanoH = 19.2 GPa). Young’s modulus of the Ti-rich silicide in NT1.1–HT200 was very similar to that of the βNb
5Si
3 in NT1.2. (Note that the Ti-rich silicide in NT1.1 was richer in Al and Cr and poorer in Si and Ti compared with the Ti-rich silicide in NT1.2, with Nb/(Ti + Hf) ratios, respectively, 1.21 and 1.13.)
In the nano-hardness data of the βNb
5Si
3, note the repeated downward trends in nano-hardness (i.e., decrease in nano-hardness) between the nanoindentation points 2, 3, 4 and 10, 11, 12 and 16, 17 and 24, 25 and 32, 33, 34 and 37, 38 and the repeated upward trends in nano-hardness (i.e., increase in nano-hardness) between the nanoindentation points 17, 18, 19 and 25, 26 and 31, 32 and 36, 37 (
Figure 25a). In Young’s modulus data of the βNb
5Si
3, note the repeated downward trends of
Es (i.e., decrease in
Es) between the nanoindentation points 2, 3, 4 and 5, 6 and 37, 38, and between the points 10, 11, 12 and 16, 17, 18, and the upward trends of
Es (i.e., increase in
Es) between the nanoindentation points 1, 2 and 18, 19 and 24, 25, 26 (
Figure 25b). Similarly, the nano-hardness of A15–Nb
3X increased between nanoindentation points 20, 21, 22, 23 (
Figure 25a) and Young’s modulus between nanoindentation points 20, 21, 22 (
Figure 25b). The property changes in specific areas of the microstructure shown in
Figure 18 were associated with changes in the parameters VEC and Δχ (
Figure 26).
The parameters VEC and Δχ of the microstructure in
Figure 18 are shown in
Figure 26. The parameter Δχ of the silicide exhibited less variation between points compared with the parameter VEC, and the opposite was the case for the parameters of the A15–Nb
3X. Whereas between the nanoindentation points 1 to 6 the change in the VEC parameter of βNb
5Si
3 was marginal, between the nanoindentation points 16, 17 and 18, a change in VEC was clear (
Figure 26a). Similarly, whereas there was a marginal change in the parameter VEC of the A15–Nb
3X between the nanoindentations 12, 13 and 14, and a slight change between the nanoindentations 7, 8 and 9, a change in Δχ was noticeable between the said nanoindentation points (
Figure 26b). The Δχ parameter of the Ti-rich silicide (red data in
Figure 26b) did not differ significantly from that of the βNb
5Si
3 but its VEC was noticeably lower (
Figure 26a).
In the alloy NT1.1–HT, the silicide was the β(Nb,Cr,Hf,Mo,Ti,W)
5(Al,Ge,Si,Sn)
3, the Nb was substituted by Cr, Hf, Mo, Ti and W, and the Si was substituted by Al, Ge and Sn. The A15 compound was the A15–(Nb,Cr,Hf,Mo,Ti,W)
3(Al,Ge,Si,Sn), the Nb was substituted by Cr, Hf, Mo, Ti and W, and the Si was substituted by Al, Ge and Sn. The calculated Young’s modulus of binary (unalloyed) Nb
5Si
3 is 291, 268.9 and 188.5 GPa for the αNb
5Si
3, βNb
5Si
3 and γNb
5Si
3 polymorphs, respectively [
68]. Also, for the αNb
5Si
3 polymorph, Young’s moduli of 314.3 and 325 GPa have been reported, respectively, in [
69,
70]. The data in [
68] show that for 12.5 at.% Ti addition in the silicide the calculated Young’s moduli of α(Nb,Ti)
5Si
3, β(Nb,Ti)
5Si
3 and γ(Nb,Ti)
5Si
3, respectively, were 313.8, 238.5 and 207.1 GPa. In other words, according to first-principles calculations, the substitution of Nb by Ti in the silicide increased the modulus of the α and γ polymorphs and decreased the modulus of the β polymorph.
The calculated Young’s moduli of A15 Nb
3Al, Nb
3Ge, Nb
3Si and Nb
3Sn, respectively, are 164, 193.3, 210 and 172.7 GPa [
67]. For the A15 Nb
3Al and Nb
3Sn, the values of 193.5 and 195.3 GPa, respectively, were also reported in [
71] and the experimental modulus of 179 GPa was reported by Old and Charlesworth [
72,
73]. As the A15–Nb
3X was rich in Mo, we also considered data for A15–Mo
3X compounds. The calculated Young’s moduli of A15 Mo
3Al and Mo
3Ge were 312.3 GPa and 315.7 GPa, respectively [
74,
75]. For A15 Mo
3Si, calculated Young’s moduli were 338.3 GPa [
75], 315.9 GPa [
76], 370 GPa [
77] and 343 GPa [
78] and experimental moduli were 327.5 GPa [
79] and 295 GPa [
80]. The calculated modulus of 333 GPa of Mo
3Si increased when alloyed with 12 at.% addition of Al or Nb, respectively, to 347 GPa and 344 GPa [
81]. For thin films of Nb
3Sn deposited on Nb substrates, the experimental Young’s modulus of Nb
3Sn was in the range of 150.1 to 201.9 GPa [
82]. A low Young’s modulus of 134.9 GPa has also been reported for Nb
3Sn [
83].
The Young’s modulus and hardness of the alloyed βNb
5Si
3 in NT1.1–HT200 were close to the properties of the β(Nb,Cr,Hf,Ti)
5(Al,Si)
3 silicide in the RMIC alloy JN1-HT (241.4 GPa and 17.4 GPa, respectively) [
84]. Our group reported that the substitution of Si by Ge in the silicide increases the hardness of the latter [
61]. This was supported by the recent work of Zhaobo Li et al. [
85], who reported that the nano-hardness and Young’s modulus of the β(Nb,Cr,Ti)
5(Al,Ge,Si)
3 silicide in the as-cast RM(Nb)IC (Nb silicide-based alloy) Nb–22Ti–16Si–2Al–2Cr–5Ge was 21.46 GPa and 279.2 GPa, respectively.
The Young’s modulus of the alloyed βNb5Si3 in NT1.1–HT200 was close to that of the β(Nb,Ti)5Si3 (see above) and that of the Ti-rich silicide was close to that of unalloyed β(Nb,Ti)5Si3. It is suggested that the Ti-rich silicide in NT1.1–HT was Ti-rich β(Nb,Ti)5Si3. The Young’s modulus of the alloyed A15–Nb3X was significantly lower than that of unalloyed Mo3X compounds (X = Al, Ge, Si) and close to that of A15–Nb3X compounds (X = Al, Ge, Si, Sn). In actual fact, Young’s modulus of the alloyed A15–Nb3X was very close to that of the A15–Nb3Si and the γ(Nb,Ti)5Si3.
To the authors’ knowledge, nano-hardness data for binary or alloyed A15 compounds are not available in the open literature. We have calculated the hardness of binary (unalloyed) A15–M
3X (M = Mo, Nb and X = Al, Ge, Si, Sn) compounds using the following equations [
86]:
with data for the bulk modulus B, shear modulus G, Young’s modulus E and Poisson ratio ν from the literature. The calculated hardness data are given in
Table 4.
The average and the minimum and maximum (i.e., the range) values of the nano-hardness of the alloyed A15–Nb
3X of this work were close to HV
3 of A15–Nb
3Si and HV
2 of A15–Mo
3Ge. Note that the experimental data of Pudasaini et al. [
82] for A15–Nb
3Sn thin films on Nb substrates showed that the thin film with the highest E (201.9 GPa) had nanoH = 12.8 GPa, whereas the film with nanoH = 14.4 GPa had E = 161.2 GPa.
The calculated HV
1 of the β(Nb,Cr,Hf,Mo,Ti,W)
5(Al,Ge,Si,Sn)
3 silicide of this work, using Equation (1) with the experimental Young’s modulus (average, and range (minimum and maximum)) values given above and ν = 0.281 from [
67] for βNb
16Ti
4Si
12, was 13.3, 12.5 and 14 GPa, respectively, for the average, minimum and maximum E
s values. All three calculated values of nanoH were lower than the experimental ones.
If we were to use the experimental nanoindentation and chemical analysis data for the A15–Nb
3X and silicide grains in NT1.1–HT200 and calculate the change in a property or parameter per atomic percent addition of solute X (i.e., calculate ΔP/X) using the maximum and minimum concentration values of X (i.e., C
max.
X and C
min.
X, respectively) and the corresponding property or parameter values for the aforementioned concentrations, we obtain the data for the alloyed βNb
5Si
3 and A15–Nb
3X shown in
Table 5 and
Table 6, respectively. In these tables, ΔP/X = (P
max.
X − P
min.
X)/(C
max.
X − C
min.
X), where P is (i) a property, namely Young’s modulus or nano-hardness (shown as HV in
Table 5 and
Table 6), or (ii) a parameter, namely VEC or Δχ. This is the same approach to the calculation of property or parameter changes per at.% solute that was discussed in [
46].
To understand the data in
Table 5 and
Table 6, we must consider the microstructure of NT1.2–HT, relationships between solutes, between solutes and parameters, between parameters of specific phases and between phases. We shall make use of the above discussion,
Figure 19,
Figure 20,
Figure 21,
Figure 22,
Figure 23 and
Figure 24, and the concepts of synergy and entanglement that were discussed in [
46].
Consider the synergy and entanglement of A15–Nb
3X and βNb
5Si
3 (
Figure 24). As Ge partitioned to the A15 and the silicide, the concentrations of Ti and Si increased (
Figure 19c,e) and those of Sn and Mo decreased (
Figure 19g,i) in the former intermetallic, and the contents of Al and Si increased (
Figure 21f,j) and those of Cr, Mo, Sn and Si decreased (
Figure 21g–j) in the latter intermetallic. The increase in Ti concentration in the A15–Nb
3X was accompanied by the decrease in its Cr content (
Figure 19a), whereas in the βNb
5Si
3 the increase in Al content was accompanied by the increase in the Ti, Si and Ge concentrations (
Figure 21a,d,f) and the decrease in the Mo, Cr and Sn concentrations (
Figure 21b,c,e). Owing to changes in solute concentrations, the parameters Δχ and VEC of the A15–Nb
3X changed with Mo and <X> contents (
Figure 20) and those of the βNb
5Si
3 changed with Ge and Ti content (
Figure 22), and the alloyed silicide “shifted further away” from the unalloyed βNb
5Si
3 in the Δχ versus VEC map (
Figure 23a).
Owing to synergy and entanglement, a change in the concentration of solute element X brought changes to properties and parameters of the βNb
5Si
3 silicide, namely the changes Δ
ES/X, Δ[nano-H]/X (shown as Δ[HV]/X in
Table 5 and
Table 6), Δ[VEC]/X and Δ[Δχ]/X (see
Table 5). The same was the case for the A15–Nb
3X. Comparison with the data for Δ
ES/X, Δ[HV]/X, Δ[VEC]/X and Δ[Δχ]/X in Table 12 in [
46] shows differences in the contributions of all elements, as well as differences in the sign (meaning positive or negative) of changes attributed to Cr, Hf, Mo, Si and Sn for Δ
ES/X, or Cr, Si, Sn and Ti for Δ[HV]/X, or Al, Ge, Nb, Sn, Ti and W for Δ[VEC]/X, or Al, Cr. Nb, Ti and W for Δ[Δχ]/X. For example, we note that for Ti in the β(Nb,Cr,Hf,Mo,Ti,W)
5(Al,Ge,Si,Sn)
3 silicide in NT1.1, the Δ
Es/Ti was positive and equal to +8.77 GPa/at.% compared with +6.28 GPa/at.% for the alloyed silicide in NT1.2 (see Table 12 in [
46]), whereas it was negative (−2.432 GPa/at.%) for the β(Nb,Ti)
5Si
3 (see discussion of properties of alloyed silicide in Section 4.2 in [
46]). Also, we note that for Al in the silicide, the Δ
Es/Al was negative (−1.24 GPa/at.%) in NT1.2 (Table 12 in [
46]) and negative (−7.83 GPa/at.%) in NT1.1 (
Table 5). These differences are attributed to the βNb
5Si
3 being in synergy with A15–Nb
3X in the alloy NT1.1 and not with the bcc (A2) solid solution, as was the case in the alloy NT1.2 [
46].
Note that
Table 6 shows for the first time how properties of A15–Nb
3X in a RCCA/RMIC change with solute addition.


