Article

Optimization of Water Content in a High-Shear Wet Granulation Using an In-Line Rheometer

by
Vadim Stepaniuk
1 and
Valery A. Sheverev
2,*
1
Lenterra Inc., Newark, NJ 07103, USA
2
Department of Applied Physics, Tandon School of Engineering, New York University, Brooklyn, NY 11201, USA
*
Author to whom correspondence should be addressed.
Powders 2026, 5(2), 12; https://doi.org/10.3390/powders5020012
Submission received: 16 January 2026 / Revised: 10 March 2026 / Accepted: 25 March 2026 / Published: 1 April 2026

Abstract

An in-line process analytical technology that measures drag force exerted by wet mass in a high-shear granulator on a thin cylindrical probe enabled real-time identification of distinct stages in high-shear wet granulation of acetaminophen. The technology known as Lenterra in-line rheometer outputs two parameters, the mean force pulse magnitude (MFPM) and the coefficient of variation of force pulse magnitude (CVFPM), that characterize granule densification and size uniformity in real time, providing a process fingerprint. The MFPM and CVFPM evolutions measured during granulation of acetaminophen formulations for varied amounts of added water were compared with the results of particle size distribution (PSD) analysis of the powder released after granulation and with the tablet dissolution tests. The comparison demonstrated a correlation between salient features of the MFPM and CVFPM evolutions and particle size distributions for different water amounts. Based on the measured process fingerprints, it was possible to identify the water amount optimal for best granulation output. In addition, MFPM and CVFPM evolutions allowed for the prediction of a granulation endpoint. The results indicate that in-line rheometry can be a useful tool for formulation development and scale-up of high-shear wet granulation processes.

1. Introduction

High-shear wet granulation (HSWG) is a high-energy, rapid process that uses granulating fluid (typically water) and a cohesive substance (binder) to affect the adhesion of primary powder particles [1]. The primary powder particles agglomerate during HSWG into larger granules. The wet and/or dry granules are then milled to produce more uniformly sized granules. While all three constituent unit operations (HSWG, drying, and milling) play significant roles in the quality of the product of this process (granule density/porosity and size distribution), HSWG is the most significant contributor because it drives interparticle adhesion and formation of agglomerated granules.
Process analytical technology (PAT) tools are important for robust and reproducible manufacturing of pharmaceutical dosage forms [2]. Specifically, PAT tools can be used to guide development and scale-up of new drug product processes [3,4].
A key objective in monitoring and controlling the HSWG unit operation is the need to identify optimum process parameters that result in consistent quality of the product. These process parameters could be, for example, the impeller speed, mixing time, or the amount of water used for granulation. The quality attributes that affect the following unit operation (wet milling and/or drying) include wet mass properties (adhesion or agglomerate formation, and particle size distribution (PSD)). The quality attributes of the finished drug product that are affected by the HSWG unit operation include uniformity of drug content (affected by granule PSD) and drug release or dissolution (affected by granule density or porosity) [5].
A range of PAT tools are available to enable defining, monitoring, and allowing the control of the HSWG unit operation [1,3,6,7]. Based on the physical property measured, they may be roughly divided into optical methods, rheological methods, and others.
Optical methods such as near-infrared (NIR) spectroscopy [8,9,10], focused beam reflectance measurement (FBRM) [11], spatial filtering technique (SFT) [12], and Raman spectroscopy [7] are based on probing the powder or wet mass with optical or electro-magnetic radiation and observing reflected light intensity or spectra. NIR is primarily used for in-line monitoring of moisture or active pharmaceutical ingredient (API) content. Focused beam reflectance measurement and spatial filtering techniques measure granule chord length distribution during granulation, which can be correlated with PSD. While offering direct insight into powder characteristics, optical technologies have one common shortcoming, specifically a requirement for an optical window placed in direct contact with the powder. Special care should be taken to prevent powder/wet mass adhesion to the optical window. Optical probes require frequent cleaning, calibration and/or use of complex chemometric models. For example, a mechanical scraper in the FBRM can be employed to clean the optical window at a predefined time interval to allow the use of the probe in cohesive or sticky powders during pharmaceutical wet granulation [13,14]. In NIR measurements, the probe may require periodical extraction from the powder for cleaning before returning to the measurement position [15]. These procedures introduce additional complexity to the device and interrupt continuous monitoring of the granulation process.
Other less popular techniques include capacitance [16], acoustics emissions [17], and stress and vibration measurements [18,19]. Some of these techniques provide limited information about the state of the powder while others are associated with submerging a probe with movable parts that are prone to frequent fouling [7].
Traditionally, rheological characteristics of the powder deduced from the impeller torque (or related amperage or power consumption) were used for monitoring HSWG. Impeller torque is related to forces exerted by the wet mass on the impeller blades [20,21] and can be viewed as an integration of all the forces and force moment arms along each of the mixing blade arms. Torque and power consumption measurements correlate well with each other [22]; however, it is understandable that amperage and power consumption are influenced by motor wear and tear, changes in motor temperature, and other equipment characteristics. But since measuring power consumption is an easier and cheaper method, it is used most often in evaluation of the impeller mechanical load [7] and has been considered an “excellent” in-line measure of the load on the main impeller [7,20,21].
Typical power and torque time dependencies over a granulation cycle start with a flat low-level dry mixing stage, rise steeply when binder fluid or solution is added, then either level off into a plateau or slowly decrease, followed by flattening in an over-granulation stage. According to the standard granulation theory [23], useable granules can be obtained in the region that begins with the peak of the signal derivative. Therefore, in real-time monitoring, observation of the amperage signal may provide a good indication for the time when the process should be stopped [24,25].
While being intuitively related to the physical parameter of the wet mass, the torque or power consumption measurement, however, is not sufficient for granulation endpoint determination and scaling. Specifically, a number of researchers found that a plateau of the torque versus time dependence did not correspond to the desired granulation endpoint for many formulations [7].
In contrast to the impeller parameter monitoring, Lenterra in-line rheometer (LIR) uses a thin cylindrical probe immersed in wet mass during high-shear wet granulation to measure local forces in a desired location [26]. The probe, known as a drag force flow (DFF) sensor, detects forces exerted by moving powder at a high measurement rate, and its outputs reflect granule density and particle size distribution in real time during the granulation process. Monitoring these parameters allows operators to directly control the process, and analyzing the evolution of these parameters could be used for formulation development, optimization of water addition, determination of the granulation endpoint, and scale-up. The technology has been found to be more sensitive than that based on impeller torque monitoring [26,27] and was successfully used to predict tablet tensile strength [27]. The LIR measurements have also been used as the input variables for a predictive model for tableting die fill depth [28].
The aim of this work was to investigate possible correlations between the LIR output with granule properties and tablet dissolution times while varying the water content in HSWG.

2. Materials and Methods

In this study, acetaminophen (APAP) was used as an active pharmaceutical ingredient. Acetaminophen (paracetamol) is a common and popular choice as a model API in academic and industrial studies of granulation and tableting. It is widely used in research because of its challenging processing properties: poor flowability and tabletability, and relevance to real tablet products. A wide range of API load, from 3%wt. to 97.5%wt., in formulations were studied [29,30,31,32,33,34].
Formulations with 75% APAP (Formulation 1) and 90% APAP (Formulation 2) were compared in this study (see Table 1). The amount of binder, polyvinylpyrrolidone (PVP), was kept the same for both formulations at 5%, to separate binding effects of APAP and PVP. To accommodate the increased APAP content in Formulation 2, the quantities of the remaining excipients were proportionally reduced, and their ratios to one another were maintained consistent between the two formulations. The batch weight of the internal phase for Formulation 1 was 78.6 g, and for Formulation 2 was 79.7 g. The weights of the API and excipients were measured using digital laboratory scales (SF-400D product of Horizon Group, Warren, NJ, USA and GPR-20, product of AWS, Cumming, GA, USA). API was dry mixed with excipients in a granulator following the water addition with a constant flow rate and wet massing. Wet granules were then air-dried in an oven and particle size distribution was determined using sieve analysis. After dried granules were milled, tablets were manufactured using a hand press. Produced tablets were further characterized in a dissolution test using a United States Pharmacopeia (USP) type 2 apparatus.

2.1. High-Shear Wet Granulation

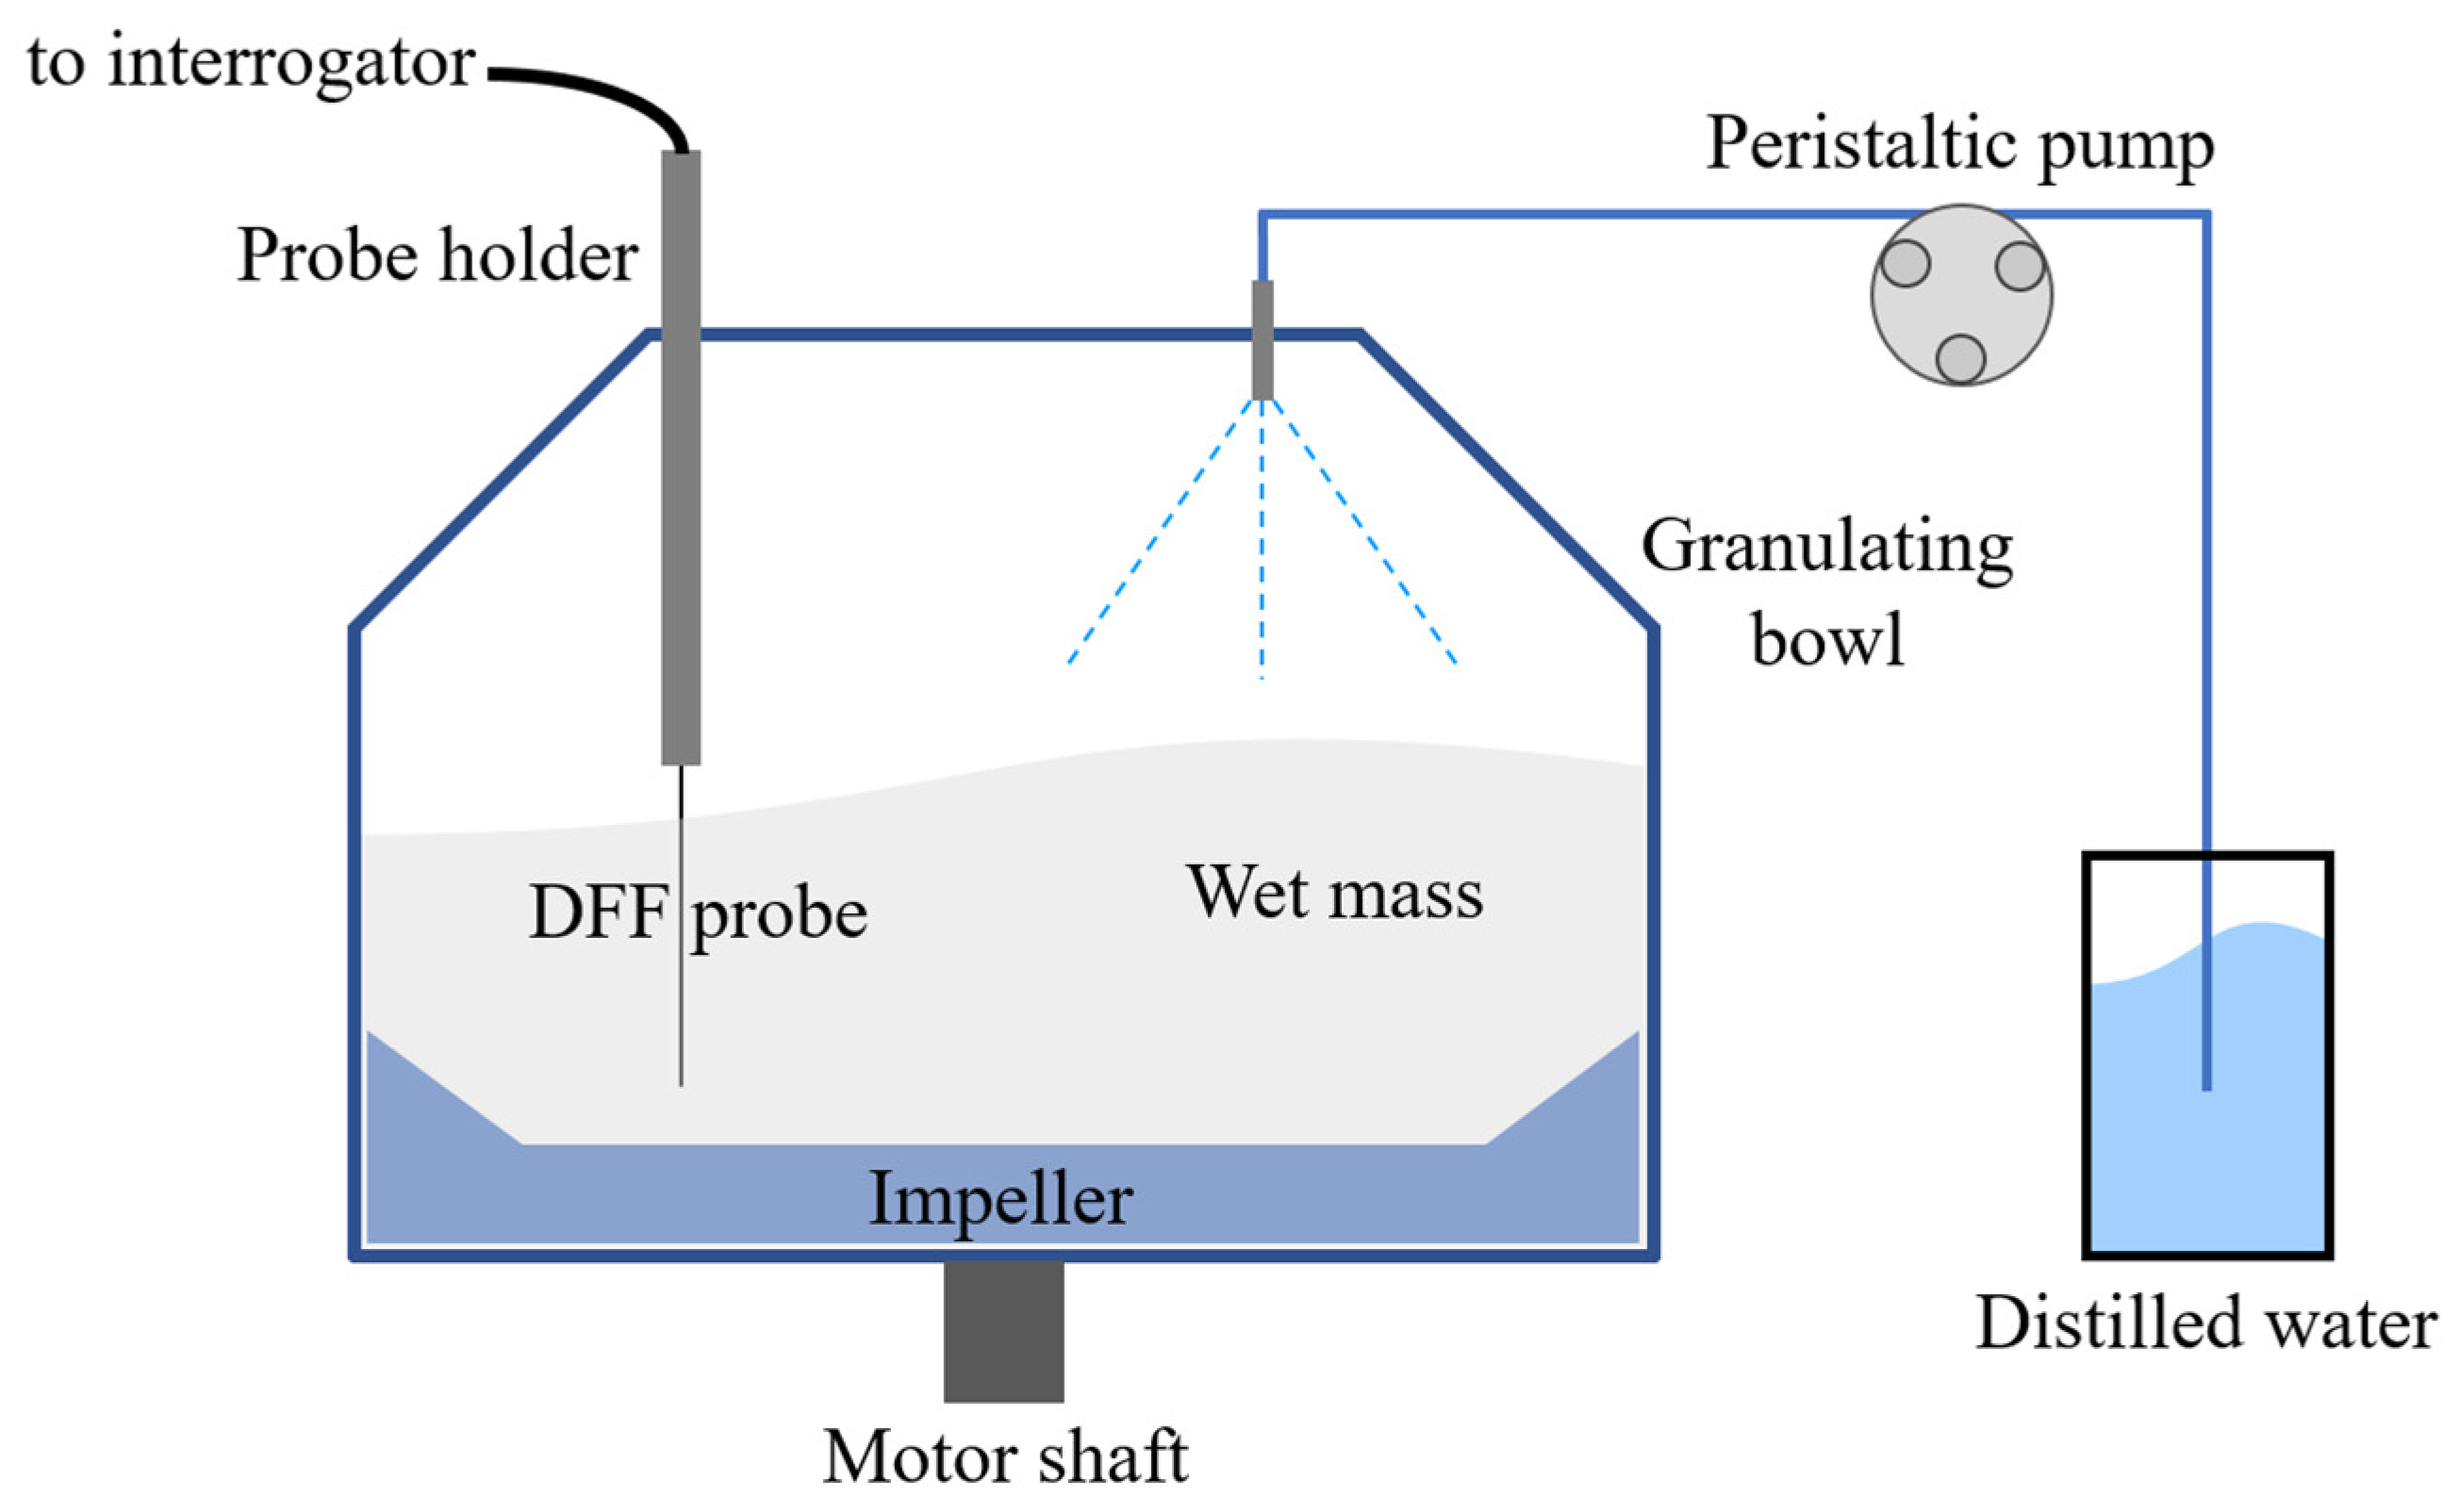
Granulation was performed in a custom made 0.5 L bowl with a three-blade impeller (see Figure 1). The bowl diameter was 100 mm; height was 70 mm. The top portion of the granulating bowl wall was inclined to promote a roping motion of the granulated material. The bowl was installed in a bottom-driven table-top mixer (product of Lenterra Inc., Newark, NJ, USA). Water was added using a precalibrated miniature peristaltic pump (EK1960, product of Gikfun, Dongguan, Guangdong, China) at a fixed flow rate of 5 mL/min for all tests. Water was dispersed into the bowl through a horizontally cut 23-gauge stainless steel needle fixed at the lid and positioned 33 mm from the impeller axis diametrically opposite the DFF probe.

2.2. Lenterra In-Line Rheometer

Lenterra Inline Rheometer (LIR, product of Lenterra Inc., Newark, NJ, USA) consists of a DFF sensor connected to the Lenterra optical interrogator and a host computer [4]. A sensor, type SD-4000-40, with a 40 mm long, 2.8 mm diameter probe (measurement range 4 N) was used. The probe was inserted vertically through the opening in the lid (see Figure 1). The tip of the probe was located 2 mm above the blade or 12 mm above the bottom of the bowl, and 33 mm from the impeller axis or at 66% radial position. Sensor measurement axis was tangential, perpendicular to the bowl radius. The DFF probe position was kept the same for all batches.
The LIR registered force pulses due to impeller blades moving under the sensor tip, and for each pulse found its magnitude (force pulse magnitude, FPM). For a predetermined group of pulses, LIR built a histogram distribution and applied a log-normal distribution fit to find the FPM mean value and width of the distribution. This FPM mean value (MFPM) is the first output of the measurement. The width of the distribution divided by the mean gives a second, independent from MFPM, output: the coefficient of variation (CVFPM). Time evolutions of MFPM and CVFPM represent the granulation process fingerprint. MFPM evolution indicates change in densification of the wet powder during granulation and the CVFPM characterizes uniformity of the granule sizes at various times, i.e., reflects particle size distribution [26]. Observing MFPM and CVFPM evolutions in real time allows operators to see changes in granulation stages in real time and control the process.

2.3. Design of Experiment

Quality by Design (QbD) is a critical framework for high-shear granulation studies, as it facilitates understanding of how variations in granulation process parameters influence the properties of intermediate granules and, consequently, the quality of the final tablet product. In this study, the influence of water amount and wet-massing time on the critical quality attributes of intermediate granules and the final tablet product were systematically assessed. The design of experiment (DoE) was the mixed-level full factorial design with three factors (APAP content, wet mixing time, and water addition intervals) and two levels for the first two factors and three levels for the last factor, developed without the help of a dedicated software. Preliminary experiments have shown that granulations for more than one minute for formulations with 90% APAP resulted in quick formation of large unusable lumps; therefore, these tests were excluded from the analysis.
A total of nine granulations are reported here (see Table 2). Each granulation was coded using the format Fx-Wy-Tz where x denotes the formulation (1 or 2, specified in Table 1), y indicates the volume of water added in milliliters (3, 12, or 16 mL), and z represents the wet-massing duration in minutes (1 or 5 min). For example, F1-W16-T5 corresponds to Formulation 1 prepared with 16 mL of water and wet-massed for 5 min. Levels of the process variables and granulation codes are summarized in Table 2.
Three water addition levels (3, 12, and 16 mL) were selected based on preliminary tests. These levels correspond to conditions of insufficient wetting (under-watering), near-optimal granulation, and overwetting, respectively.
Tests were conducted in the following steps: (1) the dry powder mixture was placed in the bowl and mixed for 3 min; (2) water was added for a predetermined time interval; (3) wet massing continued for a predetermined time. The LIR process fingerprint was recorded for every granulation. The impeller speed was 300 RPM for all batches, and water content and wet-massing time were varied.

2.4. Granule Analysis

Granules produced in high-shear wet granulation were dried in an air fryer (Nuwave Air Frier XL, product of Nuwave LLC, Vernon Hills, IL, USA) at 48 °C for 16 h. Particle size distribution analysis was carried out using Vibrating Screen Sieve Shaker BZS-200 (product of Xinxiang Cobrotech, Xinxiang, Henan, China). Set of 8” stainless steel sieves (product of Gilson Company, Inc., Lewis Center, OH, USA) were used including No. 12, 20, 30, 40, 60, 100, and 170. A total of 30–60 g of granules was sieved for 10 min.

2.5. Tablet Fabrication

Prior to tableting, the moisture content of the granules was measured using the loss on drying method with a moisture analyzer (MA50, product of UXILAII Scientific, Nanjing, Jiangsu, China). For all batches, the moisture content ranged between 0.7% and 1.0%. The air-dried granules were subsequently milled using a burr grinder (HB583product of Aromaster, Newark, NJ, USA). Tablets were then compressed from the milled granules using a TDP-0 manual single-punch tablet press (product of LFA Tablet Presses, Bicester, Oxfordshire, UK) equipped with a 10 mm concave punch and die. The tablets were manufactured with a target weight of 433 mg for Formulation 1 and 361 mg for Formulation 2 to have the same absolute amount of API, 325 mg, in each tablet which is in line with the API amount present in commercially available tablets. At least 10 tablets were manufactured from each granulation batch. The standard deviations in tablet thickness and weight for each batch were below 0.8% and 1.6%, respectively. Prior to dissolution studies, manufactured tablets were stored in sealed Mylar Ziplock bags within a desiccator.

2.6. Tablet Dissolution

For each batch, five tablets were dissolved following the United States Pharmacopeia (USP) dissolution procedure for acetaminophen tablets [35]. Tests were done using an USP type 2 apparatus (SOTAX AT6 CH-4008, product of SOTAX AG, Aesch, Switzerland) in 900 mL of phosphate buffer (pH 5.8) at the temperature of 37 ± 0.5 °C. The paddle rotation was kept at 50 rpm. Samples were taken with a syringe and replaced with the fresh buffer at 0, 1, 2, 3, 5, 7, 10, 15, 30 and 60 min after placing a tablet into a vessel. The samples were further diluted with the buffer and analyzed using a UV/VIS spectrophotometer (UV 5100B, product of Shanghai Metash Instruments Co., Shanghai, China). Transmission coefficient was measured at 243 nm and converted into percentage of the drug released into buffer.

3. Results and Discussion

3.1. Granulation Stages as Observed by LIR

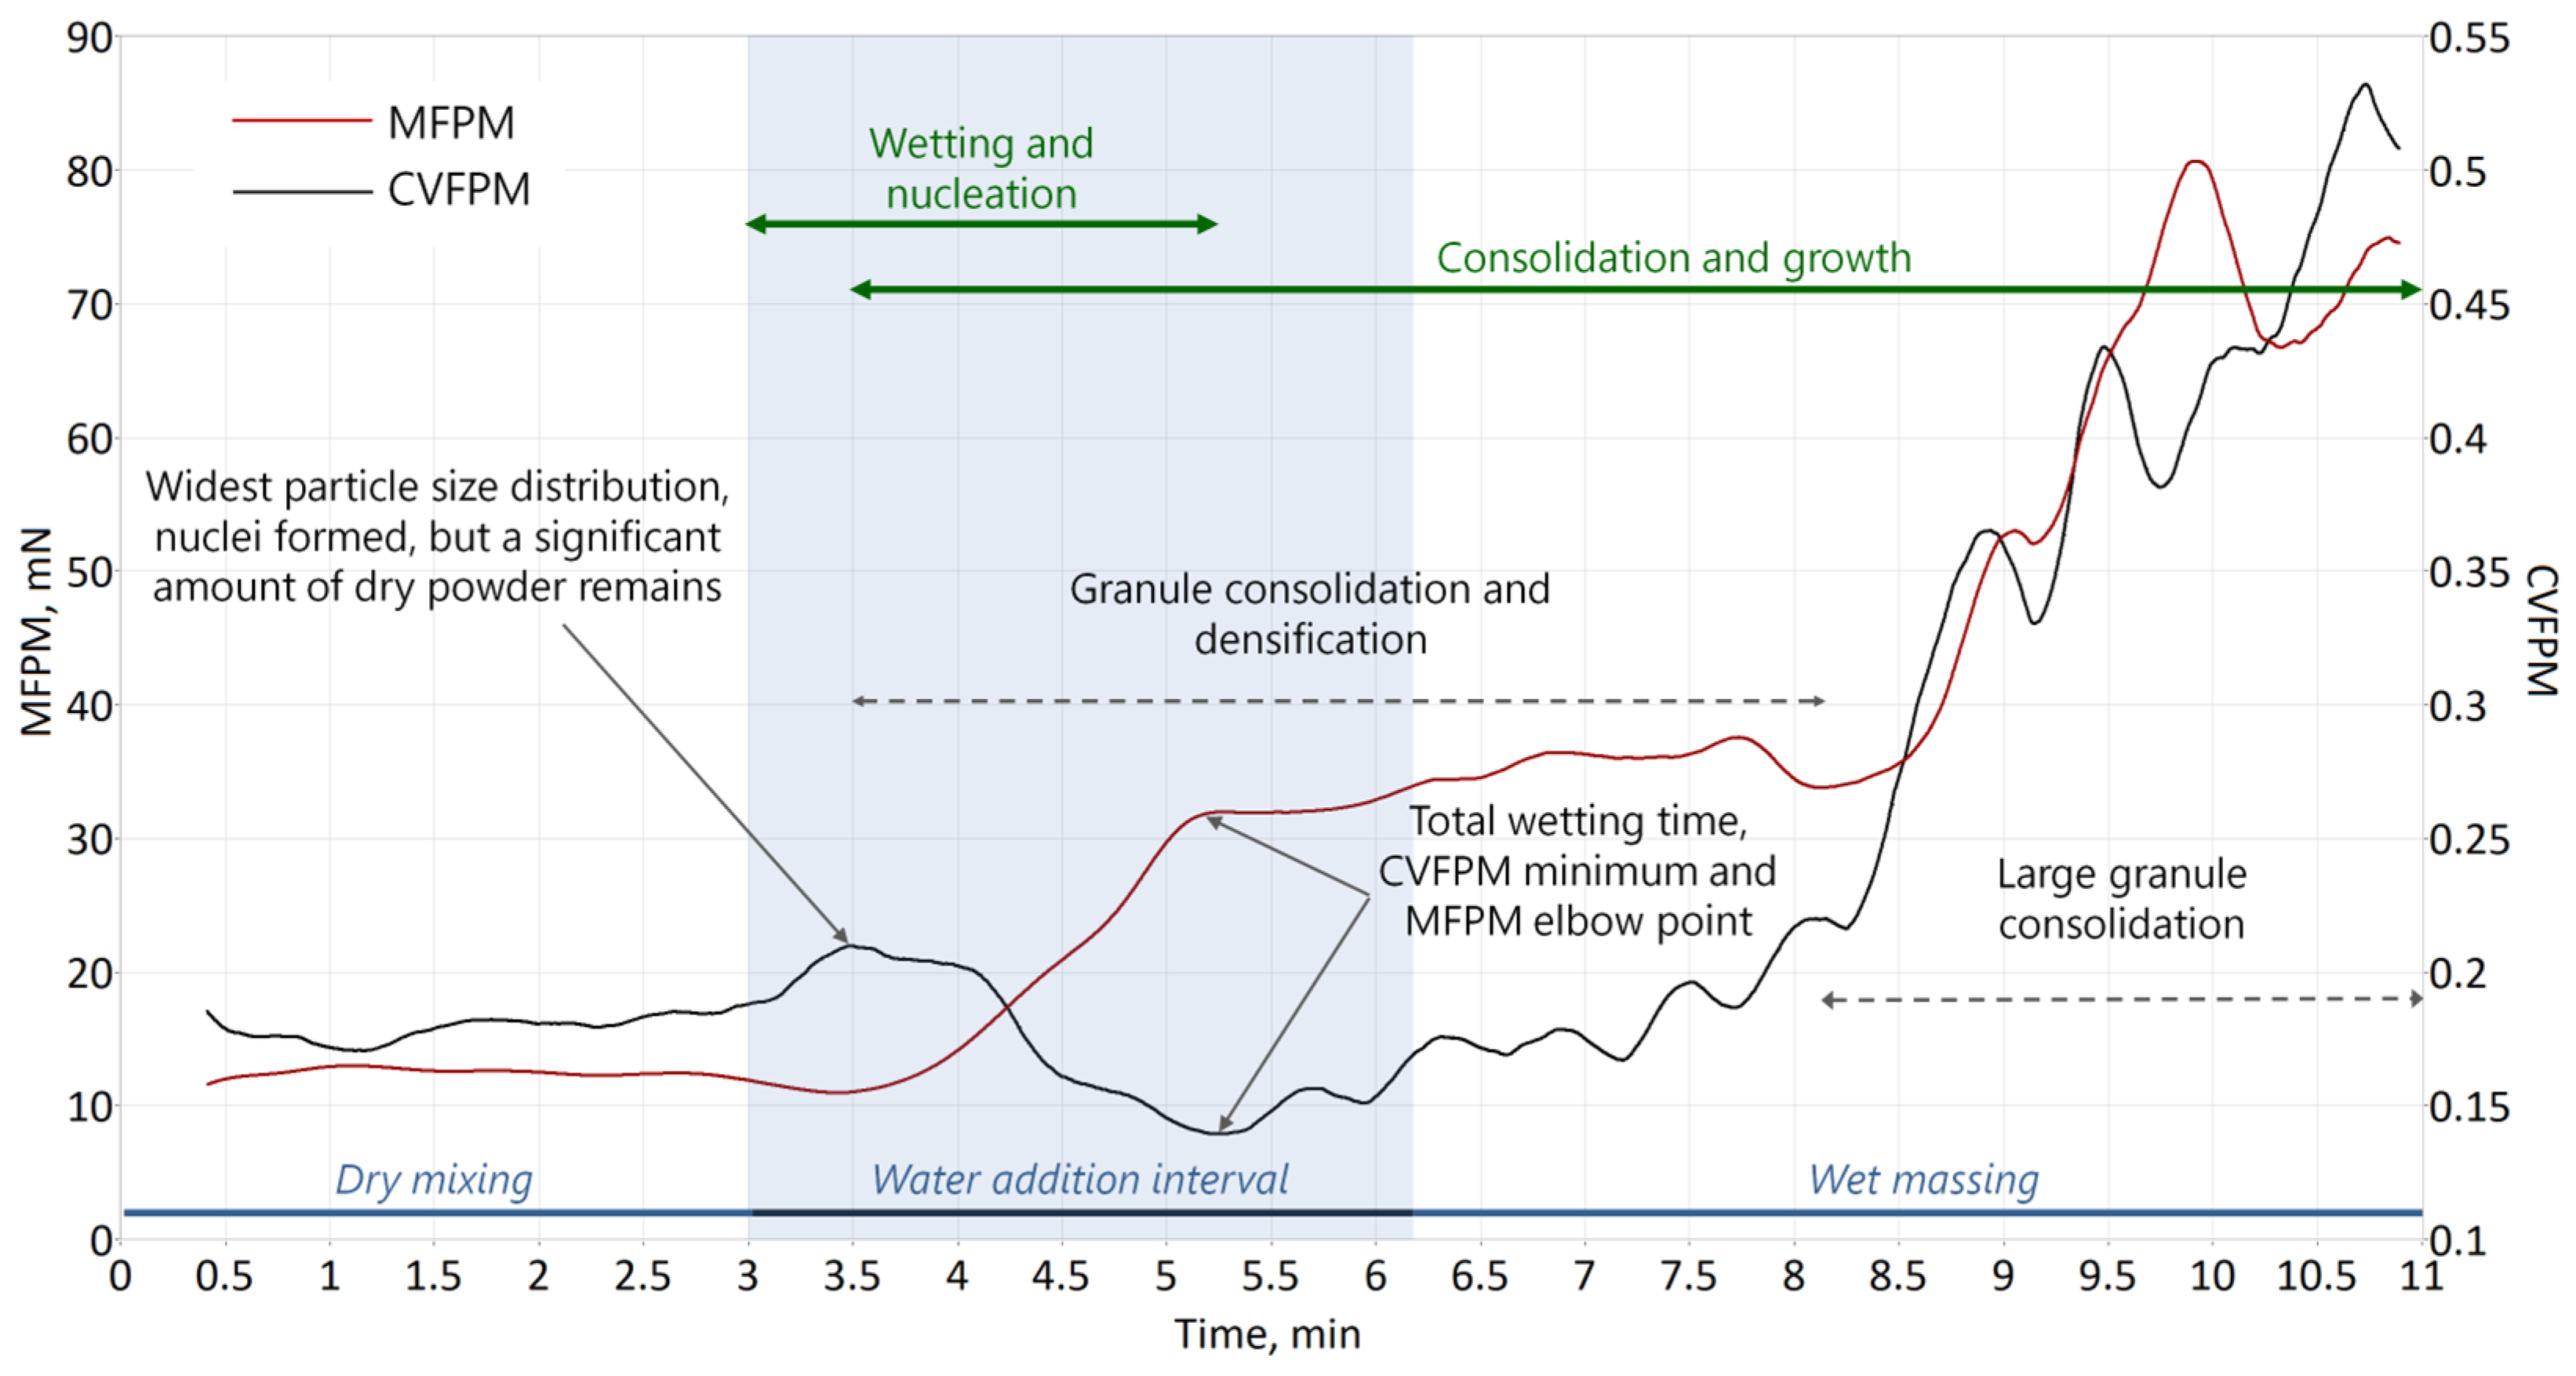
A process fingerprint for one of the granulation cycles (F1-W16-T5) is presented in Figure 2. For this batch, the motor started at zero time instant, the dry powder was mixed for three minutes, water was added for 3.2 min, and wet massing continued for 5 min thereafter. One can identify the following granulation stages:
  • [0 to 3 min] Dry powder mixing. MFPM and CVFPM are steady at relatively low level, reflecting low density and uniformity of the dry powder;
  • [3 to 3.5 min] Start of water addition and extensive nucleation. CVFPM increases reflecting increasing non-uniformity of the powder due to agglomerate formation, reaching maximum at approximately 3.5 min. One would expect the distribution of masses in the powder to be widest at this time, when large number of nuclei and low-density agglomerates formed, but a significant amount of dry powder still remains;
  • [3.5 to 5.3 min] Granule consolidation and densification phase starts. MFPM grows fast reflecting increasing number of granules in the powder; CVFPM begins to fall indicating that uniformity of the powder increases when decreasingly less dry powder remains.
  • [5.3 min] Total wetting, nucleation stage ends at 5.3 min or 2.3 min after water addition started. A minimum is observed at this time instant on the CVFPM evolution, and an elbow point is observed approximately at this time on the MFPM evolution;
  • [5.3 to 8 min] Granule consolidation and densification continue. MFPM continues to grow, CVFPM gradually increases showing secondary maxima and minima, and the formation of increasingly heavy granules widens particle size distribution. Note that the termination of water addition at 6.2 min does not affect the MFPM and CVFPM growth continuing from 5.3 min to 8 min. This means that adding extra amounts of water after 5.3 min does not significantly affect the chemistry of the wet mass;
  • [8 to 10 min] Larger granule consolidation. MFPM and CVFPM increase rapidly, CVFPM demonstrates unstable growth, and MFPM also shows local minima. Figure 3F shows the photograph and particle size distribution of the powder released from the granulator at the end of this granulation cycle. Large granules of 5 to 10 mm were observed.
According to the accepted description [36], a granulation cycle consists of three sets of rate processes: (1) wetting and nucleation, (2) consolidation and growth, and (3) attrition and breakage. In Figure 2, the first two stages are observed; their ranges are shown with green arrows. Continuing granulation further for this batch led to wet mass agglomerating into a few large lumps, apparently indicating that the optimal endpoint of this granulation has already occurred; therefore, the granulation was stopped after 10 min. Note, however, that for the first two stages, MFPM and CVFPM evolutions show details. The wetting and nucleation stage overlaps with the consolidation and growth stage resulting in the formation of salient points on the process fingerprint. The consolidation and growth stage is also split into two phases separated with a salient point where the MFPM and CVFPM dependencies begin to rise rapidly, indicating formation of the larger granules. These salient points apparently characterize specific conditions of the powder, and they are used in this study for correlation with PSD and tablet dissolution data.

3.2. Impact of Water Addition on Granule Properties (Formulation 1)

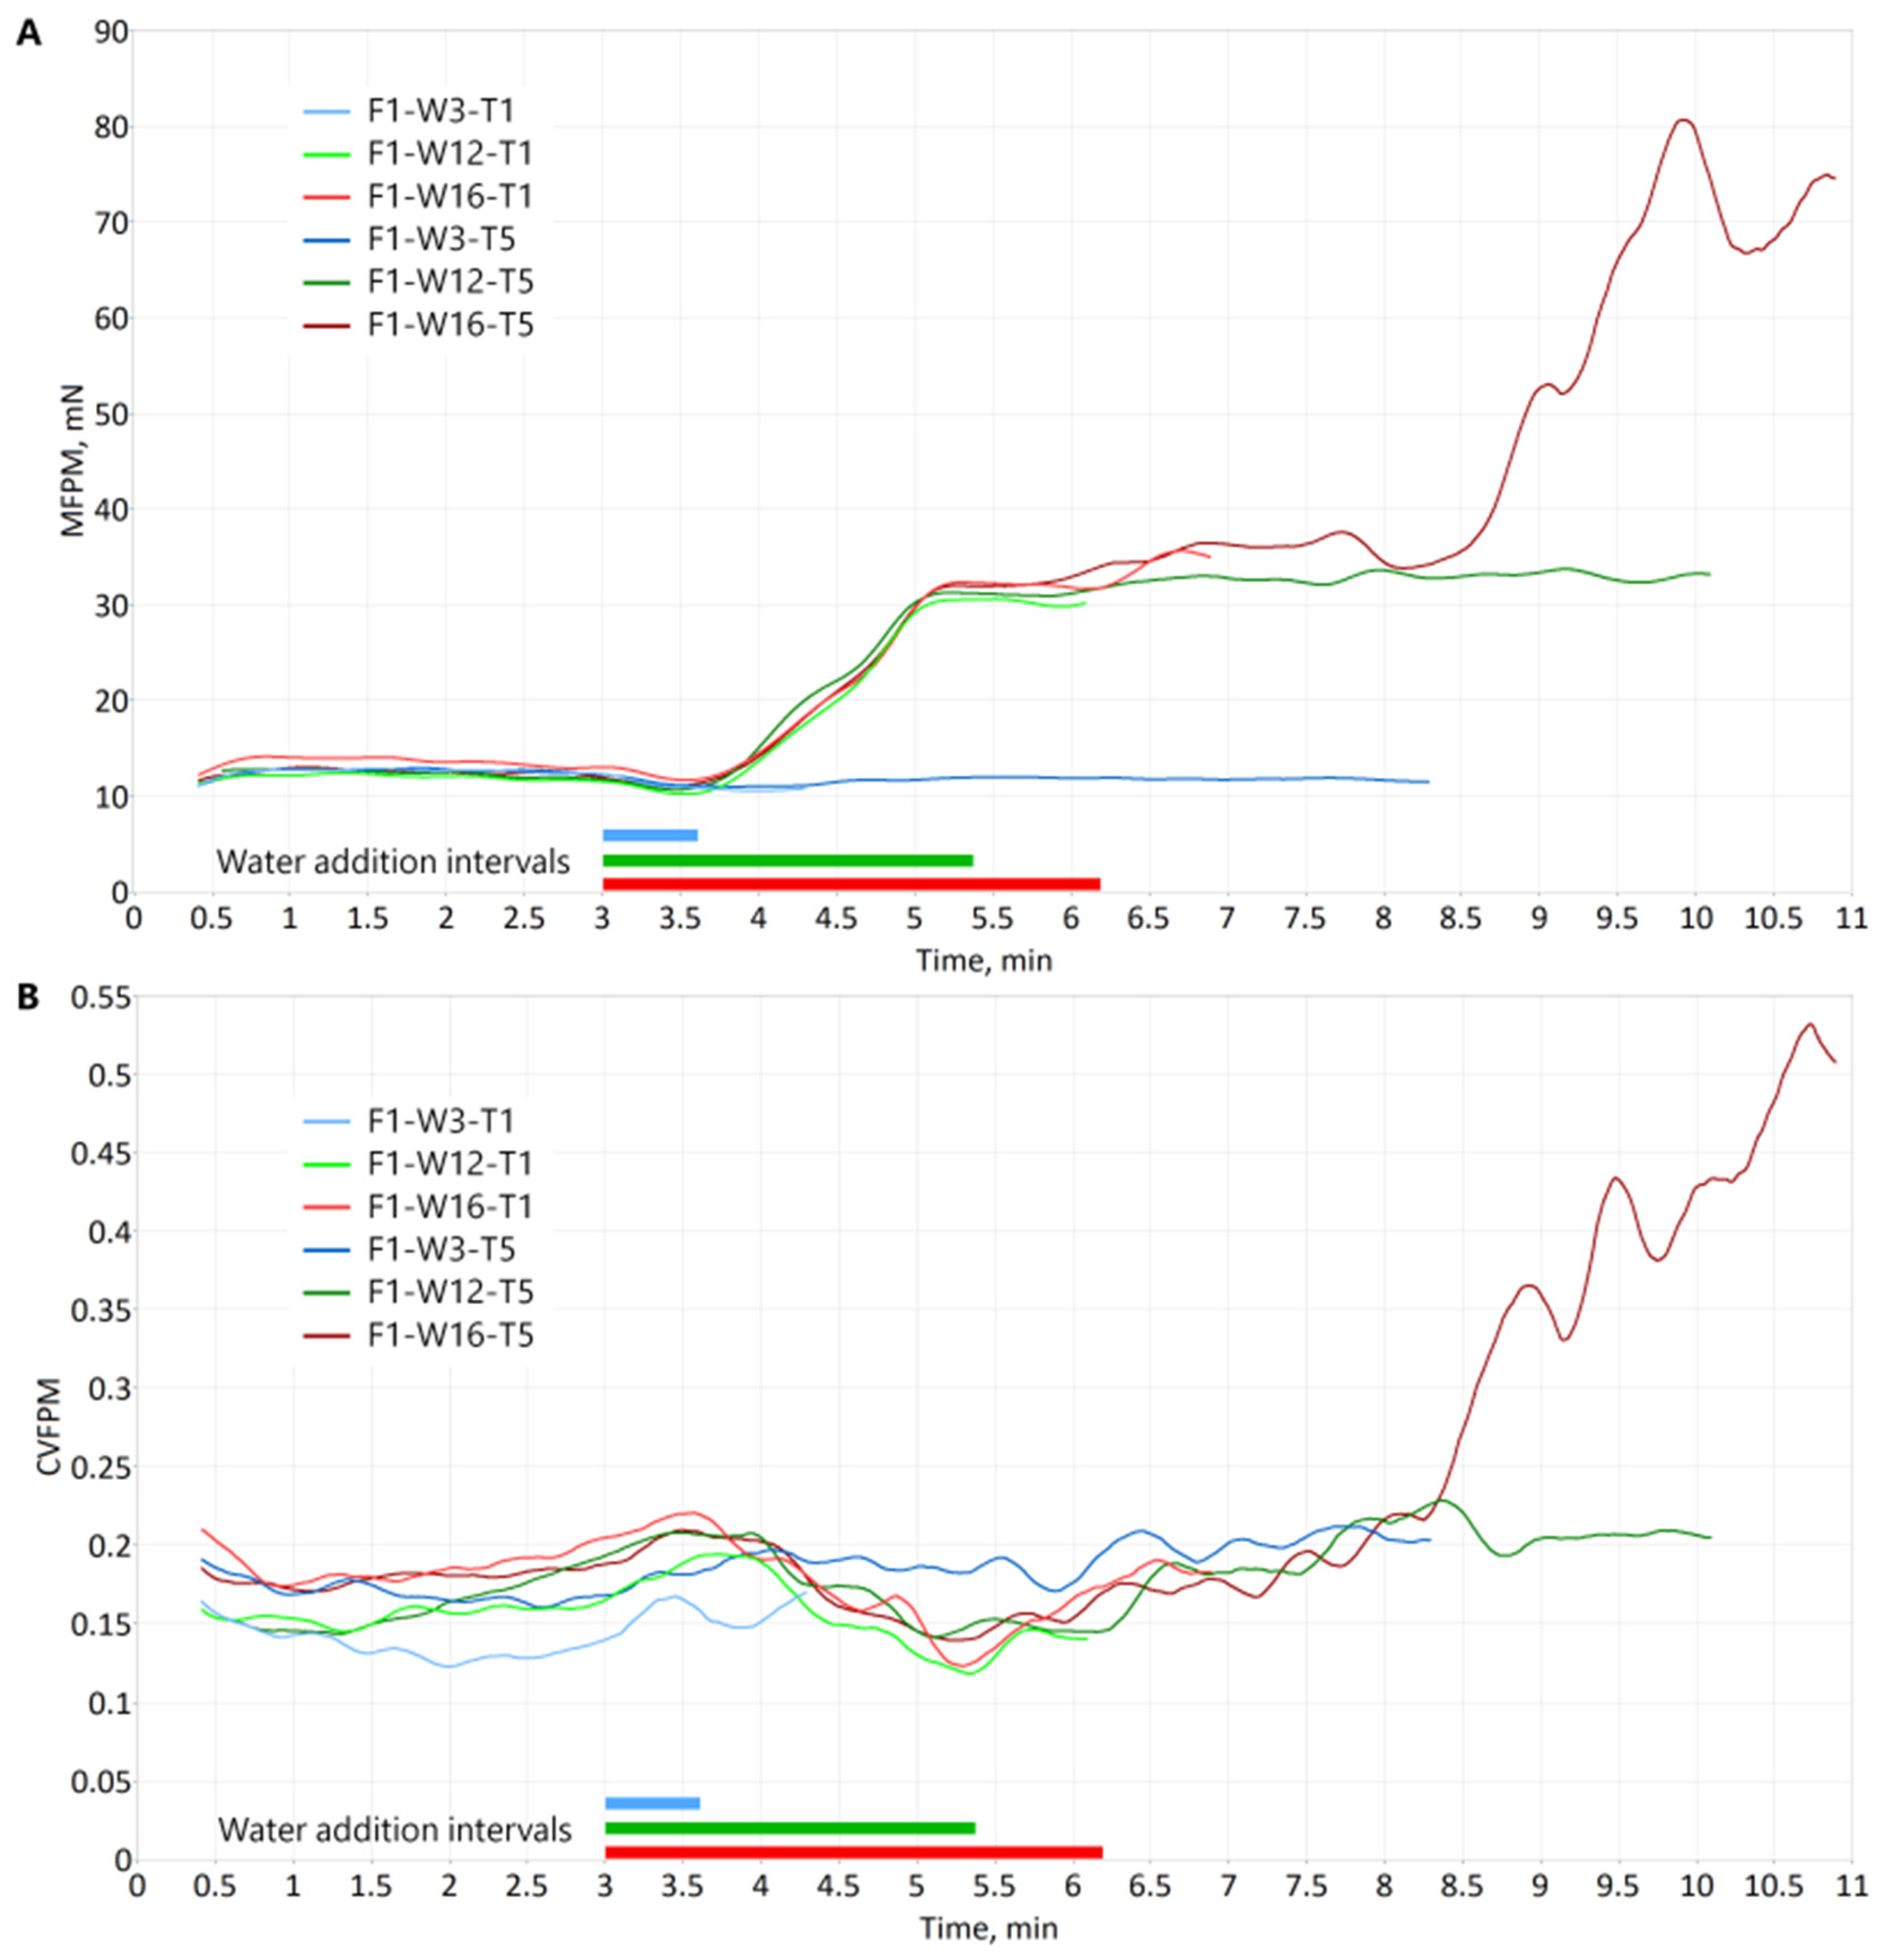
Six fingerprints (plots of MFPM and CVFPM as function of time) for 75% APAP (Formulation 1) are given in Figure 4. Three of them were granulated with a wet-massing time of 1 min (F1-W3-T1, F1-W12-T1, and F1-W16-T1) and the other three with a wet-massing time of 5 min (F1-W3-T5, F1-W12-T5, and F1-W16-T5). In each set, the water addition was 3, 12, and 16 mL, respectively. MFPM and CVFPM plots are split in this figure to allow better separation of multiple granulation fingerprints.
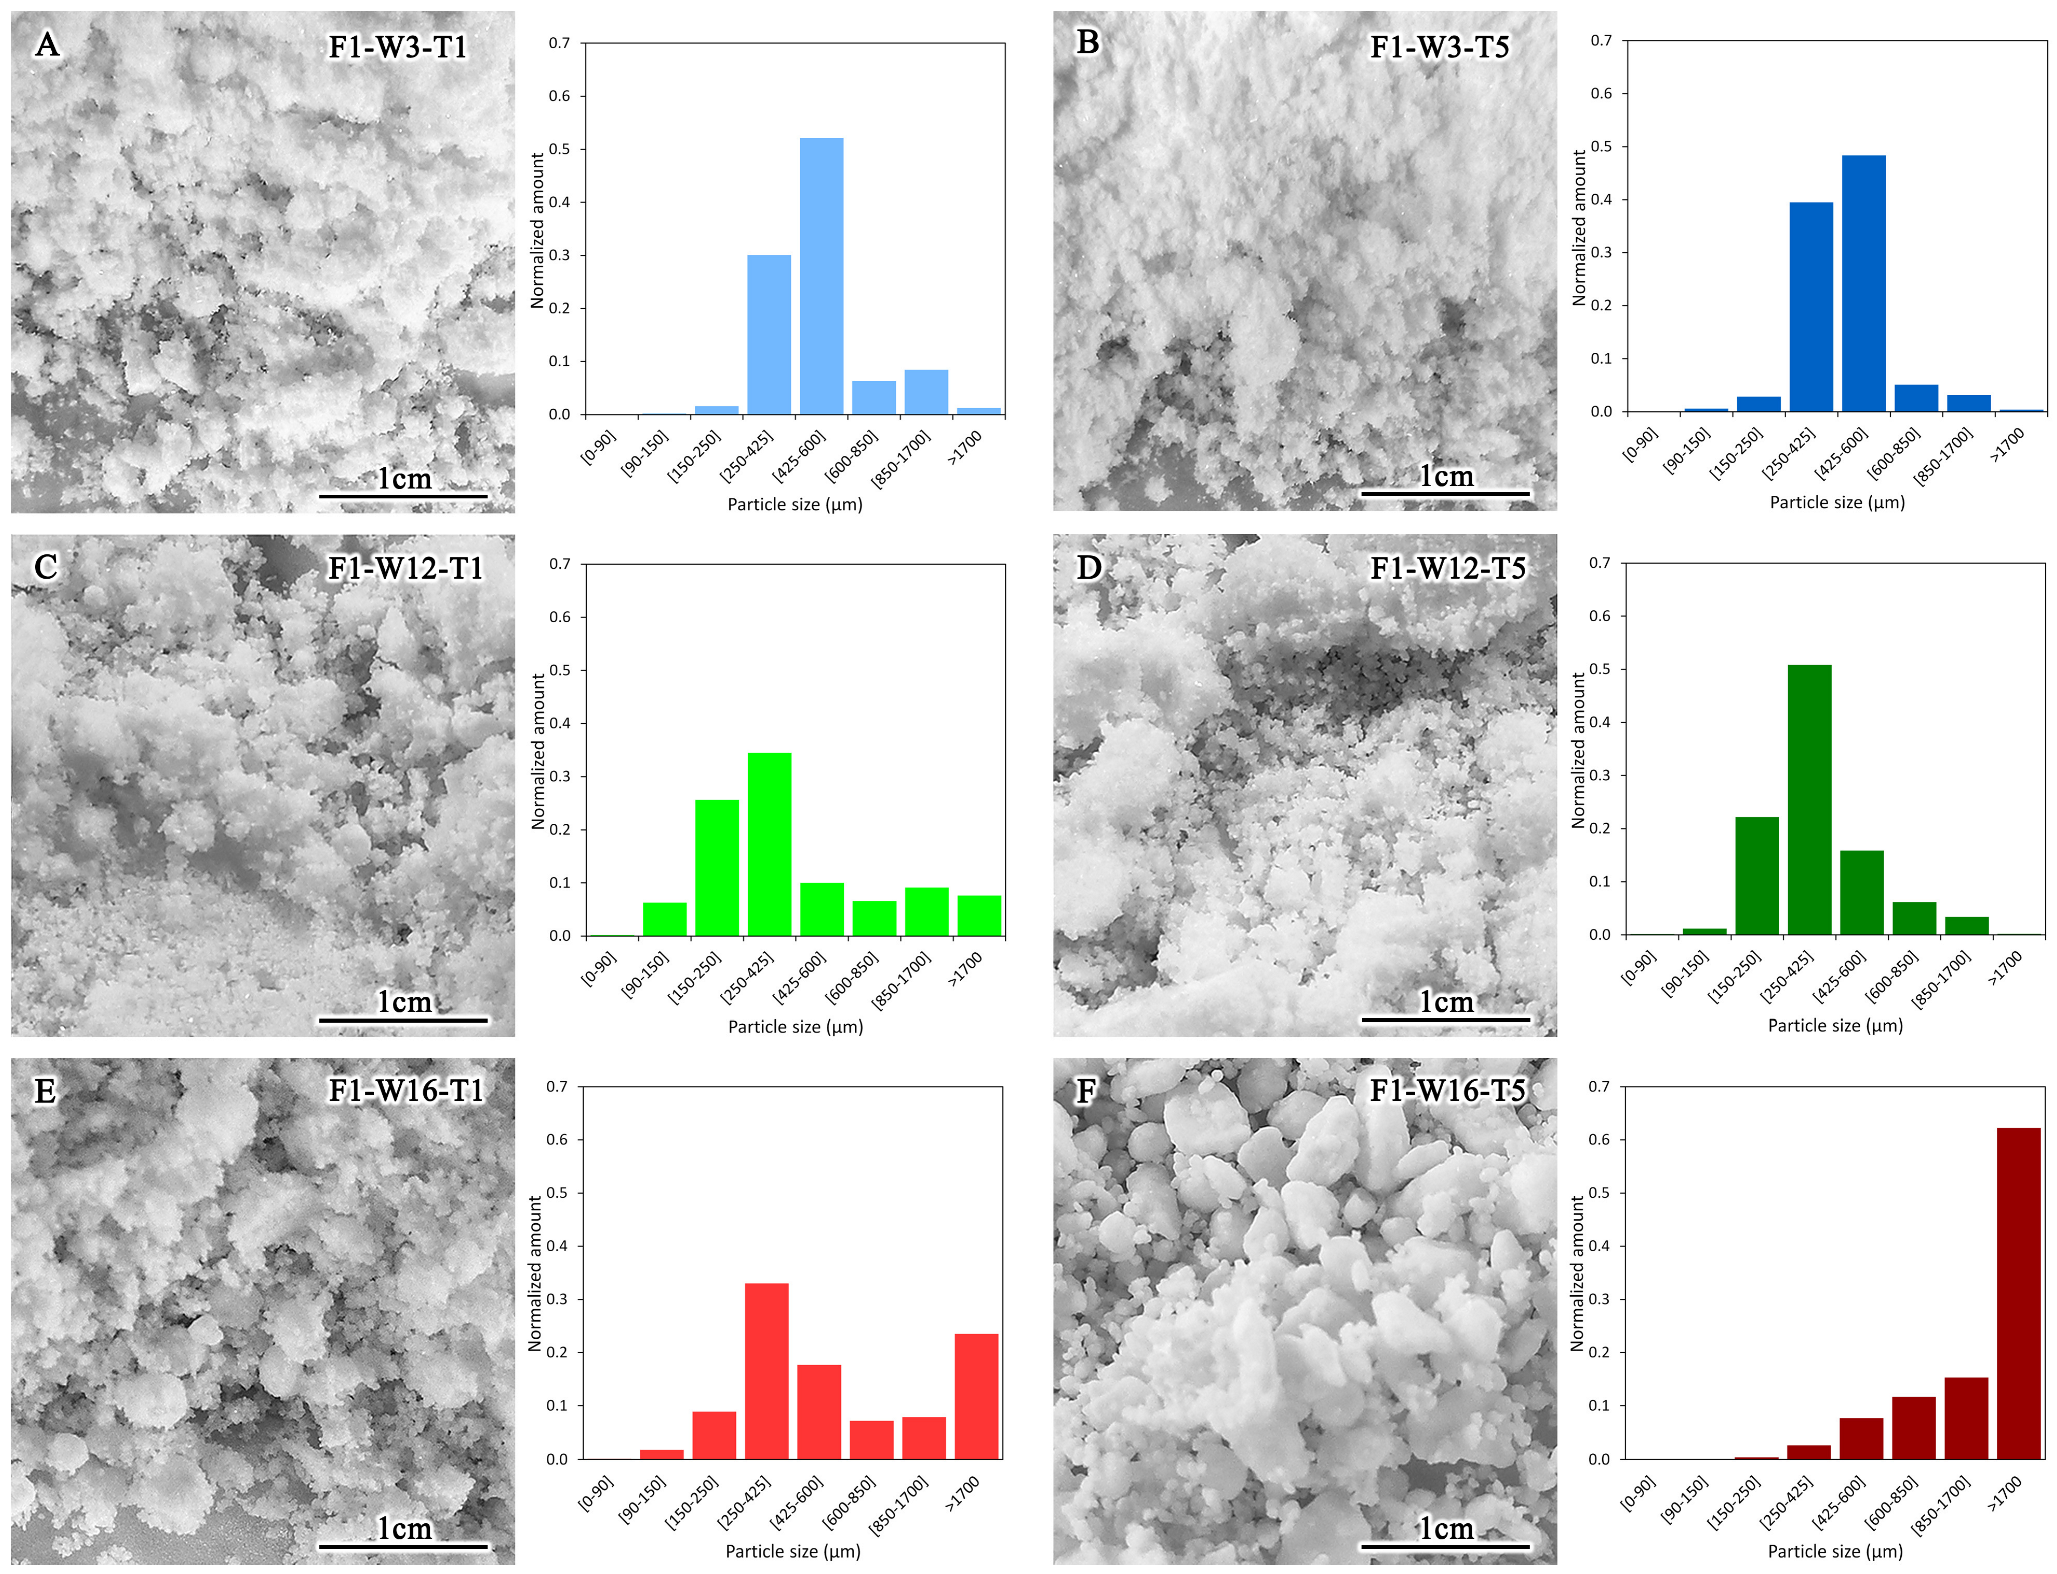
For the 3 mL batches (F1-W3-T1 and F1-W3-T5), both MFPM and CVFPM evolutions before and after water addition do not differ. This small amount of water appears to be insufficient for granulation to start. It is also observable on the photographs in Figure 3A,B. PSD plots (Figure 3A,B) for F1-W3-T1 and F1-W3-T5 batches are similar, which confirms the assumption.
The MFPM and CVFPM evolutions for the remaining batches in Figure 4 (F1-W12-T1, F1-W12-T5, F1-W16-T1, and F1-W16-T5) demonstrate a salient point that is similar to that observed for the F1-W16-T5 batch shown in Figure 2 (repeated in Figure 4A,B with dark red color). Specifically, the elbow point of MFPM and the minimum of CVFPM at 5.3 min are common for all four batches. Both MFPM and CVFPM evolutions are overlapping for up to 8 min for all four batches. Two batches (F1-W12-T5 and F1-W16-T5) continued after 8 min where they show significant difference in both MFPM and CVFPM evolutions. For the 12 mL batch (F1-W12-T5), we do not see the larger granule consolidation stage starting at 8 min that is well pronounced for the 16 mL batch (F1-W16-T5). The difference between the batches is also evident when comparing their PSDs and photographs (Figure 3D and Figure 3F, respectively). On the photograph and PSD for the F1-W12-T5 batch, a number of smaller granules are readily observable, and no well-formed large dense granules are present, while on the photograph and PSD for the F1-W16-T5 batch, no small granules are seen and large well-formed dense granules dominate.
The evolutions of PSD from 1 min to 5 min of wet-massing time is well noticeable for 12 mL and 16 mL batches (see Figure 3C,D for 12 mL, and Figure 3E,F for 16 mL), while for 3 mL batches, no significant changes are observed (Figure 3A,B). As was pointed out earlier, in 3 mL batches the amount of water is insufficient for fully wetting the powder and granule coalescence and densification does not occur for a major part of the powder. For 12 mL and 16 mL batches, however, the granule consolidation and densification is obvious after 1 min of wet massing, as demonstrated by PSDs for 1 min of wet-massing time (Figure 3C and Figure 3E, respectively). A noticeable fraction of larger granules is evident in these histograms. They are both different from the 3 mL batch for either 1 or 5 min massing (Figure 3A,B) where we do not observe granules > 1700 microns. One may also notice that PSD for 12 mL and 16 mL batches after 1 min massing time are similar to each other. The same differences and similarities are observed on MFPM and CVFPM evolutions (light blue, light green, and light red curves in Figure 4A,B).
PSDs of two batches for 12 mL and 16 mL that continued after 8 min are quite different (Figure 3D and Figure 3F, respectively). Between 1 min and 5 min of wet massing for 12 mL, the large granule fractions decreased, creating a close to log-normal particle size distribution. The granules of the 16 mL batch, on the contrary, consolidated into larger agglomerates (dark red column for >1700 microns in Figure 3F). It seems reasonable to deduce that granules formed up to 8 min of wet-massing time for the 16 mL batch were more adhesive than those for the 12 mL batch at this time. Wet massing after 8 min leads to granule consolidation dominating breakage for the 16 mL batch while the opposite is true for the 12 mL batch. These processes are also evident in the process fingerprint for 12 mL and 16 mL batches (green and red lines, respectively, in Figure 4A,B, after approximately 8 min time). One may therefore conclude that the LIR process fingerprint reflects instantaneous granule size distribution during granulation, especially for larger granule fractions.
The MFPM and CVFPM measurements could also be used for optimization of water addition amount and granulation endpoint determination. It seems reasonable to assume that water addition should end soon after the start of the granule growth that is after the minimum of CVFPM and elbow point on the MFPM evolutions seen in Figure 4A,B at 5.3 min. For this formulation (75% APAP), the end of water addition for 12 mL water content (F1-W12-T1 and F1-W12-T5) is 0.1 min after the minimum of CVFPM. One may conclude that when continuing wet massing for several minutes after water addition ends has little influence on the resulting granule properties. This is illustrated first by the observations that the 1 min and 5 min wet-massing MFPM and CVFPM evolutions are flat after the end of respective water additions (see Figure 4) and, second, because PSDs for these two batches are similar (see Figure 3C,D) as well as tablet dissolution times (discussed in Section 3.3). It does not seem reasonable, however, to continue wet massing after the MFPM and CVFPM start rising sharply at 8 min, as discussed earlier. Therefore, the wet massing of 1 min realized for a 12 mL 75% APAP batch is considered sufficient, and this time instant can be recommended as a granulation endpoint

3.3. Impact of Water Addition on Granule Properties (Formulation 2)

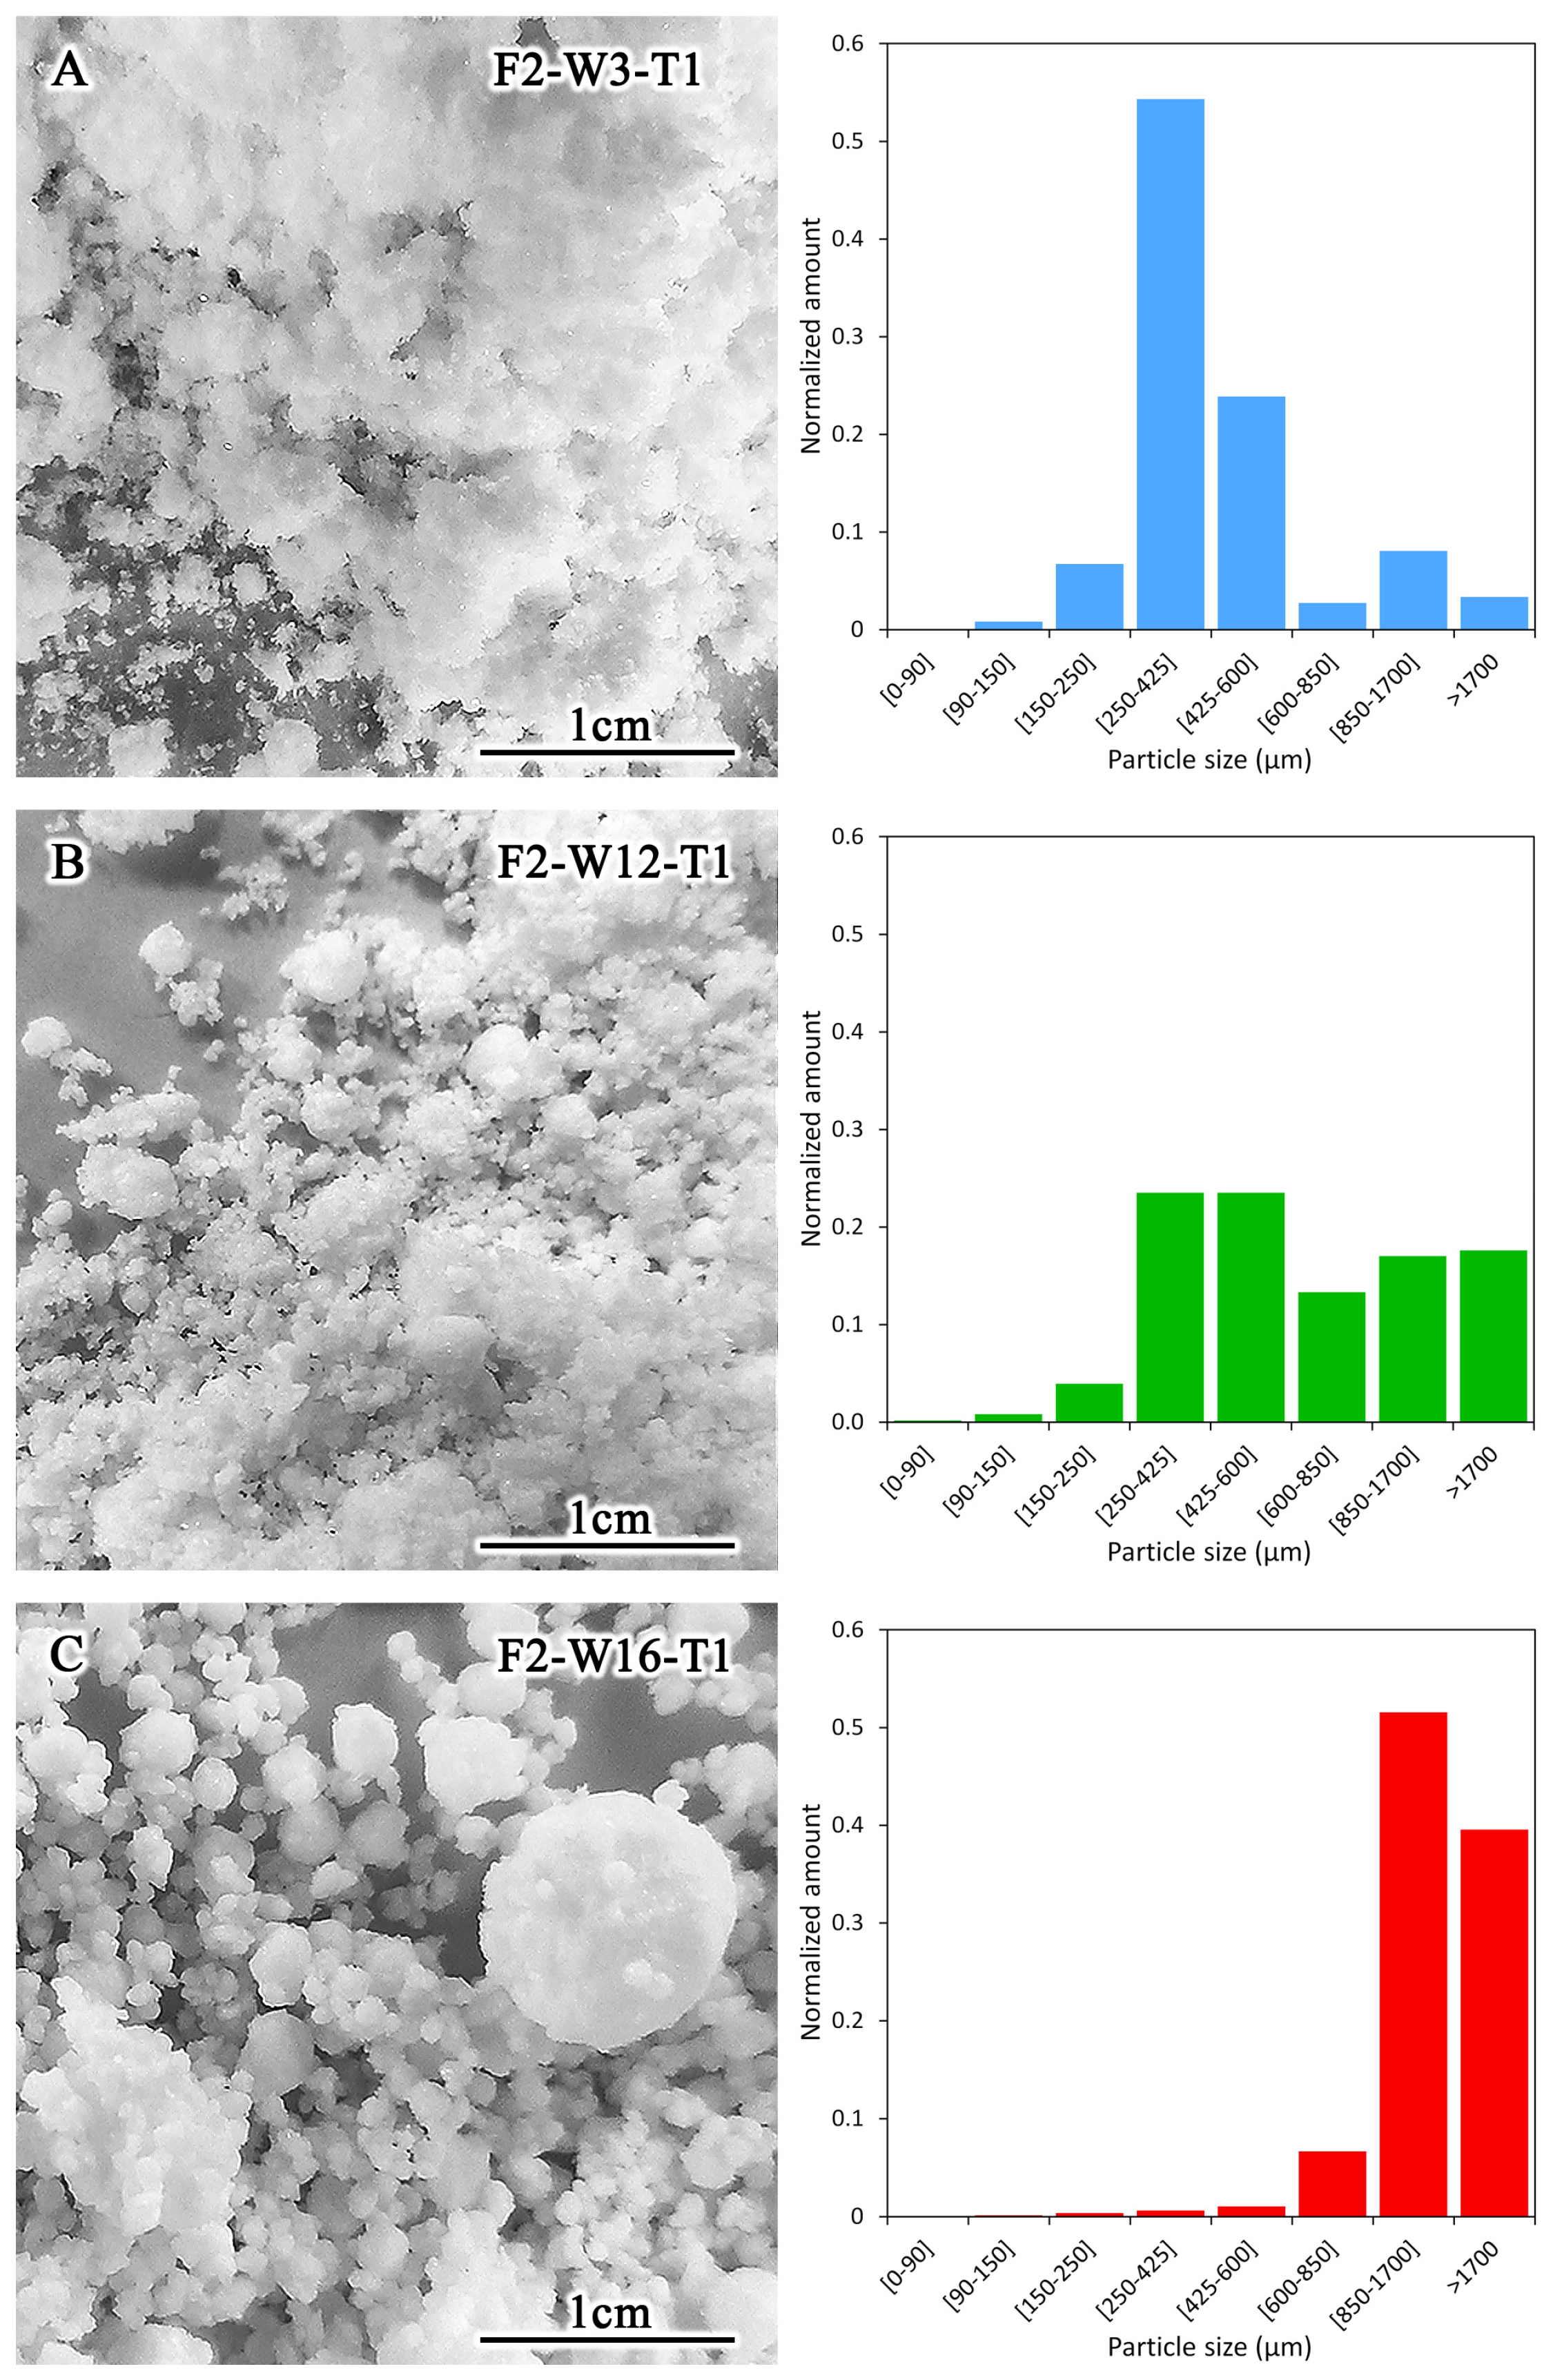
Figure 5 presents three process fingerprints for Formulation 2 (90% APAP), coded as F2-W3-T1, F2-W12-T1, and F2-W16-T1, and Figure 6 shows photographs and particle size distributions of the released powder. The wet-massing time for all batches was 1 min. A high amount of APAP increases the risk of overwetting, excessive agglomeration, and lump formation [37]. In preliminary experiments, granulations for more than one minute for 90% APAP resulted in quick formation of large granules as in those observed for the 75% APAP F1–W16–T5 batch (Figure 3F). Therefore, wet massing of more than 1 min was not studied for the 90% APAP formulation.
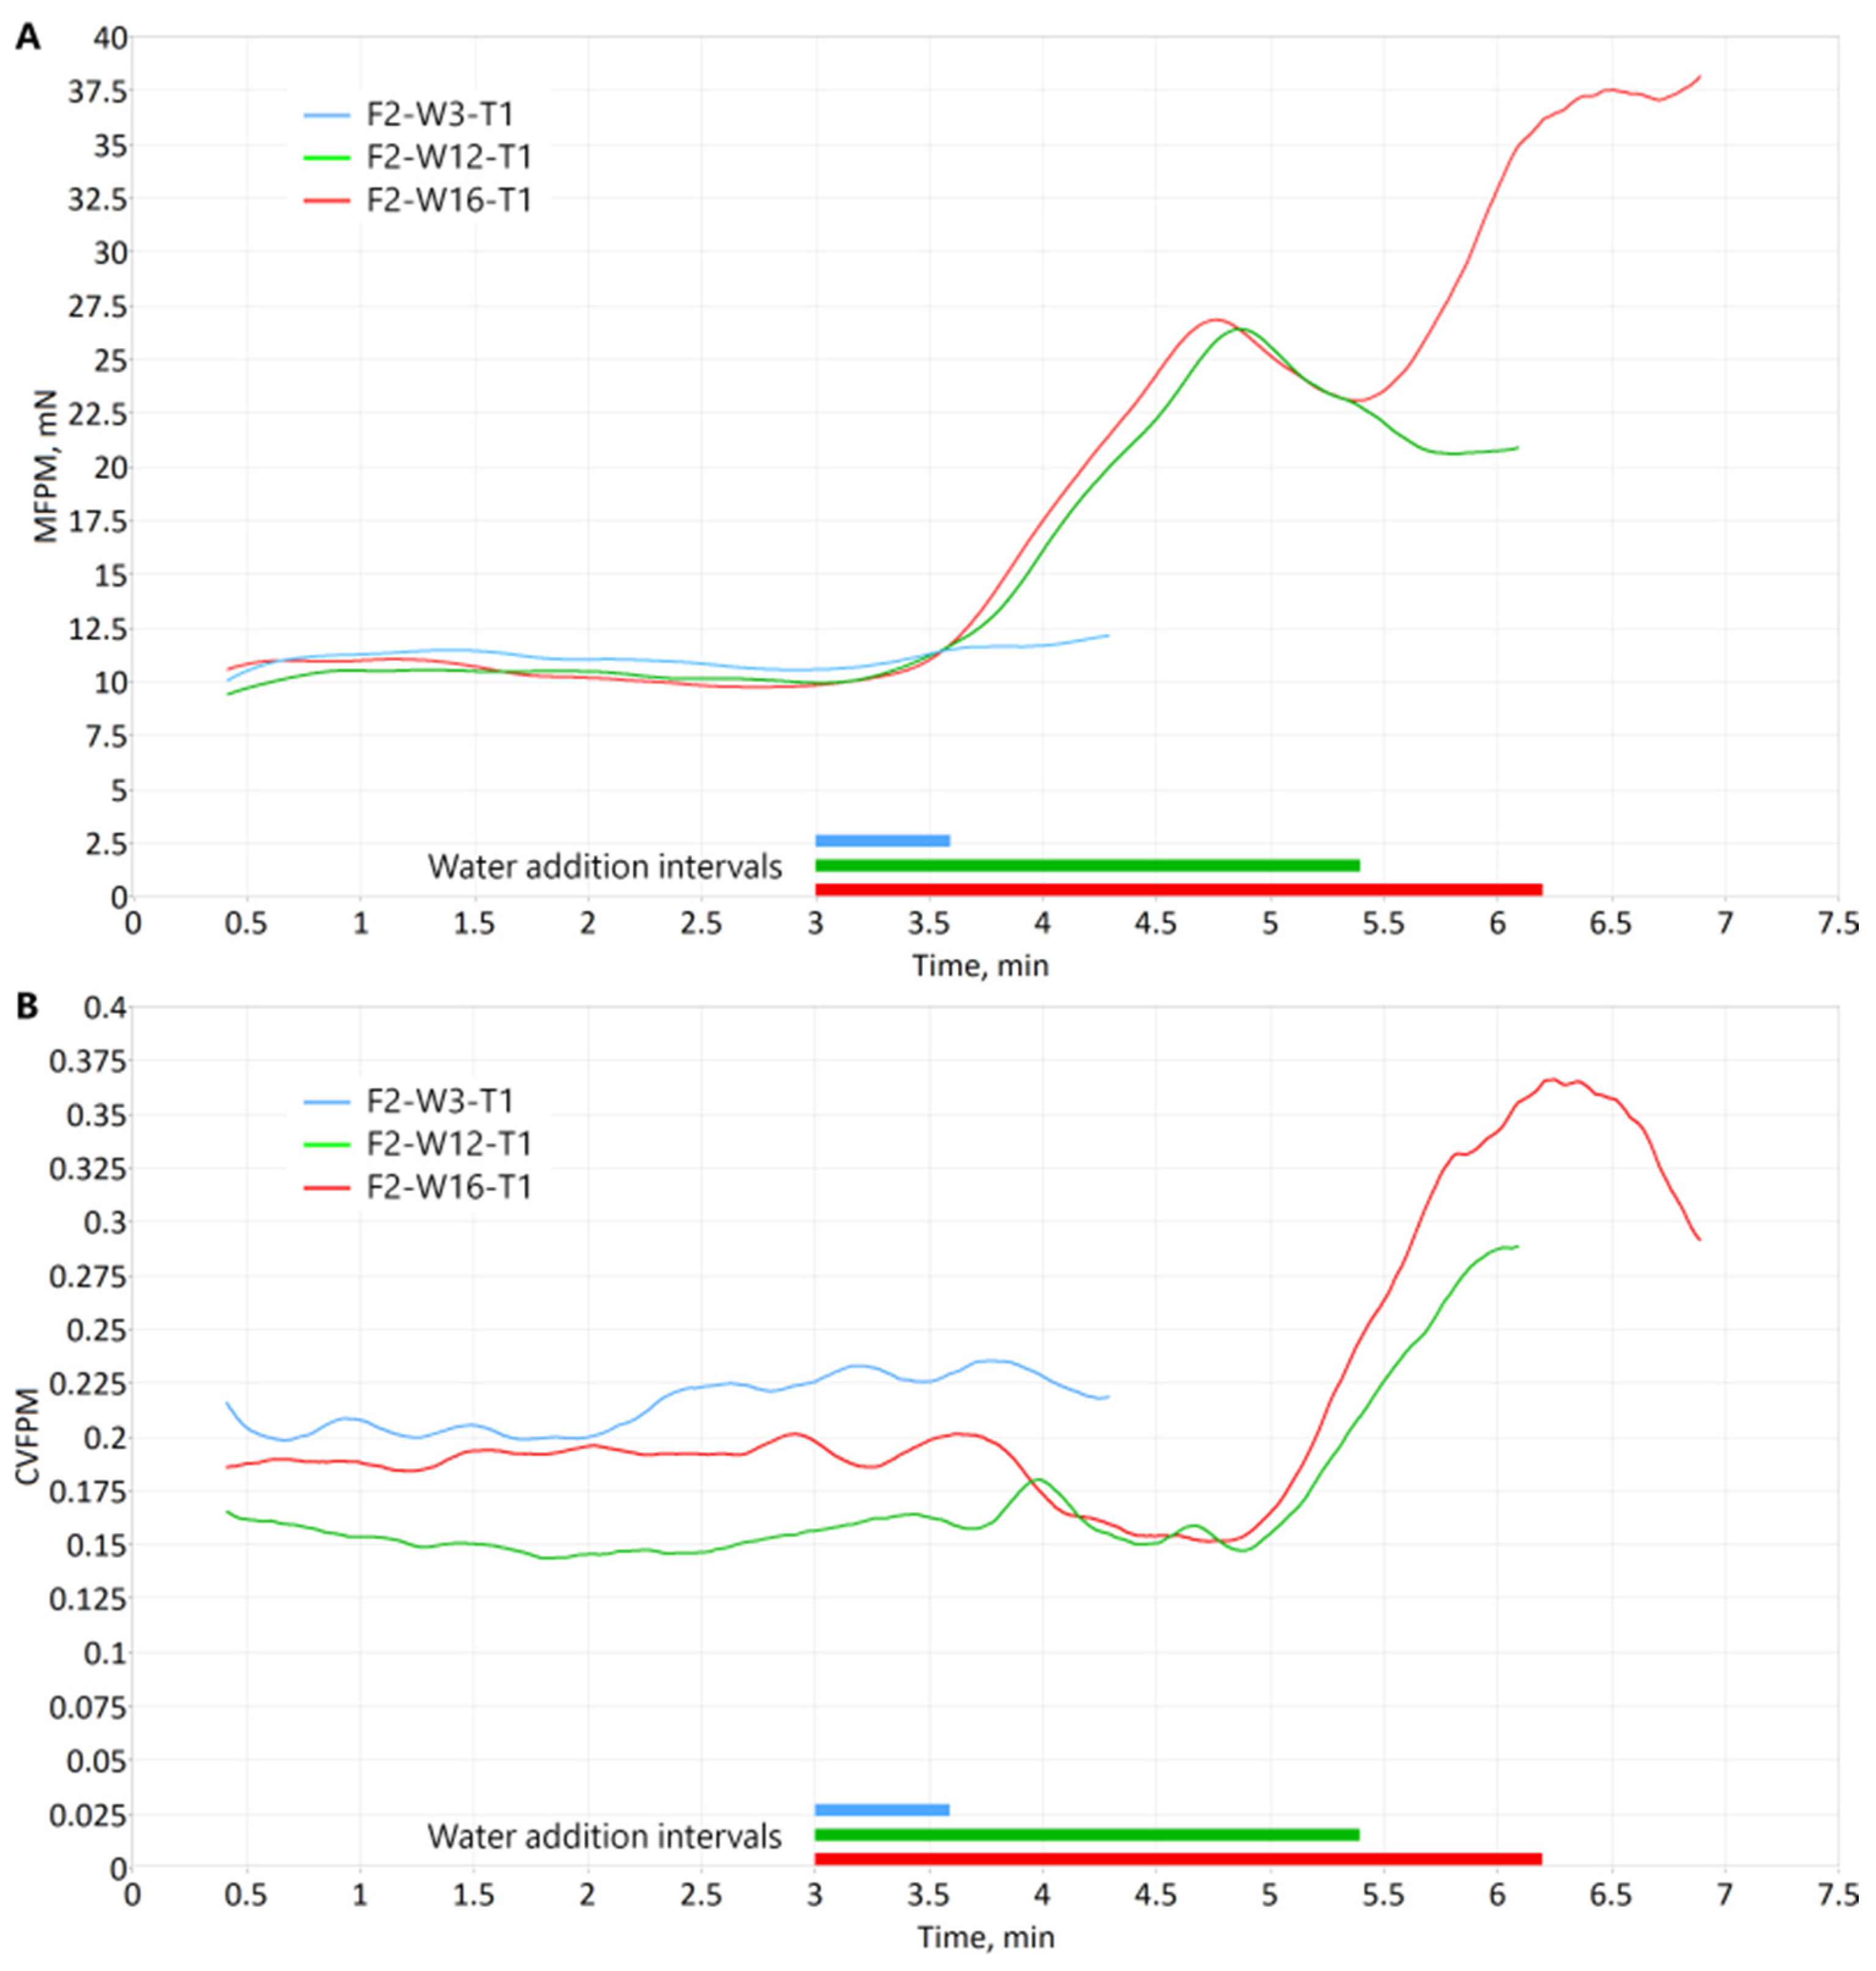
As it was the case for the 75% APAP 3 mL water content (F1-W3-T1 and F1-W3-T5 in Figure 4A,B), MFPM and CVFPM levels for the 90% APAP 3 mL (F2-W3-T1) batch remain steady before, during and after water addition intervals. Again, this is considered as evidence that this small amount of water is insufficient for granulation to start. The similarity between these batches is also observable on the photographs for batches F1-W3-T1, F1-W3-T5, and F2-W3-T1 in Figure 3A,B and Figure 6A. Also, the particle size distribution for the 90% APAP 3 mL batch (F2-W3-T1, see it in Figure 6A) is similar to that observed for the 75% APAP 3 mL batches (F1-W3-T1 and F1-W3-T5), as can be seen in Figure 3A,B).
By comparing Figure 4 and Figure 5, one may see that all 75% and 90% APAP formulations display generally similarly shaped fingerprints. The salient points of the fingerprints such as the minimum in CVFPM evolution and the elbow/maximum points for MFPM evolution are present in both formulations (cr. Figure 4 and Figure 5). The larger granule consolidation stage is observed for the 16 mL water amount (F1-W16-T5 and F2-W16-T1) and not observed for the 12 mL water amount for both 75% and 90% APAP formulations (F1-W12-T5 and F2-W12-T1). However, for the 90% APAP, these points are closer in time to the start of water addition (4.6 min vs. 5.3 min for 75% APAP) indicating that the granule consolidation and densification stage starts earlier for the 90% APAP formulation. Also, the large granule consolidation stage observed for the 90% APAP F2-W16-T1 batch starts earlier as well (5.4 min vs. 8 min for 75% APAP). This is expected since the 90% APAP formulation is more likely to form large agglomerates and lumps than the 75% APAP formulation due to the chemical binding properties of APAP, as discussed earlier. This is emphasized by the observation that the characteristic point that was observed for 75% APAP at 5.2 min as an elbow point on the MFPM plot (see Figure 4A) manifests itself for 90% APAP F2-W12-T1 and F2-W16-T1 as an extreme point, a maximum, seen at 4.7 min (Figure 5A), making identification of this point more reliable.
One can see from Figure 5 that for the F2-W16-T1 batch both MFPM and CVFPM plots rise sharply well before the end of water addition, at 5.4 min, unlike the situation with the 75% APAP formulation (F1-W16-T5) where rapid rise started later, at 8 min (see Figure 4A,B). This indicates that the optimum amount of water addition for the 90% APAP formulation is smaller than 18 mL. The 12 mL of water addition may be considered satisfactory for tablet production, since the MFPM evolution did not display a sharp rise after 5.5 min (green line in Figure 5A), and the PSD for this batch (Figure 6B) may be considered adequate; however, a slightly lower amount of water may provide better results, since the CVFPM does rise sharply after 5 min (green line in Figure 5B) indicating start in formation of larger granules as also evident from the PSD. The suggested granulation endpoint for the 12 mL batch at around 1 min of wet massing seems reasonable as supported by PSD and tablet dissolution analyses.

3.4. Tablet Dissolution Tests

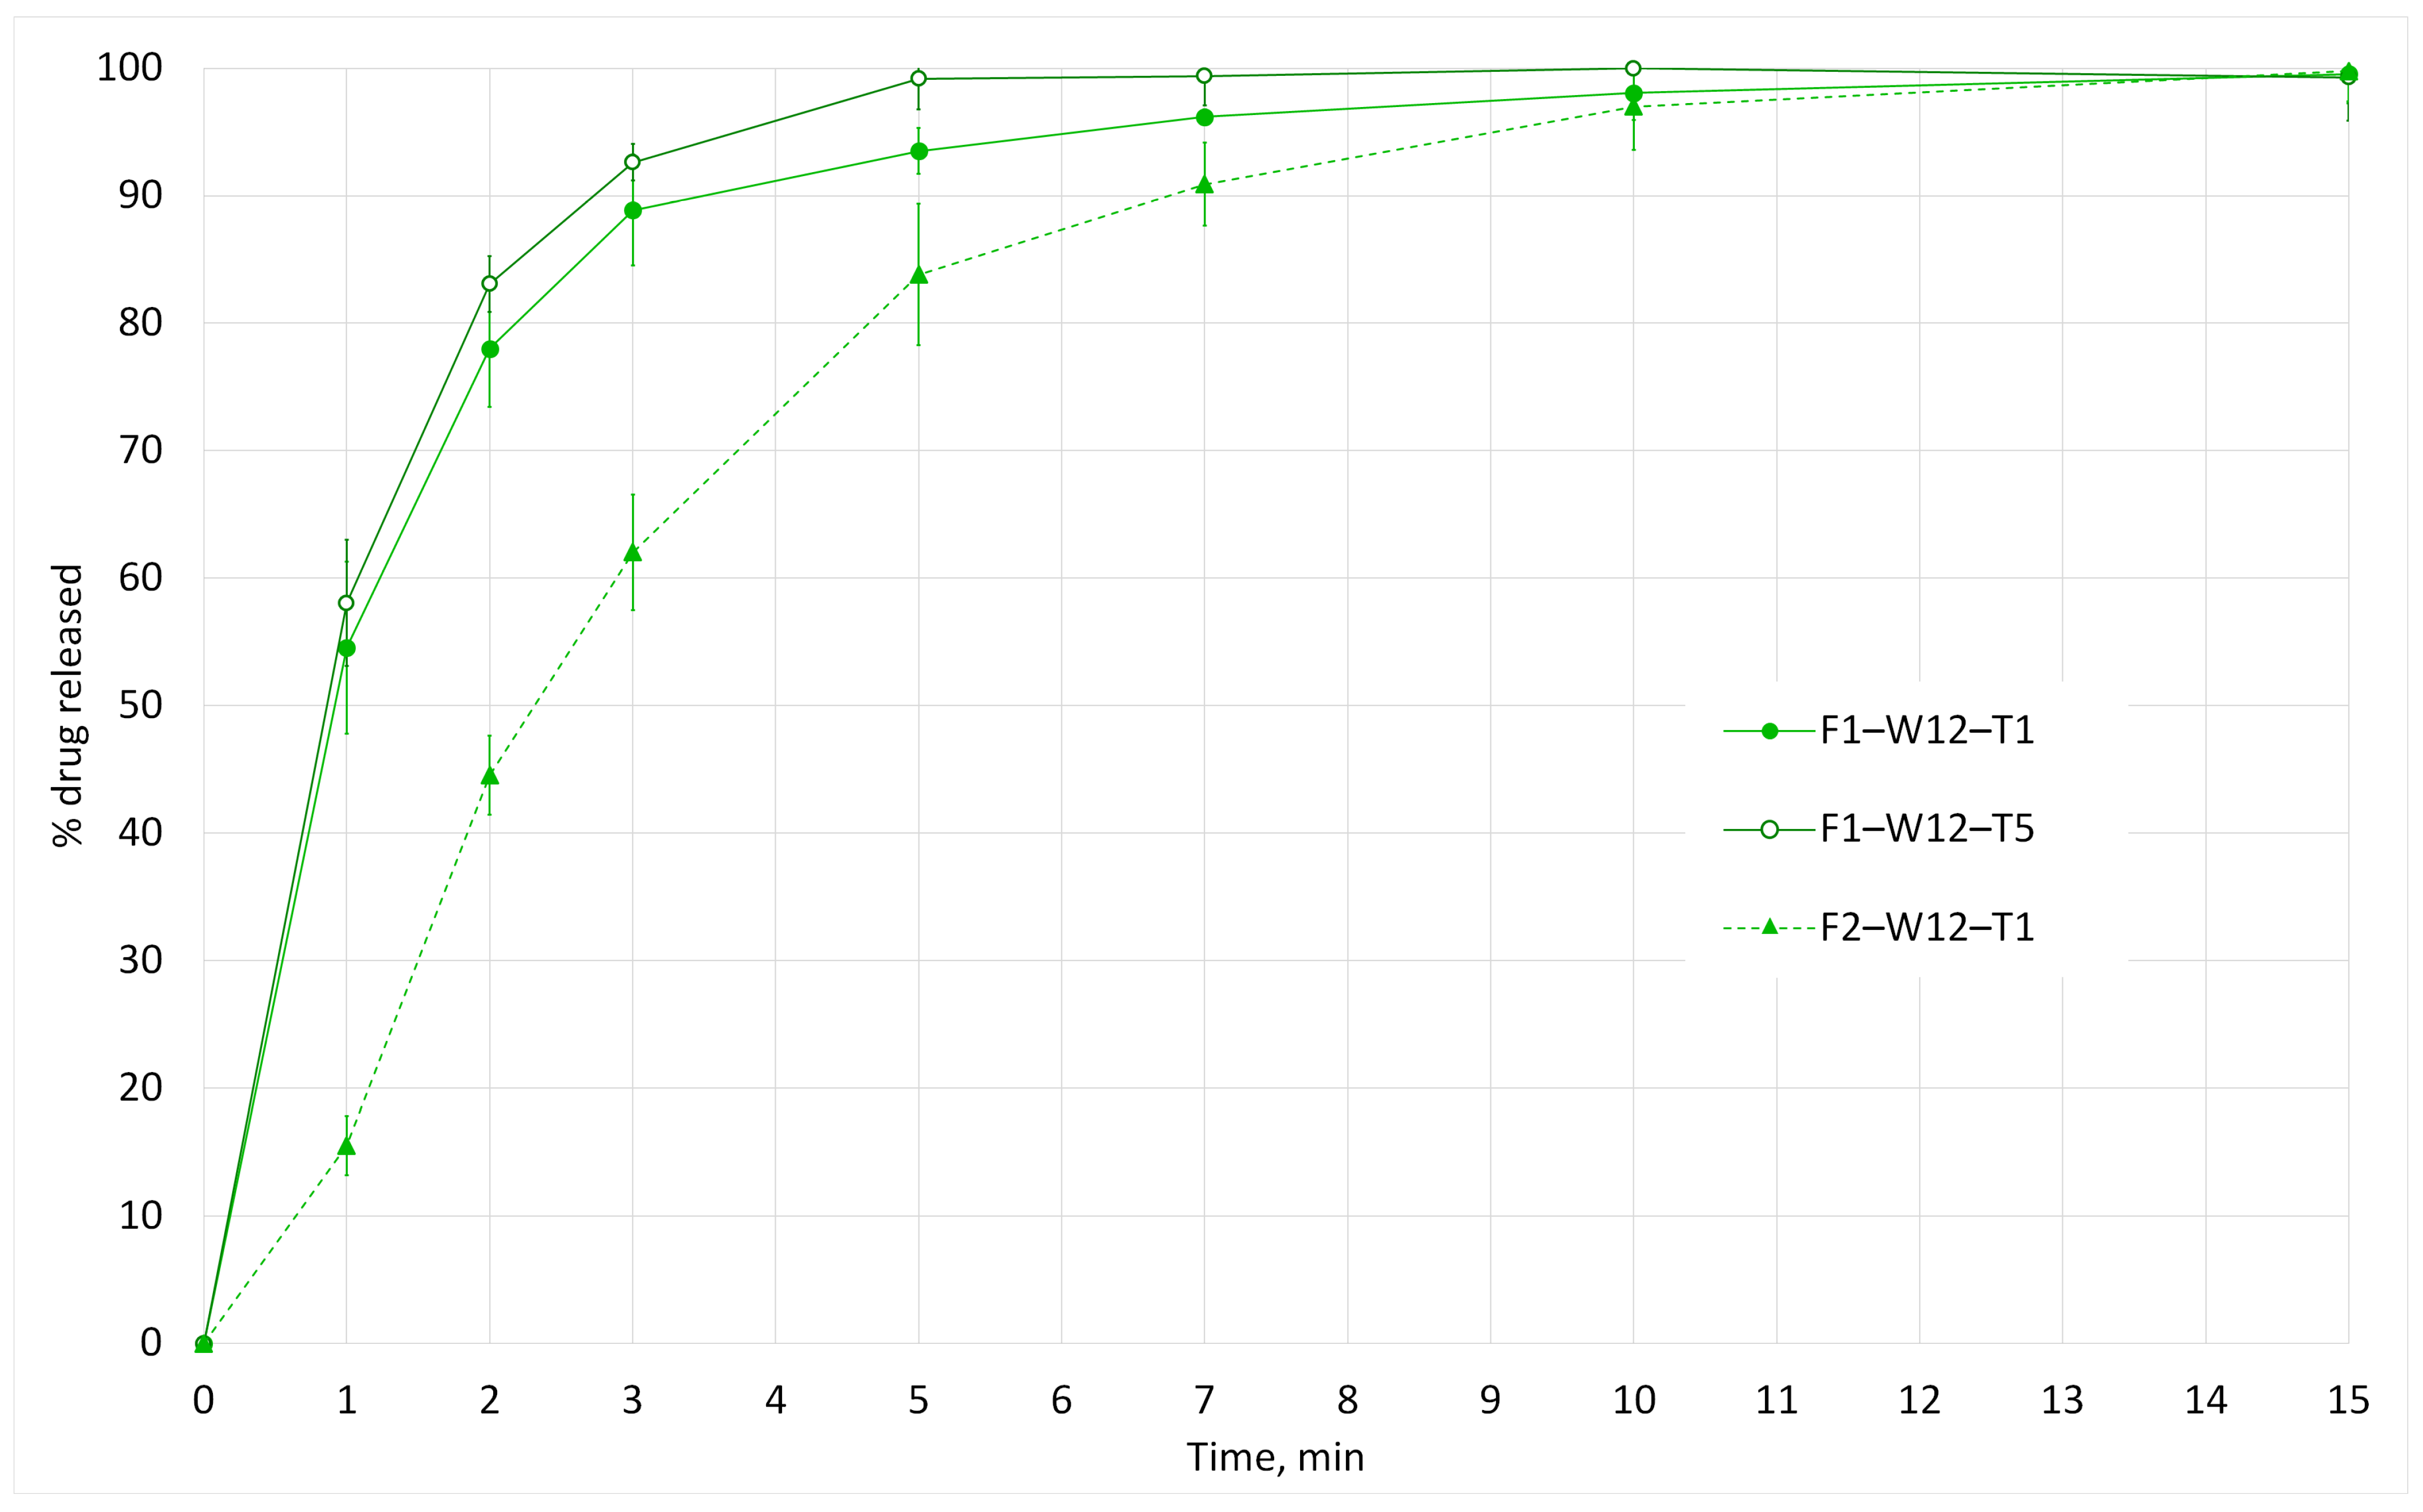
After analyzing MFPM and CVFPM evolutions and PSD results, the granules from Formulation 2 batches with 3 mL and 16 mL water were not selected for tablet dissolution tests since the former water amount was found insufficient to start the granulation process, and the latter resulted in overwetting and the formation of dense large agglomerates. Dissolution tests results for the 75% (1 and 5 min of wet massing) and 90% (1 min of wet massing) APAP formulations with 12 mL water (F1-W12-T1, F1-W12-T5, and F2-W12-T1 batches, respectively) are summarized in Figure 7.
Tablets prepared from F1-W12-T1 and F1-W12-T5 batches exhibited dissolution profiles that are close to each other, with T85% values of 2.6 min and 2.2 min, respectively. This similarity in dissolution time parallels similarity in salient points of CVFPM and MFPM evolutions observed in Figure 4 for these two batches. Specifically, the CVFPM minima and MFPM elbow points (light green and dark green curves) are at approximately 5.3 min for both batches. For the 90% APAP tablets (F2-W12-T1, dashed curve in Figure 7), the T85% dissolution time is 5.4 min which is noticeably greater than that observed for the F1-W12-T1 and F1-W12-T5 tablets. In an inversed but apparent relationship, the salient points for the CVFPM and MFPM F2-W12-T1 evolutions (light green curves in Figure 5) occur earlier at ~4.6 min versus ~5.3 min in the 75% APAP batches. This connection between salient features observable in the granulation process fingerprints and dissolution time may be used for the prediction of tablet dissolution times.

4. Conclusions

An in-line PAT that measures drag force exerted by wet mass in a high-shear granulator on a thin cylindrical probe at a high data acquisition rate (DFF sensor) provided a signal that was able to identify the stages of granulation process in a high-shear wet granulator. The fingerprints measured for granulations of acetaminophen formulations with different API content and varied water addition were compared with results of PSD analysis of the powder released after granulation and tablet dissolution tests. The comparison demonstrated evidence of a strong correlation between salient features of MFPM and CVFPM evolutions and particle size distributions for different water amounts added during granulation. From the three different water amounts studied, based on the measured process fingerprints, it was possible to reliably identify the water amount that is optimal for granulation. In addition, a correlation was found between the time when a characteristic feature (a minimum of CVFPM and a maximum of MFPM) appears on the LIR measurements and dissolution times of the tablets. The technology also identified the time interval that is suitable for ending granulation and determination of the endpoint. Overall, this research indicated that LIR can be used as a tool for formulation development, scale-up, as well as real-time monitoring and control of HSWG.

Author Contributions

Conceptualization, V.A.S.; Methodology, V.S. and V.A.S.; Validation, V.S.; Formal analysis, V.A.S.; Investigation, V.S. and V.A.S.; Resources, V.S.; Writing—original draft, V.A.S.; Writing—review and editing, V.S. and V.A.S. All authors have read and agreed to the published version of the manuscript.

Funding

This research received no external funding.

Data Availability Statement

The original contributions presented in this study are included in the article. Further inquiries can be directed to the corresponding author.

Acknowledgments

The authors would like to express gratitude to Ajit S. Narang for his invaluable contribution to the application of LIR technology to HSWG and guidance throughout this study. His expertise was instrumental in shaping this research.

Conflicts of Interest

Vadim Stepaniuk was employed by the company Lenterra, Inc. The remaining author declares that the research was conducted in the absence of any commercial or financial relationships that could be construed as a potential conflict of interest.

Abbreviations

APAPAcetaminophen
APIActive Pharmaceutical Ingredient
CVFPMCoefficient of Variation of FPM
DFFDrag Force Flow (sensor)
DoEDesign of Experiment
FBRMFocused Beam Reflectance Measurement
FPMForce Pulse Magnitude
HSWGHigh-Shear Wet Granulation
LIRLenterra In-line Rheometer
MFPMMean FPM
NIRNear-infrared
PATProcess Analytical Technology
PSDParticle Size Distribution
PVPPolyvinylpyrrolidon
QbDQuality by Design
SFTSpatial Filtering Technique
USPUnited States Pharmacopeia
UV/VISUltraviolet/visible

References

  1. Narang, A.S.; Badawy, S.I.F. (Eds.) Handbook of Pharmaceutical Wet Granulation: Theory and Practice in a Quality by Design Paradigm, 2nd ed.; Academic Press: Boston, MA, USA, 2025. [Google Scholar]
  2. U.S. Department of Health and Human Services; Food and Drug Administration; Center for Drug Evaluation and Research (CDER); Center for Veterinary Medicine (CVM); Office of Regulatory Affairs (ORA). Guidance for Industry: PAT—A Framework for Innovative Pharmaceutical Manufacturing and Quality Assurance. Available online: https://www.fda.gov/media/71012/download (accessed on 13 February 2026).
  3. Alves, A.R.; Simões, M.F.; Simões, S.; Gomes, J. A review on the scale-up of high-shear wet granulation processes and the impact of process parameters. Particuology 2024, 92, 180–195. [Google Scholar] [CrossRef]
  4. Jang, E.H.; Park, Y.S.; Kim, M.-S.; Choi, D.H. Model-based scale-up methodologies for pharmaceutical granulation. Pharmaceutics 2020, 12, 453. [Google Scholar] [CrossRef]
  5. Badawy, S.I.F.; Narang, A.S.; Lamarche, K.; Subramanian, G.; Varia, S.A. Mechanistic basis for the effects of process parameters on quality attributes in high shear wet granulation. Int. J. Pharm. 2012, 439, 324–333. [Google Scholar] [CrossRef]
  6. Indian Pharmaceutical Alliance (IPA). The Guidance on Process Analytical Tools (PAT) on Oral Solids and API. Available online: https://www.ipa-india.org/wp-content/uploads/2024/06/Guidance_on_Process_Analytical_Tools_(PAT)_in_Oral_Solids_and_API.pdf (accessed on 13 February 2026).
  7. Hansuld, E.M.; Briens, L. A review of monitoring methods for pharmaceutical wet granulation. Int. J. Pharm. 2014, 472, 192–201. [Google Scholar] [CrossRef]
  8. Koyanagi, K.; Ueno, A.; Hattori, Y.; Sasaki, T.; Sakamoto, T.; Otsuka, M. Analysis of granulation mechanism in a high-shear wet granulation method using near-infrared spectroscopy and stirring power consumption. Colloid Polym. Sci. 2020, 298, 977–987. [Google Scholar] [CrossRef]
  9. Jørgensen, A.C.; Rantanen, J.; Luukkonen, P.; Laine, S.; Yliruusi, J. Visualization of a pharmaceutical unit operation:  Wet granulation. Anal. Chem. 2004, 76, 5331–5338. [Google Scholar] [CrossRef] [PubMed]
  10. Atanaskova, E.; Angelovska, V.; Chachorovska, M.; Stojanovska, N.A.; Petrushevski, G.; Makreski, P.; Geskovski, N. Development of novel portable NIR spectroscopy process analytical technology (PAT) tool for monitoring the transition of ibuprofen to ibuprofen sodium during wet granulation process. Spectrochim. Acta Part A Mol. Biomol. Spectrosc. 2024, 317, 124369. [Google Scholar] [CrossRef] [PubMed]
  11. Narang, A.S.; Stevens, T.; Macias, K.; Paruchuri, S.; Gao, Z.; Badawy, S. Application of in-line focused beam reflectance measurement to brivanib alaninate wet granulation process to enable scale-up and attribute-based monitoring and control strategies. J. Pharm. Sci. 2017, 106, 224–233. [Google Scholar] [CrossRef]
  12. Petrak, D.; Dietrich, S.; Eckardt, G.; Köhler, M. In-line particle sizing for real-time process control by fibre-optical spatial filtering technique (SFT). Adv. Powder Technol. 2011, 22, 203–208. [Google Scholar]
  13. Huang, J.; Kaul, G.; Utz, J.; Hernandez, P.; Wong, V.; Bradley, D.; Nagi, A.; O’Grady, D. A PAT approach to improve process understanding of high shear wet granulation through in-line particle measurement using FBRM C35. J. Pharm. Sci. 2010, 99, 3205–3212. [Google Scholar] [CrossRef] [PubMed]
  14. Arp, Z.; Smith, B.; Dycus, E.; O’Grady, D. Optimization of a high shear wet granulation process using focused beam reflectance measurement and particle vision microscope technologies. J. Pharm. Sci. 2011, 100, 3431–3440. [Google Scholar] [CrossRef] [PubMed]
  15. Palmer, J.; O’Malley, C.J.; Wade, M.J.; Martin, E.B.; Page, T.; Montague, G.A. Opportunities for process control and quality assurance using online NIR analysis to a continuous wet granulation tableting line. J. Pharm. Innov. 2020, 15, 26–40. [Google Scholar] [CrossRef]
  16. Covari, V.; Fry, W.C.; Seibert, W.L.; Augsburger, L. Instrumentation of a high shear mixer: Evaluation and comparison of a new capacitive sensor, a wattmeter, and a strain-gage torque sensor for wet granulation monitoring. Pharm. Res. 1992, 9, 1525–1533. [Google Scholar] [CrossRef]
  17. Hansuld, E.M.; Briens, L.; McCann, J.A.B.; Sayani, A. Audible Acoustics in High-Shear Wet Granulation: Application of Frequency Filtering. Int. J. Pharm. 2009, 378, 37–44. [Google Scholar] [CrossRef]
  18. Ohike, A.; Ashihara, K.; Ibuki, R. Granulation monitoring by fast Fourier transform technique. Chem. Pharm. Bull. 1999, 47, 1734–1739. [Google Scholar] [CrossRef][Green Version]
  19. Talu, I.; Tardos, G.I.; Ommen, J.R. Use of stress fluctuations to monitor wet granulation of powders. Powder Technol. 2001, 117, 149–162. [Google Scholar] [CrossRef]
  20. Levin, M. How to Scale-Up a Wet Granulation End Point Scientifically; Elsevier Science & Technology: San Diego, CA, USA, 2015. [Google Scholar]
  21. Parikh, D.M. (Ed.) Handbook of Pharmaceutical Granulation Technology, 4th ed.; CRC Press: Boca Raton, FL, USA, 2010. [Google Scholar]
  22. Watano, S. Online Monitoring. In Handbook of Powder Technology; Salman, A.D., Hounslow, M.J., Seville, J.P.K., Eds.; Elsevier B.V.: Amsterdam, The Netherlands, 2007; Volume 11, pp. 477–498. [Google Scholar]
  23. Sakr, W.F.; Ibrahim, M.A.; Alanazi, F.K.; Sakr, A.A. Upgrading wet granulation monitoring from hand squeeze test to mixing torque rheometry. Saudi Pharm. J. 2011, 19, 247–253. [Google Scholar] [CrossRef]
  24. Holm, P.; Schaefer, T.; Larsen, C. End-point detection in a wet granulation process. Pharm. Dev. Technol. 2001, 6, 181–192. [Google Scholar] [CrossRef] [PubMed]
  25. Laicher, A.; Profitlich, T.; Schwitzer, K.; Ahlert, D. A modified signal analysis system for end-point control during granulation. Eur. J. Pharm. Sci. 1997, 5, 7–14. [Google Scholar] [CrossRef]
  26. Sheverev, V.A.; Stepaniuk, V.; Narang, A.S. Principles and applications of drag force flow sensor. In Handbook of Pharmaceutical Wet Granulation: Theory and Practice in a Quality by Design Paradigm, 2nd ed.; Narang, A.S., Badawy, S.I.F., Eds.; Academic Press: Boston, MA, USA, 2025; pp. 509–556. [Google Scholar]
  27. Munu, I.; Nicusan, A.L.; Crooks, J.; Pitt, K.; Windows-Yule, C.; Ingram, A. Predicting tablet properties using in-line measurements and evolutionary equation discovery: A high shear wet granulation study. Int. J. Pharm. 2024, 661, 124405. [Google Scholar] [CrossRef] [PubMed]
  28. Munu, I.; Nicusan, A.L.; Crooks, J.; Pitt, K.; Windows-Yule, C.; Ingram, A. Using in-line measurement and statistical analyses to predict tablet properties compressed using a Styl’One compaction simulator: A high shear wet granulation study. Int. J. Pharm. 2025, 669, 125098. [Google Scholar] [CrossRef]
  29. Fayed, M.H.; Abdel-Rahman, S.I.; Alanazi, F.K.; Ahmed, M.O.; Tawfeek, H.M.; Al-Shedfat, R.I. High-shear granulation process: Influence of processing parameters on critical quality attributes of acetaminophen granules and tablets using design of experiment approach. Acta Pol. Pharm. 2017, 74, 235–248. [Google Scholar]
  30. Cavinato, M.; Andreato, E.; Bresciani, M.; Pignatonec, I.; Bellazzi, G.; Franceschinis, E.; Realdon, N.; Canua, P.; Santomaso, A.C. Combining formulation and process aspects for optimizing the high-shear wet granulation of common drugs. Int. J. Pharm. 2011, 416, 229–241. [Google Scholar] [CrossRef]
  31. Kyttä, K.M.; Lakio, S.; Wikström, H.; Sulemanji, A.; Fransson, M.; Ketolainen, J.; Tajarobi, P. Comparison between twin-screw and high-shear granulation—The effect of filler and active pharmaceutical ingredient on the granule and tablet properties. Powder Technol. 2020, 376, 187–198. [Google Scholar] [CrossRef]
  32. Oka, S.; Smrčka, D.; Kataria, A.; Emady, H.; Muzzio, F.; Štěpánek, F.; Ramachandran, R. Analysis of the origins of content non-uniformity in high-shear wet granulation. Int. J. Pharm. 2017, 528, 578–585. [Google Scholar] [CrossRef]
  33. Keleb, E.I.; Vermeire, A.; Vervaet, C.; Remon, J.P. Extrusion granulation and high shear granulation of different grades of lactose and highly dosed drugs: A comparative study. Drug Dev. Ind. Pharm. 2004, 30, 679–691. [Google Scholar] [CrossRef] [PubMed]
  34. Macho, O.; Gabrišová, L.; Brokešová, J.; Svačinová, P.; Mužíková, J.; Galbavá, P.; Blaško, J.; Šklubalová, Z. Systematic study of paracetamol powder mixtures and granules tabletability: Key role of rheological properties and dynamic image analysis. Int. J. Pharm. 2021, 608, 121110. [Google Scholar] [CrossRef] [PubMed]
  35. United States Pharmacopeial Convention. USP–NF; USP: Rockville, MD, USA, 2021. [Google Scholar]
  36. Iveson, S.M.; Litster, J.D.; Hapgood, K.; Ennis, B.J. Nucleation, growth and breakage phenomena in agitated wet granulation processes: A review. Powder Technol. 2001, 117, 3–39. [Google Scholar] [CrossRef]
  37. Gao, T.; Singaravelu, A.S.S.; Oka, S.; Ramachandran, R.; Štepánek, F.; Chawla, N.; Emady, H.N. Powder bed packing and API content homogeneity of granules in single drop granule formation. Powder Technol. 2020, 366, 12–21. [Google Scholar] [CrossRef]
Figure 1. Schematics of the experiment. The probe, connected to the interrogator, was inserted into the granulator bowl vertically through an opening in the lid. Distilled water was delivered by a peristaltic pump and introduced into the granulator through a stainless steel needle.
Powders 05 00012 g001
Figure 2. Granulation fingerprint (mean force pulse magnitude, MFPM, and coefficient of variation of force pulse magnitude, CVFPM, evolutions) of Formulation 1 with 16 mL water and 5 min of wet massing (F1-W16-T5). Duration of each granulation stage (dry mixing, water addition interval, and wet massing) is indicated with blue bars at the bottom of the figure. Time intervals, corresponding to two basic rate processes—wetting and nucleation, and consolidation and growth—are shown with green arrows. Salient features of granulation fingerprint are described and indicated with black arrows. Dashed arrows denote phases deduced from the fingerprint.
Powders 05 00012 g002
Figure 3. Formulation 1 (75% APAP). Photographs and particle size distributions of granules released at the end of the granulation for batches F1-W3-T1 (A), F1-W3-T5 (B), F1-W12-T1 (C), F1-W12-T5 (D), F1-W16-T1 (E), and F1-W16-T5 (F). Each photograph includes the corresponding batch code and a 1 cm scale bar.
Powders 05 00012 g003
Figure 4. Mean force pulse magnitude, MFPM, part (A) and coefficient of variation of force pulse magnitude, CVFPM, part (B) evolutions for Formulation 1 (75% acetaminophen, APAP). Water addition intervals are indicated with color bars at the bottom of the plots. Blue bar corresponds to F1-W3-T1 and F1-W3-T5 batches, green bar corresponds to F1-W12-T1 and F1-W12-T5 batches, red bar corresponds to F1-W16-T1 and F1-W16-T5 batches.
Powders 05 00012 g004
Figure 5. Mean force pulse magnitude, MFPM, plot (A) and coefficient of variation of force pulse magnitude, CVFPM, plot (B) time dependencies for batches with Formulation 2 (90% APAP). Water addition intervals are indicated with color bars at the bottom of the plots. Blue bar corresponds to F2-W3-T1 batch, green bar corresponds to F2-W12-T1 batch, and red bar corresponds to F2-W16-T1 batch. Wet-massing time was 1 min in all batches.
Powders 05 00012 g005
Figure 6. Formulation 2 (90% APAP). Photographs and particle size distributions of granules released at the end of the granulation for batches F2-W3-T1 (A), F2-W12-T1 (B), and F2-W16-T1 (C). Each photograph includes the corresponding batch code and a 1 cm scale bar.
Powders 05 00012 g006
Figure 7. Dissolution tests results. Dissolution profiles for tablets made from Formulation 1 (F1-W12-T1 and F1-W12-T5 batches) with 75% of acetaminophen (APAP) and from Formulation 2 (F2-W12-T1 batch) for the 90% of APAP are shown with solid lines and dashed lines, respectively.
Powders 05 00012 g007
Table 1. Composition of the investigated formulations. Formulation 1 contains 75% acetaminophen as an active pharmaceutical ingredient, whereas Formulation 2 contains 90%. Both formulations kept polyvinylpyrrolidone as a binder at 5%. The ratios among the remaining excipients were kept constant between the two formulations.
ComponentManufacturer and GradeQuantity as % of Total
Tablet Weight
Formulation 1Formulation 2
Intra-granular
Acetaminophen (APAP)Sigma-Aldrich, Saint Louis, MO, USA7590
Polyvinylpyrrolidone (PVP)RND Center INC, La Jolla, CA, USA
M.W. = 40,000
55
Cellulose microcrystalline Sigma-Aldrich, Saint Louis, MO, USA
Avicel® PH-101
6.81.7
Lactose monohydrateMerck, Rahway, NJ, USA10.12.6
Croscarmellose sodiumSpectrum Chemical, New Brunswick, NJ, USA1.30.3
Extra-granular
Croscarmellose sodiumSpectrum Chemical, New Brunswick, NJ, USA1.30.3
Magnesium stearateSpectrum Chemical, New Brunswick, NJ, USA0.50.1
Table 2. Levels of process variables and batch codes. A total of nine granulations were done. A code for each granulation contains information about the formulation number (F1 or F2), amount of water added in ml (W3, W12, or W16), and duration of wet massing in min (T1 or T5).
FormulationWater Addition Interval, minAdded Water, mLWet-Massing Time, minBatch Code
10.631F1-W3-T1
12.4121F1-W12-T1
13.2161F1-W16-T1
10.635F1-W3-T5
12.4125F1-W12-T5
13.2165F1-W16-T5
20.631F2-W3-T1
22.4121F2-W12-T1
23.2161F2-W16-T1
Disclaimer/Publisher’s Note: The statements, opinions and data contained in all publications are solely those of the individual author(s) and contributor(s) and not of MDPI and/or the editor(s). MDPI and/or the editor(s) disclaim responsibility for any injury to people or property resulting from any ideas, methods, instructions or products referred to in the content.