Article

Manufacturing and Physicochemical Characterization of {Pt, Ir}/CeRuO2 Solid Solutions Tested in CO Oxidation


by
Ricardo Rangel
1,*,
Edson E. González-A
2,
Jaime Espino
1,
Javier Lara-Romero
1,
Armando Ramos-Corona
3,
Juan J. Alvarado-Gil
4,
Dainet Berman-Mendoza
5 and
Antonio Ramos-Carrazco
5
1
División de Estudios de Posgrado, Facultad de Ingeniería Química, Universidad Michoacana de San Nicolás de Hidalgo, Gral. Francisco J. Múgica S/N, Ciudad Universitaria, Morelia 58060, Michoacán, Mexico
2
Departamento de Ingeniería Bioquímica, TecNM/ITS Irapuato, Silao-Irapuato km 12.5, El Copal, Irapuato 36821, Guanajuato, Mexico
3
Investigador por México, Departamento de Física Aplicada, Cinvestav-Unidad Mérida, Carretera Antigua a Progreso Km. 6, Mérida 97310, Yucatán, Mexico
4
Departamento de Física Aplicada, Cinvestav-Unidad Mérida, Carretera Antigua a Progreso Km. 6, Mérida 97310, Yucatán, Mexico
5
Departamento de Investigación en Física, Universidad de Sonora, Hermosillo 83000, Sonora, Mexico
*
Author to whom correspondence should be addressed.
Powders 2026, 5(2), 13; https://doi.org/10.3390/powders5020013
Submission received: 28 January 2026 / Revised: 8 March 2026 / Accepted: 17 March 2026 / Published: 2 April 2026

Abstract

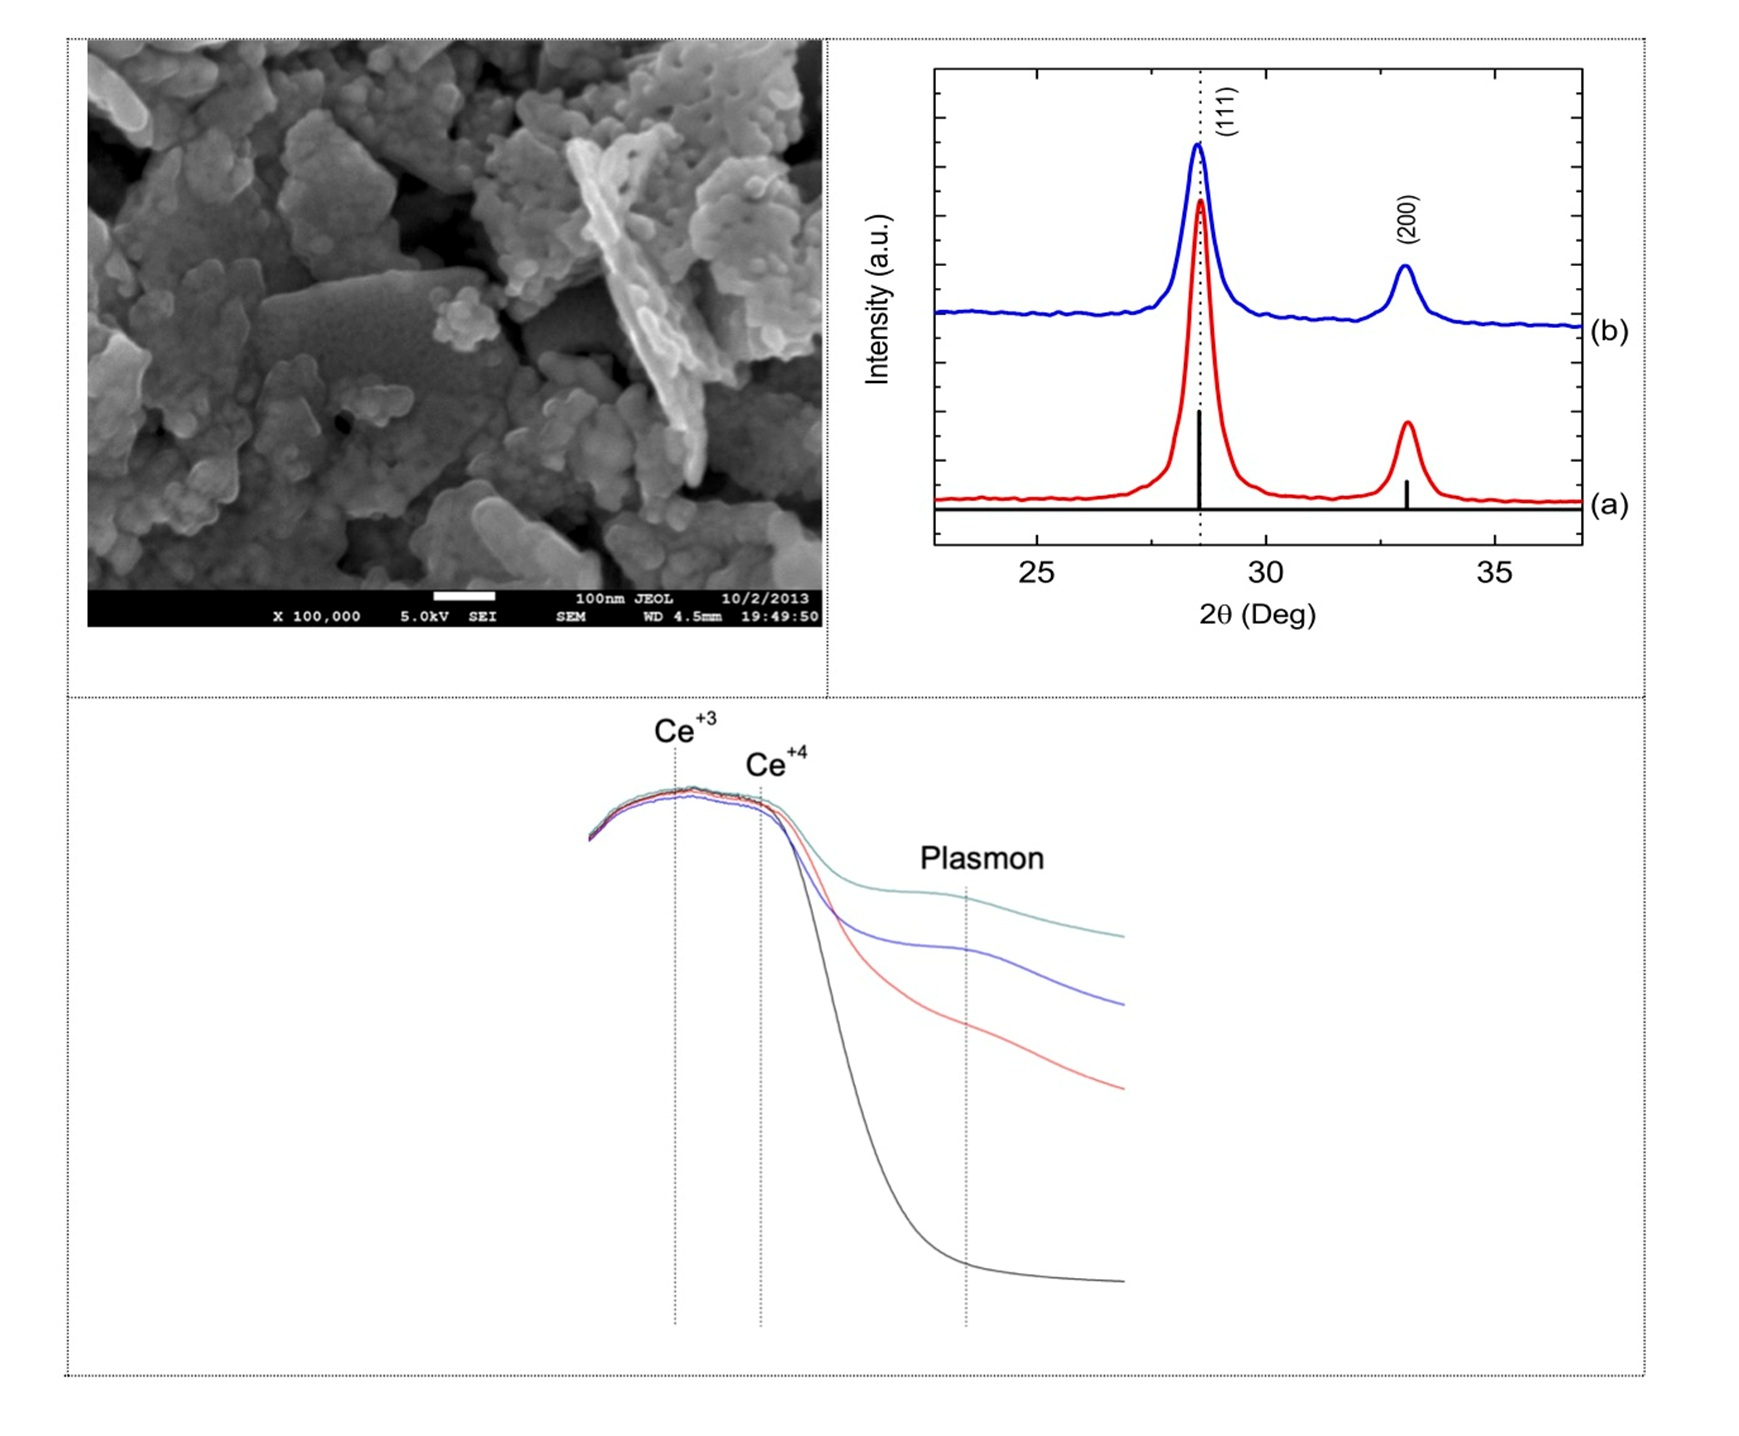
Nanoparticle powders of a Ce1−xRuxO2 mixed oxide (3.0% w/w), were synthesized to be used as catalytic supports, on which Pt and Ir nanoparticles were deposited as the active phase. The catalytic supports were prepared through a route involving microwave heating, while the Pt or Ir nanoparticles were incorporated via the wet incipient method. The {Pt, Ir/Ce1−xRuxO2} catalytic systems were successfully tested as catalysts for low-temperature CO oxidation. To provide adequate support to our results, the compounds were characterized by SEM, EDS, XRD, DRS-UV-vis, and XPS techniques. In addition, BET isotherms were carried out to determine specific surface area features. The CO oxidation evolution was tested in the range of 25–350 °C. Both Pt and Ir supported Ce1−xRuxO2 catalysts that remarkably improved the CO oxidation, reaching and sustaining 100% conversion from 125 °C onwards. Remarkably, the mixed oxide support, by itself, showed outstanding performance, achieving 100% conversion to CO2, at a temperature of 225 °C.

Graphical Abstract

1. Introduction

Global warming is one of the most important concerns of contemporary society. These disquiets cover a variety of areas, including emissions from mobile sources, gases released by industrial processes, and those caused by everyday human activity. Environmental pollution, affecting either air, water, or soil, has reached alarming levels and, in many cases, has caused irreversible damages. Several specific gases are contributing to global warming, acid rain, melting ice, ocean acidification, disruption of ecosystems and biodiversity, in addition to respiratory diseases. These included COx, SOx, NOx, N2O, SF6, NF3, and CH4, among other minor compounds [1]. Amid them, carbon monoxide (CO) and carbon dioxide (CO2) are of particular interest, as they contribute to environmental hazards, including acid rain and global warming [2]. According to a recent report from M. Yildiz et al. [3], road transportation (36.4%), residential use (28.5%), manufacturing industries (12.6%), and metal production factories (8%) are the major contributors to massive CO production.
From a public health perspective, CO represents a major public health risk, because its continuous exposure, even at low inhalation levels affects the cardiovascular, neurological, and mitochondrial function, and pregnant women may be affected [4]. In fact, low-level CO is recognized as an environmental toxin. It is also considered a cause of short and long-term respiratory morbidity, which under prolonged exposure causes death. The mechanism involves the CO attaching to hemoglobin to form carboxyhemoglobin (COHb), which competes with oxygen for binding sites and thereby reduces the blood’s oxygen-carrying capacity [5]. In general, these lethal and silent compounds are disregarded, thus minimizing their adverse effects. Considering this information, different strategies can be proposed to address the CO production, either by promoting its conversion into CO2 or incorporating CO into a chemical process, to generate value-added products or chemicals such as methanol, acetic acid, propanoic acid, ethene, propene, gasoline, and diesel fuels, among others [6,7,8]. Photocatalysis has also been explored as a route to convert CO into CO2 under sunlight, although, the efficiencies attained by this technique are commercially unattractive [9]. Another aspect for CO transformation is catalytic oxidation. A substantial body of scientific literature has focused on the catalytic oxidation of carbon monoxide. Particularly, catalyst efficiency, conversion rates, and thermal stability are critical parameters when assessing their suitability for real-world applications such as industrial exhaust or automotive catalysts. In this case, noble metals like platinum, rhodium, palladium, ruthenium, and even gold have been extensively studied in the past as part of a catalyst for CO oxidation due to their efficiency and conversion performance [10]. The different perspectives addressed for the use of those metals include the study of their shape, size, the inclusion of doping elements, their dispersion on several supports, and the presence of water or hydroxyl groups [11]. Among these materials, cerium oxide (CeO2) has stood out in carbon monoxide oxidation studies due to its proven ability to promote oxidation and regenerate in the presence of oxygen [12,13], reflecting its intrinsic ability to exchange oxidation/reduction states (Ce3+/Ce4+) with relative easiness. This redox flexibility enables CeO2 to act as an active catalyst in several reactions [14,15]. It is also used as a support in catalytic oxidation processes like Pt/CeO2, Pd/CeO2, Ru/CeO2 [10,11,15,16], CuO/CeO2, and Ni/CeO2 [17]. More complex formulations involve its use as a part of a mixed oxide support in automotive three-way catalysts, including Rh/CexOy-ZrO2 [18] and Pd/CexOy-ZrO2 [19]. Overall, CeO2 is known for its stable valence states and high redox capacity associated with the Ce3+ to Ce4+ oxidation states. Nevertheless, pure CeO2 often shows limited activity in low-temperature CO oxidation, mainly due to moderate oxygen mobility and restricted formation of active oxygen vacancies under reaction conditions. These limitations have motivated researchers to modify ceria to enhance its redox behavior and improve catalytic efficiency [20]. Several strategies have followed to improve the catalytic features of CeO2; among them, the use of new suitable promoters, supports, pretreatment, best synthesis methods, control of size and dispersion, as well as the incorporation of noble metal catalysts such as Pd, Rh, and Ru have shown favorable effects on reducibility and oxygen activation [21]. One way to control the oxygen vacancy and defect structure is by doping CeO2 with several metals like In, La, Ru, etc. In this regard, previous studies on Ru-containing CeO2 compounds have been reported to improve the performance of CO oxidation compared to bare CeO2, suggesting a favorable synergistic interaction between Ru active species contained in the ceria lattice [22,23]. Once the active metal is incorporated into the CeO2 lattice, it significantly restricts the oxygen vacancy formation energy on the catalyst surface, resulting in a high catalytic activity at low temperatures.
From this perspective, the present work focuses on the production of {Pt or Ir}/Ce0.985Ru0.015O2 catalysts for its application in the carbon monoxide oxidation reaction. On the one hand, it is expected that the Ce0.985Ru0.015O2 solid solution acts by itself as an active support capable of promoting CO oxidation, while on the other, the Pt or Ir metals, acting as catalysts, are supposed to enhance the redox capabilities of the solid solution, reaching full CO conversion near room temperature.

2. Experimental

2.1. Catalysts Synthesis

The pristine CeO2 compound was produced from Ce(C2H3O2)3∙H2O, 99.99% purity (from Sigma-Aldrich, St. Louis, MO, USA). The Ce(C2H3O2)3∙H2O salt was dissolved in deionized water. Afterward, 10 mL of a 10% (w/w) solution of PVP (polyvinylpyrrolidone) surfactant was added. The mixture was heated at 130 °C for 30 min in a Synthos-3000 microwave facility. In the next step, the obtained solution was washed several times, dried at 110 °C, and finally calcined at 400 °C. The Ce0.985Ru0.015O2 solid solution was prepared using 5.4 g of Ce(C2H3O2)3 (99.9%, Alfa-Aesar, Haverhill, MA, USA) and 0.07 g of Ru3(CO)12 (99.9%, Sigma-Aldrich), dissolved in distilled water and isopropyl alcohol, respectively. Also, 10 mL of a 10% (w/w) solution of PVP solution was added as surfactant to promote high specific surface area values of the catalytic support. The Ce0.985Ru0.015O2 solid solution was obtained after heating it in a microwave equipment at 150 °C for 30 min. The solution was dried at 120 °C for 24 h, at atmospheric pressure conditions, and further calcined at 500 °C for 3 h.
Pt and Ir catalysts supported on the Ce0.985Ru0.015O2 solid solution were obtained through a modified procedure of the method described in reference [14]. The catalytic support was dispersed in distilled water under constant stirring for 1 h. Subsequently, 5 mL of an 8% PVP solution was added to control the metal particles size. The stirring continued for 1 h. Afterward, either 0.16 g of the precursor salt of Pt (H2Cl6Pt·6H20), (75% Pt, Alfa Aesar) or 0.02 g of (Ir (CH3COO)|n), (49% Ir, Alfa Aesar) was dissolved in distilled water and added to the solution containing the catalytic support and the PVP solution. A total of 10 mL of a citric acid solution was incorporated as a reducing agent. The resulting solution was stirred for 12 h at 85 °C. The Pt/Ce0.985Ru0.015O2 and the Ir/Ce0.985Ru0.015O2 catalysts were dried at 120 °C for 24 h. In a further stage, those compounds underwent a reduction reaction with H2 using a stream of 30 cm3/min at 400 °C for 3 h. In both cases, the loading of the metals with respect to the Ce0.985Ru0.015O2 support was calculated to adjust 3% (w/w). In the following descriptions, the Ce0.985Ru0.015O2 compound will be abbreviated as CeRuO2.

2.2. Characterization

Textural properties were measured with a TriStar II 3020 N2 physisorption equipment (Micromeritics, Norcross, GA, USA). SEM images were obtained with a JEOL JSM 5300 scanning electron microscope (JEOL Ltd., Tokyo, Japan). Transmission electron microscopy (TEM) images were obtained in a JEOL JEM-2100F (STEM) (JEOL Ltd., Tokyo, Japan). X-ray diffraction (XRD) analyses were obtained in a Philips X’Pert analytical diffractometer (Malvern Panalytical, Almelo, The Netherlands) using Cu-Kα as the radiation source, operating at 40 kV and 30 mA of current with a step size of 0.02°/min from 10 to 90 deg (2θ). The X-ray photoelectron spectroscopy (XPS) technique allowed studying the electronic environment of the species in the catalysts employing a Thermo-Scientific device (Thermo Fisher Scientific, Waltham, MA, USA) coupled with an X-ray source, provided by an Al-Kα monochromator. The diffuse reflectance spectroscopy (DRS) UV–Vis spectra, and band-gap energy determination were performed in a Varian Cary-5000 UV/Vis spectrophotometer (Agilent Technologies, Santa Clara, CA, USA). FTIR experiments under reaction conditions were performed in an Agilent 660 spectrophotometer (Agilent Technologies, Santa Clara, CA, USA). In a previous step, the catalysts were submitted to a gas mixture (H2/N2 25% vol H2), progressively increasing the temperature value up to 300 °C. Once the reduction process was achieved, the flowing gas was shifted for a reaction mixture gas (CO/O2/N2 molar ratio 1/1/98). The contact time W/FCO value was 30 gcat, h molCO−1. The temperature of the FTIR reactor started at room temperature and further increased up to 280 °C at a rate of 2.5 °C/min.

2.3. Catalytic Reaction Tests

The CO catalytic oxidation experiments were performed in a temperature range of 25–350 °C using an 8 mm internal diameter reactor at atmospheric pressure conditions. The reagents flow was adjusted for a total flow of 60 cm3/min. The composition consisted of 2% CO, 2% O2, and 96% N2, as a balance gas (W/F = 30g hmol−1). A sample of 0.1g of catalyst was used for each test. Previously, samples were reduced in situ at 300 °C with a mixture of 2% H2 and 98% N2 for 1 h. The reaction products were analyzed using an on-line gas chromatograph provided with a TCD system (thermal conductivity detector).

3. Characterization Techniques and CO Conversion Results

3.1. Scanning Electron Microscopy and EDS Analyses

Figure 1a shows the CeO2 compound at a magnification of 50,000×, consisting of flat plates with different sizes. An important feature of those structures is that when observed at a higher magnification of about 100,000×, Figure 1b, they appeared fully porous, allowing gas to pass through the pores. Figure 1c,d shows the grain structure of the CeRuO2 compound, where plate-like morphologies coexist with small, rounded grains.
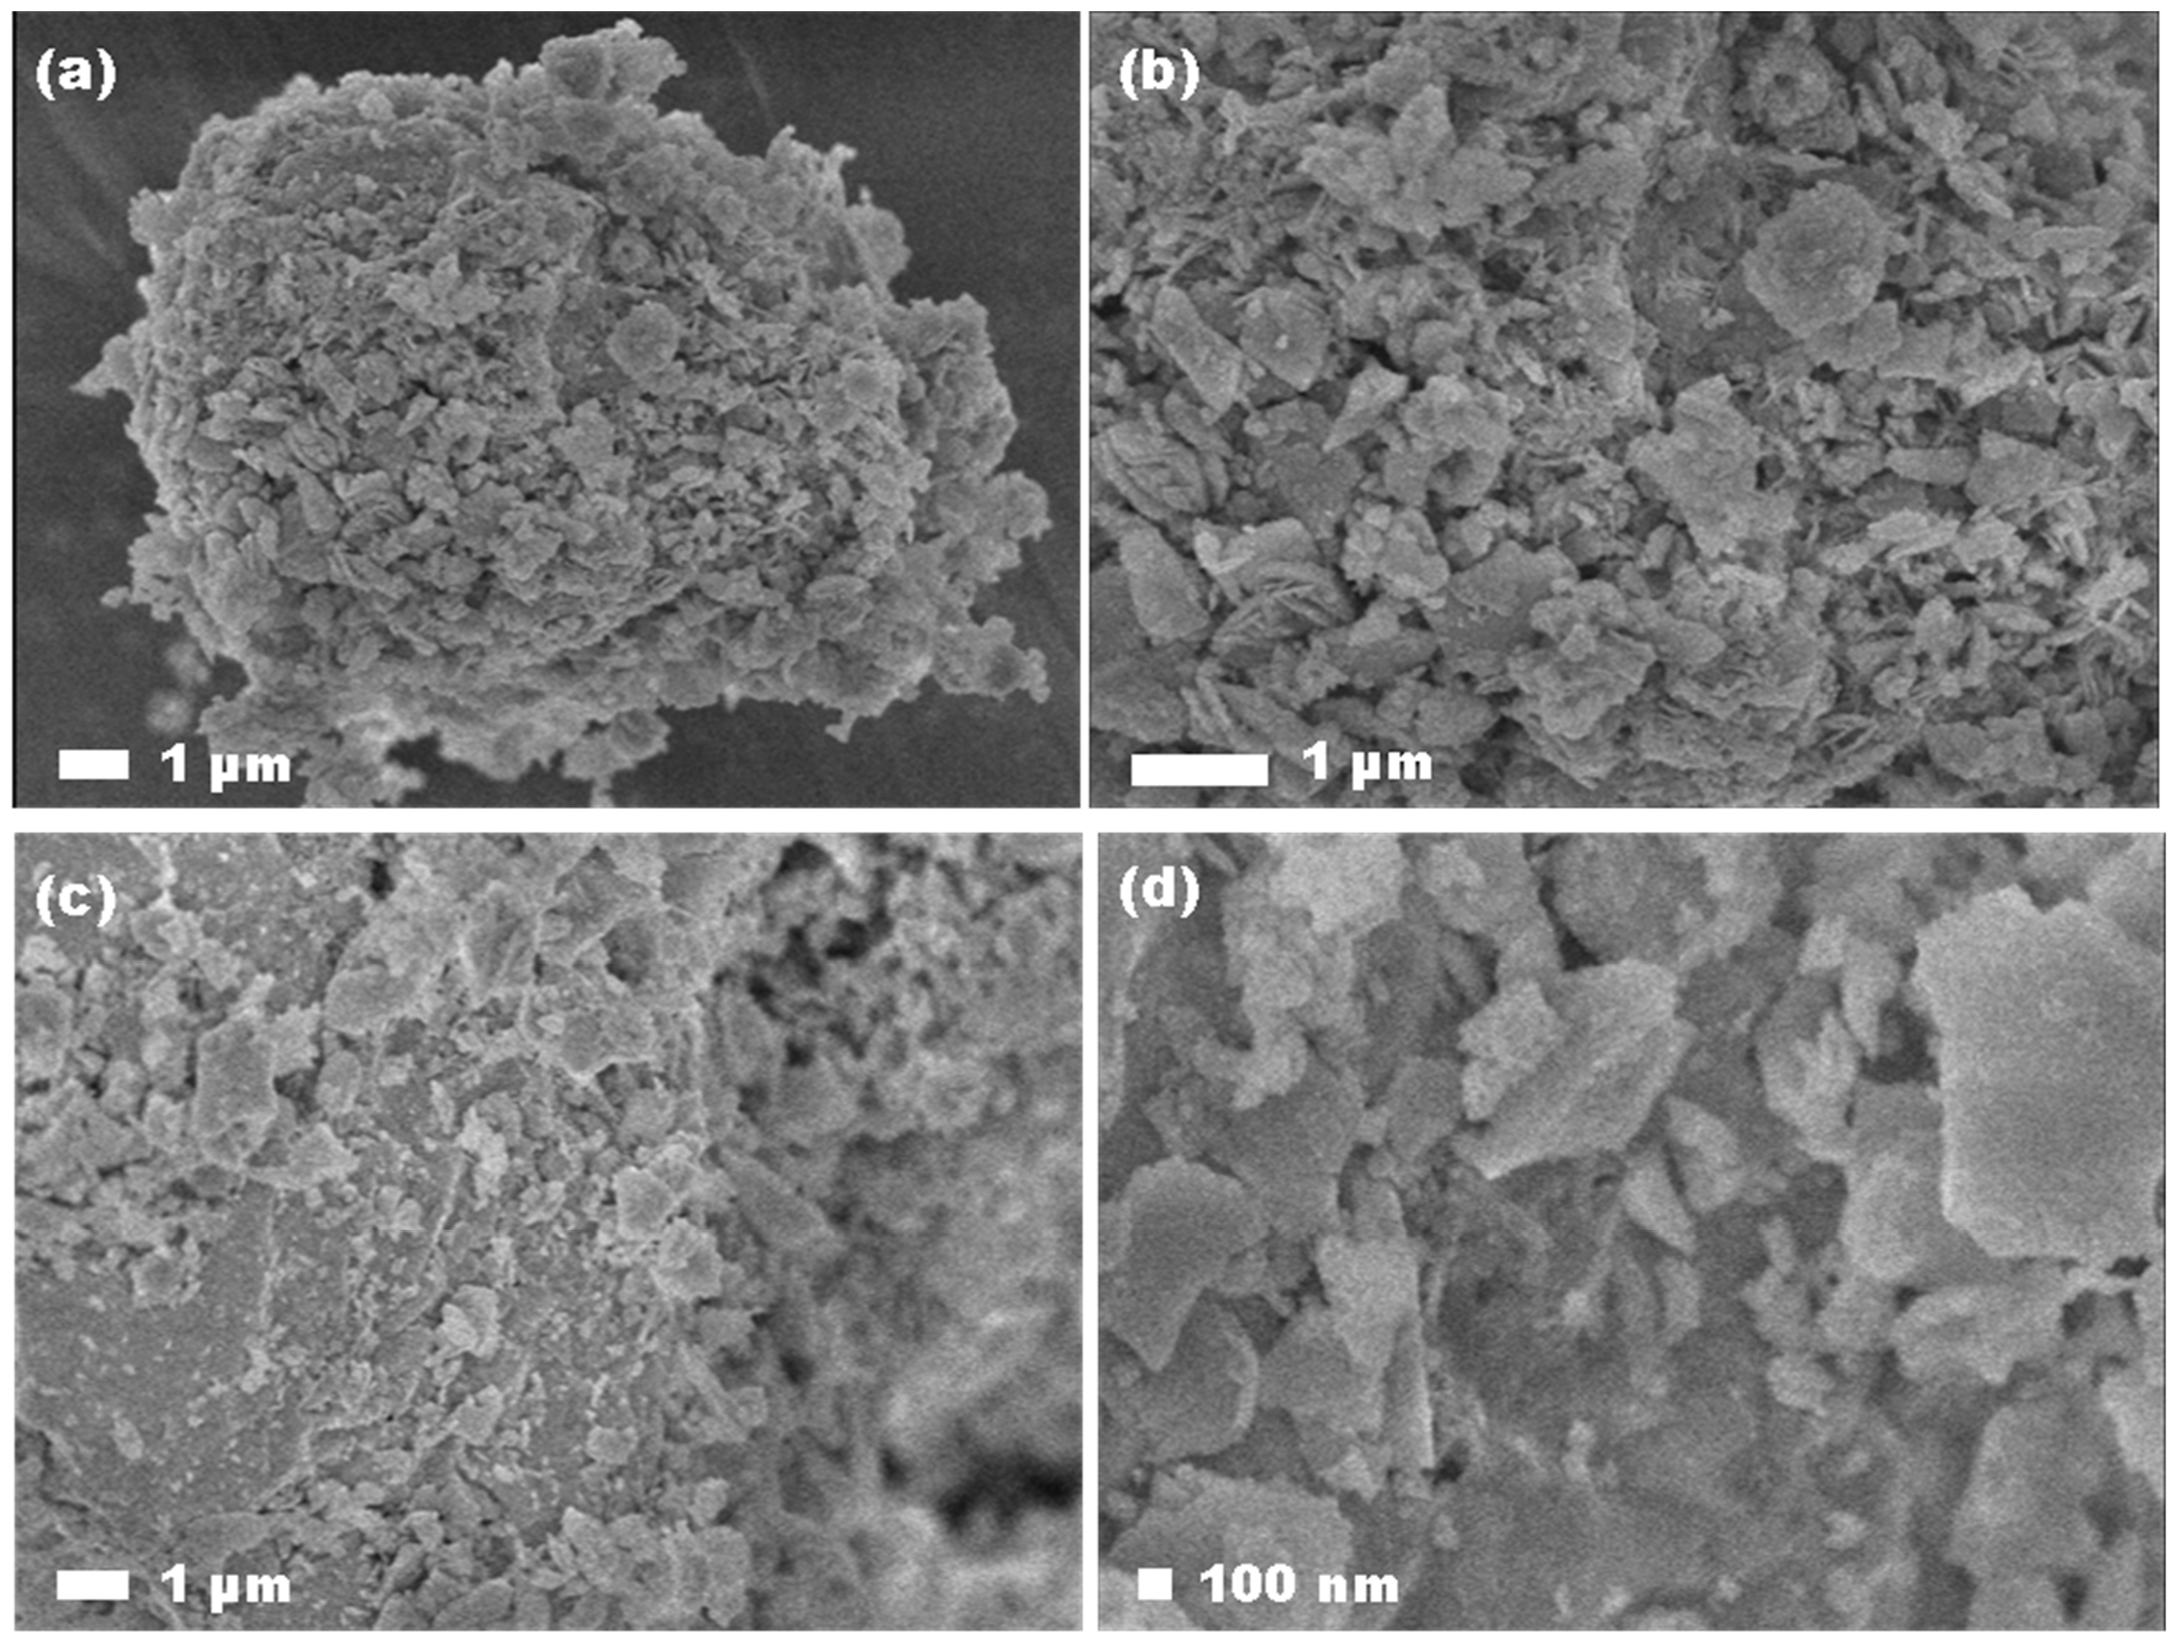
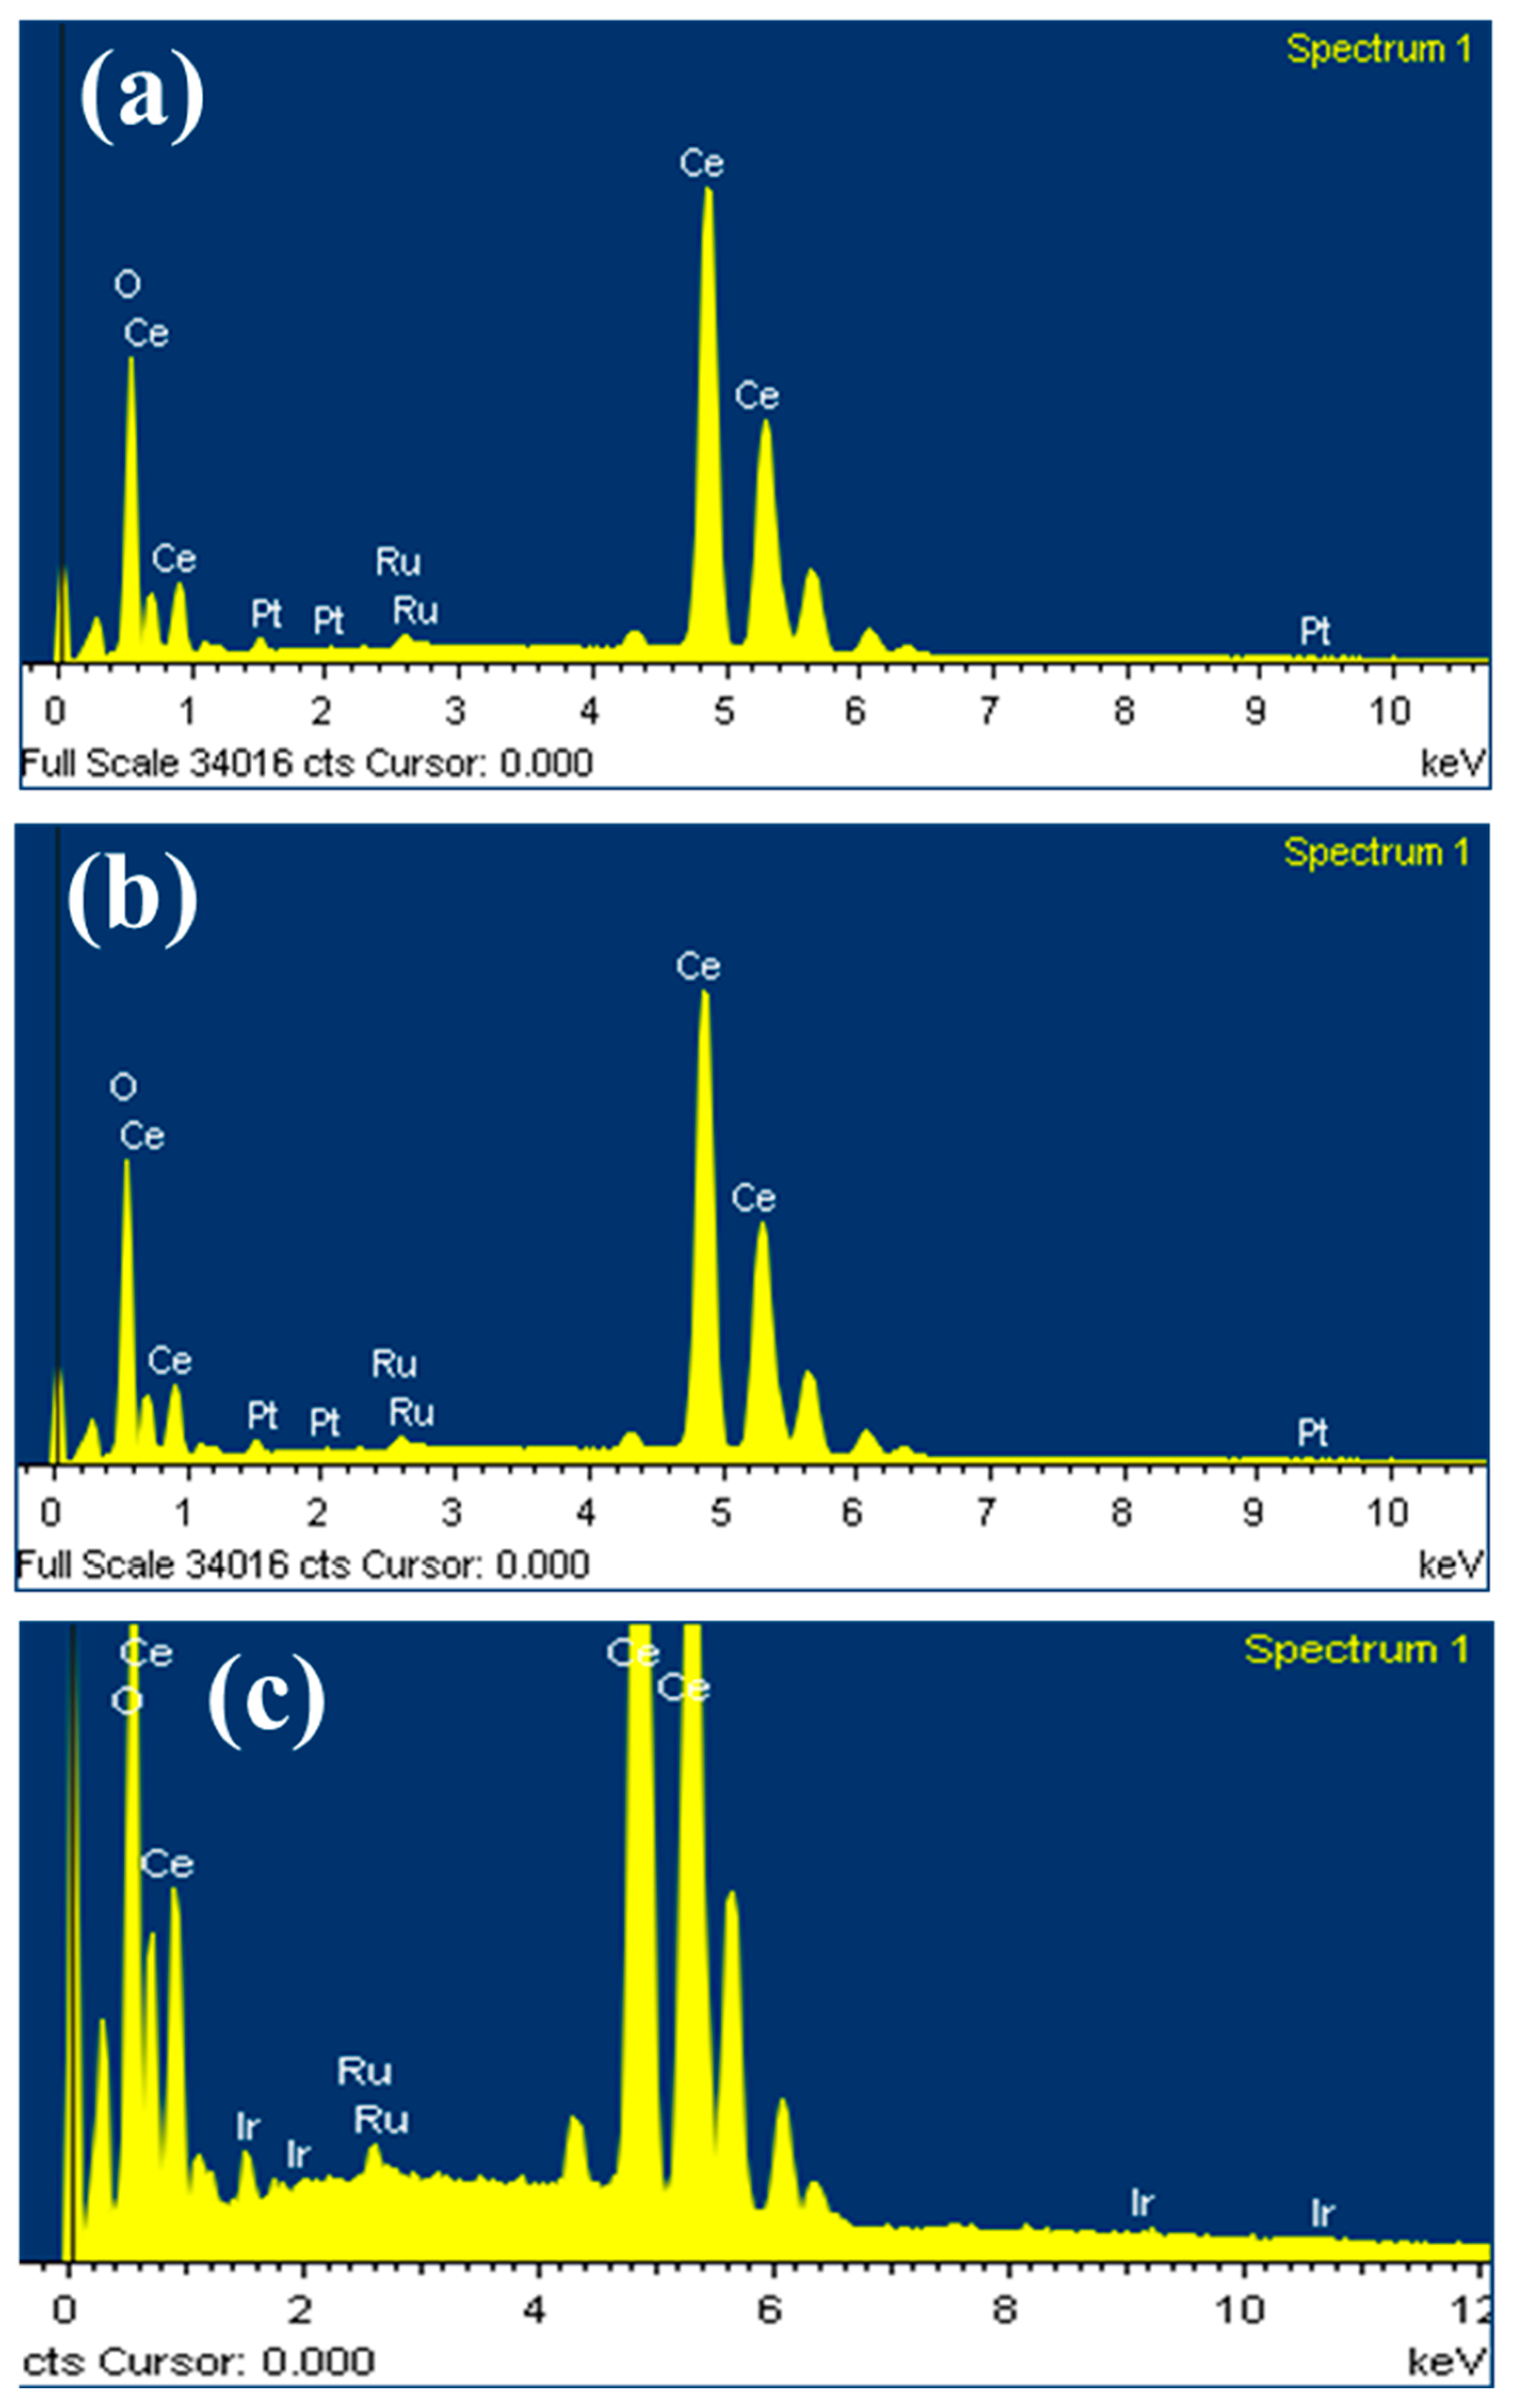
Continuing the analysis, Figure 2a,b shows the Pt/CeRuO2 compound, where flat-plane structures with porous and rough surfaces are clearly distinguished. The EDS analysis in Figure 3b confirmed the presence of Pt, Ce, Ru, and O.
Under a similar approach, the Ir/CeRuO2 compound exhibits analogous porous plate-like morphologies, as observed in Figure 2c,d. Thus, it can be concluded that the Ir procedure to disperse the nanoparticles does not induce significant morphological changes compared to the CeRuO2 support. The EDS analysis shown in Figure 3c for the Ir/CeRuO2 compound revealed characteristic signals of Ir, Ce, and Ru. This structural configuration found in Pt/CeRuO2 and Ir/CeRuO2 compounds may be beneficial, as the combination of porosity and flat surfaces can facilitate gas transport across the material.
An EDS analysis of the CeRuO2 surface detected only Ce, Ru, O, Pt and Ir elements, as can be appreciated in Figure 3, (a) CeRuO2, (b) Pt/CeRuO2, and (c) Ir/CeRuO2 compounds.

3.2. X-Diffraction Studies

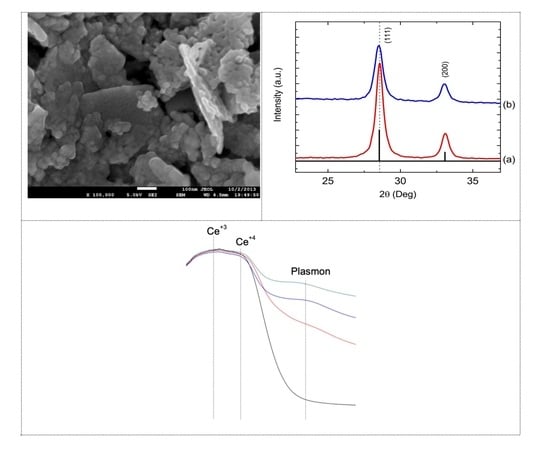
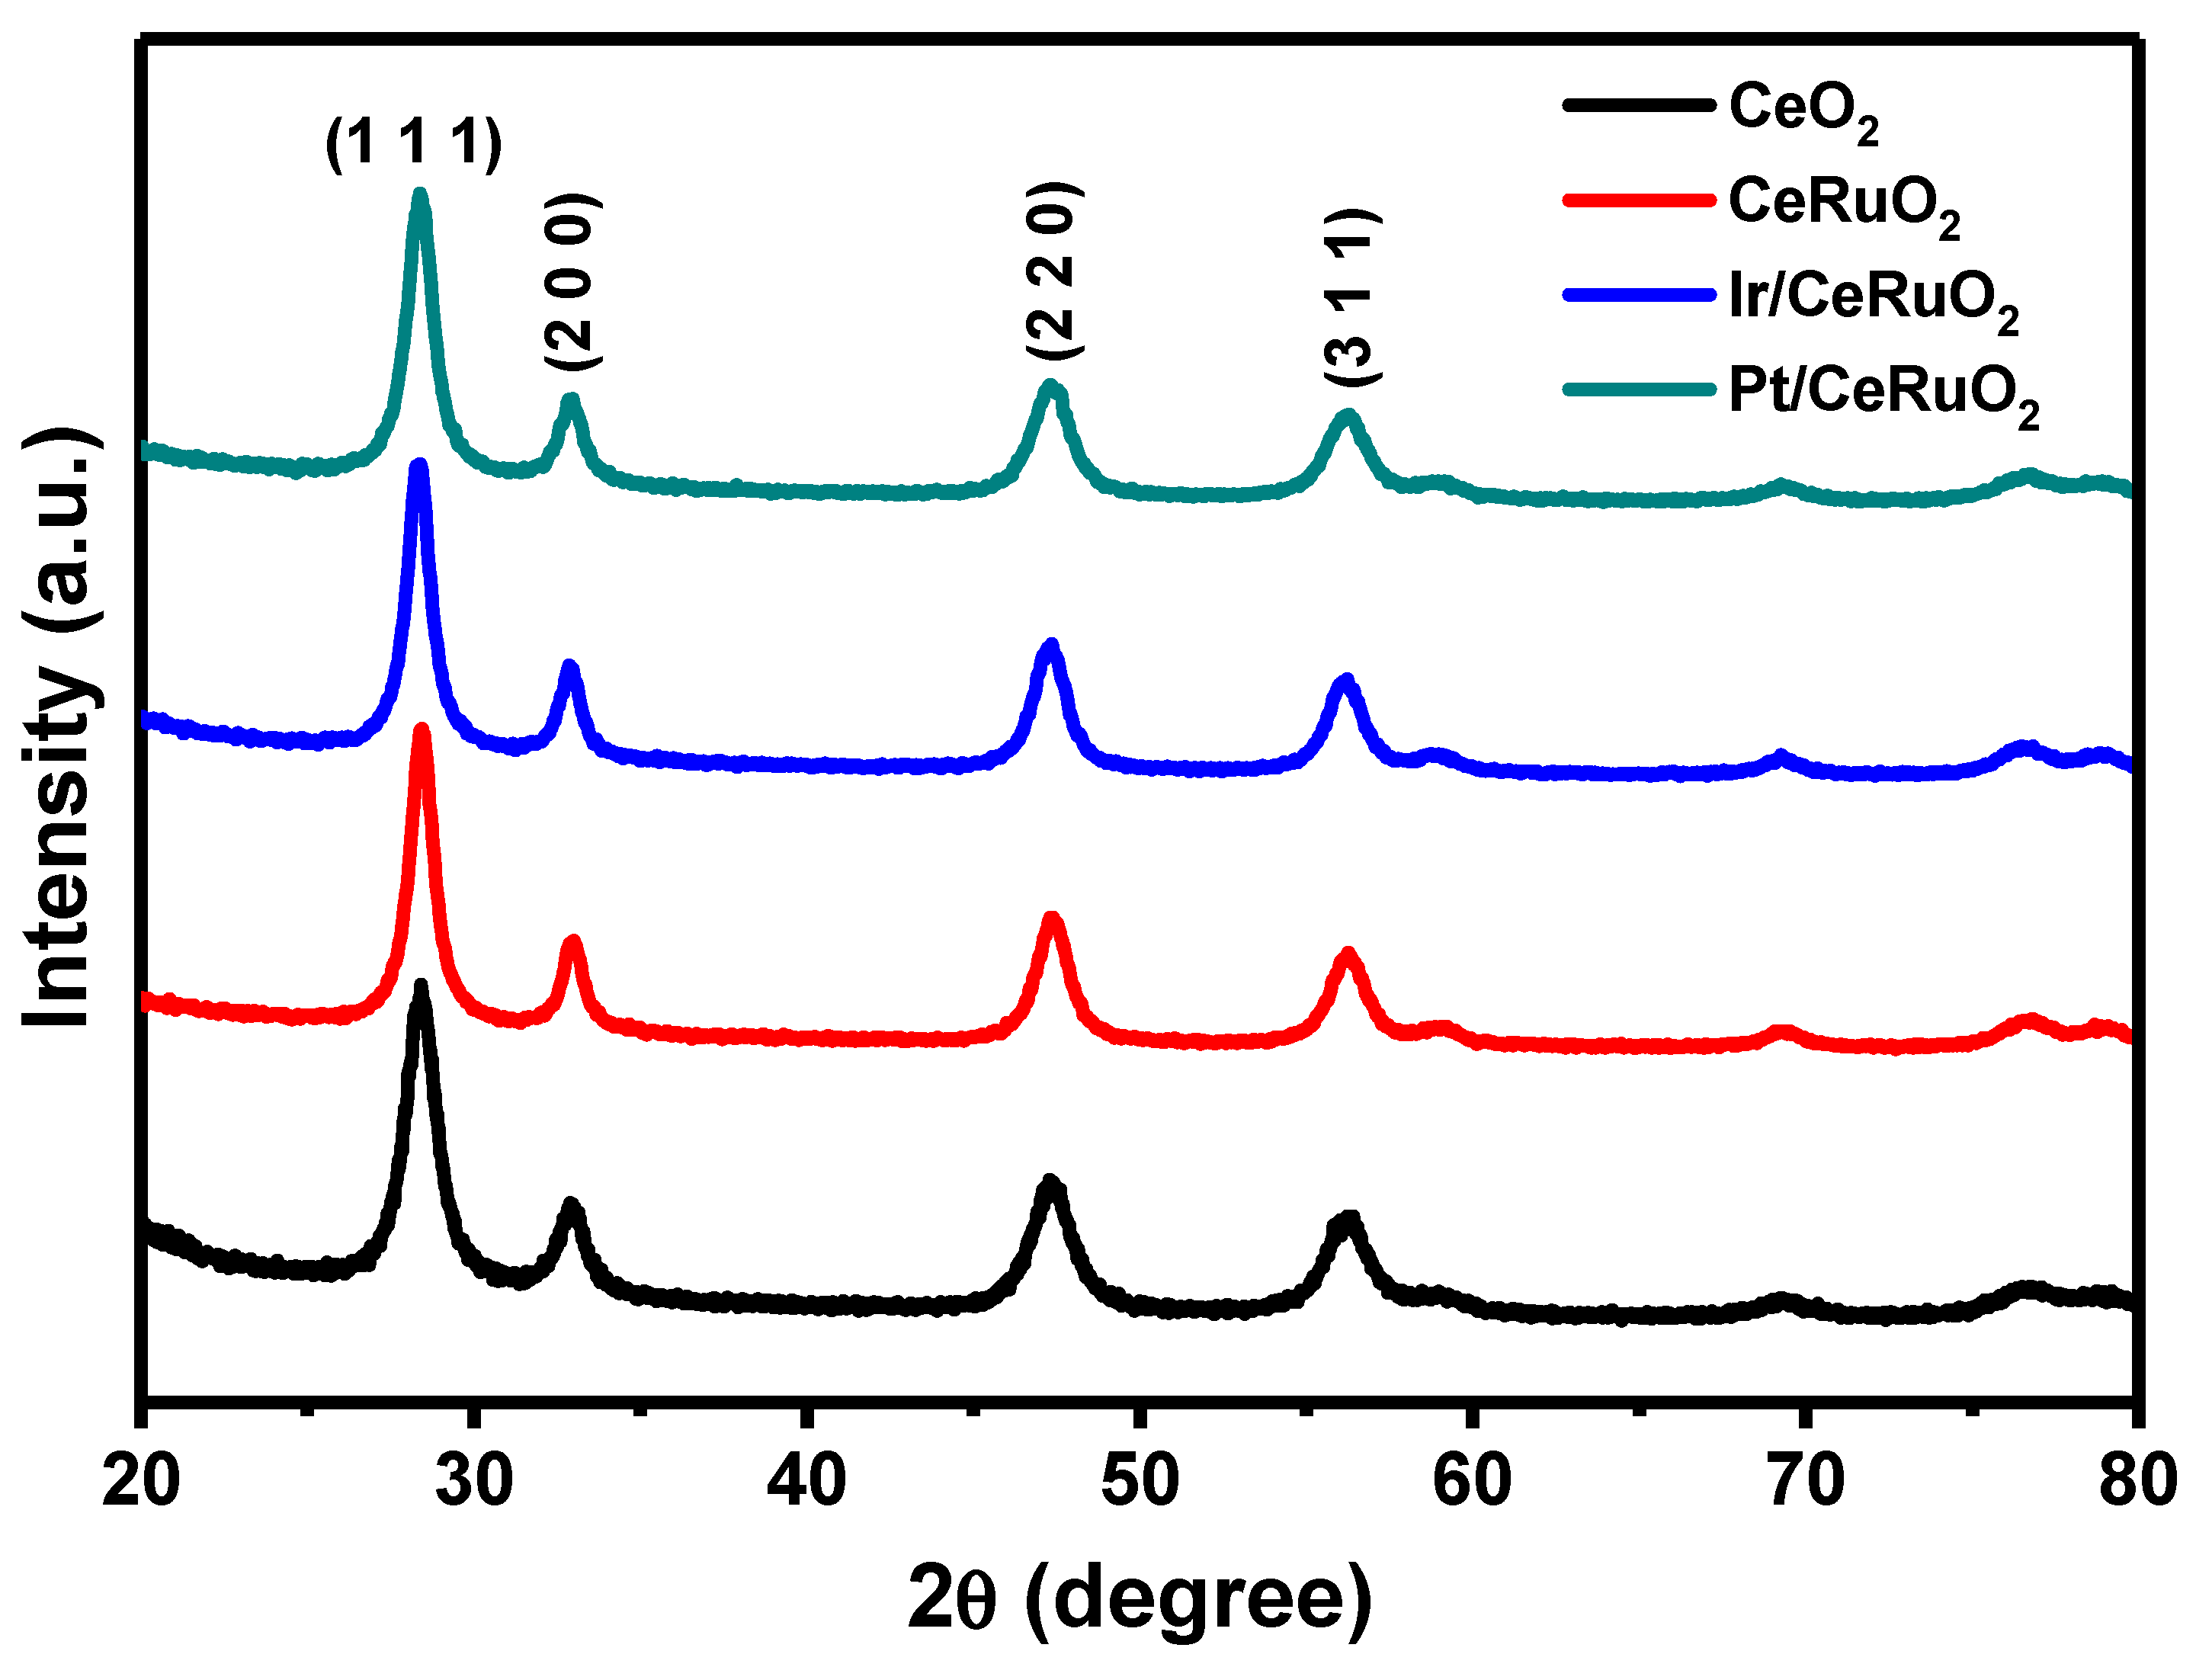
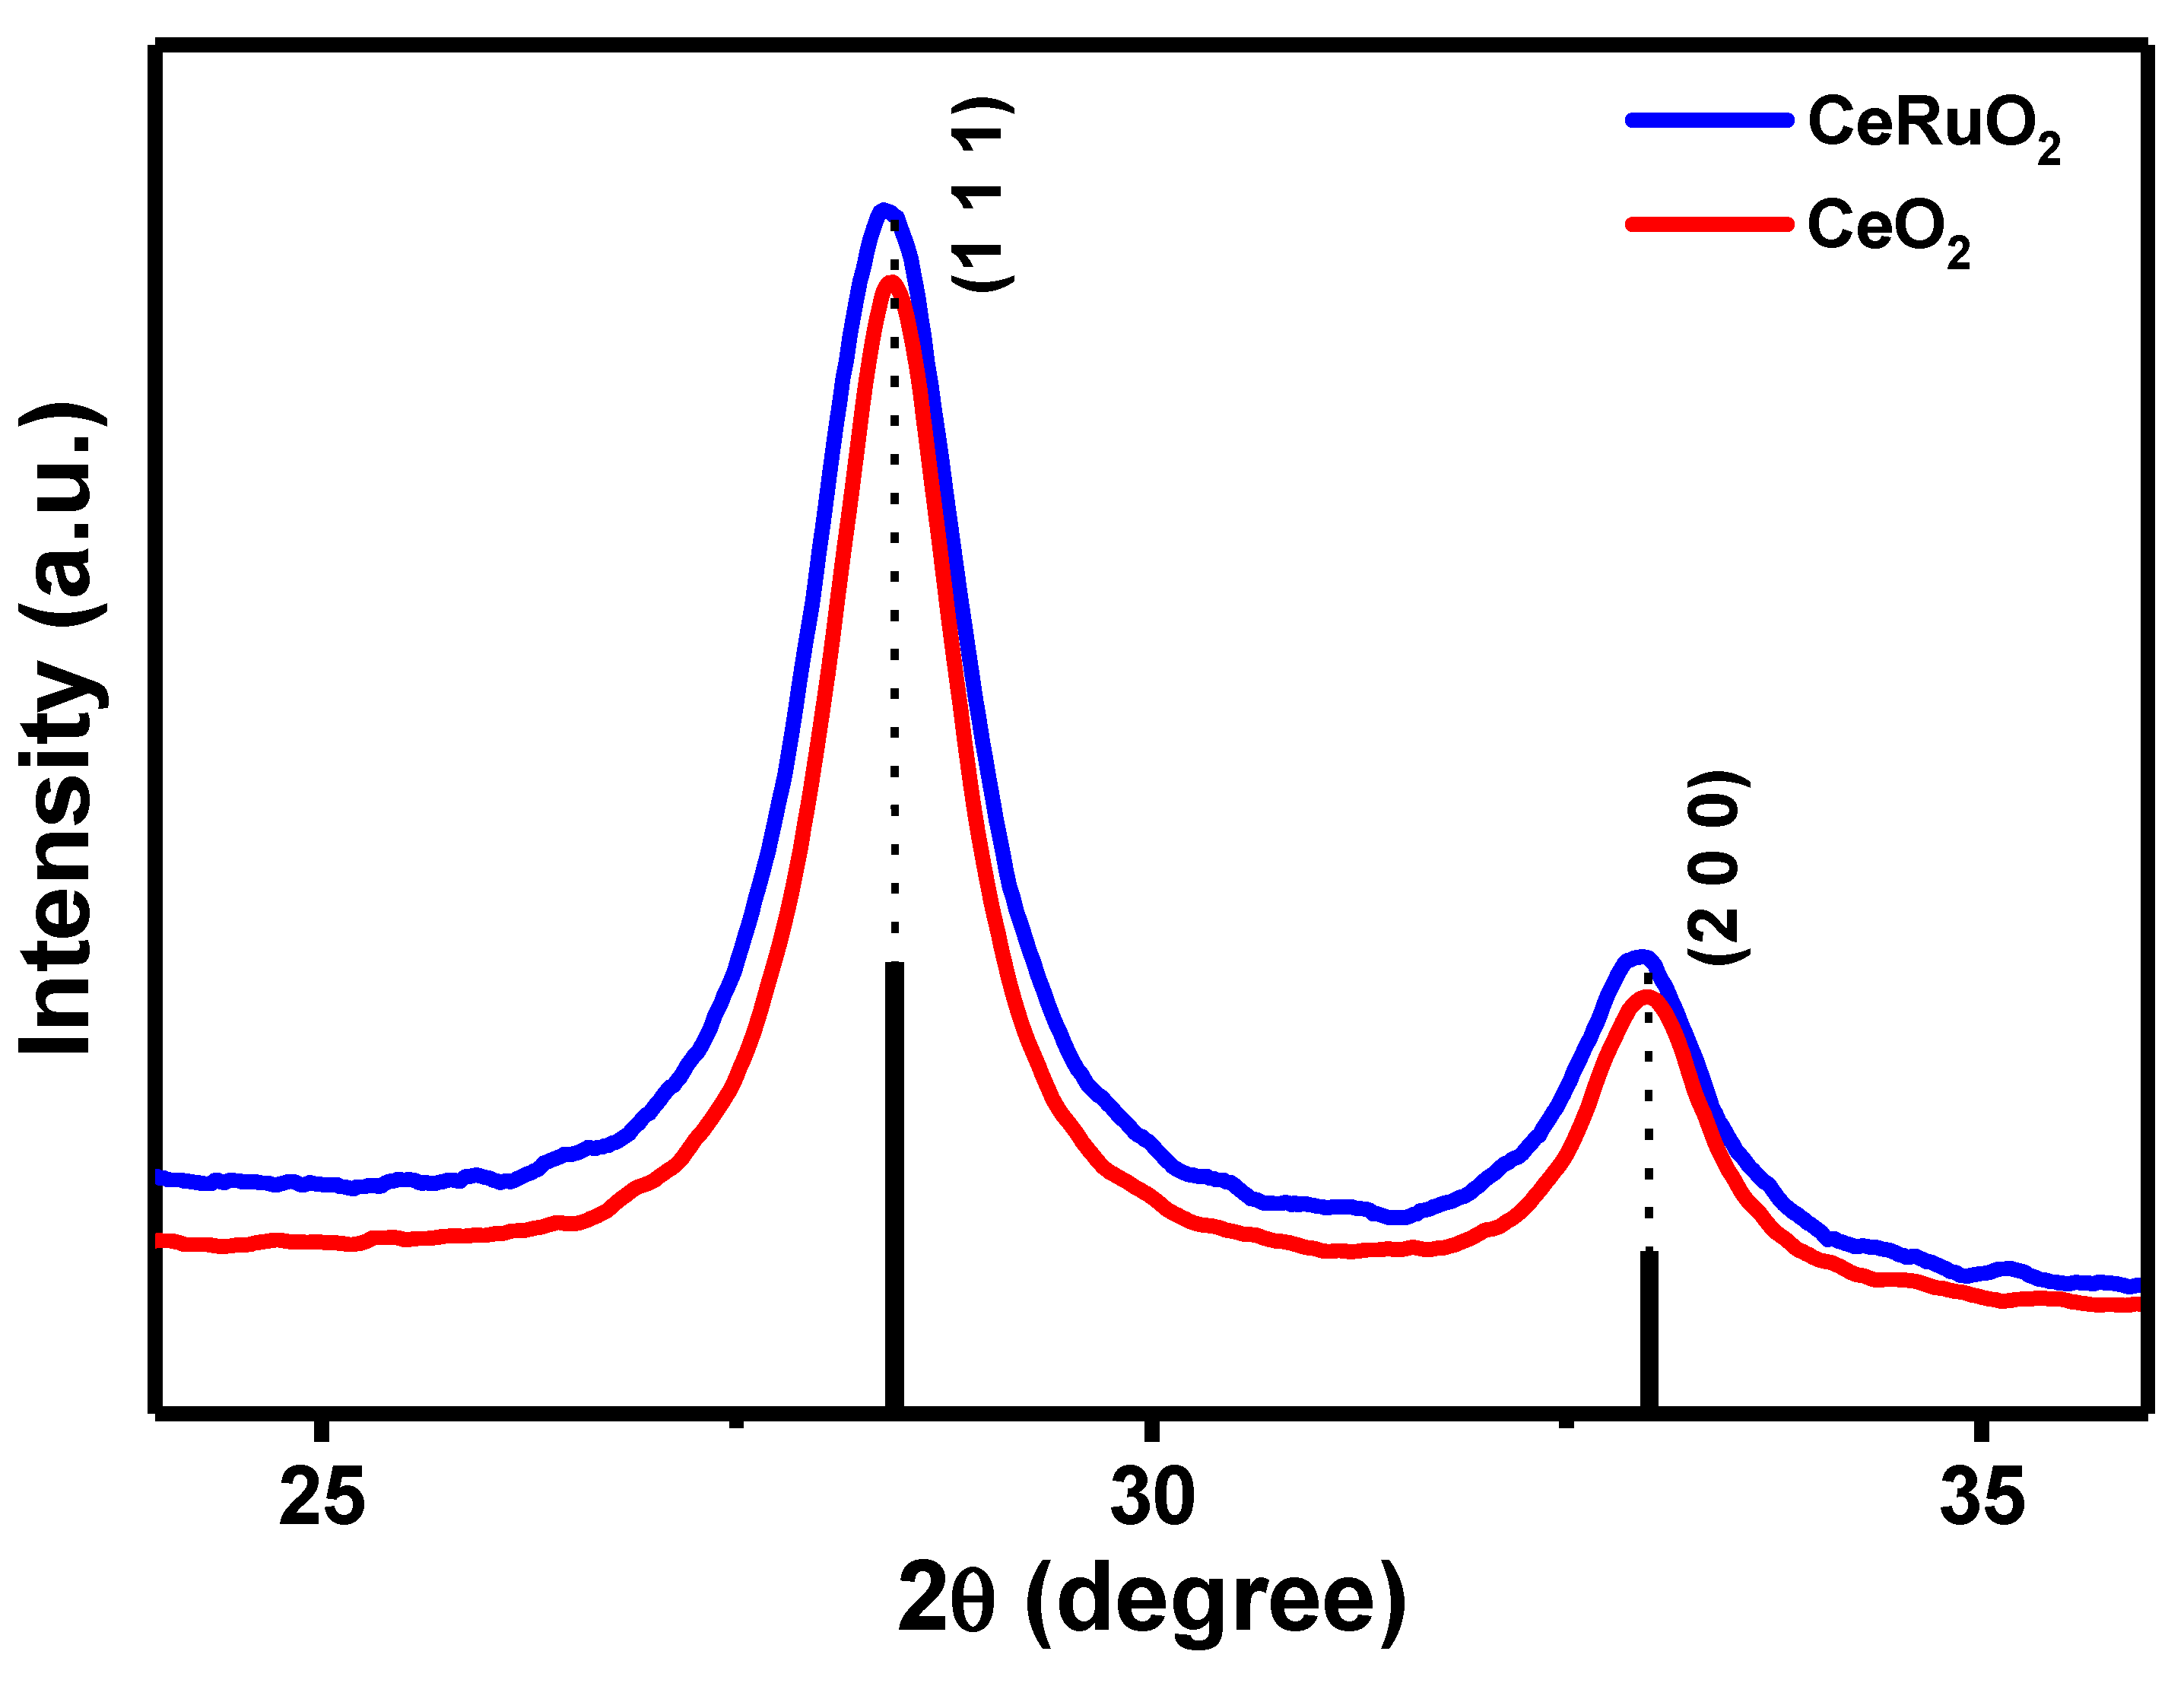
X-ray diffraction analyses were performed in samples to ensure the formation of the FCC structure, see Figure 4. Thus, ICCD card number 34-0394 was used to identify that the CeO2 sample matched properly with the CeRuO2, Ir/CeRuO2, and Pt/CeRuO2 catalysts. The main characteristic planes related to the CeO2 structure were located at 28.3, 32.96, and 47.30° (2θ), which were ascribed to the (111), (200), (200) planes, respectively, see Figure 4. In addition, a shifting towards lower-angle values was observed in samples doped with ruthenium. Analyzing it in detail, an amplified image in the 25–35 (2θ) range is shown in Figure 5. It shows high-resolution X-ray diffraction patterns performed for the CeO2 and CeRuO2 catalysts. As has been previously pointed out, a shift towards low angles is observed in CeRuO2, as well as in the supported samples.
After calculating the cell parameters for CeO2 and CeRuO2 samples, a decrease in cell volume was observed, probably related to the substitution of some Ce sites for Ru ions. Ruthenium has a smaller atomic radius (0.133 nm) compared to Ce (0.183 nm). This observation is consistent with previous reports such as Kurnatowska et al. [20], suggesting that partial substitution occurs. In addition, the crystallite size of the samples was estimated using the Scherrer equation, yielding the results summarized in Table 1.
D = K λ W cos θ  
where D: crystallite size, K: 0.94 is the shape constant, λ: 0.15405 nm, the X-ray wavelength for Cu-Kα radiation, W: full width at half maximum of the (111) plane, and θ is the diffraction angle. Accordingly, the higher value for the crystallite size was 13.41 nm for the CeO2 compound, followed by the CeRuO2 support. The wet impregnation process used to disperse the Pt or Ir, nanoparticles on the CeRuO2 support, followed by subsequent hydrogen reduction, promotes a reduction in the crystallite size. This effect, in turn, may enhance the surface/volume ratio, leading to improved catalytic performance.

3.3. Specific Surface Area Determination

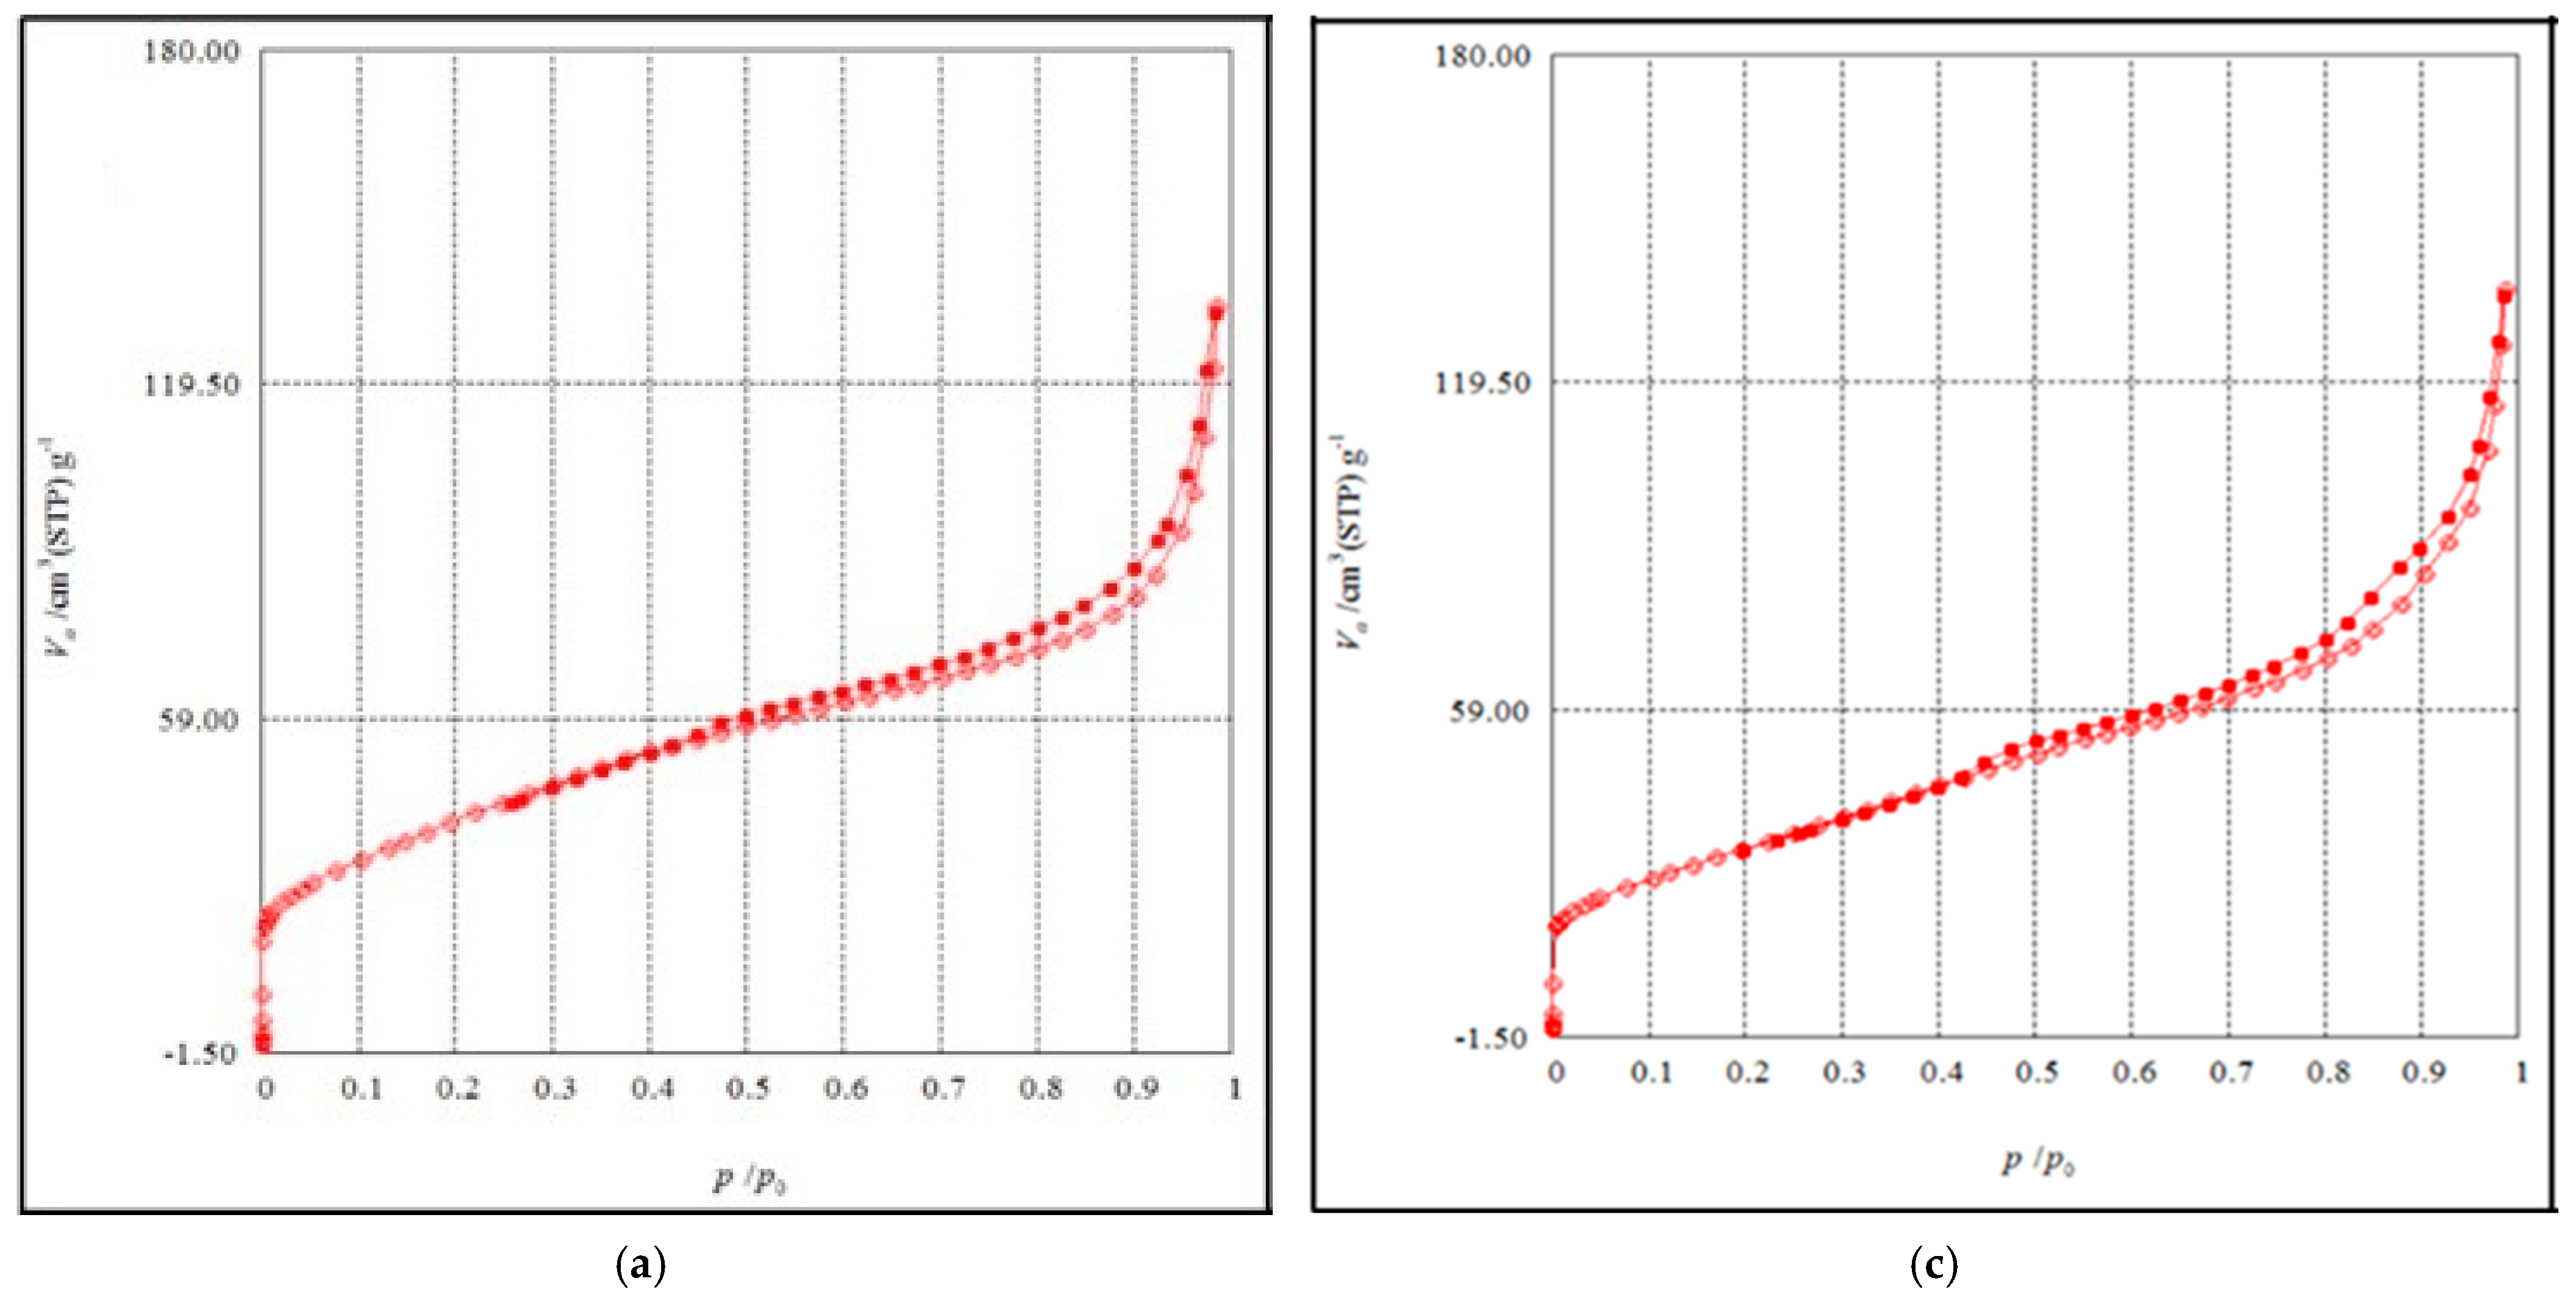
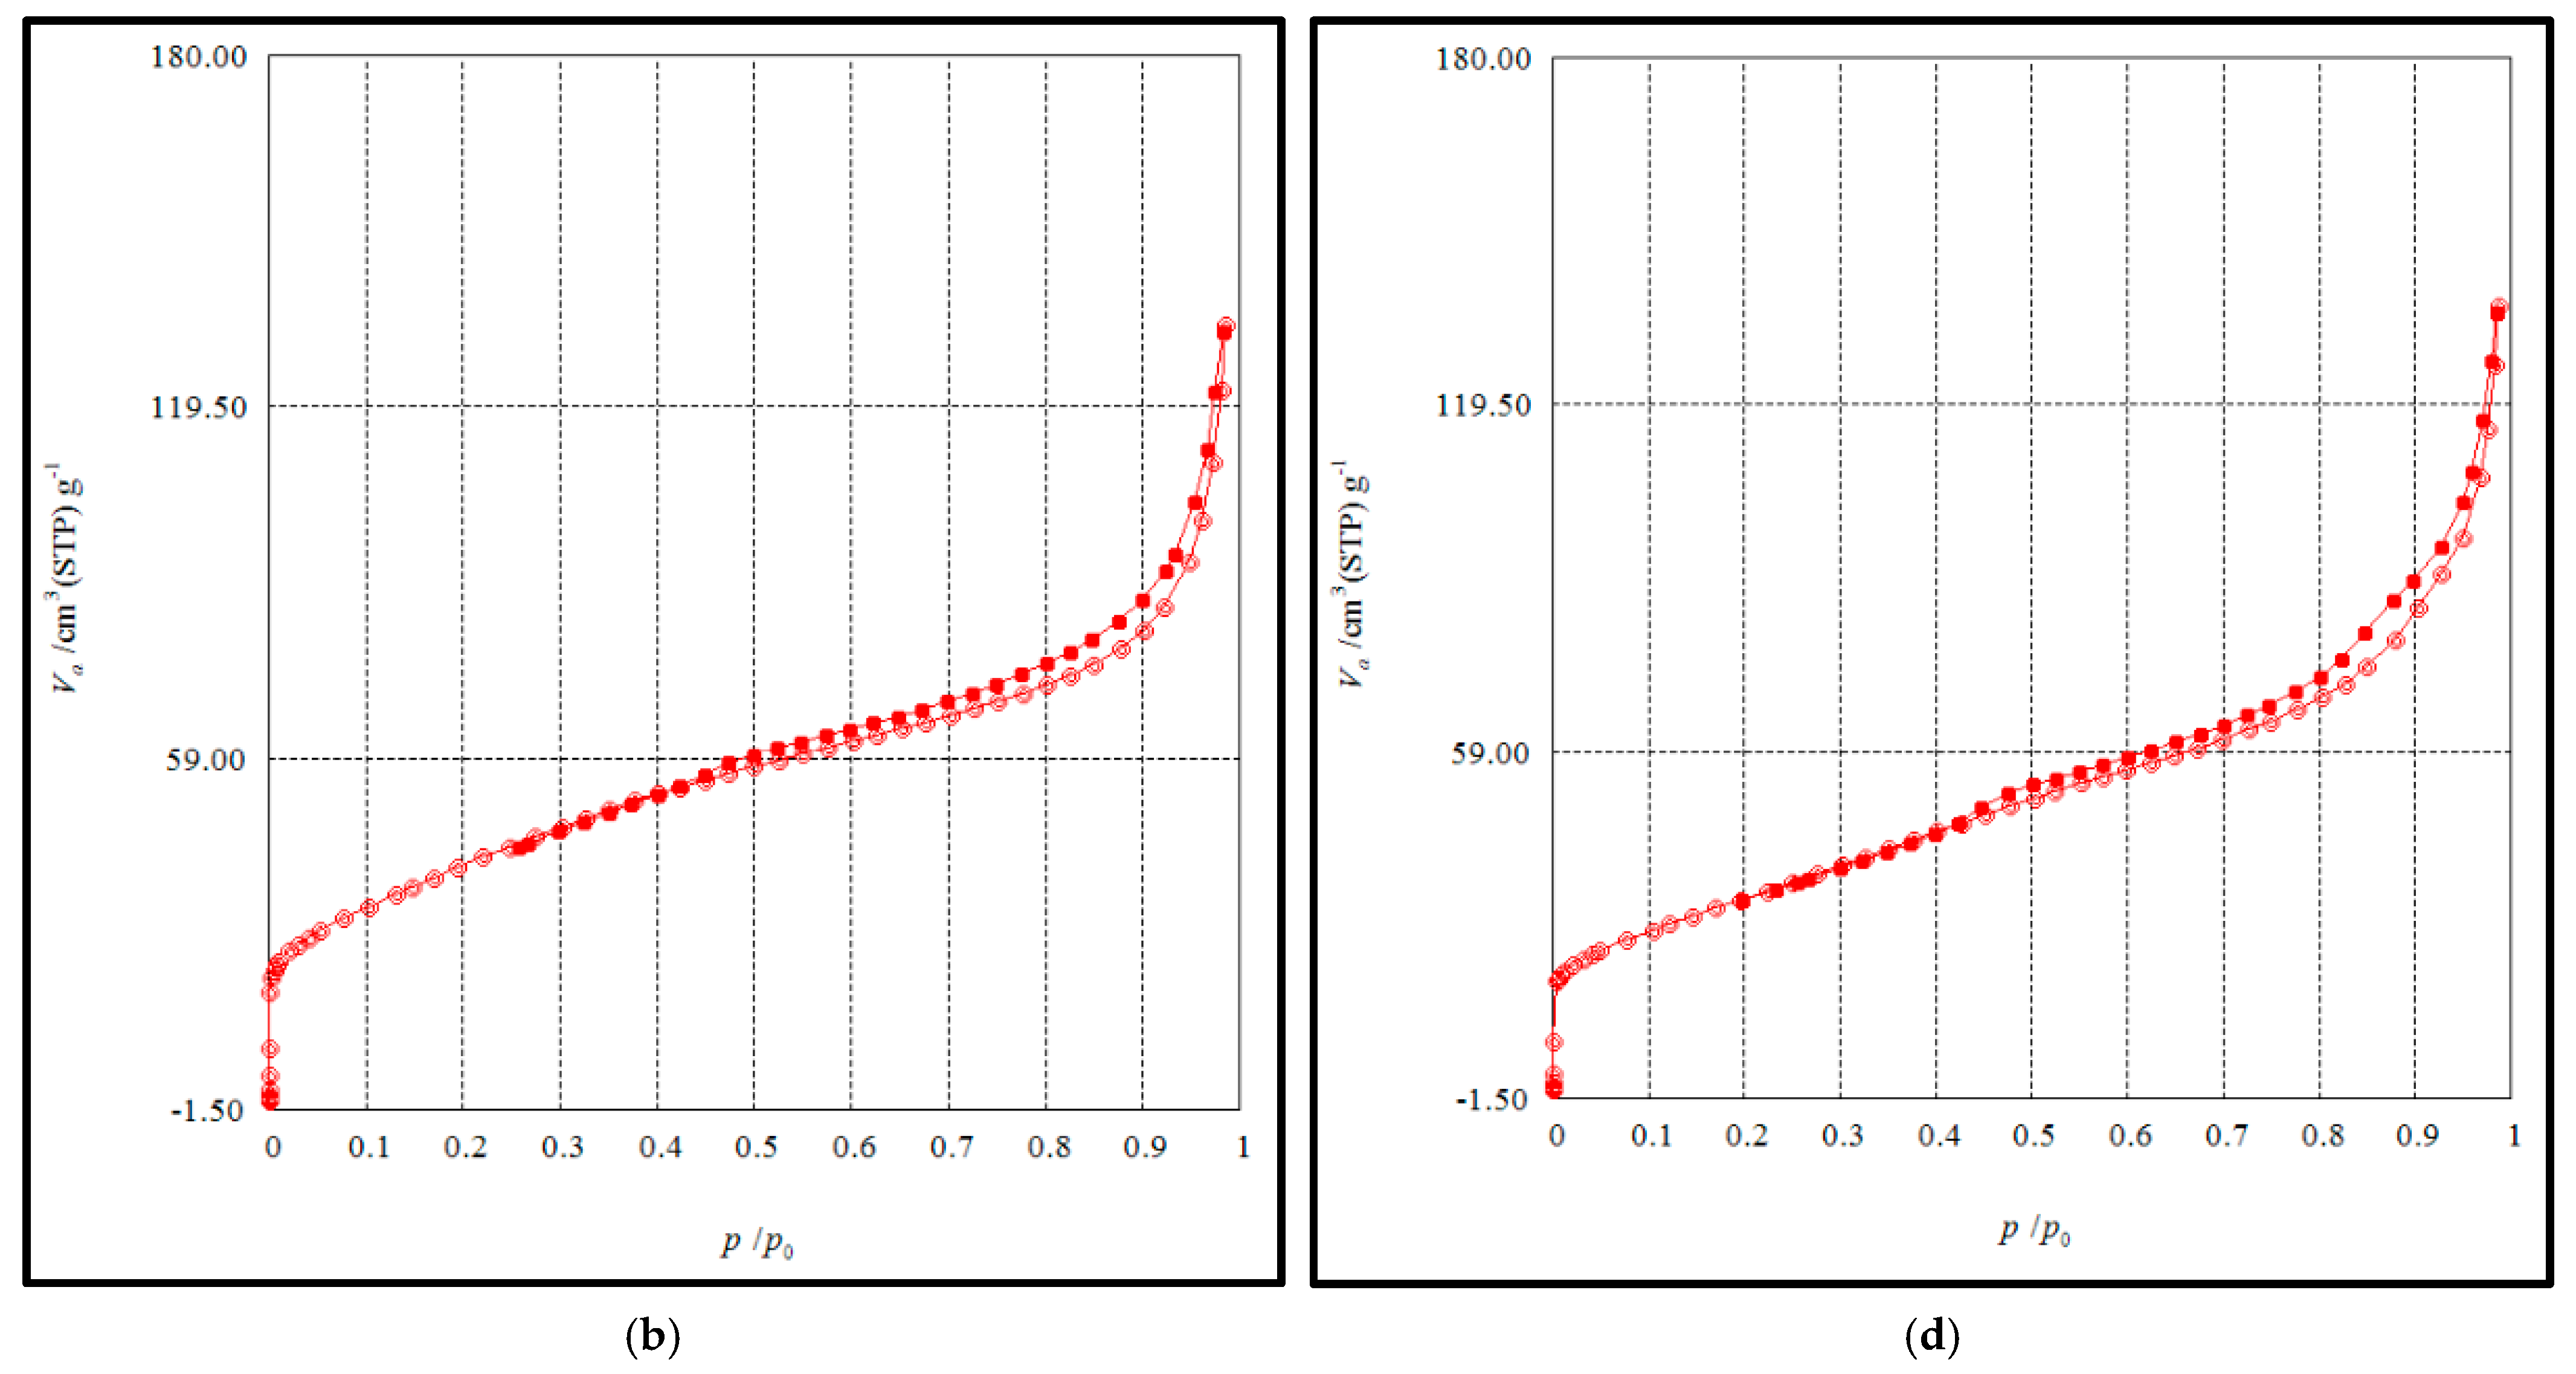
The adsorption–desorption isotherms of the supported catalysts are shown in Figure 6 and summarized in Table 2. The isotherm trends can be ascribed as type IV according to the IUPAC classification, corresponding to a typical mesoporous material. Analysis of the hysteresis loops indicate an H3-type behavior, characteristic of materials containing highly dispersed porous plates, being consistent with SEM analysis discussed earlier. The specific surface area for the CeO2 catalyst was determined to be 136.62 m2/g, while those corresponding to CeRuO2 (148.30 m2/g), Pt/CeRuO2 (149.30 m2/g), and Ir/CeRuO2 (123.40 m2/g) compounds were relatively similar. The pore size distribution also followed a comparable trend.

3.4. XPS Analyses

XPS analyses were carried out in two stages. Firstly, a general survey was conducted for every sample. In a second stage, high-resolution analyses were carried out to determine the oxidation state of the Ce, Ru, Pt, and Ir elements.
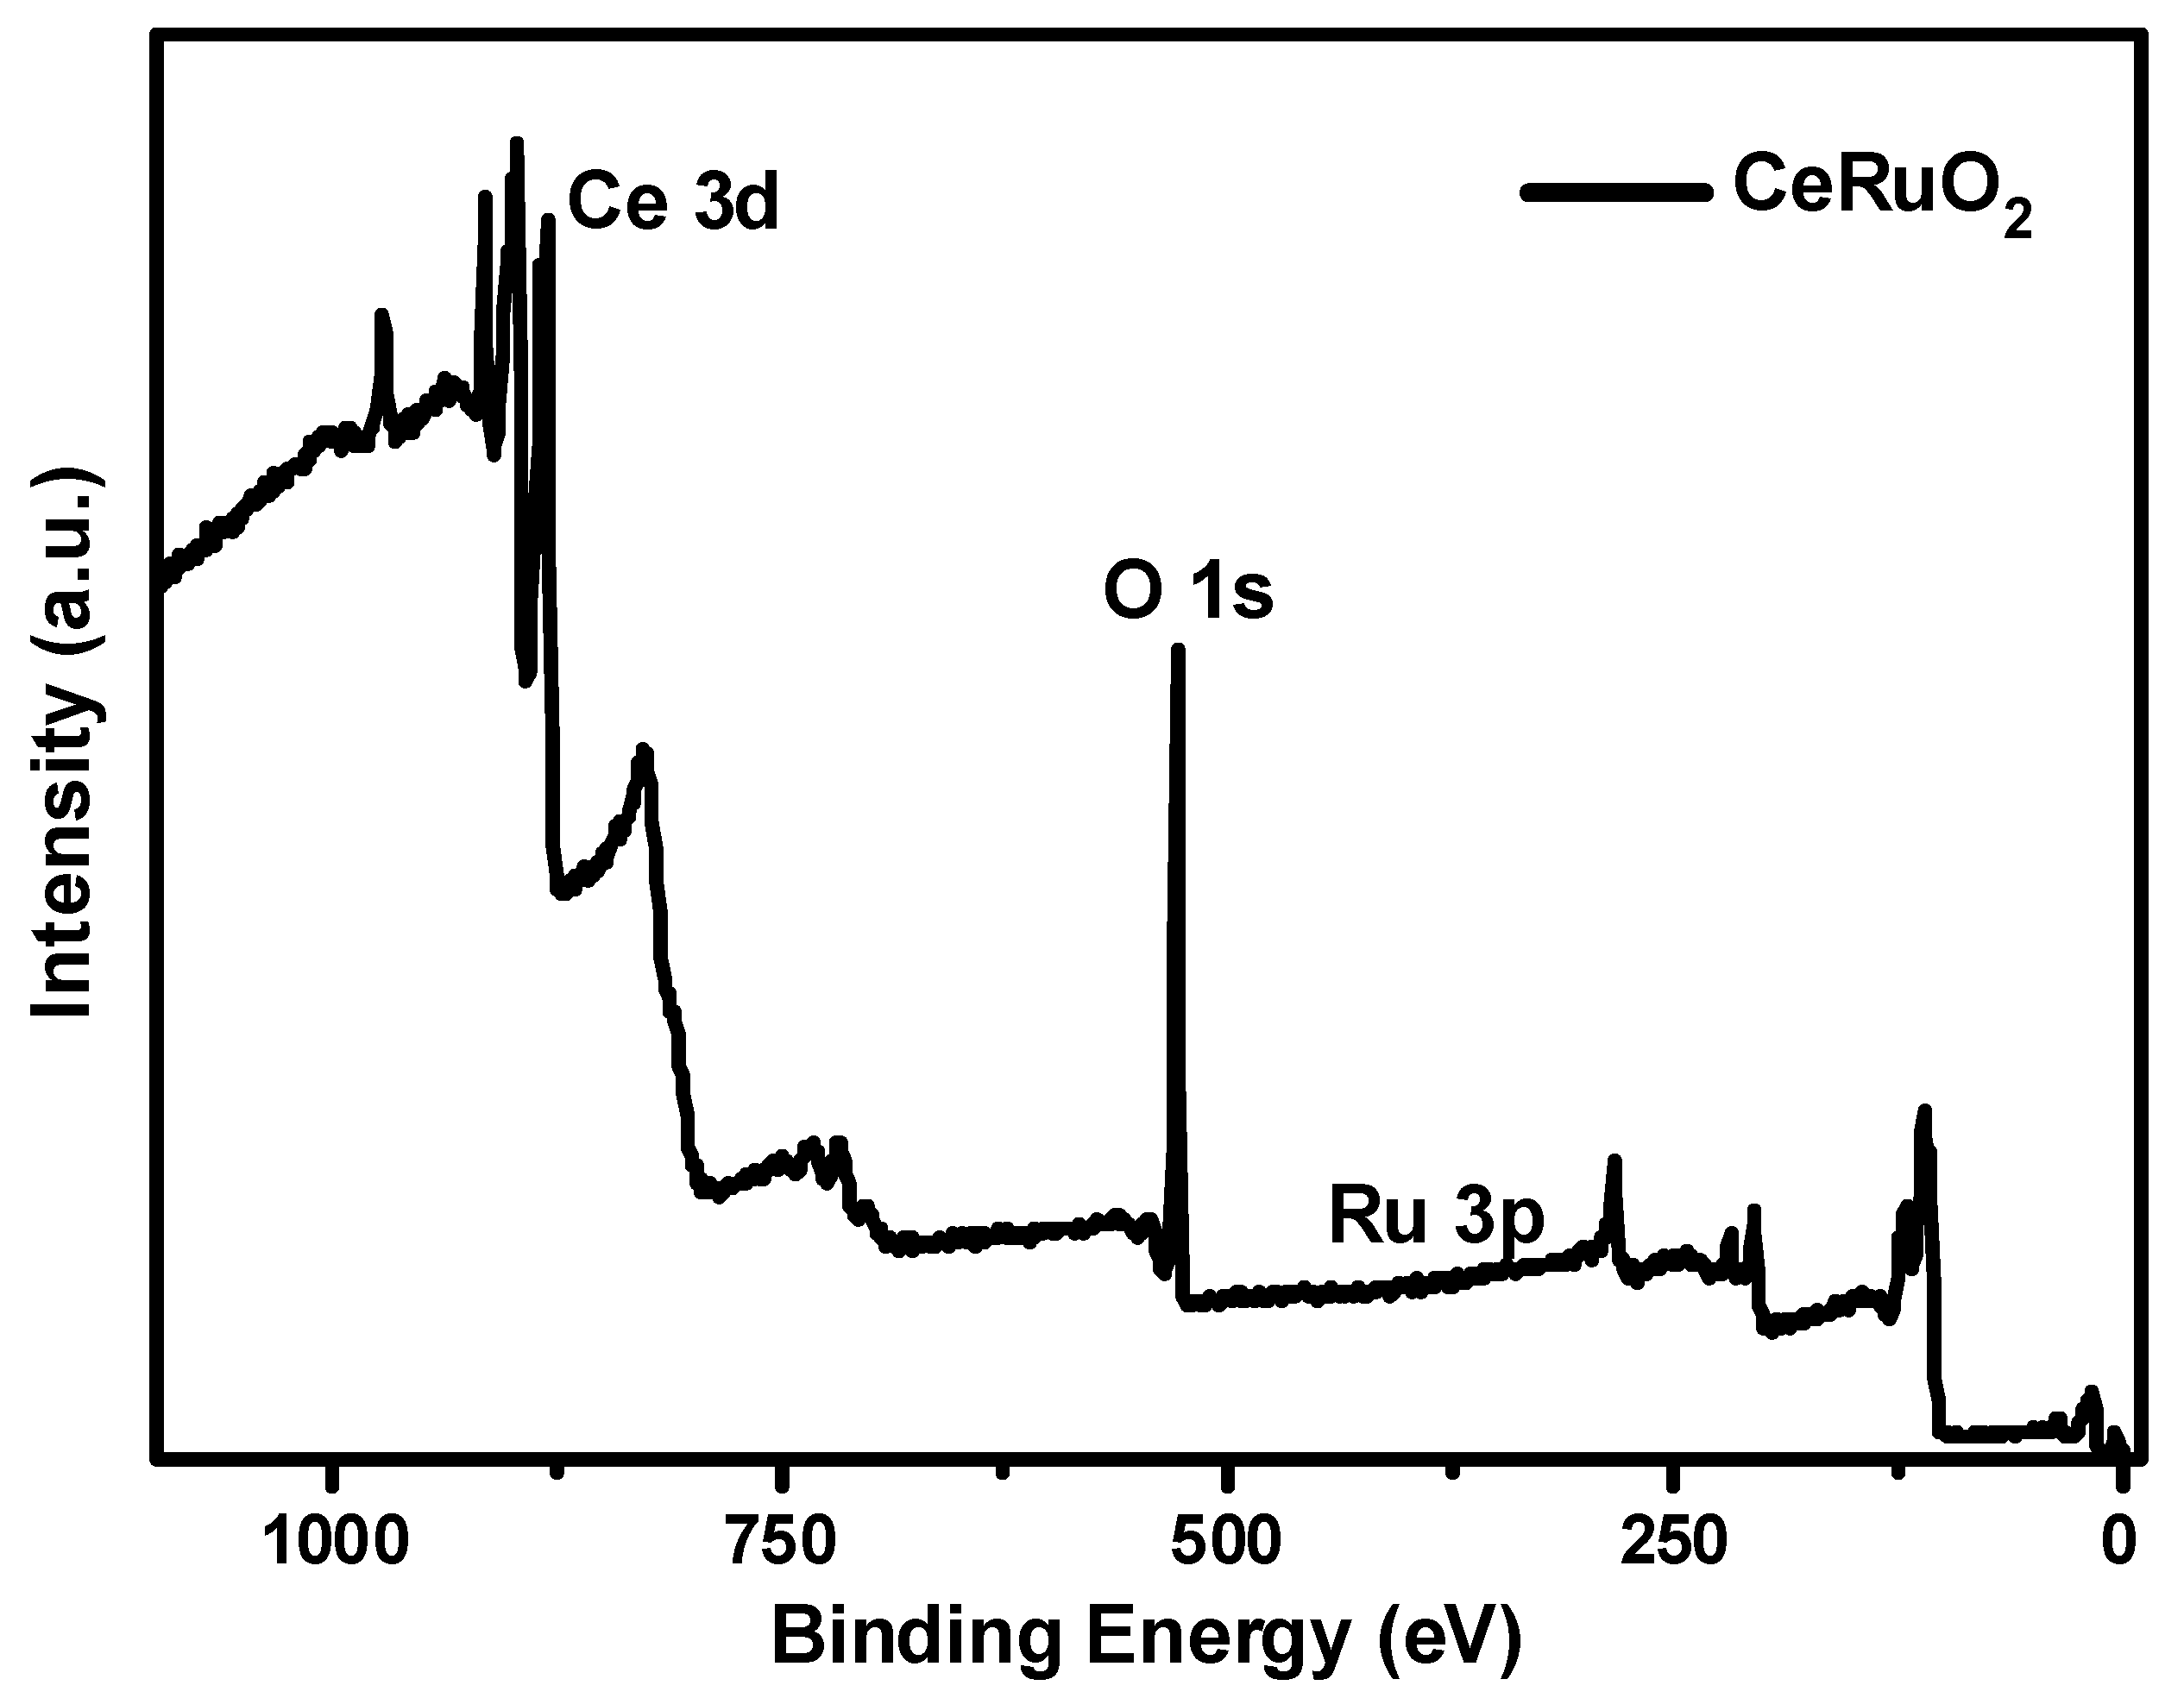
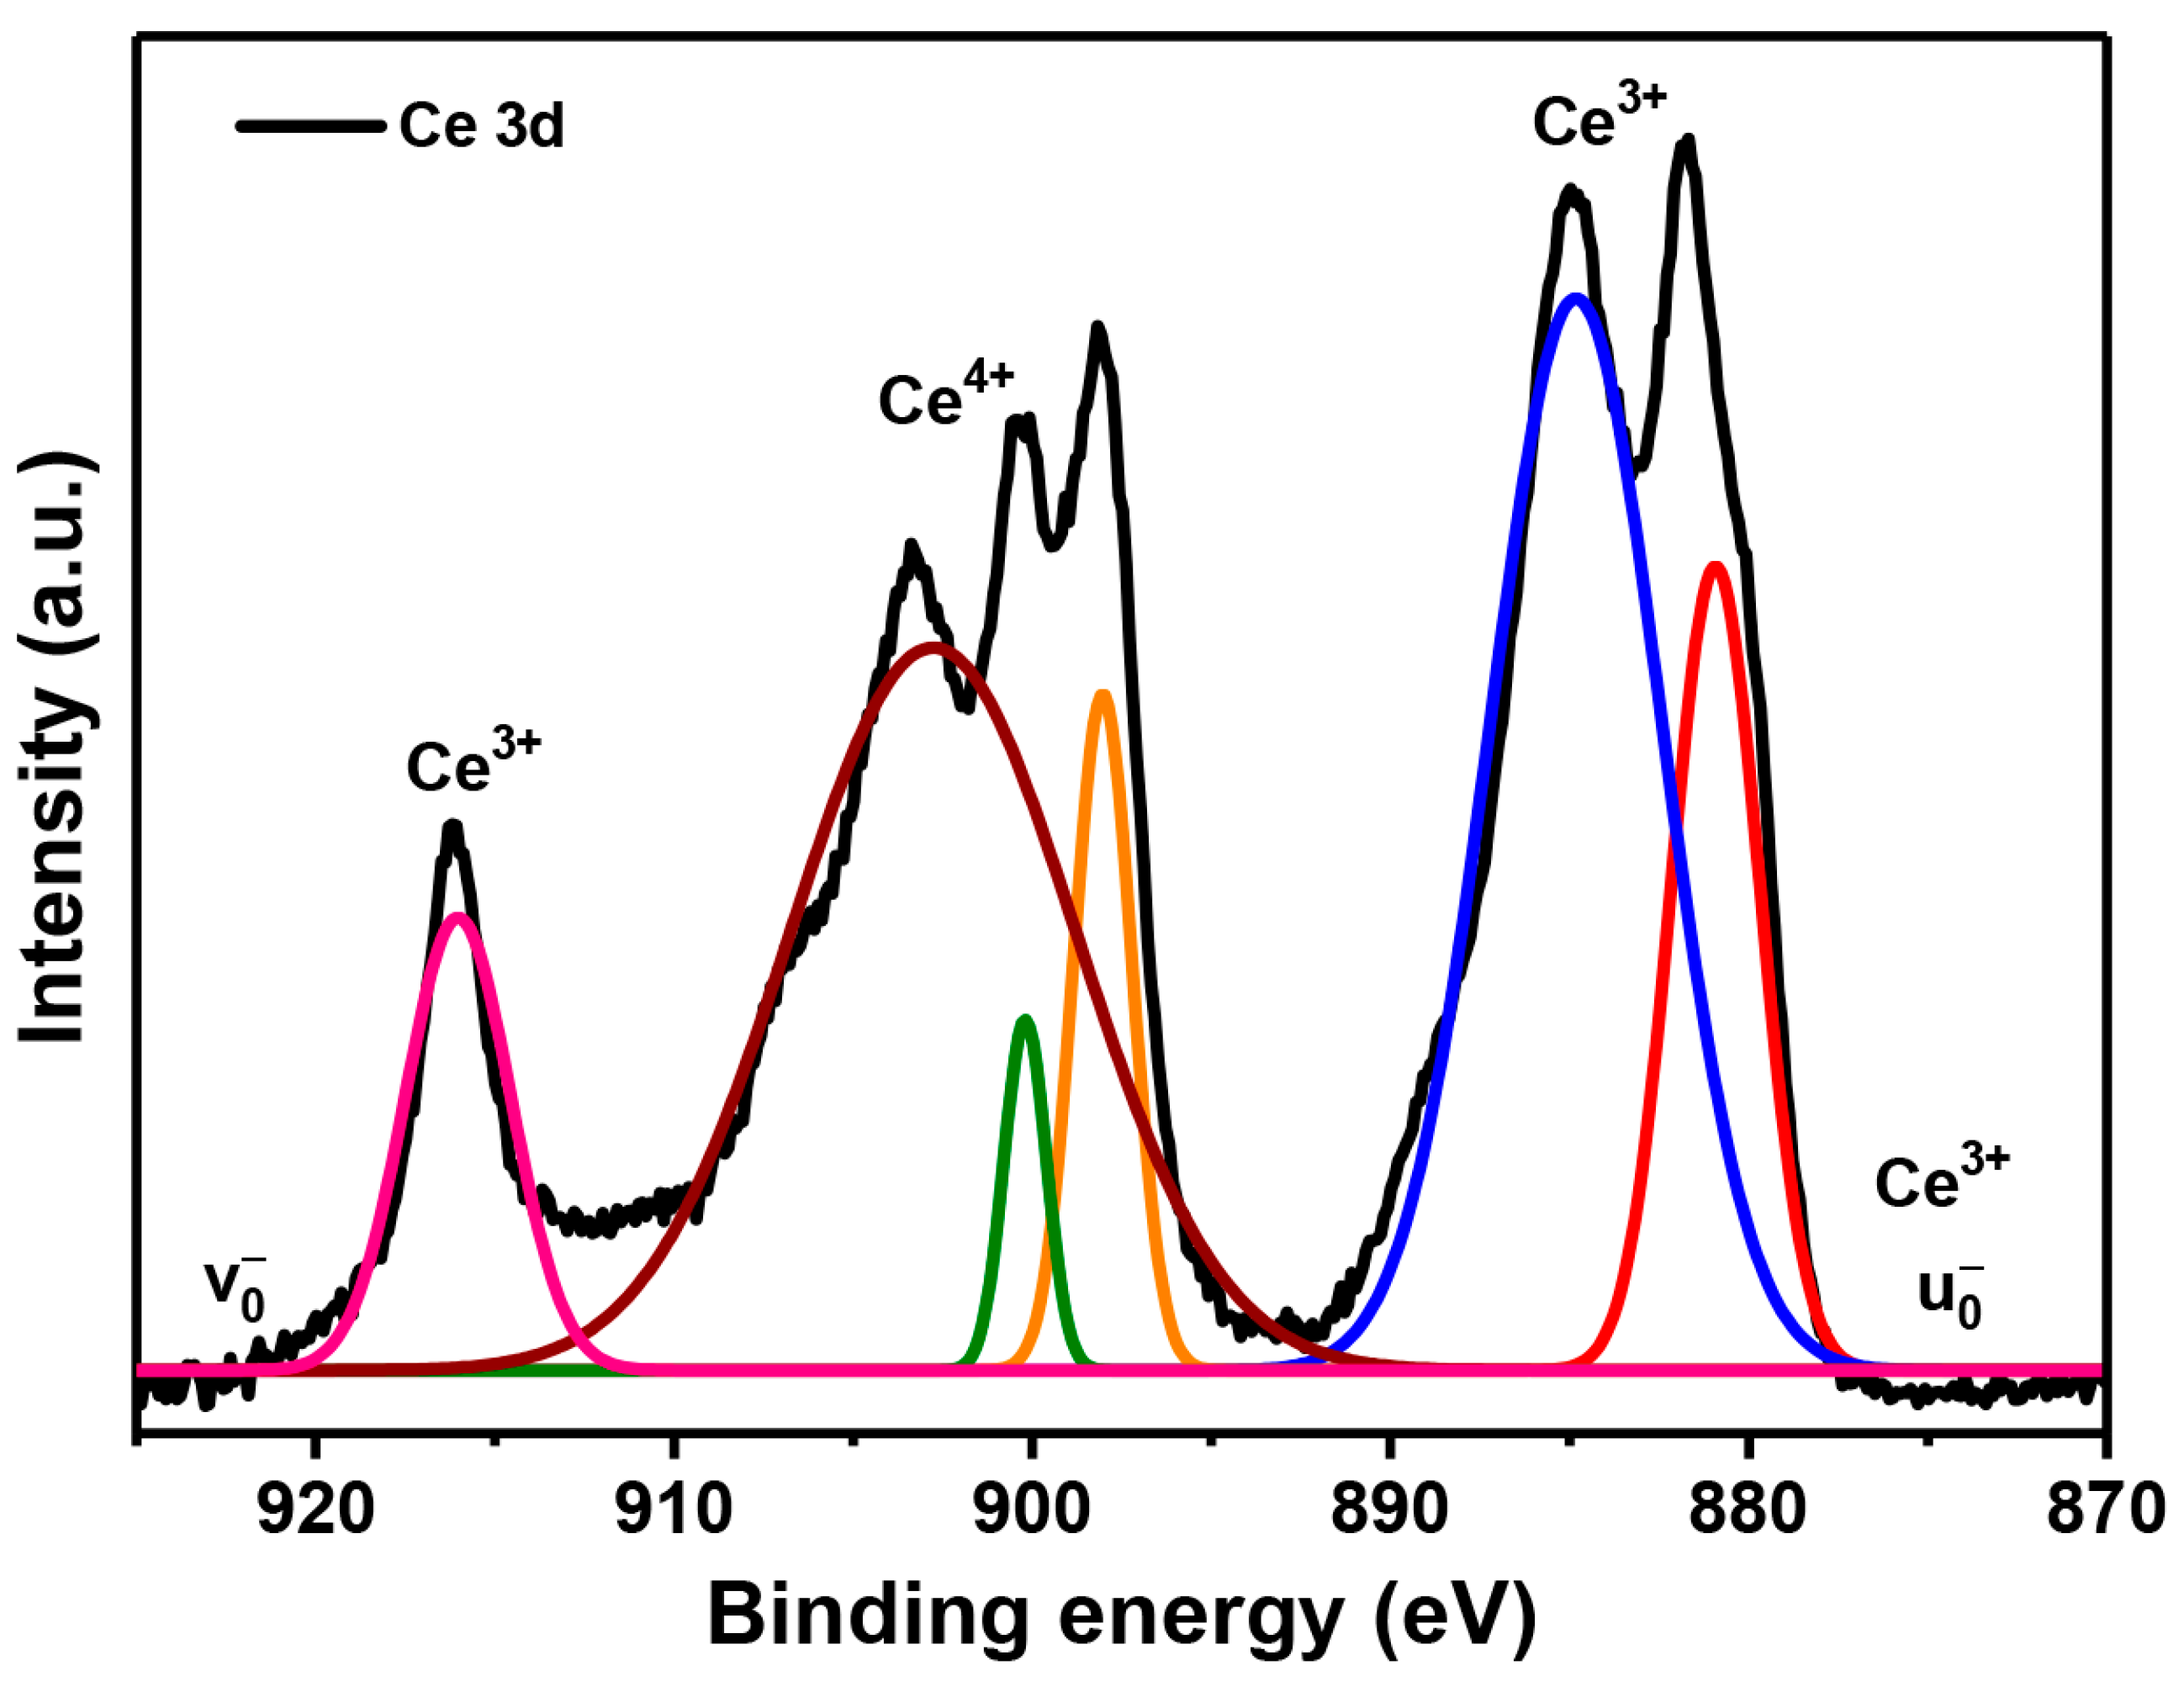
The surface composition of the samples was investigated by X-ray photoelectron spectroscopy (XPS). The survey spectrum of the CeRuO2 support (Figure 7) shows the characteristic signals of Ce, Ru, and O, confirming the successful incorporation of Ru into the CeO2 lattice without detectable impurities. The Ce 3d spectrum was deconvoluted into several components corresponding to Ce3+ and Ce4+ species (Figure 8). The peaks located at approximately 880.9, 884.8, 898, and 916 eV were assigned to Ce4+, while the components at 900.1 and 902.7 eV were attributed to Ce3+ species [14]. Based on the integrated peak areas, the relative concentration of Ce3+ was estimated to be approximately 15%, whereas Ce4+ accounted for about 85% of the total cerium species. The presence of Ce3+ indicates the formation of oxygen vacancies in the ceria lattice, which are known to enhance oxygen mobility and promote catalytic oxidation reactions.
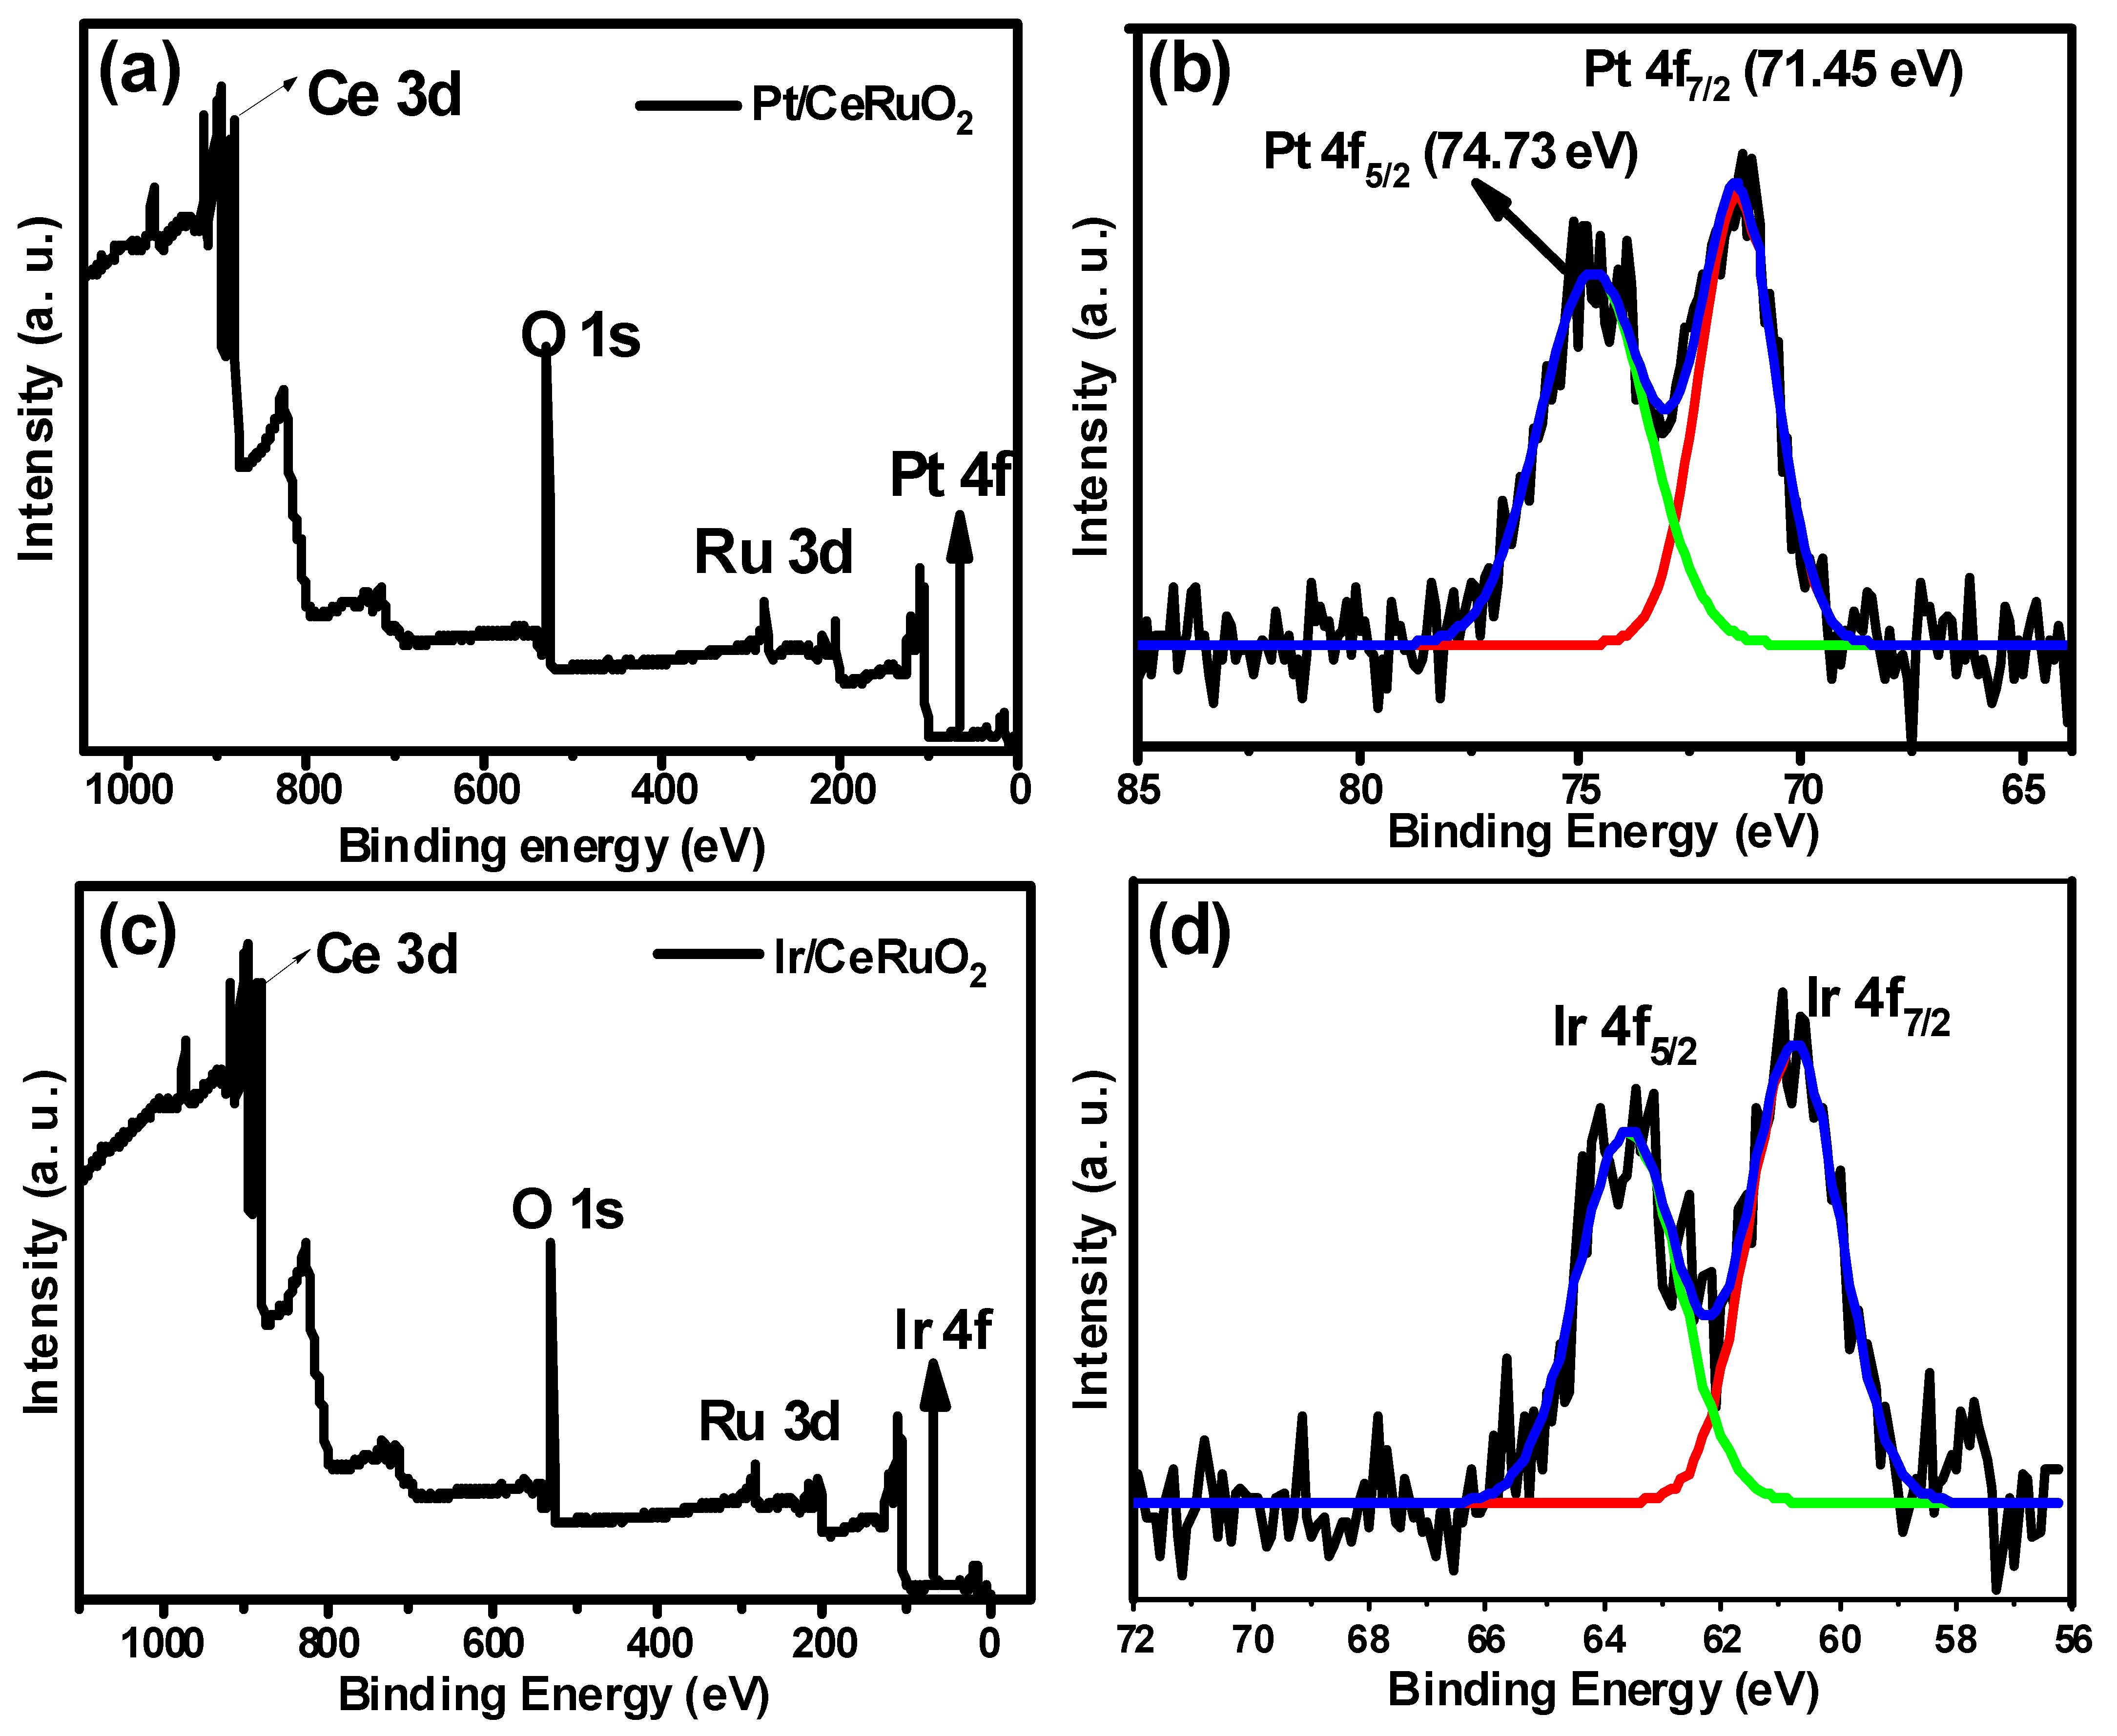
For the Pt/CeRuO2 catalyst, the survey spectrum, Figure 9a, displays the expected contributions from Ce, Ru, O, and Pt, while the high-resolution Pt 4f spectrum, Figure 9b, reveals two main peaks at 71.0 eV and 74.9 eV, corresponding to metallic Pt0 and oxidized Pt4+ species, respectively. Although noble metals are preferably obtained in the metallic state (Pt0), partial oxidation is common. In this case, the more intense signal associated with Pt0 indicates that the reduction treatment was effective in promoting a high fraction of metallic platinum, which is beneficial for catalytic activity. Regarding the Ir/CeRuO2 catalyst, the survey spectrum, Figure 9c, evidences the presence of Ce, Ru, O, and Ir. The high-resolution Ir 4f spectrum, Figure 9d, shows two well-defined peaks centered at 60.9 eV, characteristic of metallic Ir0 species. The absence of contributions from oxidized Ir indicates that the reduction conditions applied during synthesis were sufficient to drastically reduce iridium oxides, favoring the presence of metallic iridium as the dominant active phase. These results confirm that both Pt and Ir are successfully incorporated onto the CeRuO2 support, with platinum present as a mixture of metallic and oxidized species, while iridium is stabilized in its metallic state.

3.5. UV–Vis Spectroscopy

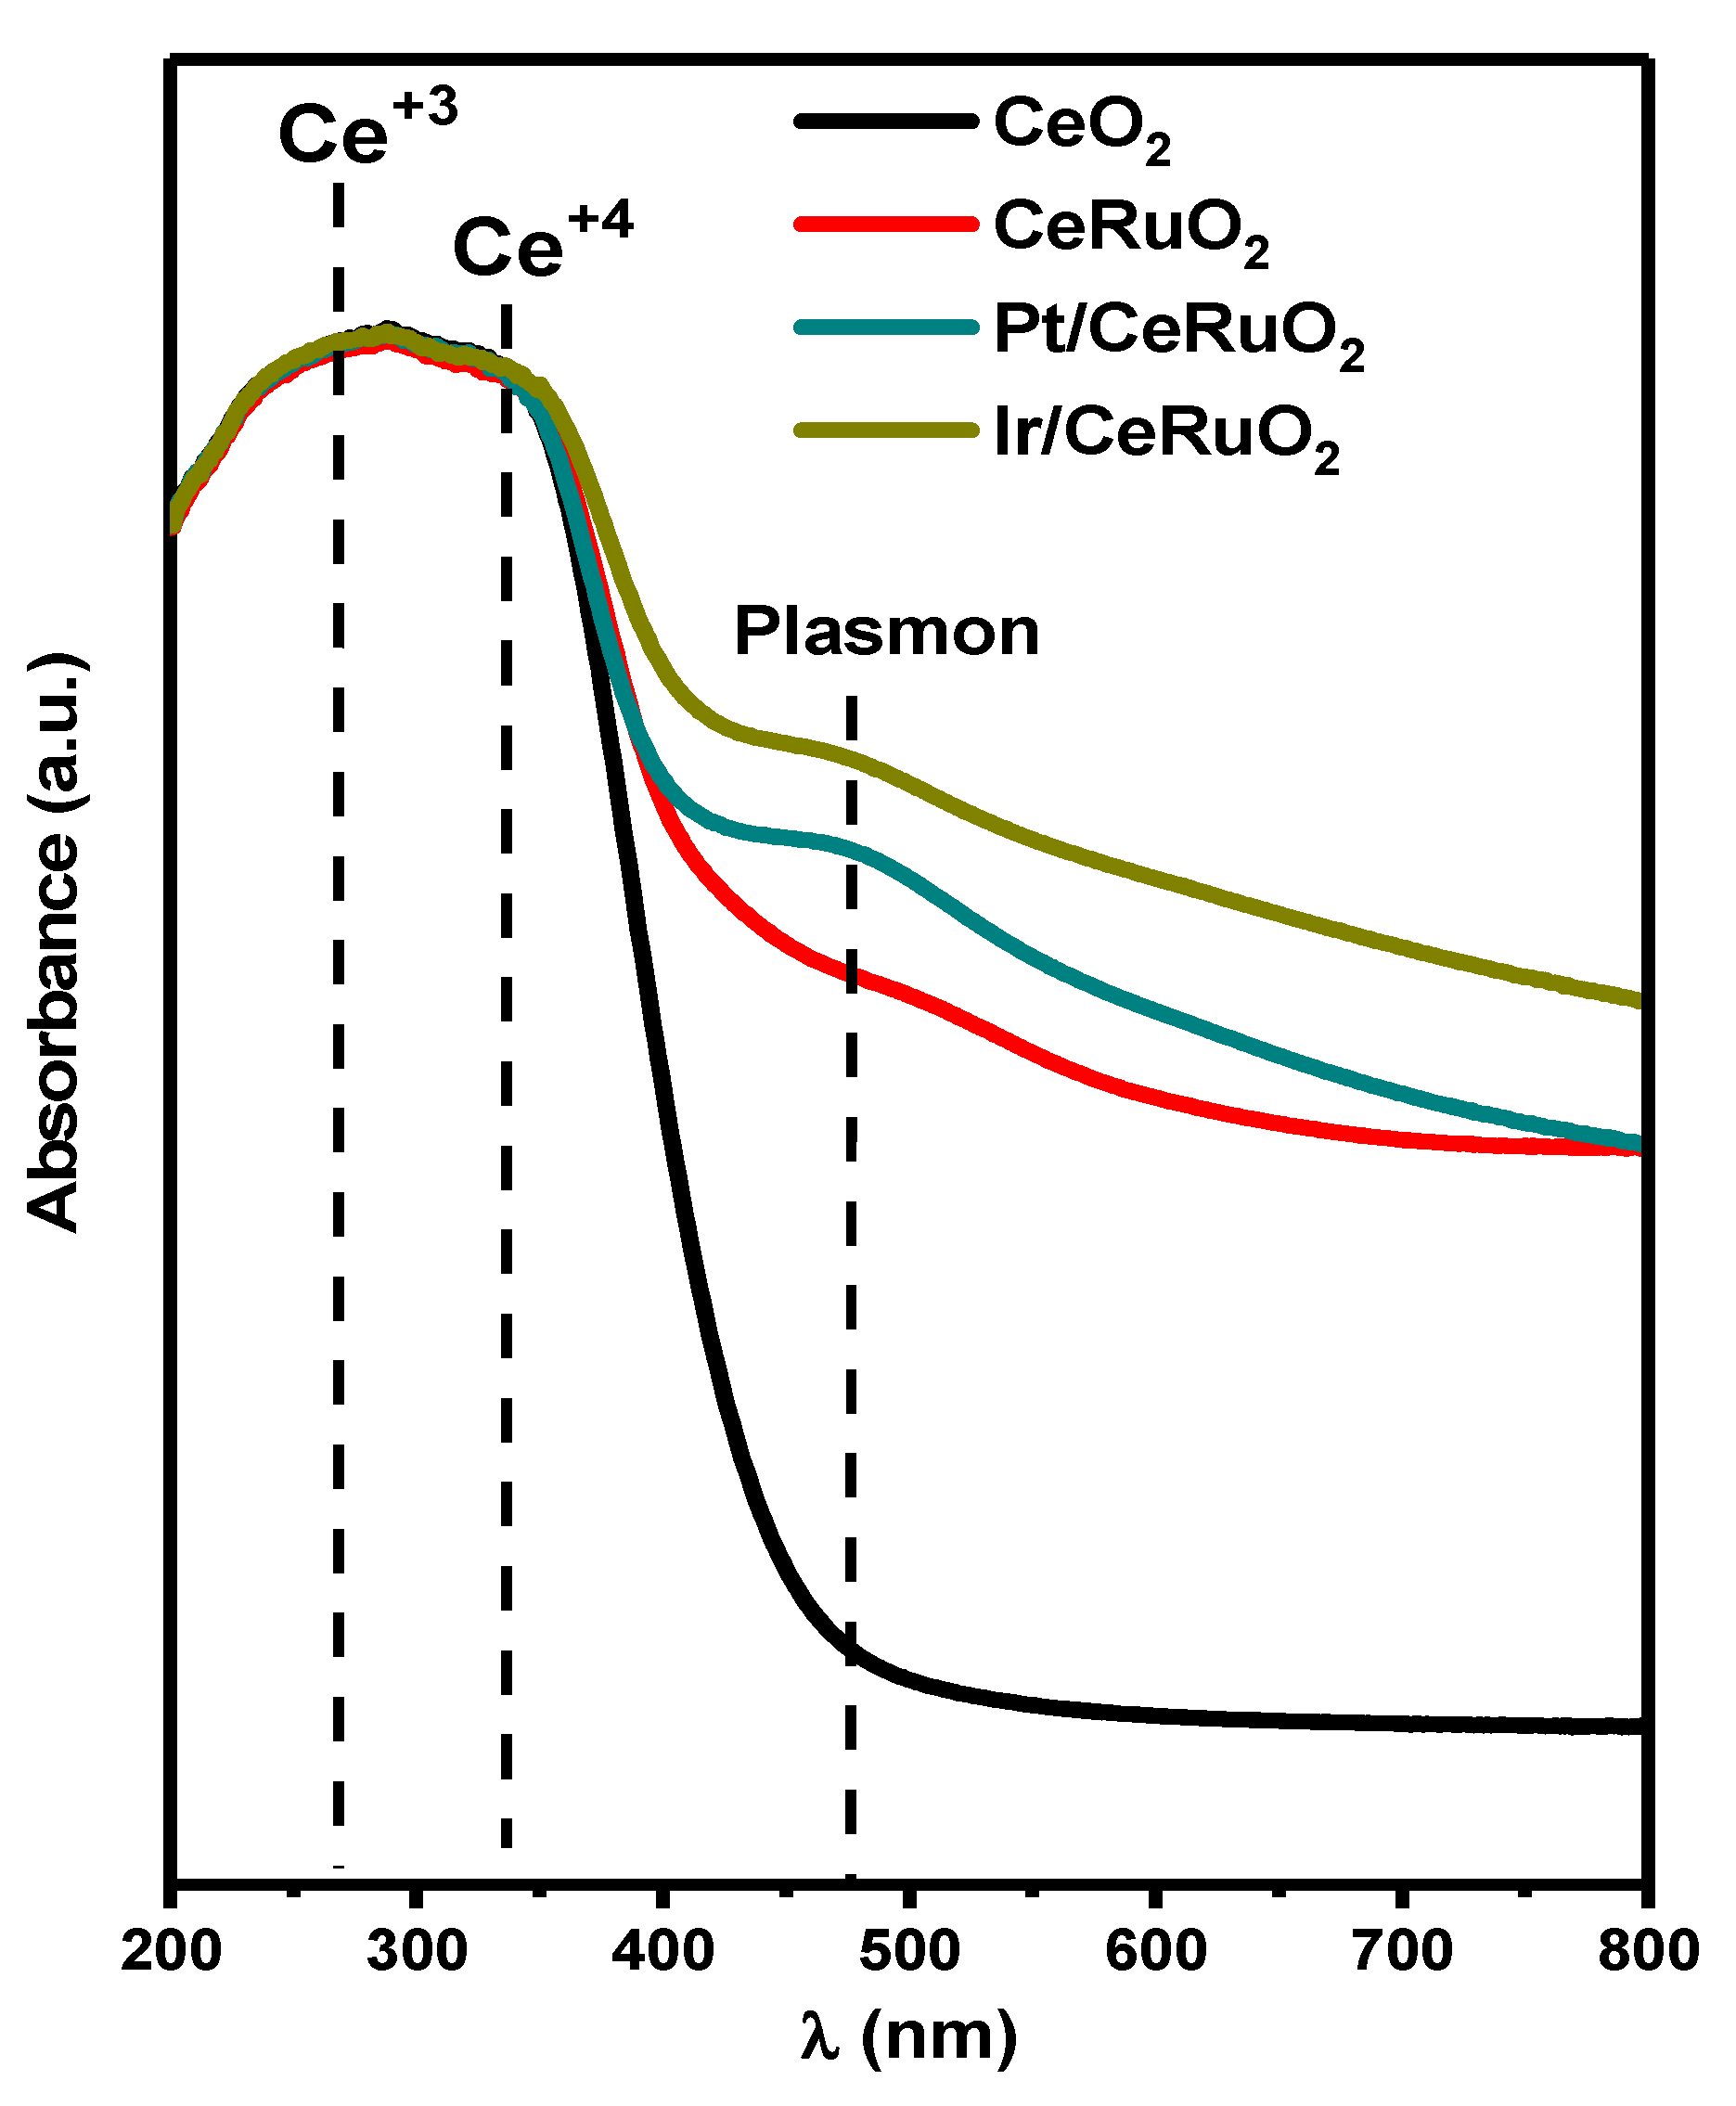
In Figure 10, the UV–Vis spectra of the samples are presented. The signals corresponding to Ce3+ and Ce4+ are located at 275 and 340 nm, respectively. As can be appreciated, the curves are quite different for every compound. The increase in the absorbance value is evident, following the order CeO2 > CeRuO2 > Ir/CeRuO2 > Pt/CeRuO2, which can be attributed to the presence of Ir or Pt nanoparticles at the surface’s catalysts In addition, a plasmon signal associated with ruthenium species appears at 480 nm.

3.6. Band-Gap Determination

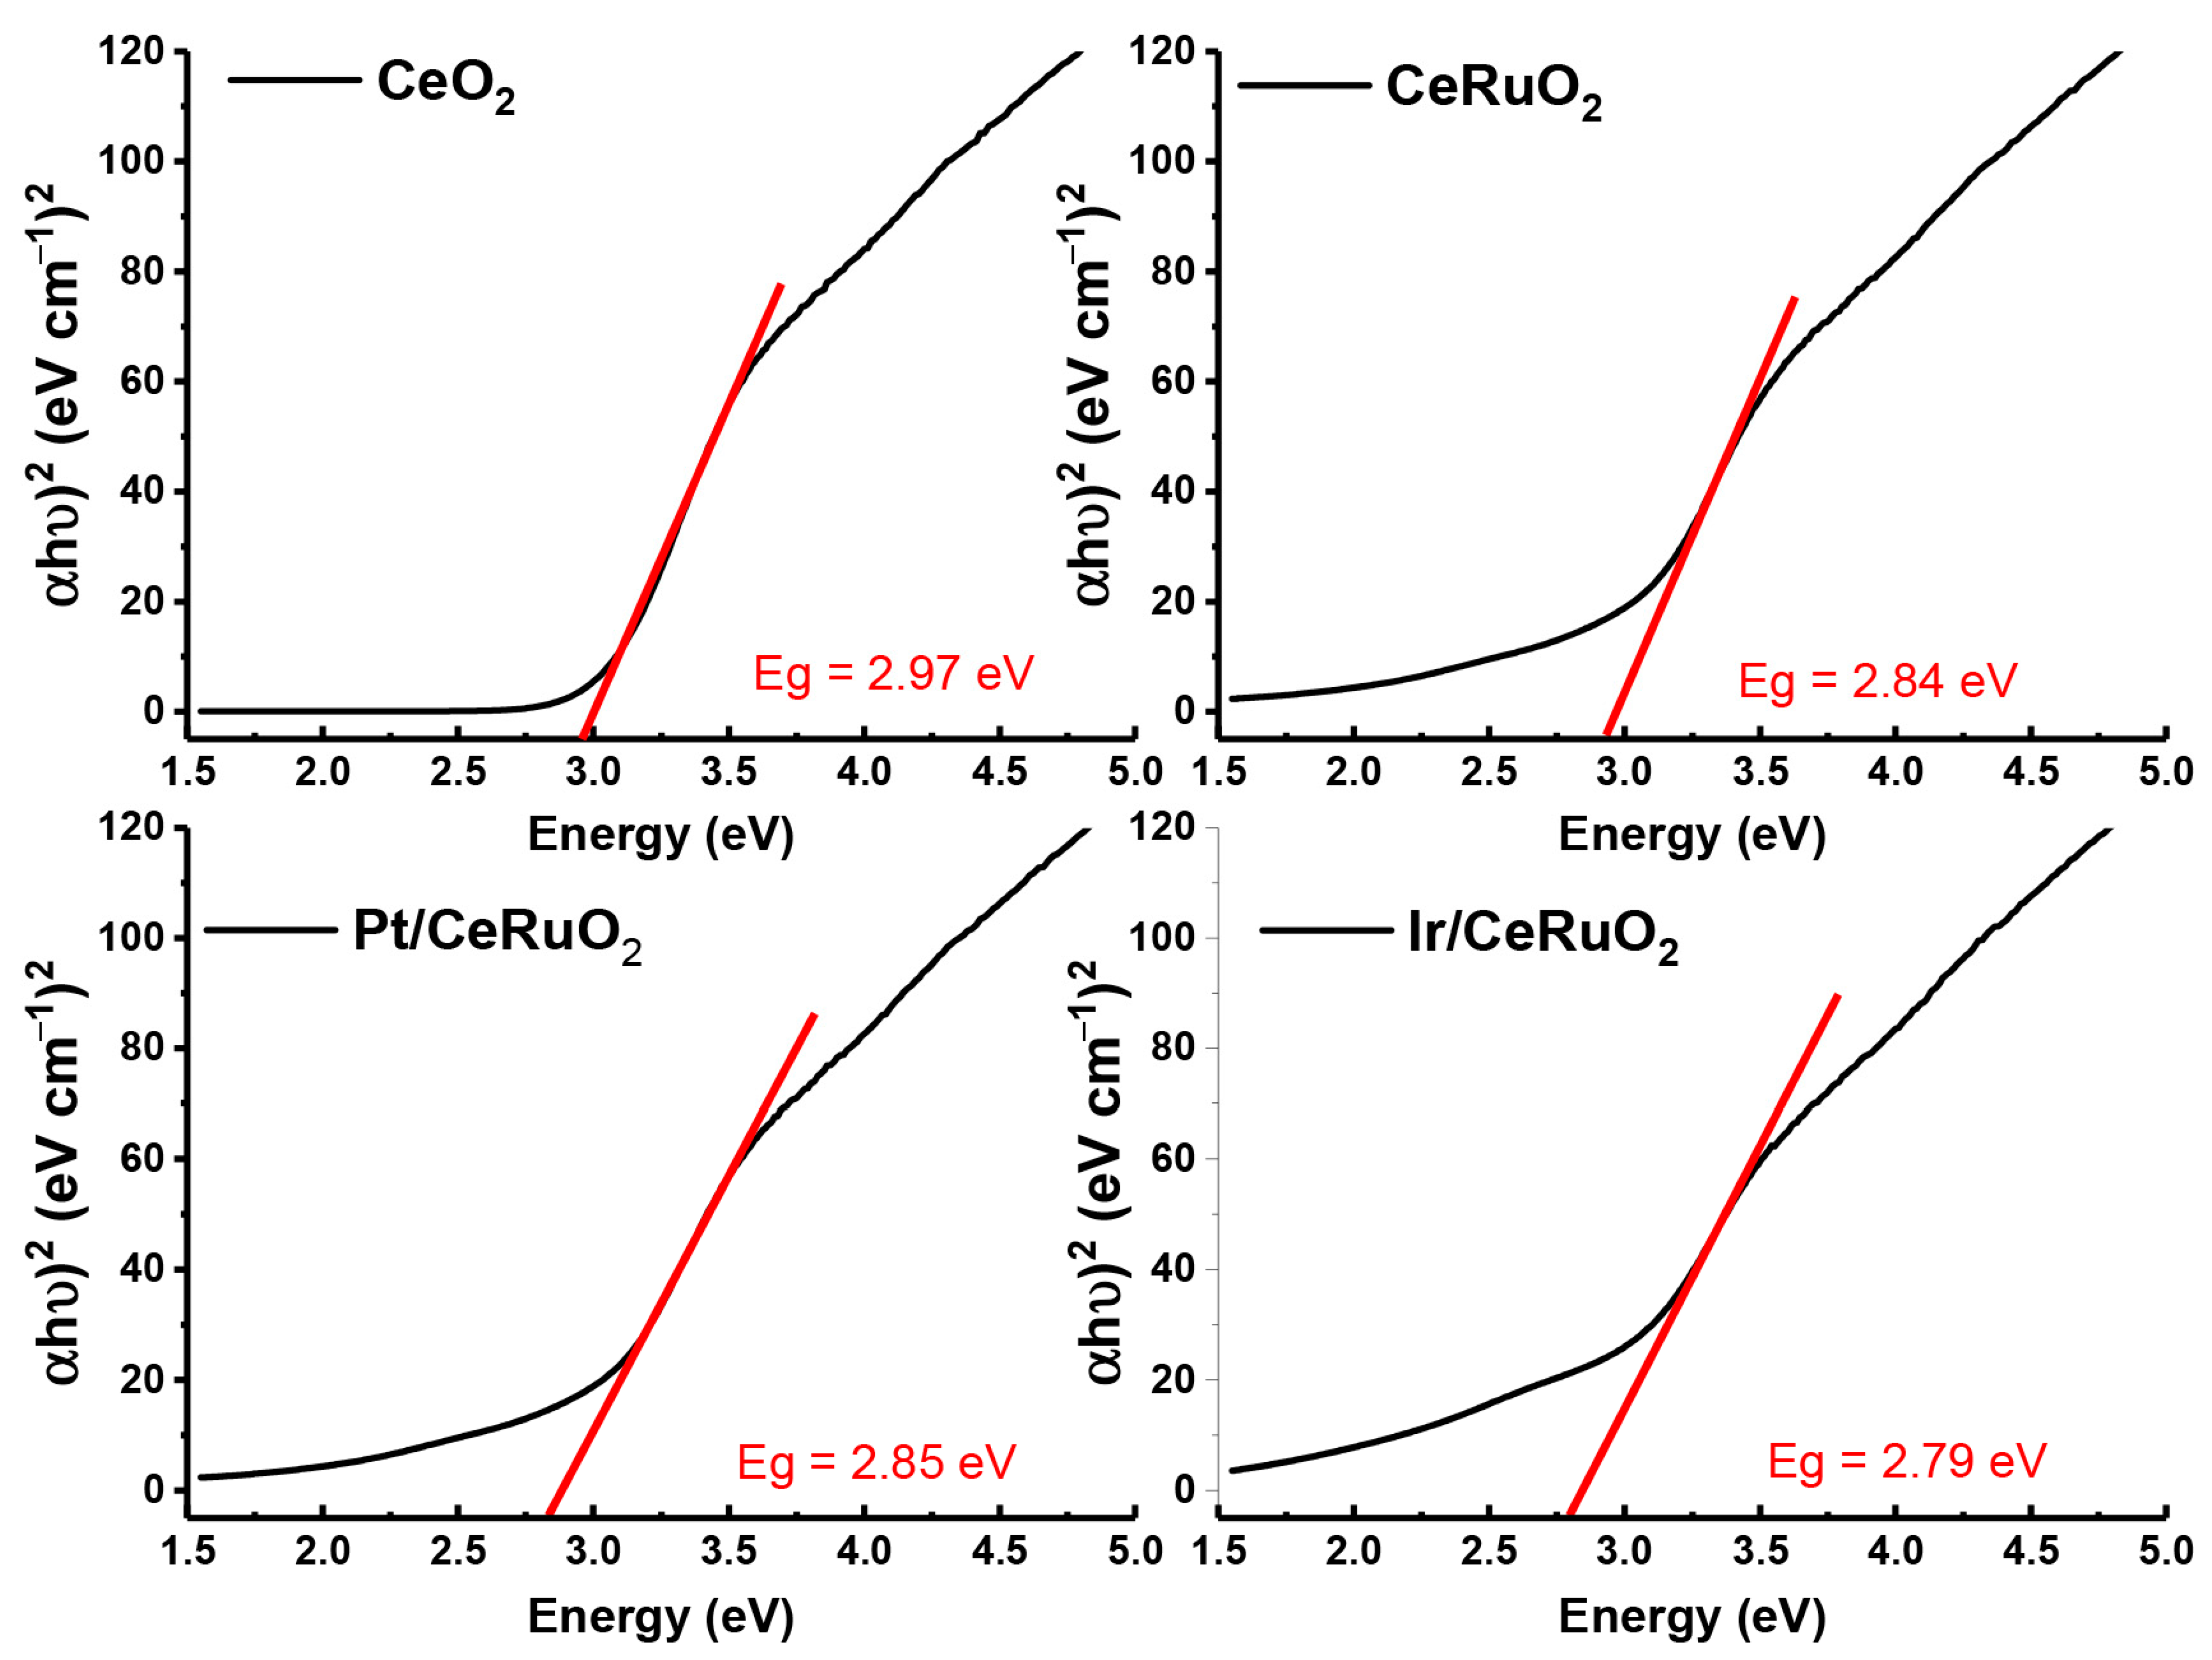
The energy gap values were determined from diffuse reflectance spectroscopy (DRS) UV–Vis measurements. The absorbance data were transformed into (αhν)2 vs. photon energy (hν) plots using the Tauc method, from which the band-gap (Eg) values were obtained and are summarized in Figure 11. The CeO2 compound showed an energy gap value of 2.97 eV. The energy gap values followed the order CeRuO2 (2.84 eV) < Pt/CeRuO2 (2.85 eV) < Ir/CeRuO2 (2.90 eV). Those values mainly reflect the positive effect of the CeRuO2 mixed oxide catalytic support.

3.7. FTIR In Situ Studies for the CO Oxidation Reaction

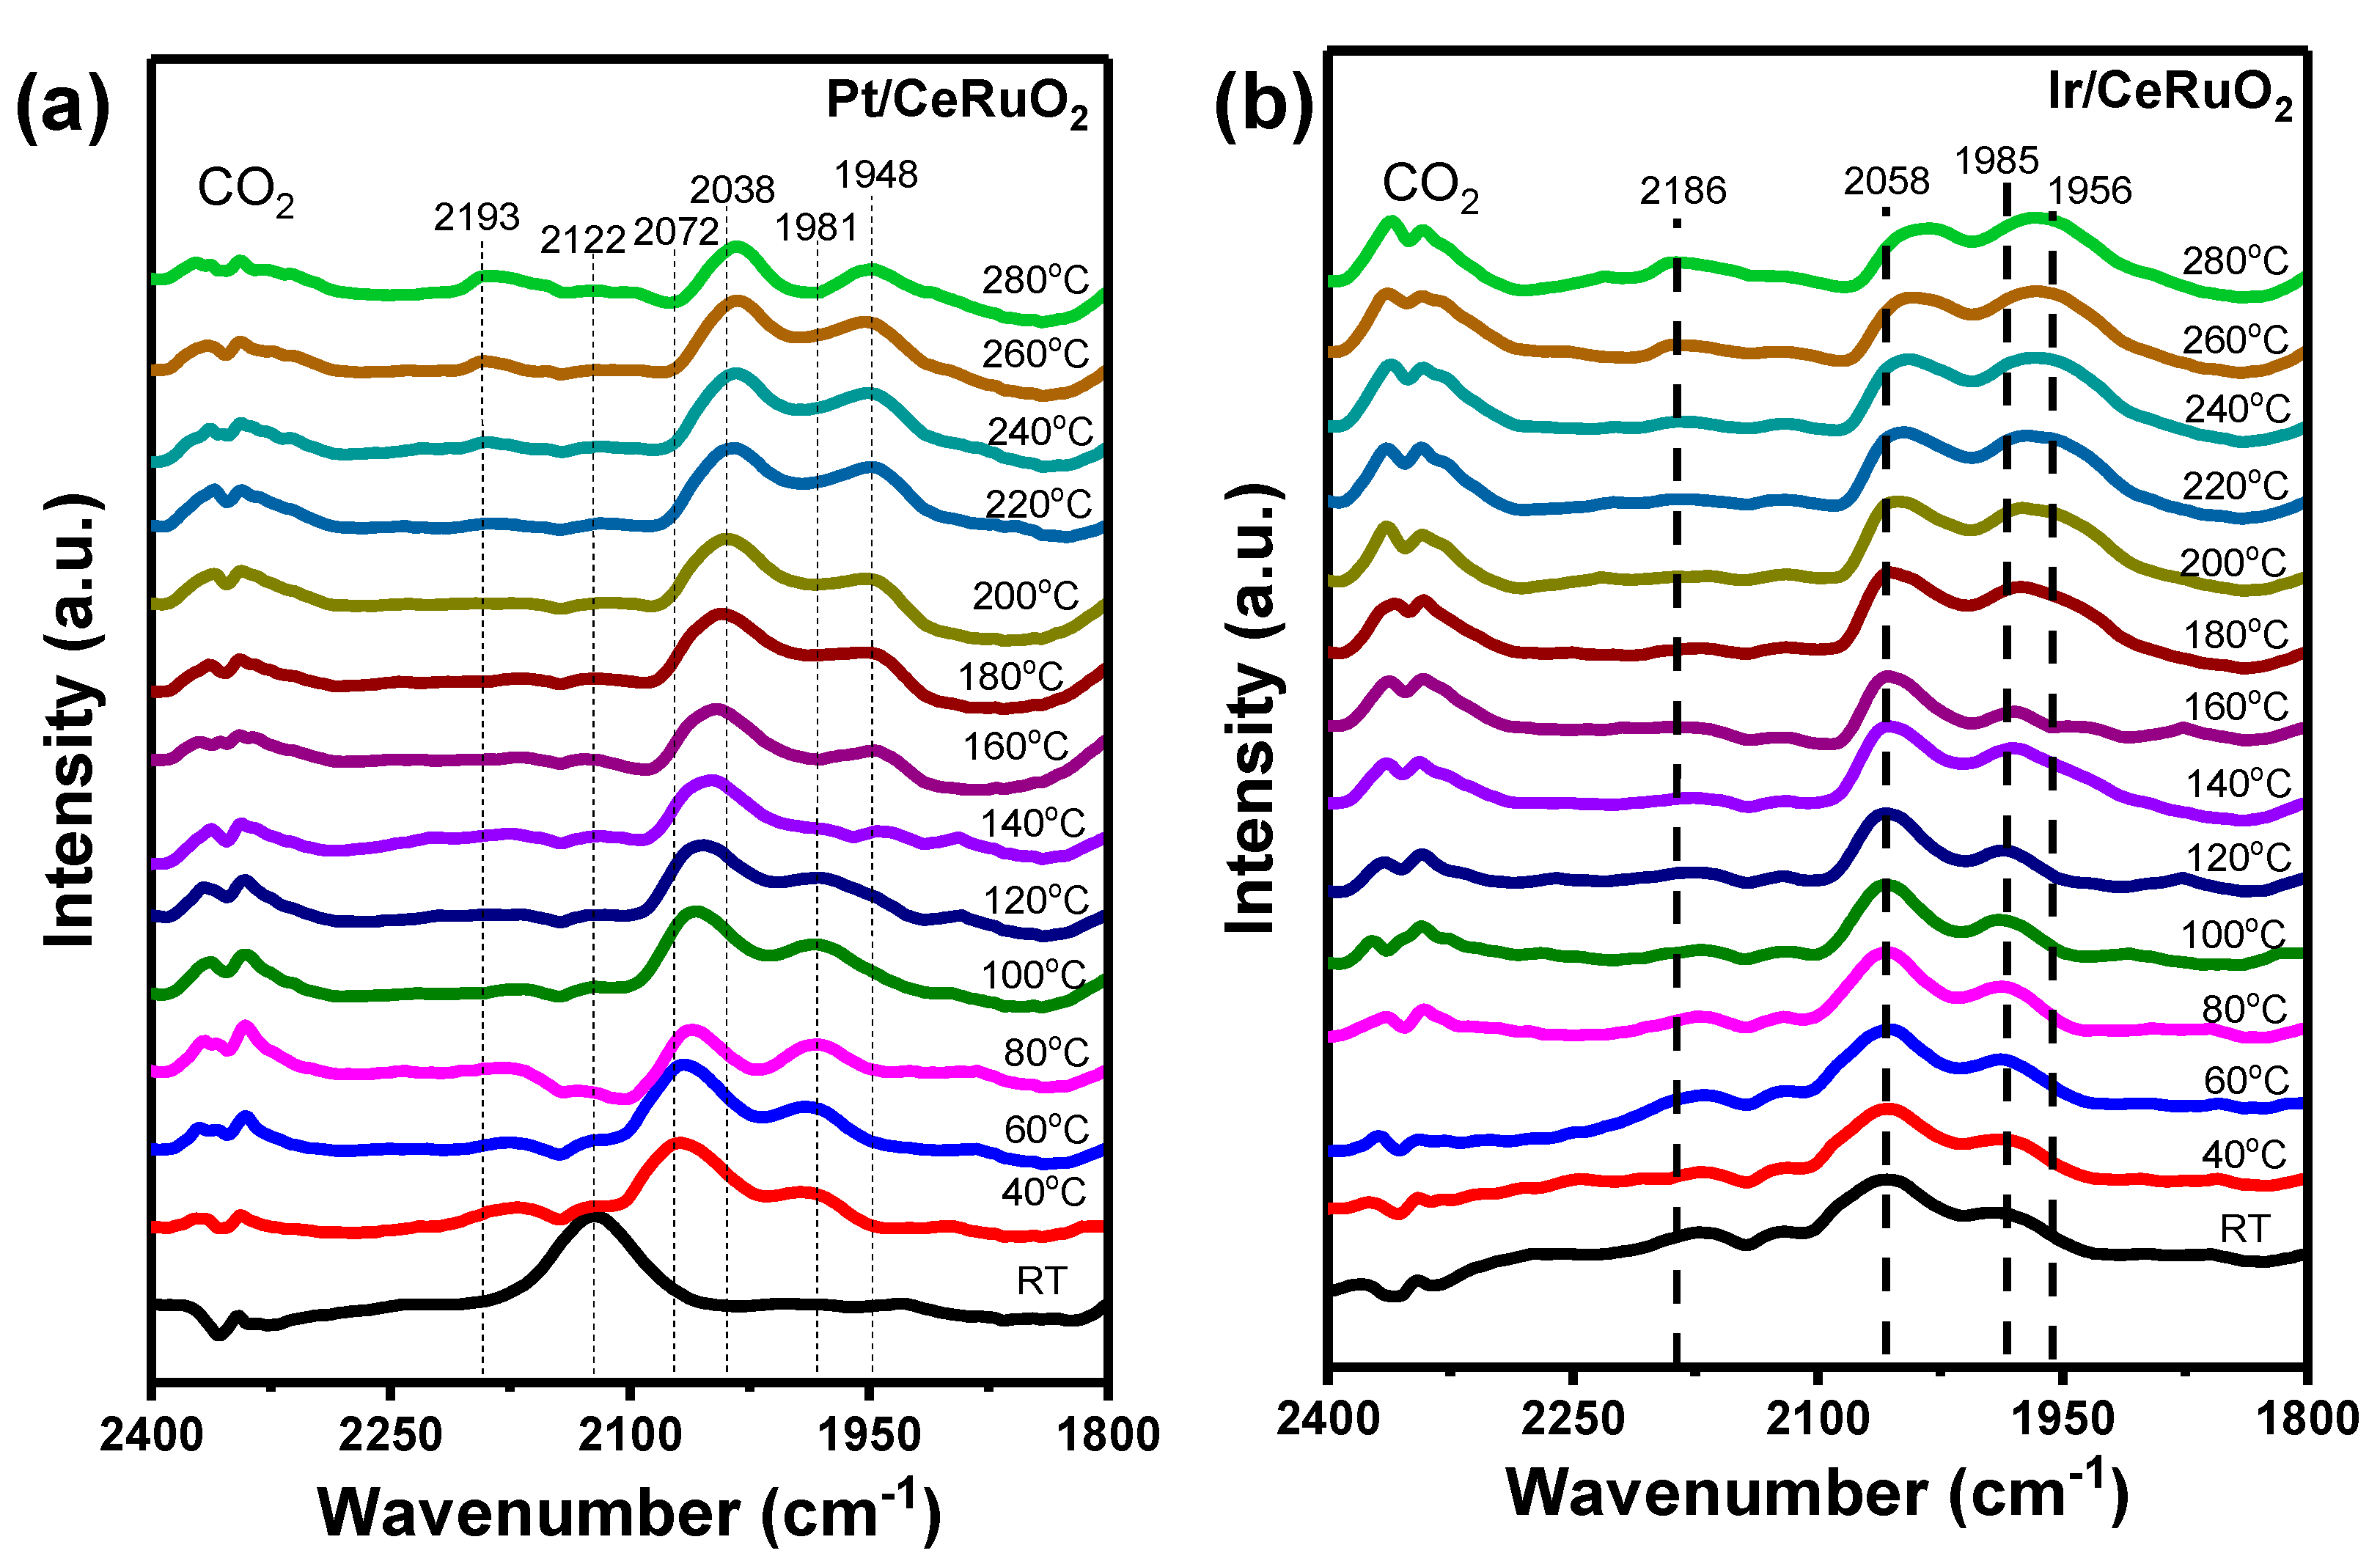
The results of the FTIR spectra for the Pt/CeRuO2, Ir/CeRuO2 catalysts are summarized in Figure 12. In Figure 12a,b, signals located at 2360 and 2341 cm−1 are ascribed to CO2, while the peaks sited among 2193–2186 and 2120–2122 cm−1 are related to CO linearly linked to Lewis’s acids sites of CeO2, Ce4+, and Ce3+, respectively. On both images, at room temperature, the Ce3+-CO signal is more intense than that of Ce4+. This effect is attributed to the presence of Ru species promoting the reduction at low temperature.
Regarding the Pt/CeRuO2 catalyst, following the passing of the reaction gas mixture through the chamber at room temperature, signals corresponding to 2183, 2122, 2072, and 1981 cm−1 were detected. When temperature values above 180 °C were reached, a new band appeared at 2186 cm−1, which could be related to asymmetric vibrations of Ir+-(CO)2 di-carbonyl species [21]. This absorption band gradually increased above 180 °C, reaching its highest intensity at 280 °C. The in situ FTIR spectrum for the supported Ir catalysts is shown in Figure 12b. Basically, this compound follows a similar trend to that previously described for the Pt supported catalyst; however, the values where the signals appear are slightly shifted due to the Pt/CeRuO2 surface charge interaction. Thus, the incorporation of Pt and Ir metals improved gas absorption on the Ce0RuO2 support and, consequently, its activity. The evidence of CO2 production is evident for both compounds as temperature values as low as 60 °C. Furthermore, the addition of the metal increased the number of oxygen vacancies, which are the preferential sites to carry out the catalytic oxidation.

4. CO Oxidation Tests

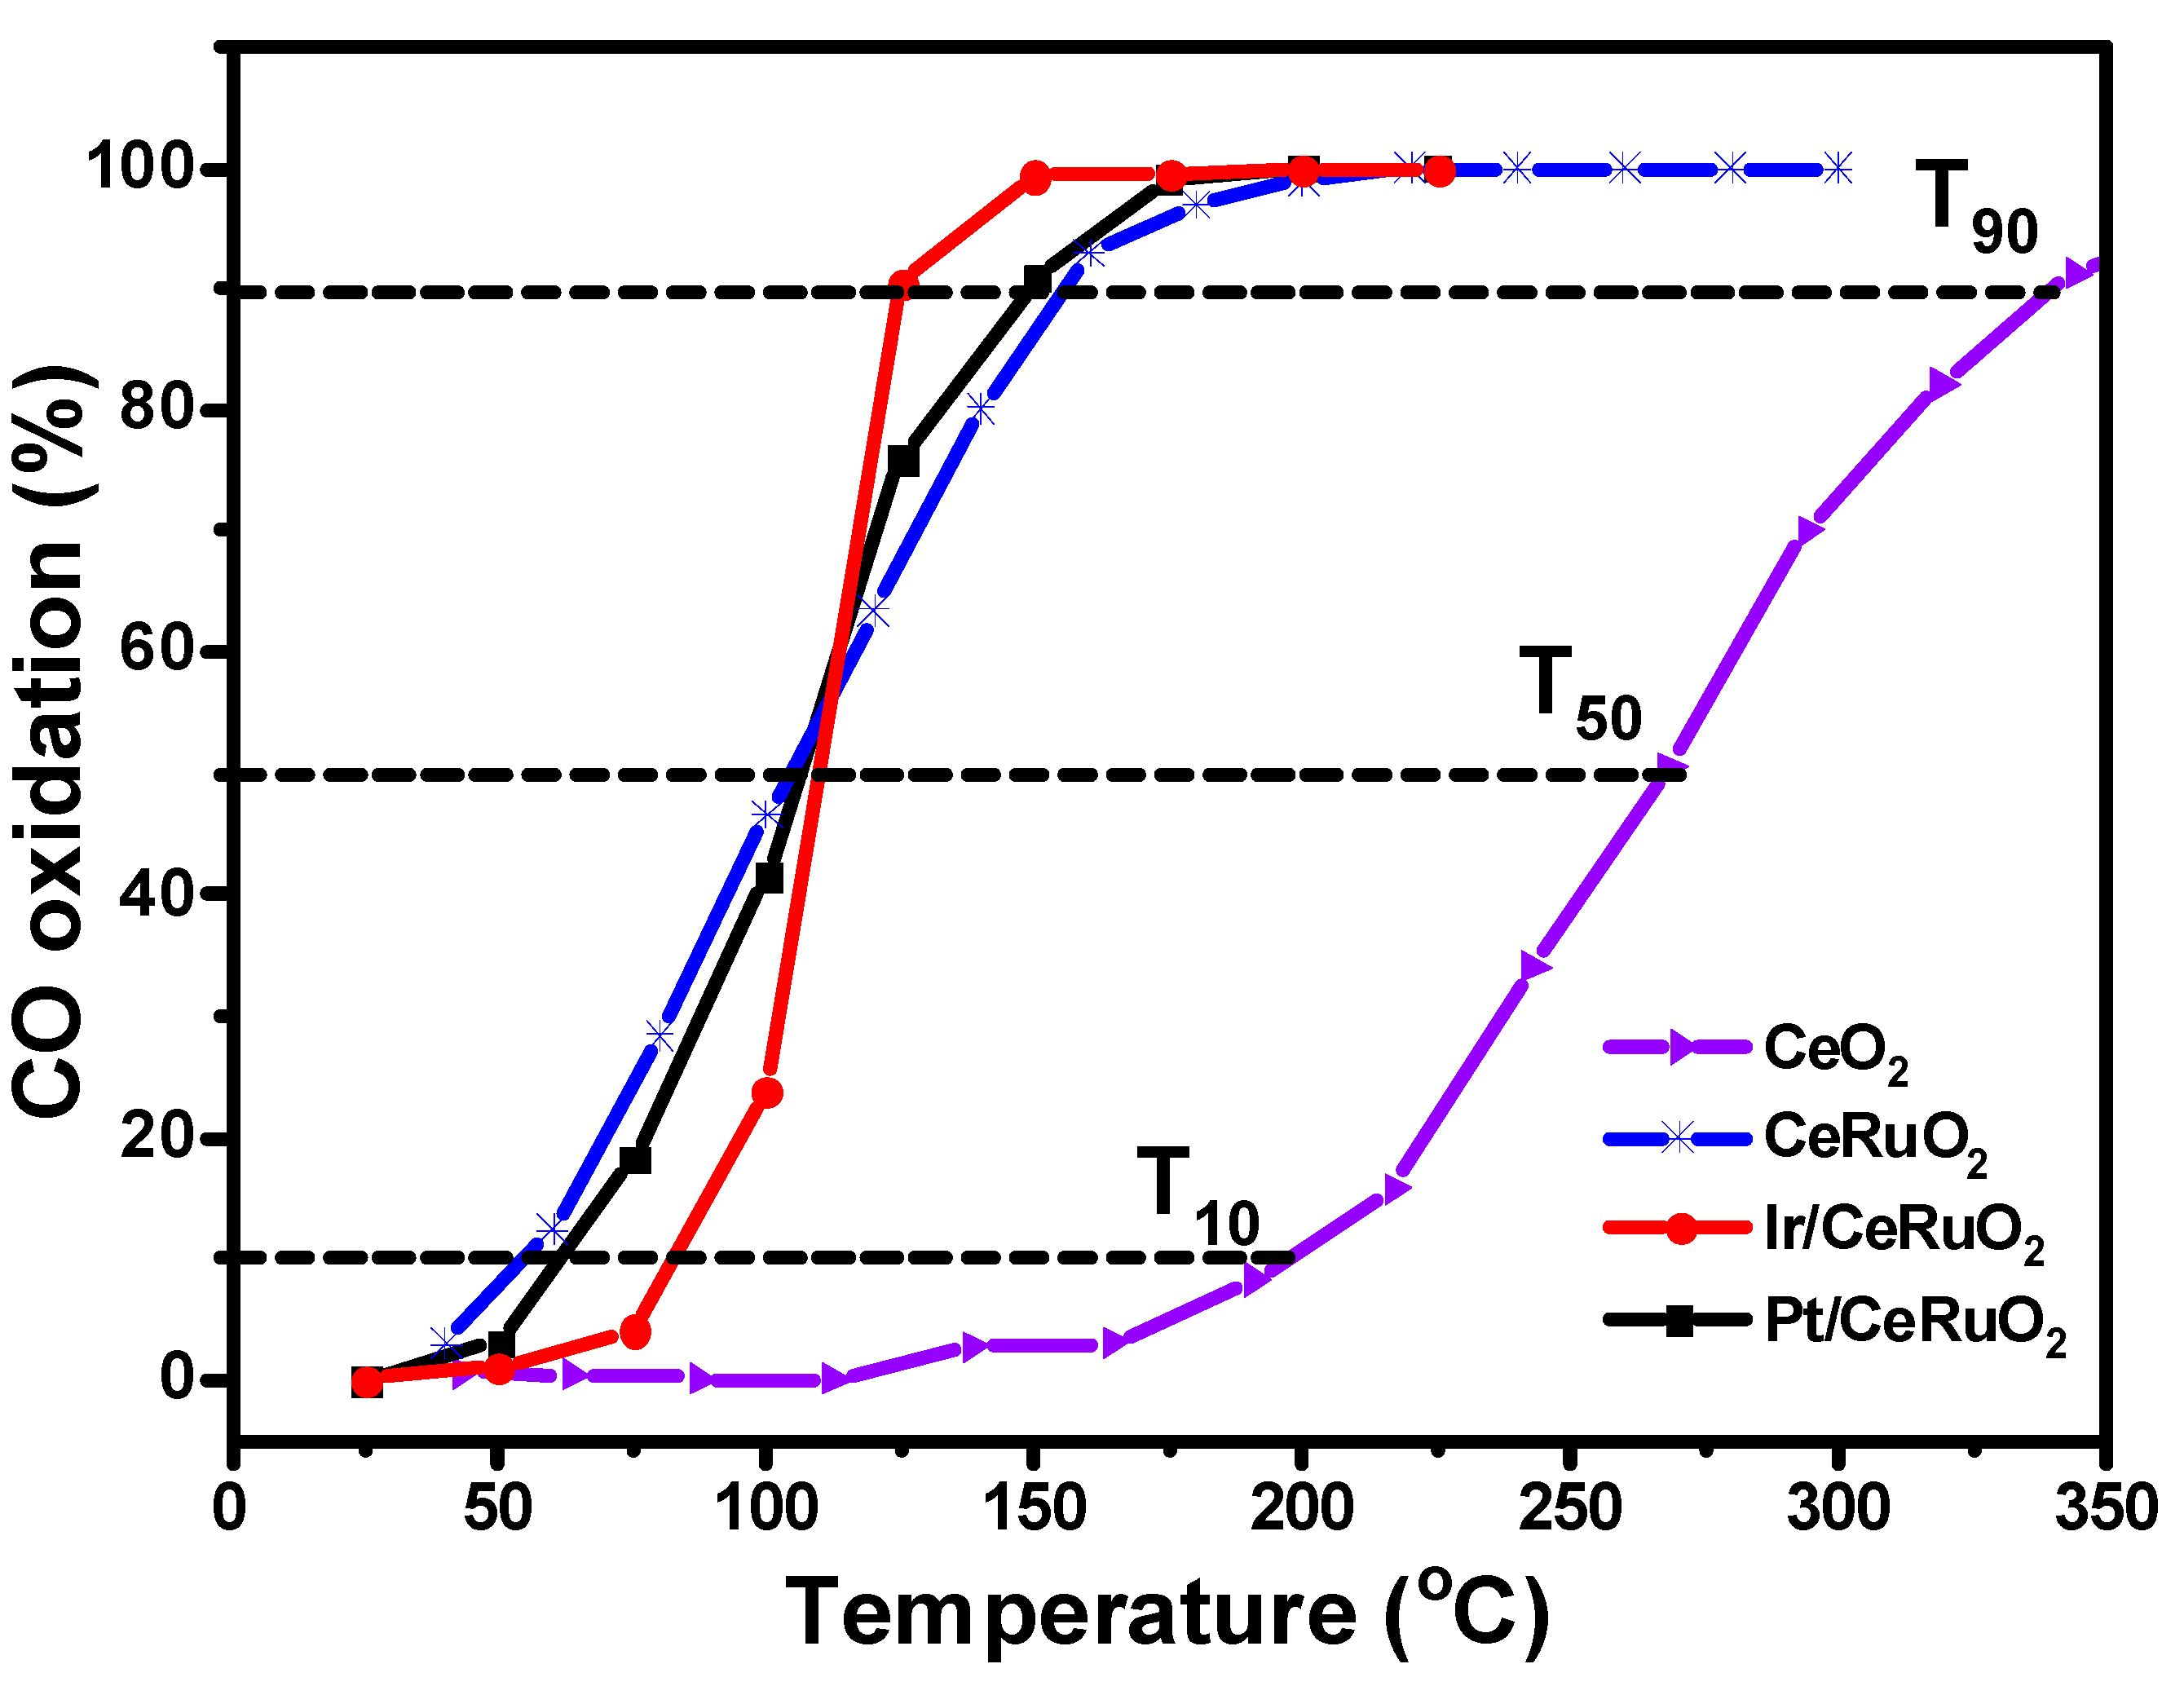
The CO oxidation tests were carried out on the catalysts and the support, where CeO2 is the reference material, and the results were condensed into a single graphic image, Figure 13. The reaction reveals that CeO2 was activated around 175 °C, reaching 90% of conversion at a temperature of 350 °C. This result has been observed and attributed to delayed mobility of lattice oxygen, which appears to be activated after 225 °C. Quite differently, the CeRuO2 support shows a prominent behavior demonstrating that ruthenium inclusion in CeO2 as doping element provides a synergistic promoting effect for CO oxidation. As can be seen, this active support achieves 50% of CO conversion at about 100 °C. On the other hand, the Pt/CeRuO2 catalyst described a similar behavior, being activated near to 60 °C, attaining 100% of CO conversion close to 150 °C, holding that value beyond 350 °C. Regarding the Ir/CeRuO2 system, it started the CO oxidation at 75 °C, followed by a steep rise in a short temperature interval of 100–110 °C, showing a dramatic change from 25 up to 90% of CO conversion, to finally reach 100% of CO conversion at 125 °C. That means there is an outstanding increase in conversion, where this behavior is attributed to the increase in surface absorption sites, mainly vacant sites where O2 has been adsorbed, to subsequently dissociate. Simultaneously, the decrease in activation temperature is promoted by the presence of ruthenium species.

5. Discussion

We establish a comparison with previously reported works on CeO2 doped catalysts for CO oxidation which are condensed in Table 3; for instance, the preparation of a series of CeyIn1−yOx compounds, where the indium content was varied has been reported. The results attained reveal that small amounts of indium doping provides lower activation temperature, reaching 100% of CO conversion from 110 to 125 °C [24]. Also, CeO2 doped cobalt has been tested as a catalyst for CO oxidation, showing similar results, reaching 100% of CO conversion at a temperature of 125 °C [25]. Recently, the preparation of transition metal-embellished cerium oxide (M-Ce-Ox) mesoporous alloys, using Co, Ni, Co, and Fe has been reported. Those catalysts were prepared by means of a micro drop-confined method. This method attempts to promote defects creation and oxygen availability. Their results indicate that catalytic activity is improved in comparison to pristine CeO2 in the order Cu > Ni > Co > Fe, reaching 100% of CO conversion at about 110 °C [26]. Y. Shen et al. [27] reported the preparation of Pt/CeO2 catalysts which were modulated in their reactivity through the addition of HNO3 to produce Pt (N)/CeO2 (N) catalysts. The HNO3 was added during support treatment and/or Pt impregnation. Their results indicate that nitric acid weakened the Pt-CeO2 interaction and facilitates the removal of lattice oxygen from Pt-O-Ce bonds under reaction conditions, generating active P t 0 ,   P t 1 species, showing superior Pt dispersion. Their results allowed obtaining 100% of CO conversion at a temperature of 175 °C. In comparison, our results are close to those obtained from these authors; however, we consider it important to emphasize that particularly, ruthenium addition to CeO2 provides substantial defects creation, which, in turn, enhances the oxygen mobility and long-term stability.

Activation Energy Determination

The activation energy, E A , for the different catalysts was determined at the start of every reaction. To perform the calculation, the Arrhenius equation was used:
ln r A = ln A E A R 1 T  
where rA: reaction velocity, A: is the frequency factor, EA: is the activation energy, R: de Rydberg constant of gases, and T is the temperature value, expressed in K degrees. This calculation is valid only for a packed reactor behavior, considering that the gas concentration is the same on the catalyst. It can be used when the conversion from CO to CO2 is relatively low, under 20%. In Table 4, the results are summarized relative to those calculations.
As can be seen, the energy value for the CeO2 compound, EA = 9209.212 J/mol, is the largest compared to the other compounds. In contrast, the smaller value was found for the CeRuO2 mixed oxide (EA = 1366.305 J/mol), confirming the inherent activity of the catalytic support. The Pt/CeRuO2 catalyst with EA = 1963.678 J/mol exhibited the lowest activation energy among the metal-supported systems, followed by the Ir/CeRuO2 compound. At the same time, we should notice that the specific surface area values followed the order CeRuO2 > Pt/CeRuO2 > Ir/CeRuO2 > CeO2 even though we consider that the area values are not the most important factor to achieve high conversion rates for the present study.

6. Conclusions

In accordance with the objectives initially set, Pt/Ce1−xRuxO2 and Ir/Ce1−xRuxO2 catalysts were successfully synthesized and tested in the CO oxidation reaction. Comparatively, Pt/CeRuO2, Ir/CeRuO2 catalysts, and even the CeRuO2, exhibited higher activity in comparison to CeO2. It is worth it to express that CeRuO2 is an active support by itself. However, it performs best when Pt or Ir are dispersed on its surface. When comparing all the systems, the Ir-supported catalyst achieved 90% and 100% CO conversion at lower temperature. On the other hand, the calculated energy activation, under 20% conversion, revealed that Pt/CeRuO2 (−1963.678 J/mol) owns the lower energy activation, followed by the Ir/CeRuO2 catalyst (−4386.761 J/mol). However, surprisingly, this catalytic system showed an astonishing behavior with a higher slope in reference to the temperature value, revealing 100% CO conversion at a temperature of about 120 °C. Conclusively, it must be expressed that both Pt and Ir catalysts were synergistically working with the CeRuO2 active support, reaching 100% CO conversion at relatively low temperatures. In our view, the Ir/CeRuO2 catalyst deserves a deeper study for better understanding of this system.

Author Contributions

Conceptualization, R.R. and E.E.G.-A.; methodology, R.R., E.E.G.-A. and A.R.-C. (Armando Ramos-Corona); formal analysis, R.R., E.E.G.-A. and A.R.-C. (Antonio Ramos-Carrazco); investigation, R.R. and E.E.G.-A.; writing—original draft preparation, R.R., E.E.G.-A. and A.R.-C. (Armando Ramos-Corona); writing—review and editing, R.R., E.E.G.-A., J.E., J.L.-R., A.R.-C. (Antonio Ramos-Carrazco), J.J.A.-G. and D.B.-M.; supervision, R.R. All authors have read and agreed to the published version of the manuscript.

Funding

The present work was partially founded by CIC-UMSNH under project 2026.

Data Availability Statement

The original contributions presented in this study are included in the article. Further inquiries can be directed to the corresponding author.

Acknowledgments

R.R. acknowledges CIC-UMSNH under project 2026. The authors acknowledge Laboratorio Nacional de Nano y Biomateriales del Departamento de Física Aplicada (LAN-BIO), Cinvestav-IPN-Unidad Mérida. Daniel Aguilar Treviño for obtaining the diffractograms and Mario Herrera Salvador, J. Bante-Guerra for their help in instrumentation and data acquisition; and W. Cauich for his technical assistance in XPS and SEM analyses. A.R.C. appreciates the scholarship awarded by CONAHCyT from Estancias Posdoctorales por México funding. Authors also thank Marilyn Velasco G. for their help in editing several images.

Conflicts of Interest

The authors declare that they have no conflicts of interest in the development and publication of the results presented in this work.

References

  1. Vinoth Kanna, I.; Roseline, S.; Balamurugan, K.; Jeeva, S.; Santhiyagu, I.A. The Effects of Greenhouse Gas Emissions on Global Warming. Encycl. Renew. Energy Sustain. Environ. 2024, 1, 143–154. [Google Scholar] [CrossRef]
  2. Duggan, S. Carbon monoxide exposure inside UK road vehicles: A pilot study. Environ. Int. 2024, 194, 109070. [Google Scholar] [CrossRef]
  3. Yildiz, M.; Henry, T.D. Silent Threats: The Cardiac and Thrombotic Consequences of Carbon Monoxide Poisoning. JACC Case Rep. 2025, 30, 103327. [Google Scholar] [CrossRef]
  4. Roy, D.; McGowan, D.J.; Chilton, R.; Kulshrestha, P. Accidental Carbon Monoxide Poisoning Leading to Devastating Cardiovascular Consequences. JACC Case Rep. 2025, 30, 103320. [Google Scholar] [CrossRef]
  5. Bhardwaj, K.; Kumara, D.; Saji, V.S.; Singhc, V.; Lee, Y.; Lee, S.; Janas, D.; Mishra, Y.K.; Sharma, S.K. Carbon monoxide detection, separation, and conversion into valuable products via smart nanomaterials: Challenges and perspectives. Mater. Today 2025, 83, 1369–7021. [Google Scholar] [CrossRef]
  6. Park, S.; Grigioni, I.; Alkayyali, T.; Lee, B.-H.; Kim, J.; Shirzadi, E.; Dorakhan, R.; Lee, G.; Abed, J.; Bossola, F.; et al. High carbon efficiency in CO to alcohol electroreduction using a CO reservoir. Joule 2023, 7, 2335–2348. [Google Scholar] [CrossRef]
  7. He, Y.; Mao, D.; Guo, Q.; Yu, J. Ru/CeO2 catalyst derived from Ce-based MOF for highly efficient catalytic CO2 methanation integrated with renewable hydrogen. Fuel Process. Technol. 2024, 259, 108101. [Google Scholar] [CrossRef]
  8. Alli, Y.A.; Oladoye, P.O.; Ejeromedoghene, O.; Bankole, O.M.; Alimi, O.A.; Omotola, E.O.; Olanrewaju, C.A.; Philippota, K.; Adeleye, A.S.; Ogunlaja, A.S. Nanomaterials as catalysts for CO2 transformation into value-added products: A review. Sci. Total Environ. 2023, 868, 161547. [Google Scholar] [CrossRef] [PubMed]
  9. Xu, Z.; Zheng, X.; Ji, B.; Bao, S.; Mei, J.; Yang, Z.; Rong, J.; Li, Z. Development of cerium-doped porous composite aerogel using cellulose nanocrystals for enhanced CO2 capture and conversion. J. Colloid Interface Sci. 2025, 683, 322–334. [Google Scholar] [CrossRef] [PubMed]
  10. Zhang, J.; Shu, M.; Niu, Y.; Yi, L.; Yi, H.; Zhou, Y.; Zhao, S.; Tang, X.; Gao, F. Advances in CO catalytic oxidation on typical noble metal catalysts: Mechanism, performance and optimization. Chem. Eng. J. 2024, 495, 153523. [Google Scholar] [CrossRef]
  11. Wang, S.; Li, X.; Lai, C.; Zhang, Y.; Lin, X.; Ding, S. Recent advances in noble metal-based catalysts for CO oxidation. RSC Adv. 2024, 14, 30566–30581. [Google Scholar] [CrossRef]
  12. Ganduglia-Pirovano, M.V. The non-innocent role of cerium oxide in heterogeneous catalysis: A theoretical perspective. Catal. Today 2015, 253, 20–32. [Google Scholar] [CrossRef]
  13. Dey, S.; Dhal, G.C. Cerium catalysts applications in carbon monoxide oxidations. Mater. Sci. Energy Technol. 2020, 3, 6–24. [Google Scholar] [CrossRef]
  14. González-A, E.; Rangel, R.; Solis-Garcia, A.; Venezia, A.; Zepeda, T. FTIR investigation under reaction conditions during CO oxidation over Ru-doped CeO2 catalysts. Mol. Catal. 2020, 493, 111086. [Google Scholar] [CrossRef]
  15. González-A, E.; Rangel, R.; Lara, J.; Bartolo-Pérez, P.; Alvarado-Gil, J.J.; Galván, D.H.; García, R. Low-temperature CO oxidation over {CeO2/Bi2Mo1−xRuxO6}, {Au/Bi2Mo1−xRuxO6} catalysts. Catalysts 2019, 9, 947. [Google Scholar] [CrossRef]
  16. Voskanyan, A.A.; Tsui, C.-K.J.; Chan, K.-Y. Durable ruthenium oxide/ceria catalyst with ultra large mesopores for low-temperature CO oxidation. J. Catal. 2020, 382, 155–164. [Google Scholar] [CrossRef]
  17. Zheng, Q.; Farrauto, R.; Valsamakis, D.M. Part I: A Comparative Thermal Aging Study on the Regenerability of Rh/Al2O3 and Rh/CexOy-ZrO2 as Model Catalysts for Automotive Three-Way Catalysts. Catalysts 2015, 5, 1770–1796. [Google Scholar] [CrossRef]
  18. Zheng, Q.; Farrauto, R.; Valsamakis, D.M. Part II: Oxidative Thermal Aging of Pd/Al2O3 and Pd/CexOy-ZrO2 in Automotive Three-Way Catalysts: The Effects of Fuel Shutoff and Attempted Fuel Rich Regeneration. Catalysts 2015, 5, 1797–1814. [Google Scholar] [CrossRef]
  19. Li, J.; Xiong, J.; Cao, W.; Wei, Y. Research Progress of CeO2-Containing Catalysts in Catalytic Oxidation of CO. Carbon Hydrog. 2025, 27, 128–141. [Google Scholar] [CrossRef]
  20. Kurnatowska, M.; Mista, W.; Mazur, P.; Kepinski, L. Nanocrystalline Ce1−xRuxO2-Microstructure, stability and activity in CO and soot oxidation. Appl. Catal. B Environ. 2014, 148–149, 123–135. [Google Scholar] [CrossRef]
  21. Nagy, G.; Gál, T.; Srankó, D.F.; Sáfrán, G.; Maróti, B.; Sajó, I.E.; Schmidt, F.P.; Beck, A. Selective aerobic oxidation of benzyl alcohol on alumina supported Au-Ru and Au-Ir catalysts. J. Mol. Catal. 2020, 492, 110917. [Google Scholar] [CrossRef]
  22. Shinde, V.M.; Madras, G. Synthesis of nanosized Ce0.85M0.1Ru0.05O2−δ (M = Si, Fe) solid solution exhibiting high CO oxidation and water gas shift activity. Appl. Catal. B Environ. 2013, 138–139, 51–61. [Google Scholar] [CrossRef]
  23. Sani, N.A.; Haruna, A.; Salisu, A. An overview on Metal doped/Supported Ceria Catalysts: Synthesis, Characterization and Applications. J. Ultra Chem. JUC 2022, 18, 5–20. [Google Scholar] [CrossRef]
  24. Li, H.; Tian, F.-X.; Liu, Q.; Han, Y.-F.; Zhu, M. Promotional effect of indium on CuO–CeO2 catalysts for low-temperature CO oxidation. Catal. Sci. Technol. 2022, 12, 6590–6598. [Google Scholar] [CrossRef]
  25. Yang, L.; Zhou, S.; Ding, T.; Meng, M. Superior catalytic performance of non-stoichiometric solid solution Ce1−xCuxO2−d supported copper catalysts used for CO preferential oxidation. Fuel Process. Technol. 2014, 124, 155–164. [Google Scholar] [CrossRef]
  26. Sun, N.; Zhuge, B.; Li, L.; Xianga, L.; Su, W. Interface regulation of cerium oxide via transition metal (Fe, Co, Ni, Cu) for low-temperature CO oxidation. J. Alloys Compd. 2025, 1038, 182756. [Google Scholar] [CrossRef]
  27. Shen, Y.; Zhang, J.; Ning, K.; Nie, R.; Zhang, W.; Zhong, Q.; Wang, M.; Chen, J.; Zhang, Q. Modulating the Pt-CeO2 interface via nitric acid-mediated strategy toward active atomic Ptδ+ for CO oxidation. Appl. Surf. Sci. 2026, 731, 166435. [Google Scholar] [CrossRef]
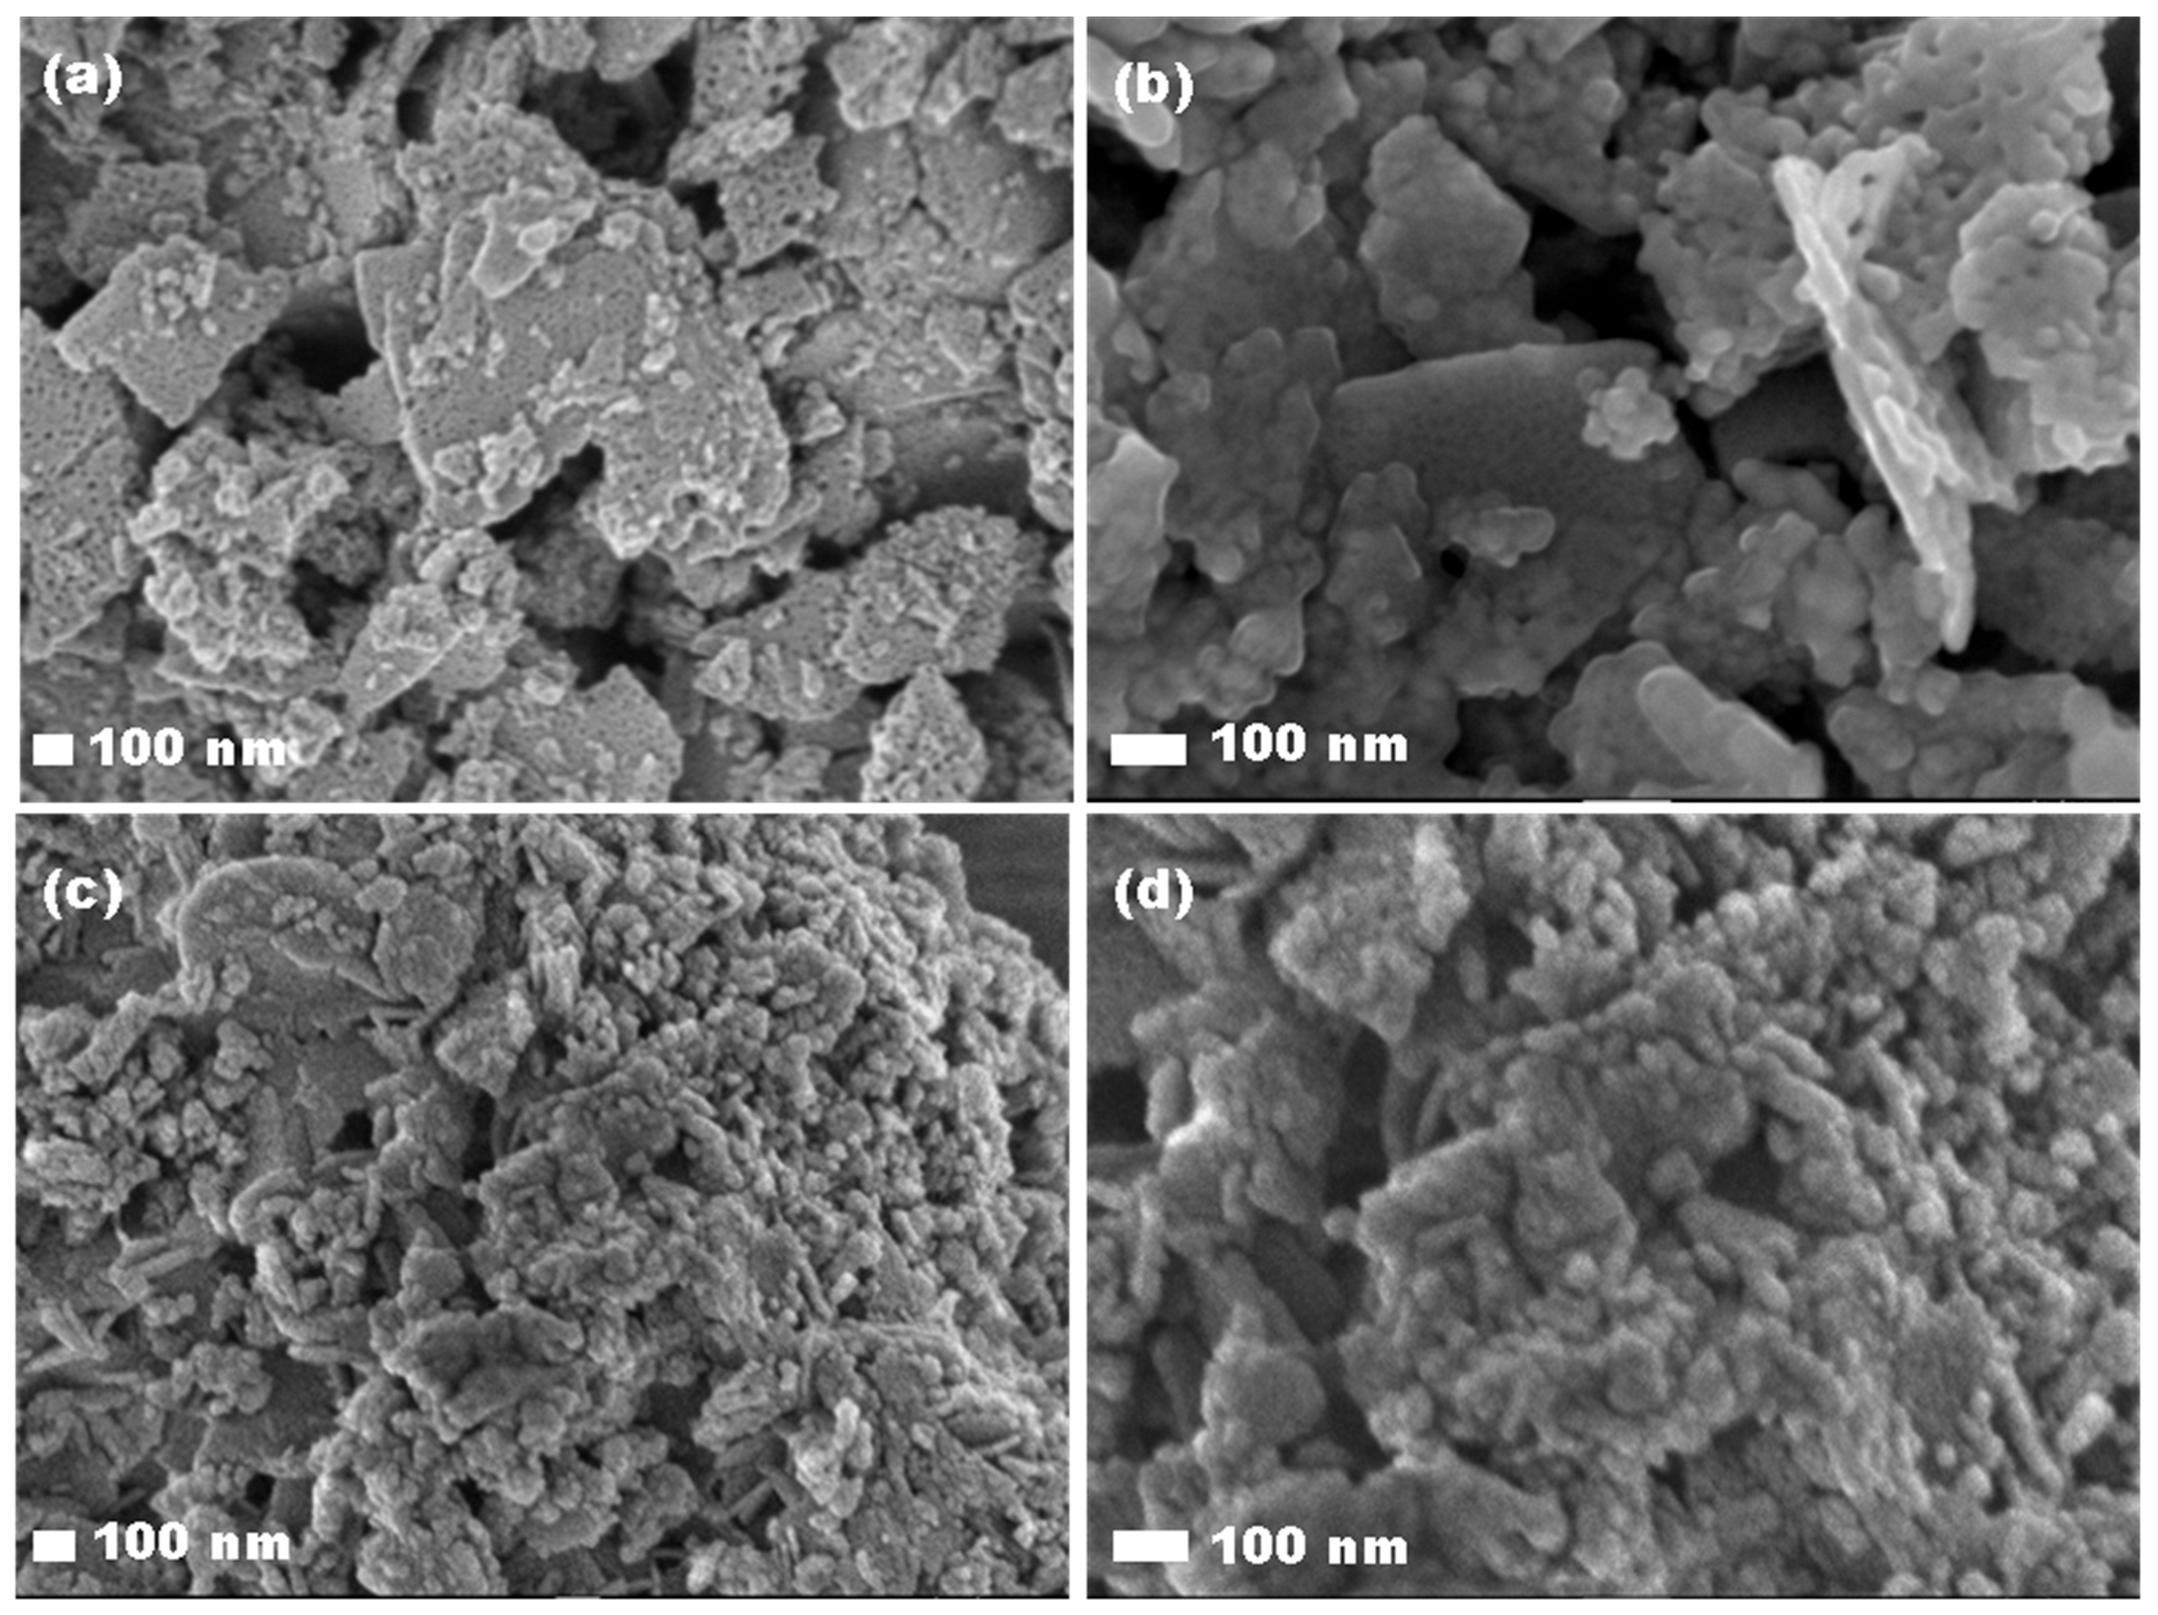
Figure 1. SEM micrographs of the compounds: (a) CeO2 at 50,000× magnification, (b) CeO2 at 100,000× magnification, (c) CeRuO2 at 50,000× magnification, and (d) CeRuO2 at 100,000× magnification.
Powders 05 00013 g001
Figure 2. SEM micrographs of the compounds: (a) Pt/CeRuO2 at 10,000× magnification, (b) Pt/CeRuO2 at 20,000× magnification, (c) Ir/CeRuO2 at 10,000× magnification, and (d) Ir/CeRuO2 at 50,000× magnification.
Powders 05 00013 g002
Figure 3. Energy dispersive analysis for (a) CeRuO2, (b) Pt/CeRuO2, and (c) Ir/CeRuO2 compounds.
Powders 05 00013 g003
Figure 4. Diffraction patterns of CeO2, CeRuO2, Pt/CeRuO2, Ir/CeRuO2 compounds.
Powders 05 00013 g004
Figure 5. High-resolution X-ray diffraction pattern corresponding to (a) CeO2 and (b) CeRuO2 compounds. Dashed lines were added as a guide to emphasize the shifting due to the doping process.
Powders 05 00013 g005
Figure 6. Adsorption–desorption isotherms of (a) CeO2, (b) CeRuO2, (c) Ir/CeRuO2, and (d) Pt/CeRuO2 compounds.
Powders 05 00013 g006aPowders 05 00013 g006b
Figure 7. General XPS spectrum of the CeRuO2 compound.
Powders 05 00013 g007
Figure 8. Ce 3d XPS spectra and peak deconvolution showing the contribution of Ce3+ and Ce4+ species. Colored peaks located at approximately 880.9, 884.8, 898, and 916 eV are assigned to Ce4+, while the components at 900.1 and 902.7 eV are attributed to Ce3+ species.
Powders 05 00013 g008
Figure 9. XPS spectra corresponding to (a) Pt/CeRuO2 compound, (b) high-resolution spectra of Pt, (c) Ir/CeRuO2 compounds, (d) high-resolution spectra of Ir. Colored lines shown the 4f7/2 and 4f5/2 contributions.
Powders 05 00013 g009
Figure 10. UV–Vis spectra for CeO2, CeRuO2, Pt/CeRuO2, and, Ir/CeRuO2 compounds. Dashed lines are the maximum in curves were Ce3+ and Ce4+ signals are located.
Powders 05 00013 g010
Figure 11. Energy band-gap (Eg) determination for CeO2, CeRuO2, Pt/CeRuO2, and Ir/CeRuO2 compounds.
Powders 05 00013 g011
Figure 12. In situ FTIR spectra CO oxidation evolution for the (a) Pt/CeRuO2 and (b) Ir/CeRuO2 compounds. Reaction mixture 1% CO, 1% O2, N2 balance. The contact time W/FCO value was 25 gcat, h mol CO−1. The CO(g) FTIR spectra were subtracted. Dashed lines were added as a guide to emphasize the observed changes.
Powders 05 00013 g012
Figure 13. CO oxidation reaction tests for CeO2, CeRuO2, Pt/CeRuO2, and Ir/CeRuO2 compounds. Reaction mixture: 2% CO, 2% O2, N2 balance, contact time W/FCO = 30 gcat h/molCO. Dashed lines indicate the temperature at which the 10, 50, and 90% of CO conversion were reached.
Powders 05 00013 g013
Table 1. Crystallite size calculation for CeO2, CeRuO2, Pt/CeRuO2, Ir/CeRuO2 compounds.
CompoundCrystallite Size (nm)
CeO211.11
CeRuO28.55
Ir/CeRuO26.06
Pt/CeRuO27.12
Table 2. Specific surface area and pore size distribution.
CompoundSpecific Surface Area
(m2/g)
Pore Size
(nm)
CeO2136.625.67
CeRuO2148.34.40
Pt/CeRuO2149.35.53
Ir/CeRuO2123.46.85
Table 3. Comparative analysis of CO oxidation using different catalysts or conditions.
CatalystPreparation
Method
Temperature
°C
Maximum
Conversion
(%)
Ref.
C u / C e 1 y C o y O x Coprecipitation110–125100[24]
C e 0.9 C o 0.1 O x Solution combustion method125100[25]
M-Ce-Ox (M = Fe, Co, Ni, Cu) alloysmicrodrop-confined method110100[26]
Pt(N)/CeO2(N)Precipitation/Wte impregnation175–19090[27]
Pt/CeRuO2 Ir/CeRuO2Hydrothermal Microwave Heating125
150
100This work
Table 4. Activation energy (Ea) for CeO2, CeRuO2, Pt/CeRuO2, Ir/CeRuO2 compounds.
CompoundEa (J/mol)
CeO29209.212
CeRuO21366.305
Pt/CeRuO21963.678
Ir/CeRuO24386.761
Disclaimer/Publisher’s Note: The statements, opinions and data contained in all publications are solely those of the individual author(s) and contributor(s) and not of MDPI and/or the editor(s). MDPI and/or the editor(s) disclaim responsibility for any injury to people or property resulting from any ideas, methods, instructions or products referred to in the content.