
Article

Statistical Characteristics of Low-Level Vertical Directional Shear and Its Potential Implications for Aircraft Landing at Baghdad International Airport

by
Thoalfaqar Al-Rbayee
,
Monim H. Al-Jiboori
* and
Osama T. Al-Taai
Atmospheric Sciences Department, College of Sciences, Mustansiriyah University, Baghdad 10052, Iraq
*
Author to whom correspondence should be addressed.
Submission received: 14 May 2026 / Revised: 6 July 2026 / Accepted: 20 July 2026 / Published: 31 July 2026
(This article belongs to the Topic Advances in Aeroacoustics Research in Wind Engineering)

Abstract

Understanding wind direction (WD) variability and vertical directional shear is critical for aviation safety, particularly during landing when aircraft are highly sensitive to abrupt wind changes. This study analyzes the temporal behavior of WD and low-level directional shear over Baghdad International Airport during representative months of 2024 (January, April, July, and October) using hourly ERA5 u and v wind components at 10 and 540 m. Circular statistical measures quantify WD variability, while directional shear roses and absolute directional shear change rates characterize vertical wind alignment and shear intensity relevant to aviation operations. The results reveal pronounced seasonal contrasts. Summer (July) shows the most stable wind regime with strong directional persistence and weak shear (<~0.1–0.15 °/m), winter (January) is generally stable but punctuated by synoptic shear peaks up to ~0.85 °/m, spring (April) exhibits moderate and more variable shear (~0.1–0.45 °/m), and autumn (October) is the most dynamically unstable, with reduced persistence and frequent shear maxima approaching ~0.9–0.95 °/m. Circular standard deviation (σdir), is highest in winter–spring (mea n≈ 38° in January and ≈34° in April), weakest in summer (≈16–17° in July), and increases again in autumn (≈28–33° in October), reflecting seasonal changes in atmospheric forcing. σdir exhibits a clear seasonal cycle, with highest values during winter and spring and the most stable conditions in summer. These results show that integrating ERA5-based circular wind statistics with directional shear diagnostics effectively identifies aviation-critical wind regimes, while future multi-year and aircraft-based analyses can further refine operational low-level wind shear risk thresholds.

1. Introduction

Low-level wind direction refers to the direction from which the wind blows within the lower atmospheric boundary layer (ABL) near the Earth’s surface, typically extending from the ground to about 500–1000 m above ground level [1]. In this layer, wind direction (WD) is strongly controlled by surface friction, local topography, land-use characteristics, and thermal stratification [2]. Consequently, WD near the surface often differs from that at higher altitudes, giving rise to low-level direction shear (LLDS), defined as the change in wind direction with height in the lower atmosphere [3]. Characterizing low-level WD is essential for both meteorological and aviation applications [4]. It contributes to improved weather forecasting, airport planning, and assessments of atmospheric stability and pollutant dispersion, particularly in urban and arid environments [5,6]. In addition, LLDS influences the development and type of severe weather, affecting the likelihood of damaging winds, hail, or tornadoes. In aviation, near-surface WD plays a critical role in runway orientation and operational decision-making, as aircraft generally take off and land into the wind to minimize ground speed and enhance aerodynamic performance [5]. Variations in WD with height also represent a major component of wind shear hazards, which can induce turbulence and pose significant risks to aircraft, especially during takeoff and landing [6]. Although directional shear is often invisible in clear air, it may become apparent in the presence of clouds [7].
During the landing phase, aircrafts operate at low altitudes and reduced airspeeds, making them highly sensitive to changes in wind conditions. Sudden variations in WD near the surface can alter the relative wind experienced by the aircraft, leading to changes in lift and lateral control [8]. Directional shear may cause deviations from the runway centerline, increased pilot workload, and reduced flight stability during the final approach. In severe cases, strong directional shear close to the ground can compromise landing safety and may require go-around procedures or flight delays. Consequently, understanding and monitoring LLWD and its vertical shear are critical for ensuring safe aircraft landing operations, especially at major international airports. At Baghdad International Airport (BIA), these influences are increasingly modified by rapid urban expansion, changes in surface roughness, and alterations in the local thermal environment [9]. The characterization of low-level WD at BIA is particularly important due to the airport’s proximity to expanding urban areas and major transportation corridors [10]. Urban development modifies airflow through increased building density, heterogeneous surface materials, and enhanced heat storage, which together alter wind turning and vertical mixing in the BL. These effects can intensify directional shear and contribute to localized turbulence. Unlike wind speed, which can be directly averaged using conventional arithmetic methods, WD is a circular variable defined over a 0–360° range. This circular nature introduces fundamental difficulties in calculating representative mean values, as simple arithmetic averaging can produce physically meaningless results [11]. Consequently, the calculation of mean WD requires vector-based or circular statistical approaches that account for the periodicity of angular data. In addition, WD exhibits greater short-term variability and sensitivity to local effects [12]. These characteristics make WD more susceptible to abrupt fluctuations than wind speed, further complicating the estimation of stable mean values. As a result, the computation and interpretation of mean WD demand more careful statistical treatment than wind speed, particularly in studies of low-level wind behavior and directional shear.
Previous studies have investigated LLWD and its shear in various climatic settings, highlighting their importance for aircraft operations near airports. In 2020, Gomez and Lundquist [13] used LiDAR and turbine data from the CWEX 2013 experiment in Iowa and showed that wind speed and direction shear follow a diurnal cycle but evolve differently with wind speed. They found that large directional shear combined with weak speed shear leads to turbine underperformance, with power losses of around 10%, particularly for wind speeds in the mid-range of the power curve. In 2022, Bretschneider et al. [14] analyzed one year of wind–LiDAR data from two German sites to examine low-level jet characteristics, including occurrence, vertical wind shear, and wind-direction rotation. They reported shear gradients ranging from −0.23 to +0.2 s−1 with predominantly clockwise directional shear, concluding that while low-level jets pose limited risk to manned aircraft, they can increase pilot workload and present significant hazards for light unmanned aerial systems. Zamreeg and Hasanean [15] analyzed wind shear frequency and intensity using radiosonde observations and ERA5 data from six airport stations in Saudi Arabia during 1991–2020. Their results showed that severe wind shear events increased markedly below 30 m after 2015 at most stations, while the highest wind shear occurrence was generally observed during autumn, except at Jeddah where it peaked in summer. Salih et al. [16] reviewed recent developments in aircraft landing systems under low-visibility conditions, focusing on the ability of GPS-based technologies to meet ICAO CAT III requirements. They reported that, despite notable progress in GPS and its augmentations (DGPS, GBAS, WAAS, and LAAS), significant limitations in accuracy, integrity, and reliability persist, particularly for CAT IIIC operations, indicating the need for further system improvements. Previous work by [17] investigated the convective environments of thunderstorm and thunderstorm with rain events at three Turkish airports using aviation observations and ERA5 reanalysis data during 2019–2023. Their results showed significant spatial and temporal variability in convective activity, with differences in CAPE, LCL, lapse rates, storm duration, and moisture conditions associated with maritime and continental climatic influences. Locally, the previous study by [18] showed that urban expansion around BIA increased surface air temperature and influenced wind shear characteristics, with a weak positive relationship with temperature and a significant positive correlation with wind shear. A recent study performed by [19] at BIA used ERA5 reanalysis data to analyze wind speed characteristics and low-level wind shear at 10 and 540 m during January, April, July, and October 2024. The results showed consistent positive wind-speed gradients between the two levels, dominant low-level wind speeds of 2–4 m/s, and stronger winds aloft (4–8 m/s), with wind shear present throughout all hours and peaking in April. The originality of this study lies in its integrated investigation of wind direction and directional shear at low levels at BIA, a topic that has received limited attention in previous aviation-related studies over Iraq. Unlike earlier studies that primarily focused on wind speed and wind-speed shear, this work specifically addresses the circular nature of wind direction using circular statistical methods and directional shear roses to characterize LLDS behavior. In addition, the study combines ERA5 reanalysis with observational validation and examines the temporal variability of LLDS under different seasonal conditions at two aviation-relevant levels (10 and 540 m). This approach provides new insight into the structure, variability, and operational implications of directional wind shear for aircraft landing safety in a rapidly urbanizing airport environment.
Accordingly, the present study investigates low-level WD and LLDS at BIA by addressing three key research questions. First, previous studies have reported substantial urban expansion in the surroundings of BIA based on Landsat observations [10]. Such changes in land surface characteristics may influence local near-surface wind patterns and potentially contribute to conditions favorable for LLDS development; however, the present study does not directly quantify these effects. Second, it assesses the frequency, magnitude, and vertical structure of LLDS and their diurnal and seasonal variability. Third, it evaluates the potential implications of LLDS for aircraft operations during critical flight phases, particularly landing. Urban development in the vicinity of BIA alters surface roughness and thermal properties, thereby disturbing low-level airflow and increasing variability in WD, which is expected to enhance the occurrence of LLDS. Directional shear is anticipated to be most pronounced within the lowest few hundred meters of the atmosphere, with elevated frequency and magnitude during specific periods of the day and distinct seasonal behavior linked to atmospheric stability and surface heating. Using hourly ERA5 reanalysis wind data at 10 and 540 m for the year 2024 under different seasonal conditions, this study tests the following hypotheses: (i) WD at 10 m differs significantly from that at 540 m over BIA due to surface friction and boundary-layer processes; (ii) the magnitude of LLDS exhibit clear seasonal variability, with stronger and more frequent shear during winter and transitional seasons compared to summer; and (iii) directional shear regimes identified through the roses at both levels produce systematic patterns in WD shear roses. The major objectives of this paper are to: (1) evaluate the reliability of ERA5 10 m WD reanalysis for aviation applications by comparing it with observed WD data from the Iraqi Meteorological Organization and Seismology (IMOS) at BIA, (2) characterize the variability of hourly LLWD and broader temporal patterns during January, April, July, and October 2024 using circular statistics, with an emphasis on the circular standard deviation, (3) quantify vertical directional shear and its hourly change rate between 10 m and 540 m to identify aviation-critical periods of rapid WD changes, and (4) assess the directional and seasonal characteristics of wind shear using directional shear rose analysis and their implications for low-level wind stability during aircraft approach and landing.

2. Material and Methodology

2.1. Description of Baghdad Airport

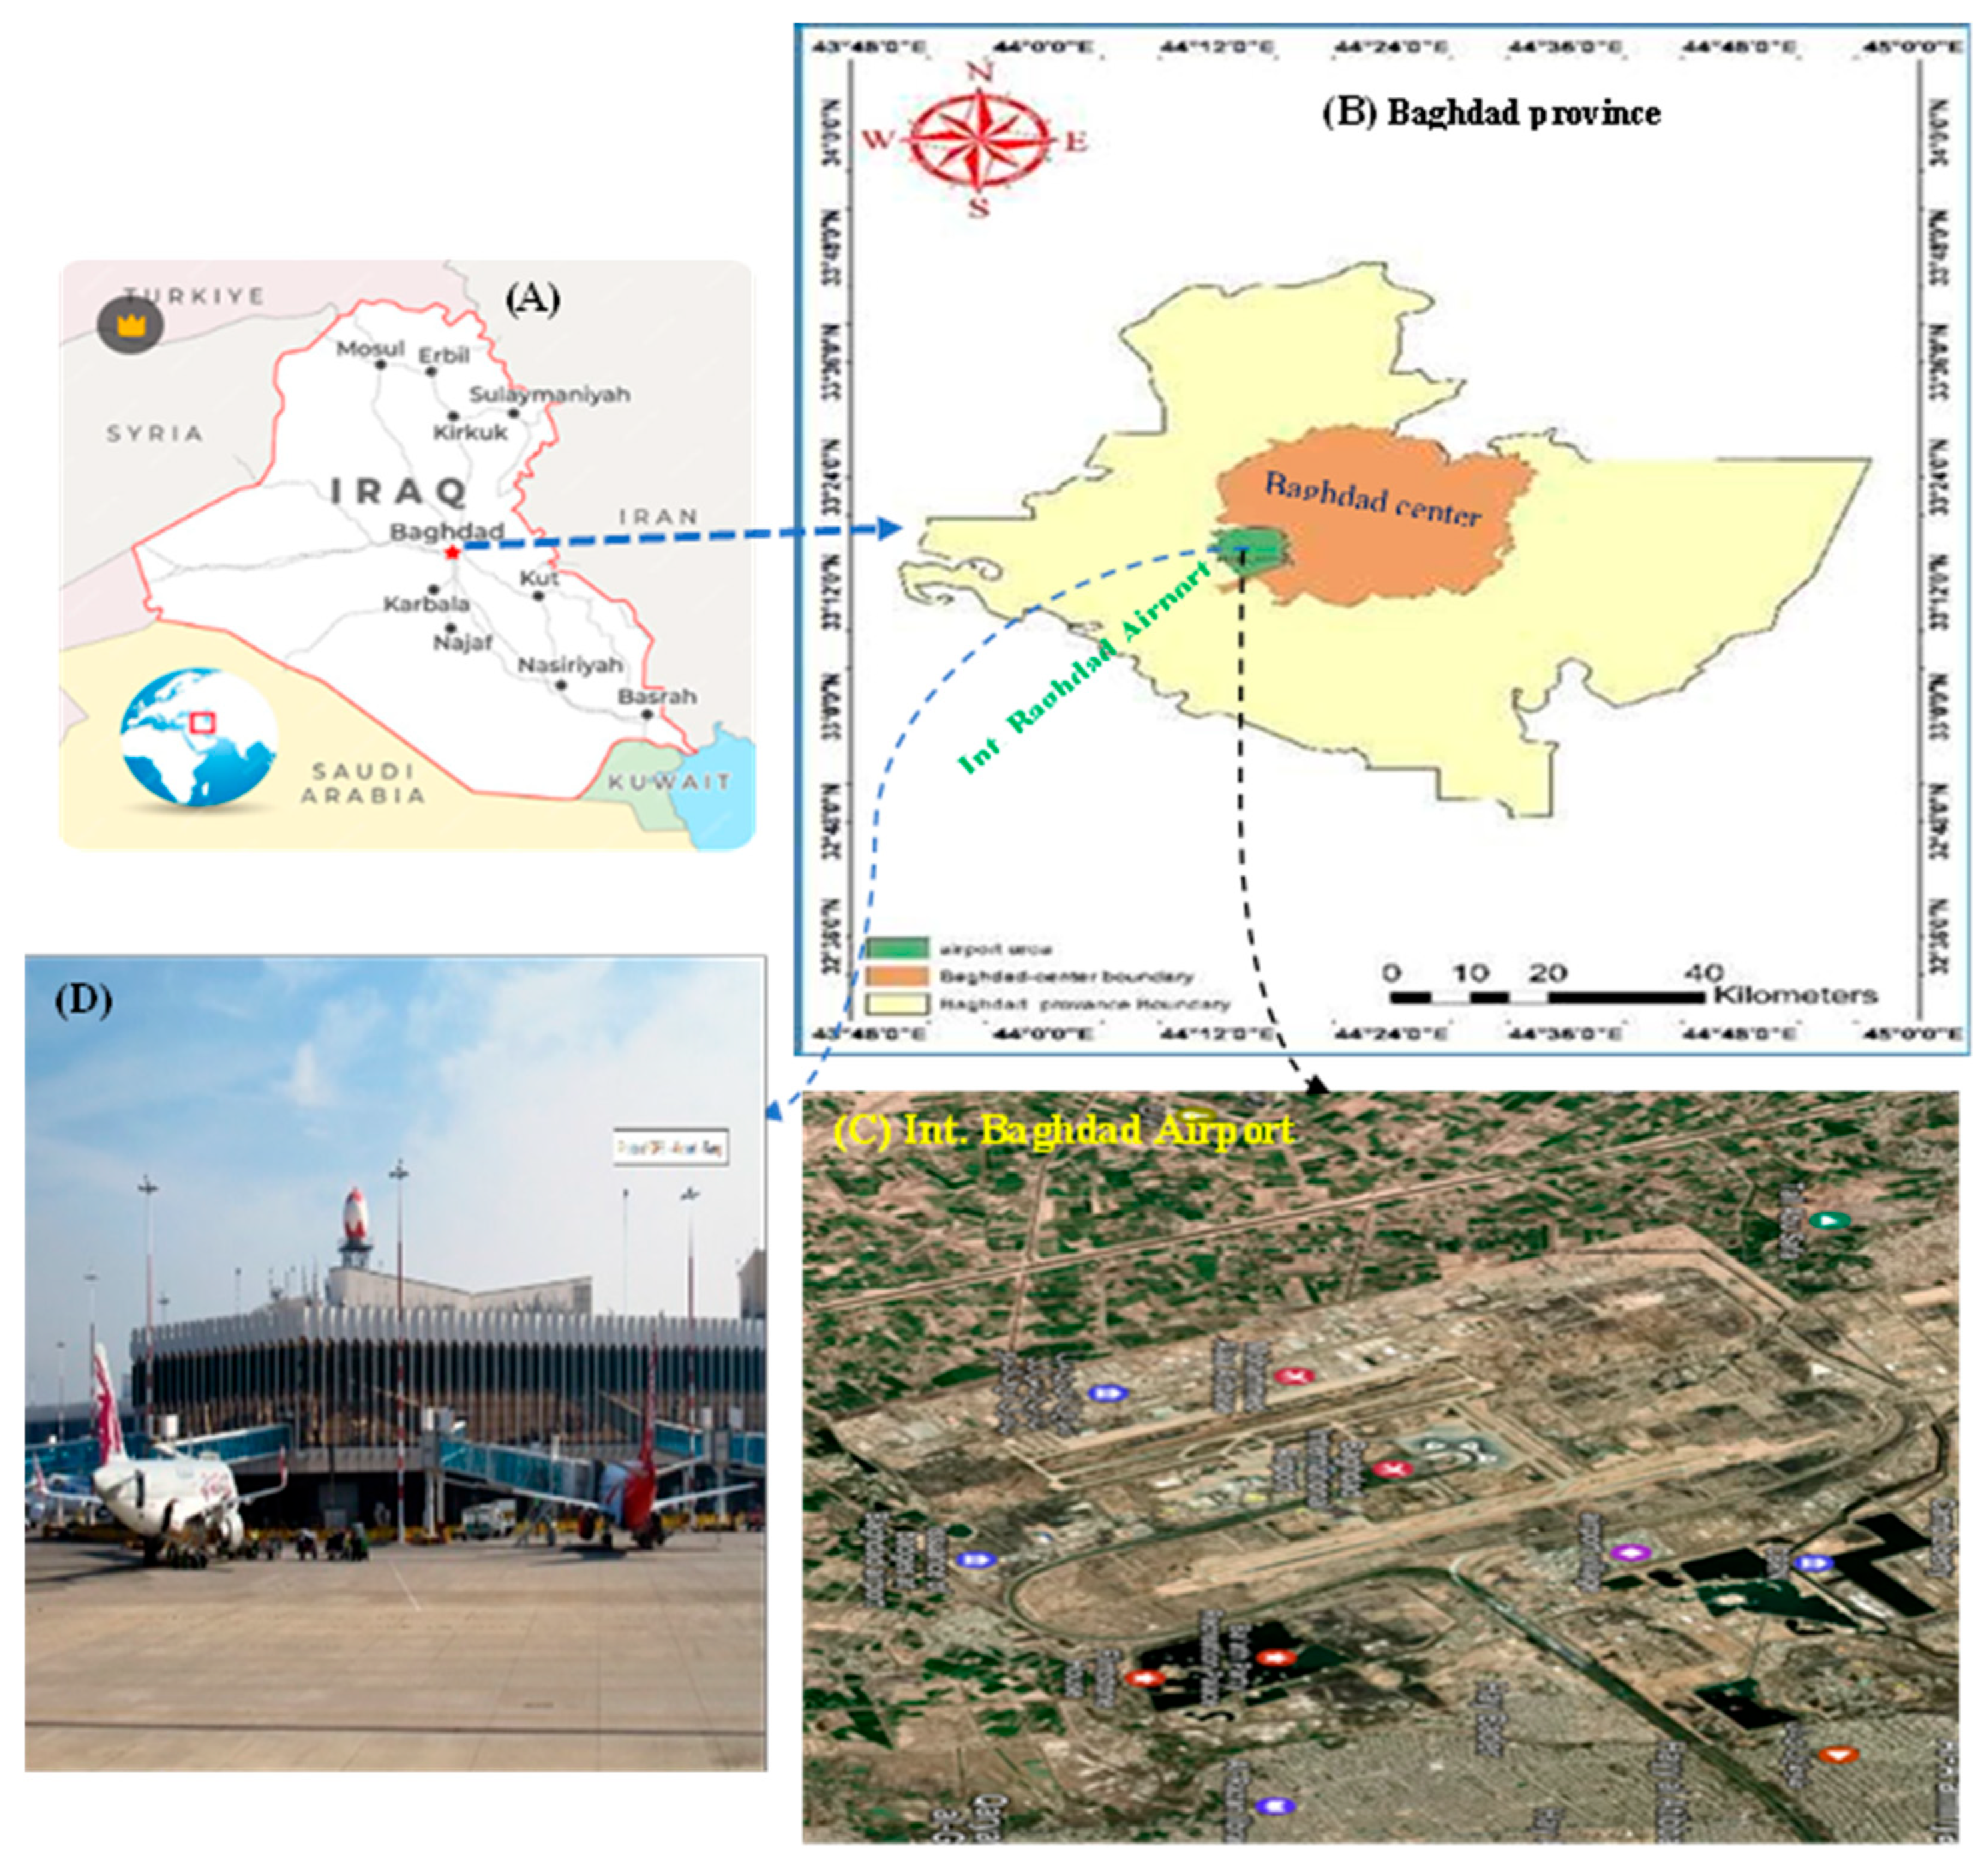
Baghdad is located on the flat alluvial plain of the Tigris River, characterized by very low relief and unconsolidated fluvial sediments. Extensive urban development, including dense residential and industrial areas, transportation networks, and impervious surfaces, significantly modifies surface roughness and the local thermal environment [20]. BIA is situated in central Iraq within Baghdad province (Figure 1A,B), approximately 16 km west of central Baghdad, on the western margin of the Tigris River plain. The airport is located at about 33.26° N, 44.23° E, with a mean elevation of ~35 m above sea level. Figure 1C shows the airport layout and surrounding land use, dominated by urban expansion [10], major transport corridors, agricultural fields, and semi-arid open land, while Figure 1D illustrates the terminal and apron areas. This setting places BIA within a rapidly urbanizing environment where land-use heterogeneity can influence near-surface wind flow. The climate of BIA is classified as hot desert (BWh), with extremely hot, dry summers and mild winters with limited precipitation. Wind conditions exhibit strong seasonal variability, with prevailing northwesterly to westerly winds throughout most of the year, dominated by the regional Shamal system, particularly in late spring and summer [21]. During winter and transitional seasons, wind directions become more variable, with occasional southerly and southeasterly flows linked to synoptic disturbances.

2.2. Data

This study employed hourly wind data from the ERA5 reanalysis for the year 2024, obtained from the Copernicus Climate Data Store (https://cds.climate.copernicus.eu (accessed on 30 July 2025)). Wind speed and direction were derived from the zonal (u) and meridional (v) wind components at the 950 hPa pressure level using ERA5 pressure-level products, together with 10 m wind fields from the ERA5-Land dataset. The 950 hPa level, corresponding to an altitude of approximately 540 m, was chosen to characterize low-level atmospheric flow above the surface layer while remaining directly relevant to aircraft landing operations. It should be noted that the geometric height of the 950 hPa surface is not constant and may vary with atmospheric conditions; thus, using a fixed height of 540 m introduces some uncertainty into the analysis. Because wind shear was calculated between pressure levels rather than fixed geometric heights, variations in the geometric height of the 950 hPa surface are expected to have only a minor effect on the estimated shear values. The 540 m measurement level was selected to represent the upper portion of the low-level atmospheric layer while remaining within the altitude range relevant to aircraft approach and departure operations. Although LLWS is particularly critical during the final approach phase within the first few hundred meters above the runway, the 540 m level captures the broader vertical structure of the shear layer where significant wind gradients can develop due to surface friction, thermal effects, and synoptic forcing. Additionally, comparing wind conditions at 540 m with near-surface measurements (10 m) allows a more effective assessment of vertical wind gradients and associated statistical characteristics. Therefore, the selected height provides a reasonable balance between representing aviation-relevant low-level shear processes and maintaining consistency with the observational capabilities of ERA5 reanalysis data. However, this altitude is located within the lower ABL, where pronounced vertical wind shear may arise as a result of surface friction, thermal stratification, and large-scale synoptic influences.
The ERA5 reanalysis data generated through a data assimilation system that combines numerical weather prediction models with various observational sources, including surface stations, radiosondes, aircraft, and satellite measurements. According to validation studies, ERA5 generally demonstrates good agreement with observed atmospheric variables and provides improved accuracy compared with previous reanalysis products, making it suitable for meteorological and BL studies [22].
ERA5 reanalysis datasets were retrieved at a spatial resolution of 0.25° × 0.25° for the year 2024. To represent the main seasonal conditions in the BIA, four months were selected: January (winter), April (spring), July (summer) and October (autumn). As each month contained either 30 or 31 days, a total of 2976 hourly observations were obtained over the study period, with 744 records per month. This seasonal sampling approach was adopted to capture LLDS characteristics under different meteorological conditions, while ensuring that seasonal variability is adequately represented, thus avoiding the need for continuous year-round analysis. The selected months were chosen to represent the main seasonal and synoptic variations in atmospheric conditions across the study area. January is characterized by cooler temperatures and increased frontal activity, whereas April is a transitional month with enhanced atmospheric instability and changing wind regimes. July is typically dominated by high temperatures, strong surface heating and relatively persistent circulation patterns. October marks the shift from summer to winter atmospheric conditions, representing another transitional period.
Data were extracted from the Copernicus Climate Data Store by selecting the predefined study period and study area extent for the ERA5 and ERA5-Land hourly datasets. The zonal wind component (u) and the meridional wind component (v) at the 950 hPa pressure level were obtained from the ERA5 dataset, while the corresponding 10 m wind components were extracted from the ERA5-Land dataset. The nearest grid point corresponding to the location of the BIA was selected for analysis. All data were downloaded in NetCDF (NC) format. The downloaded NC files were initially inspected using Panoply (NASA) to verify the availability of variables and the integrity of the data. The required variables were then extracted and converted to CSV format for further processing. Wind speed and wind shear parameters were then calculated and analyzed using Microsoft Excel. The extracted datasets were checked for missing or invalid values prior to analysis; however, no missing data were identified within the selected period. Therefore, all hourly observations were retained for subsequent statistical analysis.
However, there is a limitation of this study is that the use of ERA5 data at the above spatial resolution, which may not fully resolve localized urban-scale features and microscale flow disturbances associated with urban expansion, airport infrastructure, and surface roughness variations around Baghdad Airport. Although ERA5 provides reliable information on large-scale atmospheric patterns and regional wind characteristics, small-scale urban-induced effects may be partially smoothed because of the relatively coarse spatial resolution. Therefore, the findings should be interpreted as representing broader regional atmospheric conditions rather than detailed local-scale turbulence and flow modifications. Another limitation is related to the temporal resolution of the ERA5 dataset. Wind shear events can occur on time scales of seconds to minutes, whereas ERA5 hourly data represent averaged atmospheric conditions over broader temporal scales. As a result, short-duration and high-intensity gust events or transient wind shear structures may be smoothed or underestimated. Therefore, the calculated shear extremes should be interpreted as indicators of larger-scale atmospheric variability and background wind conditions rather than direct representations of real-time operational hazards.

3. Methodology

3.1. Some Wind Direction Statistics

Wind direction variability directly affects runway usability, crosswind components, and approach stability. We used the following formula to calculate the magnitude of the wind speed from u and v component data described in the above subsection, which is equal to the square root of the sum of the squares of these components.
U = ( u 2 + v 2 )
where u is the zonal component represents the east–west wind, with positive values indicating flow toward the east, while v is the meridional component represents the north–south wind, with positive values indicating flow toward the north. Wind direction is calculated from u and v components using the formula [11]:
D i r e c t i o n ( θ ) = 270 ° 180 π A T A N 2 ( v , u )
The resulting angle was converted from radians to degrees and adjusted to the meteorological convention, measured clockwise from true north (0–360°). Because WD is a circular variable, its temporal behavior was analyzed using circular statistics to ensure physically meaningful interpretation. Hourly WD observations were summarized using the circular mean direction to represent the dominant airflow orientation, the circular standard deviation (σdir) to quantify directional spread and variability, and the resultant vector length (R) as a measure of directional consistency. The σdir metric provides a quantitative indicator of directional variability relevant to aviation operations, with higher values highlighting periods of increased landing risk that require enhanced operational awareness and wind monitoring. These metrics were computed on hourly, diurnal (hour-of-day), and monthly scales to characterize short-term and seasonal directional stability. The σdir was calculated using the equation below after converting WD values into their sine and cosine components. σdir is particularly valuable for landing aviation, as it directly reflects WD fluctuations that affect runway alignment and approach stability [12].
σ d i r = ( 2 l n R )
R is ranging from 0 to 1, indicate strong directional persistence and can be derived.
R = ( S I N θ ¯ ) 2 + ( C O S θ ¯ ) 2 1 / 2
In this paper, the mean values of SINθ and COSθ were calculated on a daily time scale using hourly WD data, where the hourly directional observations for each day were transformed into their respective trigonometric components and then averaged to obtain representative daily values.

3.2. Directional Shear Change Rate

Vertical directional shear describes the rate at which WD varies with height in the atmosphere. It is commonly quantified using the directional shear rate, defined as the angular difference in wind direction between two vertical levels normalized by the height separating them. Directional shear, expressed as an absolute rate of change (°/m), is a linear, non-negative variable, allowing the use of conventional statistical techniques. Mathematically, the magnitude of absolute directional shear rate is expressed as [13]
A b s o l u t e   d i r e c t i o n a l   s h e a r   r a t e = W D ( Z 2 ) W D ( Z 1 ) Z
where WD(Z1) and WD(Z2) are the wind directions at heights Z1 and Z2, respectively, and ΔZ is the vertical distance between these levels. Directional shear is especially important in the lower atmosphere, where rapid near-surface directional changes can affect aircraft operations, boundary-layer turbulence, and pollutant dispersion, and is often linked to low-level jets, frontal systems, and urban-induced flow disturbances [11]. By using the absolute value, the metric emphasizes the intensity of directional variability rather than whether the change is clockwise or counter-clockwise. This approach is particularly suitable for aviation and boundary-layer studies, as rapid directional shifts—regardless of sign—can enhance turbulence, complicate runway alignment, and affect aircraft landing performance. The direction of shear is calculated to quantify how WD changes with height in the studies layer using the following Equation (4). The calculation is based on comparing wind components at two levels. By determining the difference in wind components between these levels, directional shear provides a simple measure of wind turning with altitude [11].
D i r e c t i o n a l   s h e a r = 90 ° A T A N V , U + α o
where U = u 2 u 1 and V = v 2 v 1 with the subscripts 1 and 2 are layer bottom and layer top, respectively. The constant αo equals 180° if ΔU > 0, but is 0 otherwise. The relationship between WD variability and directional shear was assessed using correlations between circular dispersion metrics and shear magnitude, together with composite analyses during high- and low-variability periods, to distinguish gradual directional spread from abrupt vertical wind turning. WD variability was analyzed using circular statistics (circular mean, circular standard deviation, and resultant vector length) on diurnal and monthly scales, while directional shear was treated as a linear variable and examined using descriptive statistics and diurnal and seasonal composites. Monthly differences were evaluated using parametric or non-parametric tests based on data normality, allowing robust separation of background directional stability from episodic high-shear events.

3.3. Low-Level Directional Shear Rose

The low-level directional shear rose is a key diagnostic tool in aviation meteorology, providing a compact representation of the prevailing directions and intensities of vertical WD changes at an airport. In this study, LLDS roses were used to characterize the frequency, direction, and magnitude of vertical WD variations relevant to aviation operations. Shear directions were classified into 16 standard compass sectors, each spanning 22.5° and encompassing cardinal, intercardinal, and secondary intercardinal directions. For each sector, the frequency of occurrence was calculated relative to the total number of valid observations, while directional shear magnitudes were optionally grouped into discrete classes and combined with directional frequencies to yield a joint depiction of shear direction and intensity. This methodology provides a clear visualization of dominant shear patterns, seasonal variability, and crosswind-related turning, enabling the identification of operationally significant vertical wind turning. The 16-sector classification enhances directional resolution, facilitating the detection of subtle directional shifts and supporting detailed assessment of wind shear impacts on landing and approach stability.

3.4. Statistical Analysis and Programs

Pearson correlation coefficient (r) was used to quantify the strength and direction of the linear relationship between ERA5-derived and observed WD data. The coefficient r ranges from −1 to +1, where values close to +1 indicate a strong positive linear relationship, values near 0 indicate a weak or no linear association, and values close to −1 indicate a strong negative relationship [23]. The statistical significance of the correlations was evaluated using two-tailed p-values, with p < 0.05 considered statistically significant and p < 0.01 indicating high significance [24].
All analyses and calculations were conducted using a combination of OriginLab 2021 and Microsoft Excel 2021. OriginLab 2021 was employed to perform the main statistical analyses and to generate graphical outputs, including wind rose and directional shear rose diagrams. Microsoft Excel 2021 was used for the preliminary calculations, where WD was derived from the horizontal wind components. In addition, Excel was utilized to compute directional shear, as well as the directional shear rate, which were subsequently analyzed and visualized using OriginLab.

4. Results and Discussion

4.1. Validation of ERA5 WD Data with In Situ Measurements

WD was calculated from the horizontal wind components using Equations (1) and (2), which relate the u and v components to the resultant direction relative to true north. This standard vector-based method ensures a consistent framework for analyzing WD, directional variability, and vertical directional shear. To assess the reliability of ERA5-derived wind directions, a validation was conducted using ground-based observations from the Baghdad weather station and the IMOS at BIA for 2024. The analysis focused on four months—January, April, July, and October—to capture the primary seasonal regimes. Near-surface (10 m) ERA5 wind directions were evaluated against the corresponding observations. A limitation of this study arises from the use of ERA5 reanalysis data at the 950 hPa level (~540 m), where direct routine observations were not available at the study sites. Although ERA5 integrates a wide range of observational data through data assimilation to provide physically consistent atmospheric fields, uncertainties in the reanalysis wind components may propagate into the calculated directional shear estimates. Variations in the u and v components can affect the derived wind direction and associated shear calculations [25], while the reanalysis procedure may also smooth localized and transient atmospheric features. Therefore, the derived directional shear values should be interpreted as representative of broader atmospheric conditions rather than exact measurements of local wind variability.
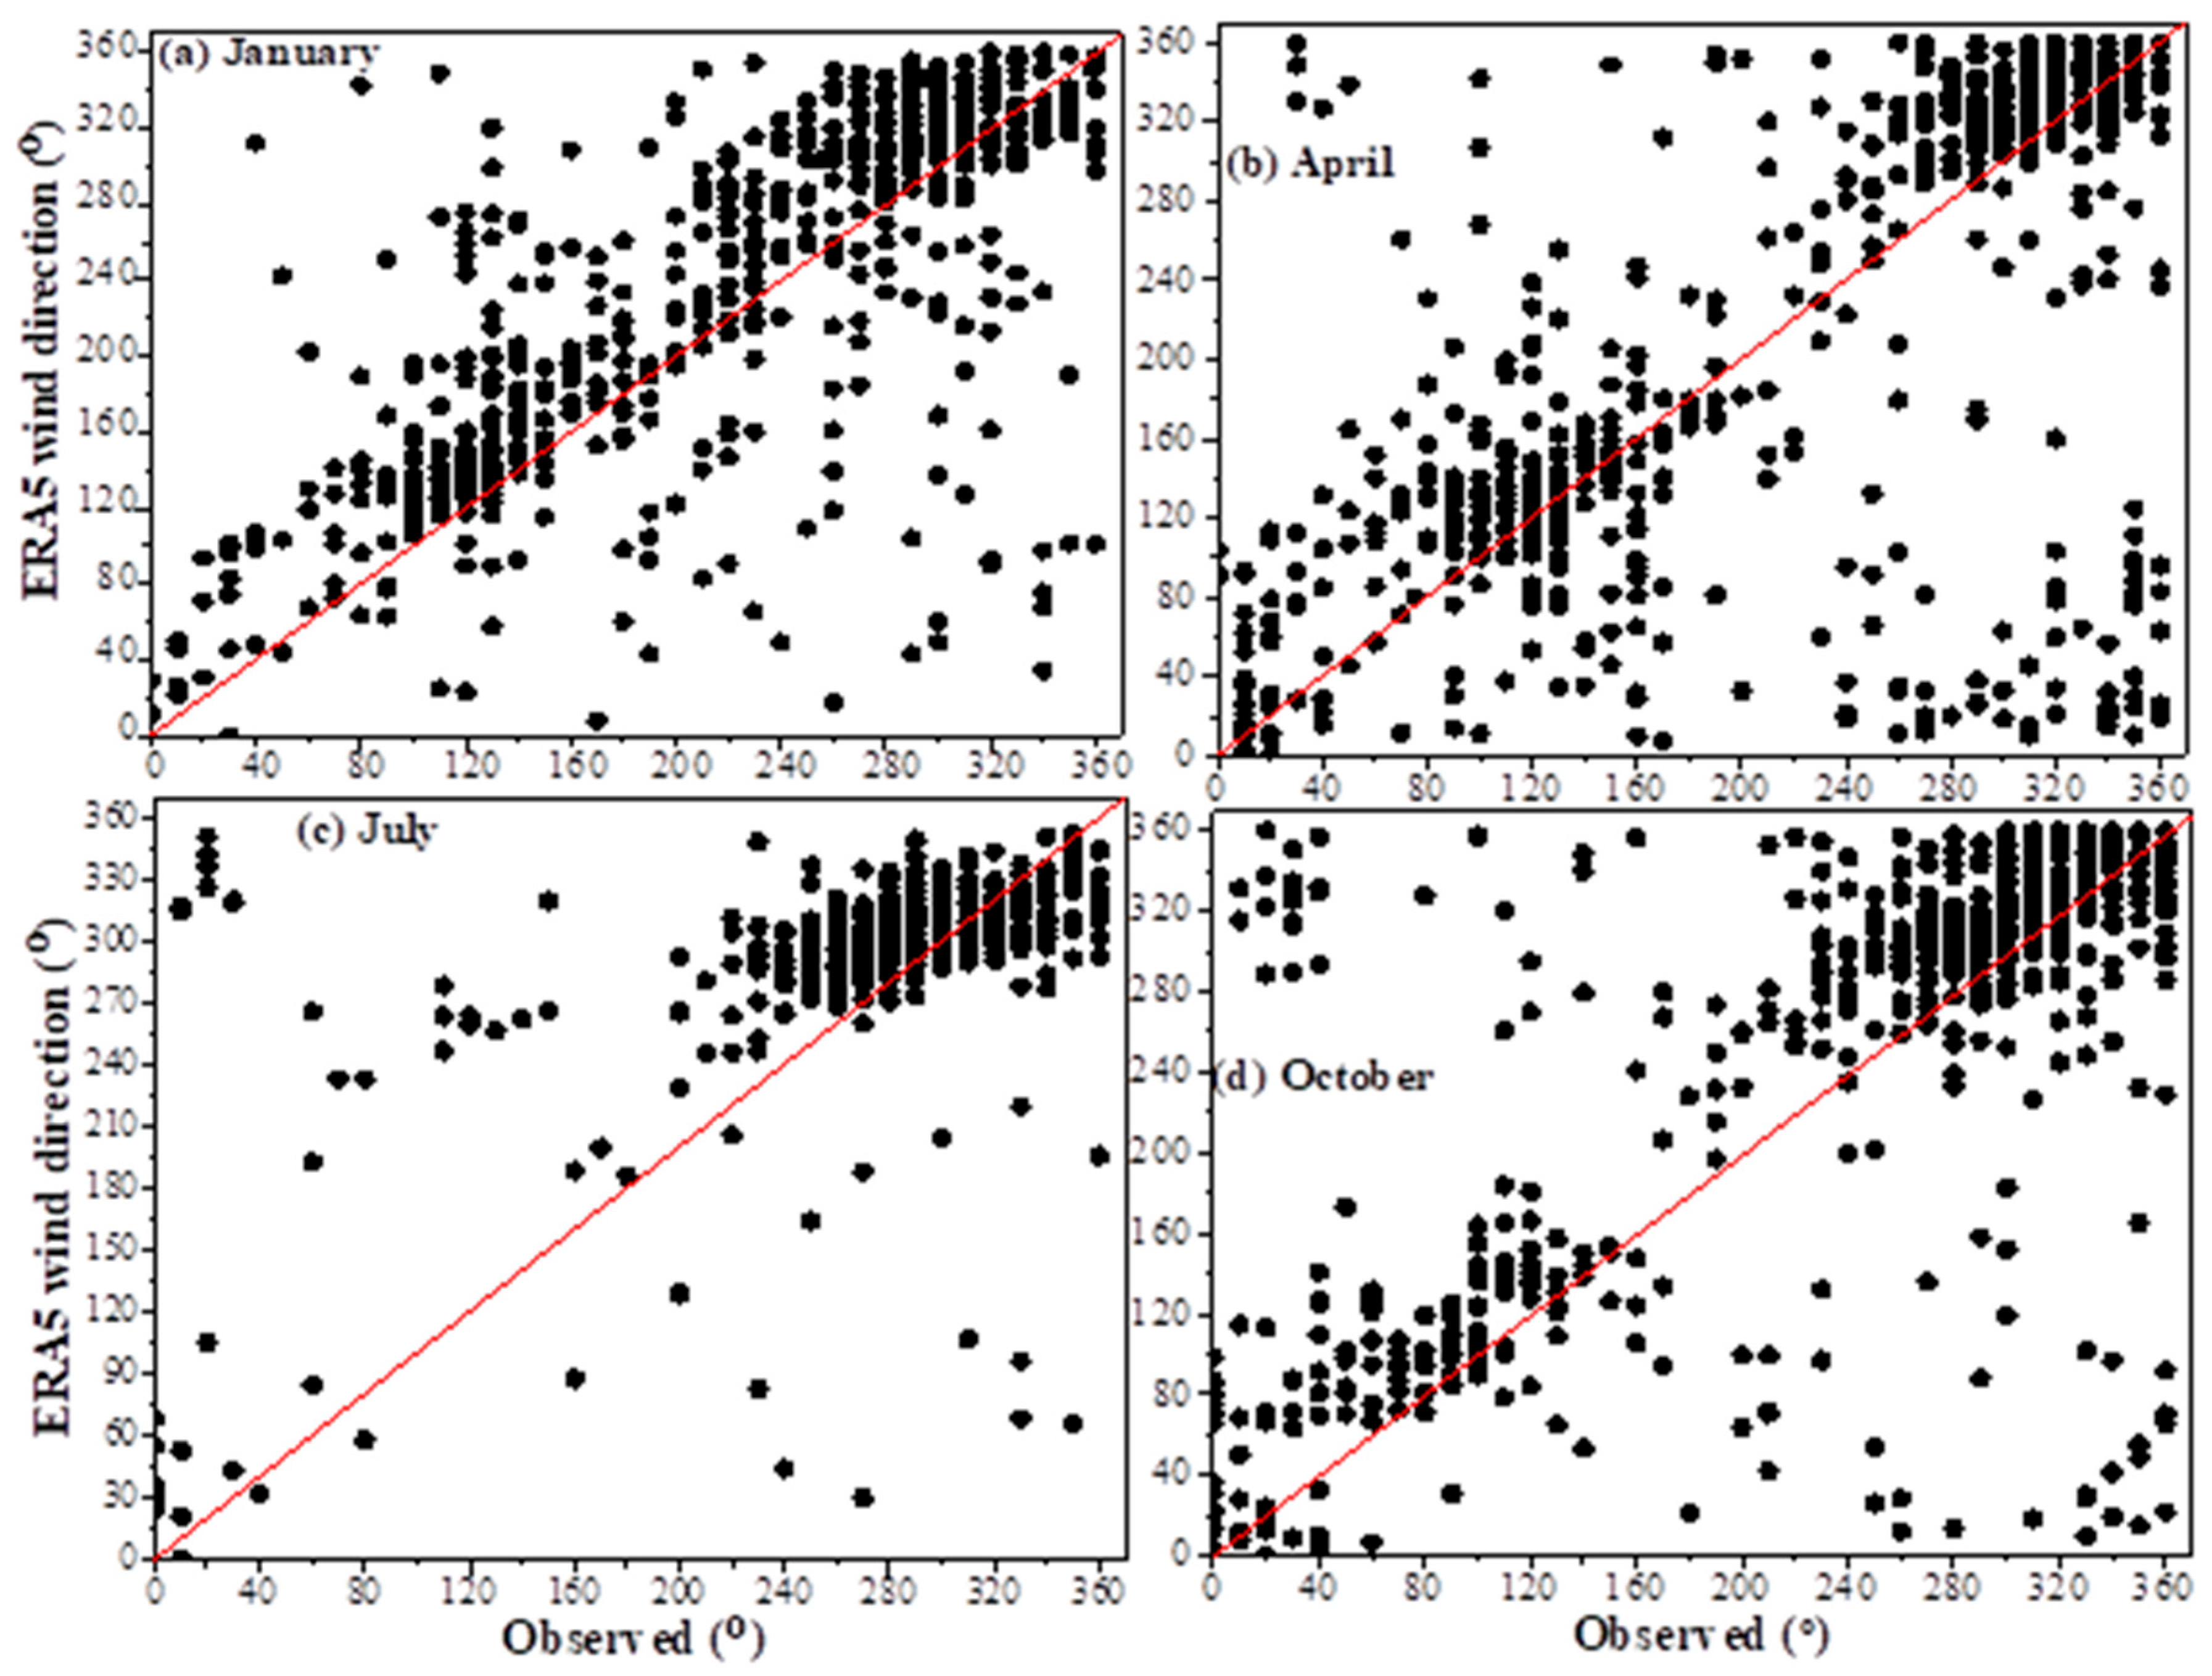
Figure 2 shows scatter plots comparing ERA5 and observed wind directions for the selected months. In all cases, data points cluster closely around the 1:1 reference line, indicating strong agreement between the reanalysis and observations. The highest correspondence occurs in October, evidenced by tighter clustering, while July shows slightly greater dispersion, likely reflecting enhanced summertime atmospheric variability. Overall, the results confirm that ERA5 reliably reproduces near-surface WD and its variability over the study area. This reliability was also confirmed by other studies [19].
The results shown Figure 2a–d reveal a consistent positive linear relationship across all months, with r ranging from 0.62 in July to 0.84 in October as shown in Table 1, indicating moderate to strong agreement. The r exhibits noticeable seasonal variability among the selected months, indicating differences in the strength of the relationship between the analyzed variables. The highest correlation was observed in October (r = 0.84), suggesting a very strong relationship during autumn conditions. This may be attributed to relatively stable atmospheric conditions and more consistent meteorological forcing during this period. January also showed a strong positive correlation (r = 0.79), indicating a substantial association between the variables during winter. In contrast, lower correlations were found in April (r = 0.64) and July (r = 0.62), reflecting only moderate relationships. The reduced values in these months may result from greater atmospheric variability and stronger influences of local processes. In April, transitional spring weather and changing synoptic patterns can increase fluctuations, while in July, intense solar heating and enhanced convective activity may introduce additional variability that weakens the observed relationship. The highest correlation occurs in October (r = 0.84), while April and July exhibit slightly lower but still meaningful correlations. On an annual basis, the correlation remains strong (r = 0.72). All correlations are statistically significant (p ≪ 0.01) as reported in Table 1, confirming that the observed relationships are robust and not attributable to random variability. Overall, the validation demonstrates that ERA5 WD data provide sufficiently reliable estimates for climatological and aviation-related analyses over the study area.

4.2. Temporal Variation of Wind Direction

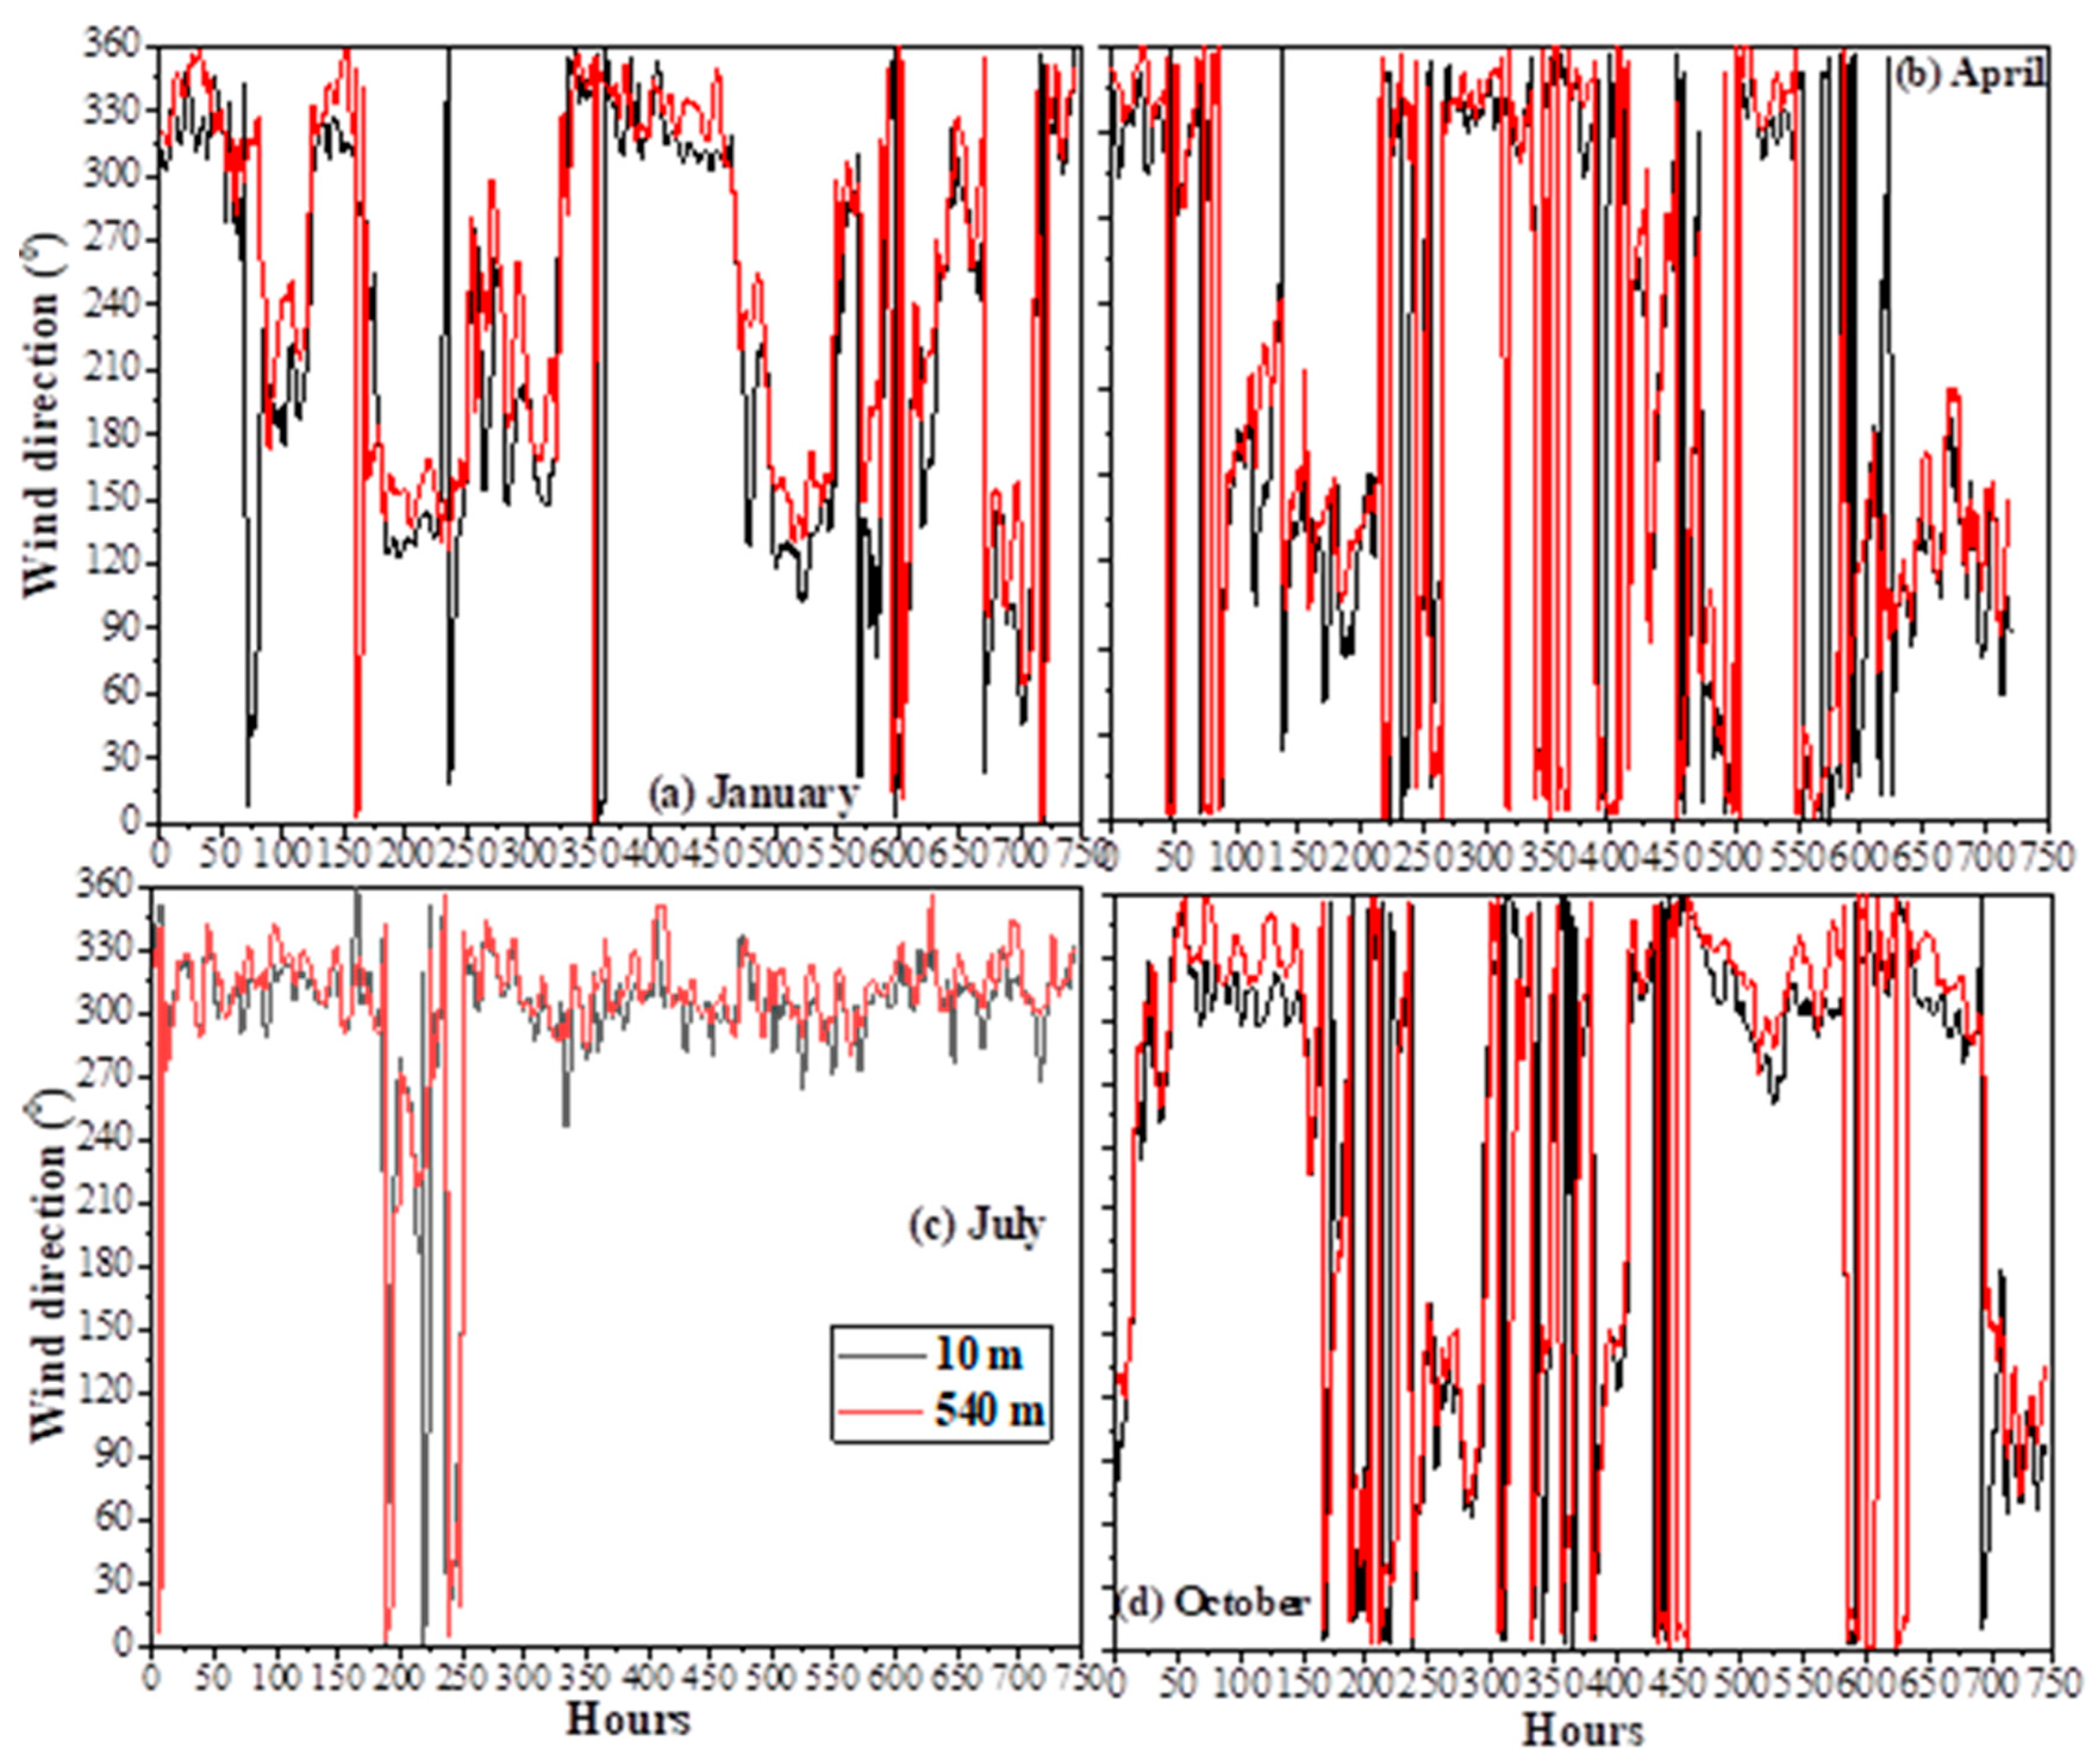
Hourly WD at 10 and 540 m was analyzed for the selected months to examine seasonal changes in vertical wind structure and directional shear (Figure 3a–d). The time series reveal pronounced seasonal variability in WD at both levels. In January, WD spans nearly the full 0–360° range, with frequent abrupt shifts at both heights, indicating strong directional shear under dominant winter synoptic forcing (Figure 3a). Near the surface, rapid fluctuations reflect frictional and local effects, while the 540 m flow remains more organized but still undergoes sharp directional changes. Large inter-level directional differences, often exceeding 90–180°, highlight frequent strong wintertime shear. April also exhibits high variability, particularly aloft, consistent with unstable spring transition conditions. WD frequently alternates between northerly (≈300–360°) and southerly–easterly sectors (≈90–180°), and persistent mismatches between the two levels indicate enhanced vertical directional shear associated with increased atmospheric instability. In contrast, July is characterized by a stable and coherent WD regime, largely confined to the 300–360° sector at both heights, reflecting the dominance of the northwesterly Shamal flow. The close alignment between surface and elevated winds indicates weak directional shear and a well-mixed summer BL. October shows a renewed increase in variability, especially at 540 m, marking the transition from summer to autumn circulation. Frequent surface–aloft directional differences indicate the re-emergence of moderate to strong directional shear during the autumn transition.
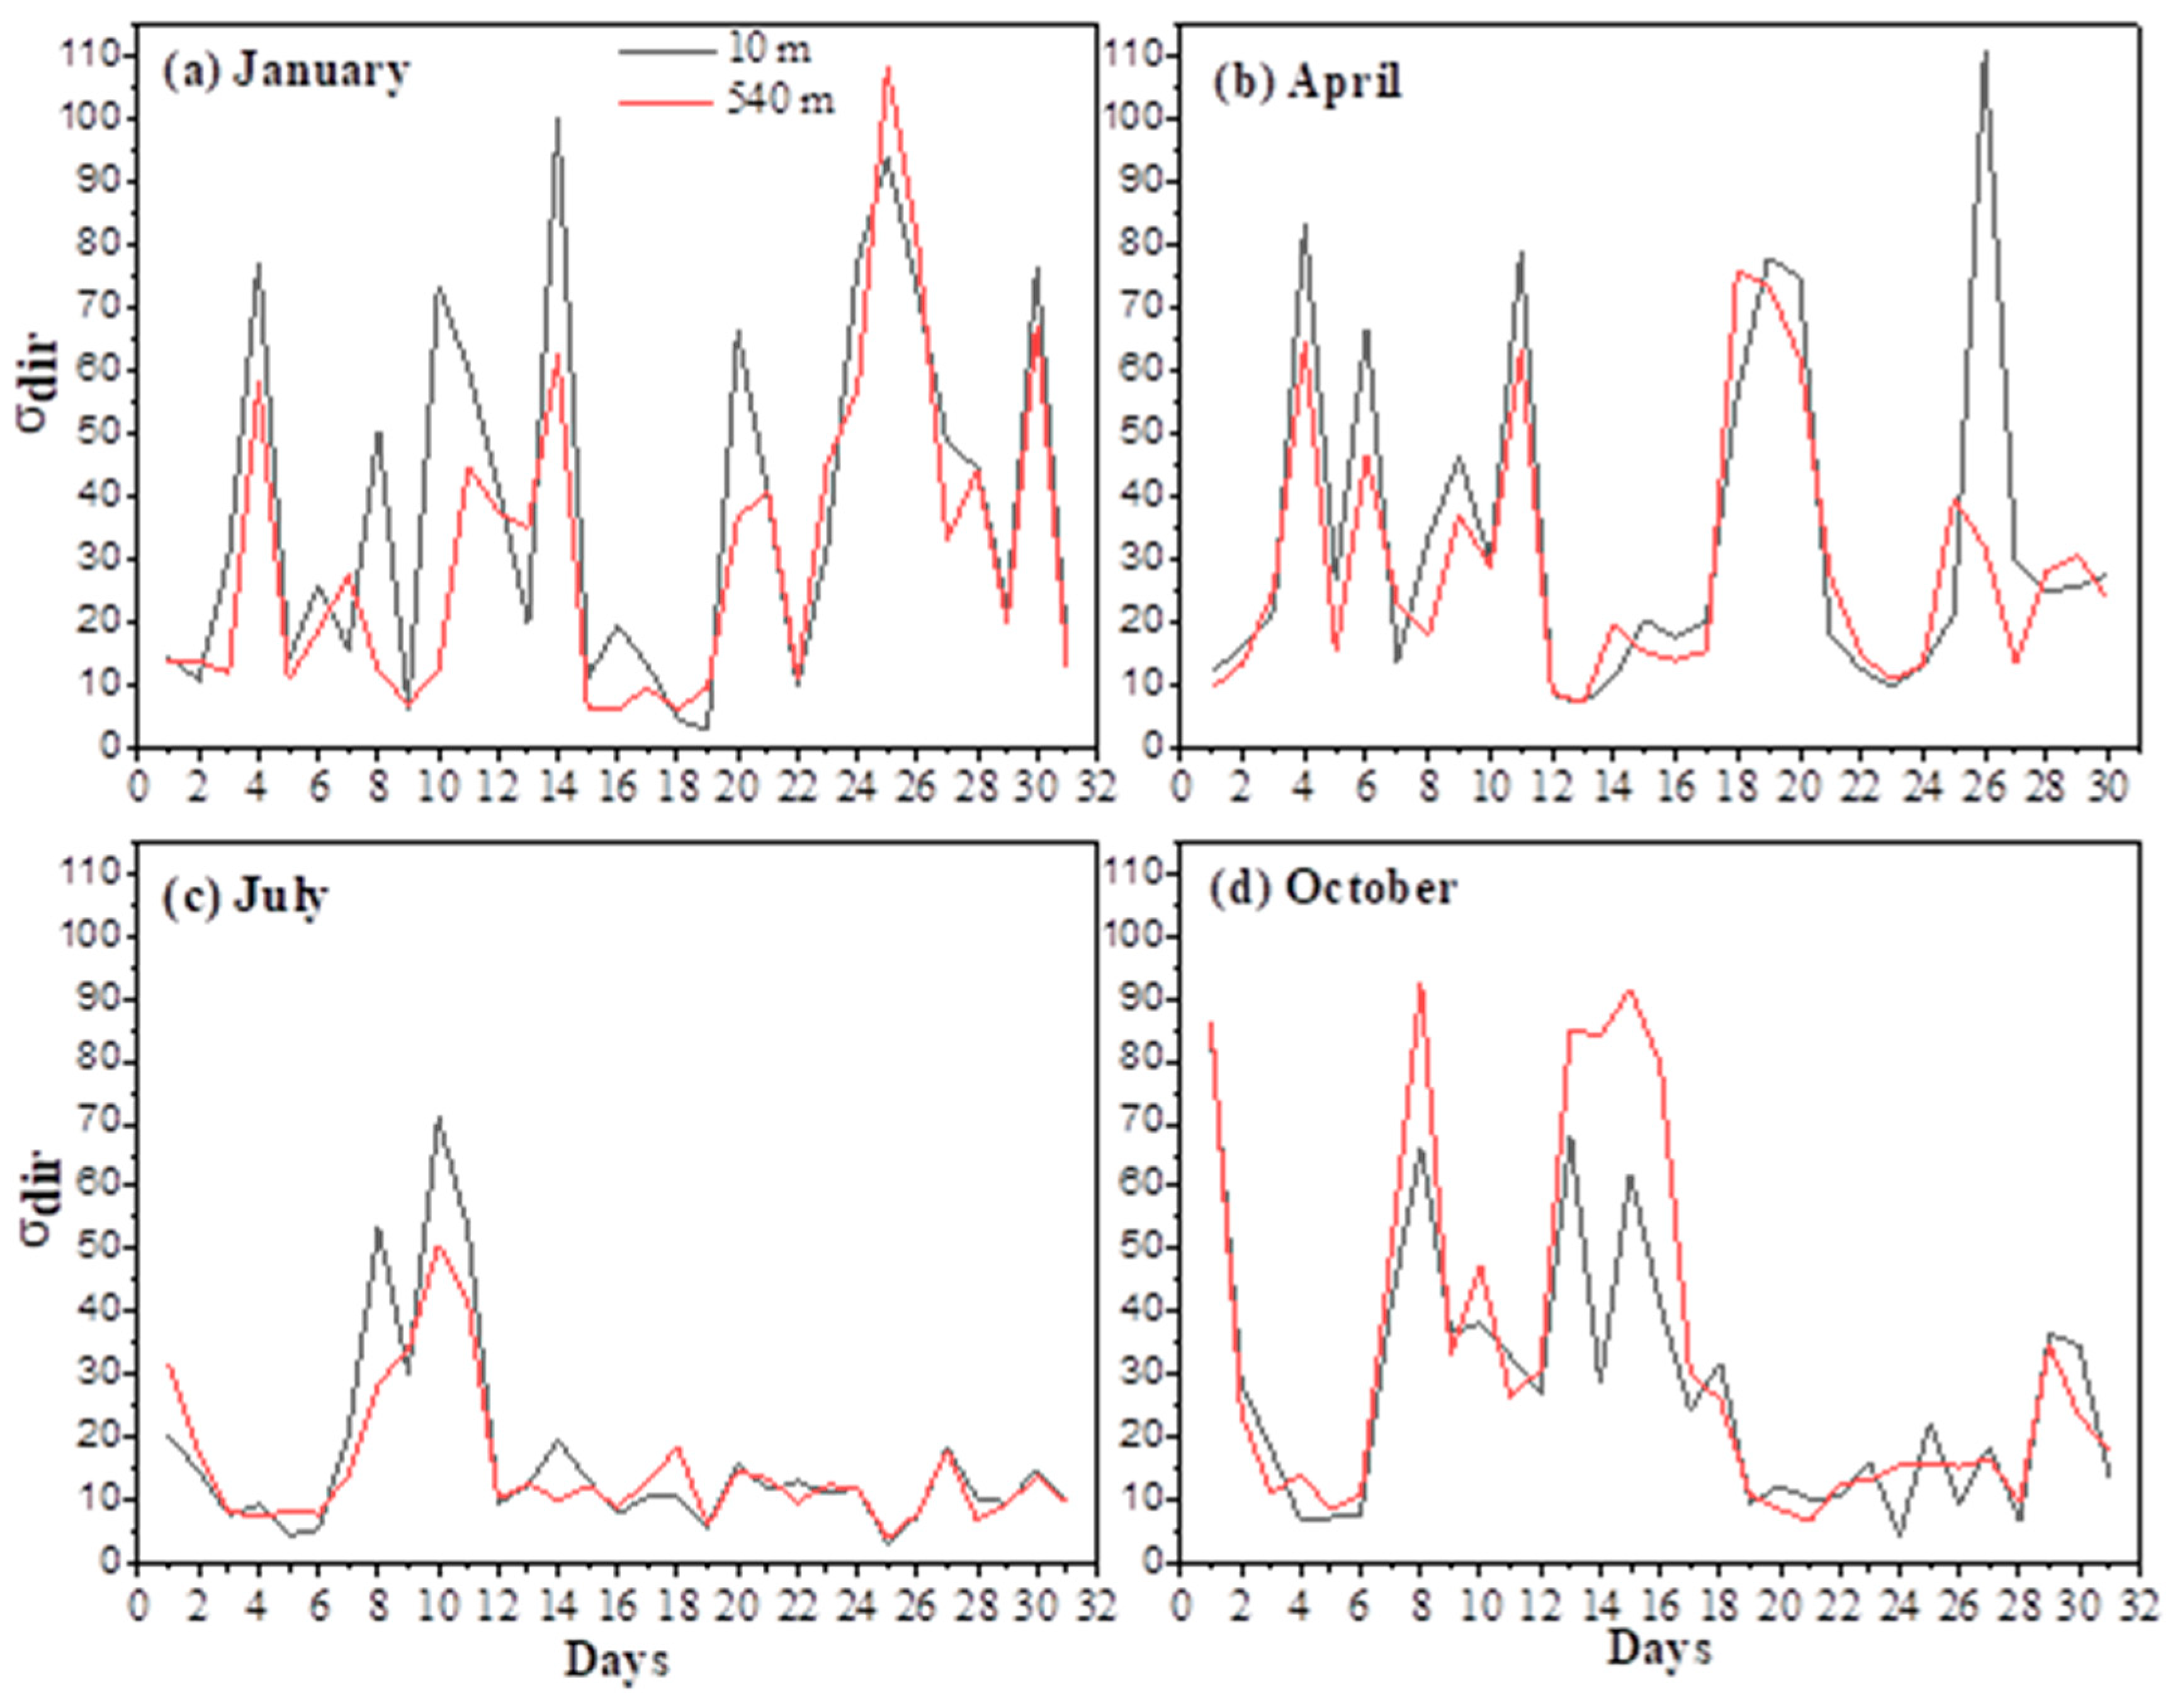
Four subplots (Figure 4a–d) illustrate the daily variation of the circular standard deviation of WD at 10 (black) and 540 m (red) for January, April, July, and October 2024, respectively. The σdir quantifies directional variability, with low values indicating stable winds and higher values (approaching 100°) representing highly variable or turbulent directional behavior. Daily σdir was computed using Equation (3), enabling direct comparison of near-surface and elevated wind variability. In January (Figure 4a), σdir at 10 m shows strong day-to-day variability, with multiple peaks reaching ~60–100°, indicating frequent low-level directional fluctuations. At 540 m, variability is generally lower (≈10–70°), though an isolated peak near 100° highlights episodic abrupt directional changes aloft. The persistent contrast between enhanced surface variability and comparatively steadier flow aloft reflects frequent wintertime vertical directional shear, which is critical for landing operations due to sudden changes in heating and airspeed close to the runway. From Figure 4b, April also exhibits elevated σdir at both levels, with repeated surface peaks of ~80–100° and smoother but still substantial variability aloft (≈60–90°). The simultaneous enhancement of σdir at 10 and 540 m indicates partial vertical coupling and recurrent moderate to strong low-level directional shear associated with transitional spring conditions, increasing uncertainty during final approach. In July (Figure 4c), σdir values are markedly lower, reflecting a stable wind regime. Near-surface σdir remains mostly within 10–40°, while aloft it is confined to 10–30°, indicating a vertically coherent flow with minimal directional shear. These conditions correspond to the lowest LLDS risk and the most favorable environment for landing operations. October is characterized by renewed increases in σdir, particularly at 10 m, where frequent peaks of ~80–100° indicate highly variable surface winds (Figure 4d). Concurrent, though generally weaker, peaks at 540 m reveal episodic strong vertical directional shear, consistent with autumn transition dynamics. The alternation between stable and highly variable days highlights increased LLDS potential and operational challenges during landing. Overall, higher σdir near the surface compared to 540 m emphasizes the dominant role of boundary-layer processes in generating directional variability, while the contrast between the stable summer conditions and the more variable winter and autumn regimes underscores the strong seasonal modulation of aviation-relevant wind shear risk.
Based on the results of this graph, the monthly minimum, maximum, and mean values of the σdir of WD at BIA in 2024, summarized in Table 2, reveal a pronounced seasonal cycle. Directional variability is highest during winter and spring, weakest in summer, and intermediate in autumn. In January, σdir shows strong variability, with minimum values of 2.8° at 10 and 6.1° at 540 m, maximum values of 100.3° and 108.5°, and mean values of 38.5° and 31°, respectively, indicating the dominance of synoptic-scale forcing. April maintains relatively high variability, with minima of 7.1–7.2°, maxima reaching 110.9° at 10 m and 76° at 540 m, and mean values of 33.9° and 29.1°, consistent with transitional spring conditions. In contrast, July exhibits the most stable wind directions, characterized by low mean σdir values of 16.8° at 10 m and 15.4° at 540 m and reduced maxima of 71° and 50°. By October, σdir increases again, with mean values of 27.7° and 33.4° and maximum values up to 84.8° and 92.4°, reflecting renewed directional variability associated with the breakdown of summer circulation. This seasonal modulation of σdir has direct implications for aircraft landing operations at BIA. Higher σdir values in winter and spring indicate frequent WD fluctuations that can enhance crosswind variability and increase pilot workload during approach and landing. Conversely, the low σdir observed in summer reflects persistent wind directions that are more favorable for stable approaches and reduced landing risk. The increased σdir during autumn highlights a transitional period in which intermittent directional changes may elevate the potential for LLDS during final approach.

4.3. Hourly Variations of Directional Shear Change Rate

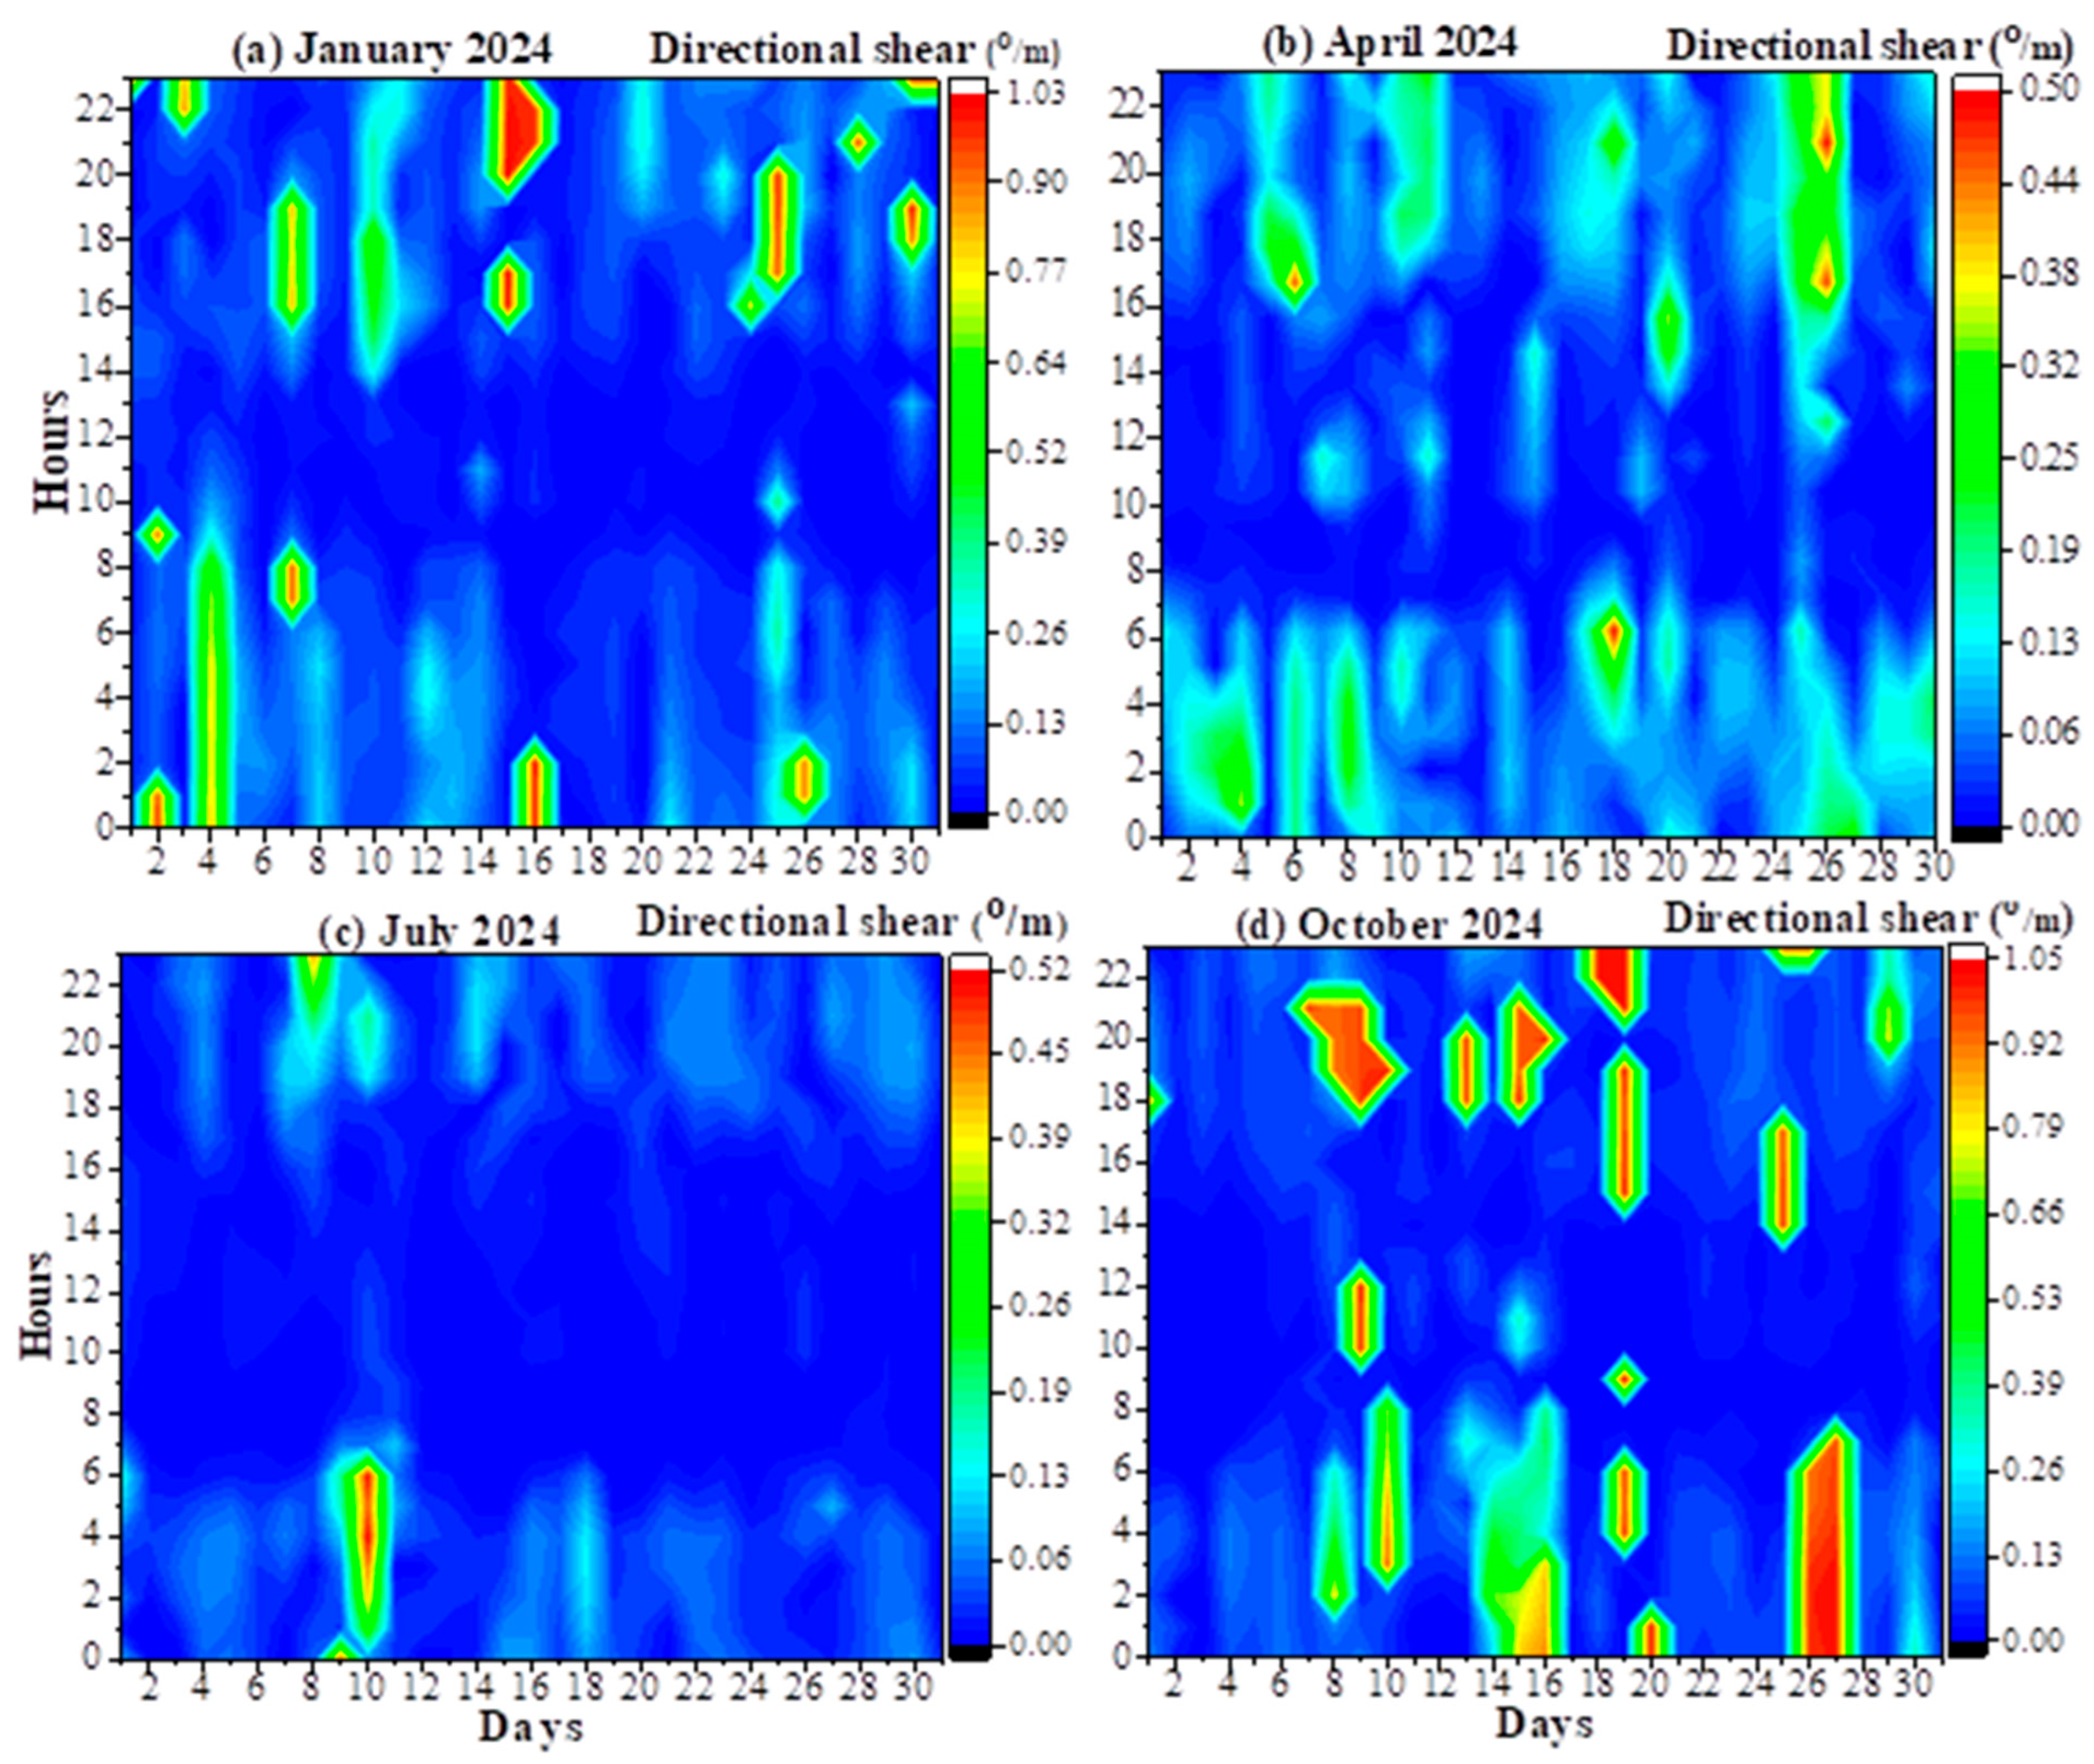
The absolute directional shear change rate was computed using Equation (5), which measures the magnitude of WD change between two vertical levels per unit height, independent of rotation sense. Hourly values were derived and displayed as day–hour contour plots to resolve both diurnal and intra-monthly variability over BIA during selected months of 2024. January (Figure 5a) is characterized by generally weak but persistent directional shear throughout the diurnal cycle. Low shear rates dominate most hours, reflecting relatively stable winter conditions associated with prevailing synoptic-scale westerly flow. Reduced solar heating limits boundary-layer development and turbulent mixing, leading to weaker vertical momentum transport and more uniform wind direction with height. Sporadic localized enhancements occur mainly during late-night to early morning (00–06 am) and evening periods, likely due to nocturnal boundary-layer stability and occasional weak frontal passages. Surface cooling during night-time can create temperature inversions and decouple lower and upper air layers, resulting in temporary directional differences with height. Most values remain below ~0.2 °/m, with intermittent moderate episodes (~0.2–0.45 °/m) and only isolated short-lived peaks reaching ~0.8–0.85 °/m. In April (Figure 5b), directional shear becomes more variable and episodic compared to winter conditions. Moderate to high shear patches appear more frequently, particularly during early morning and afternoon hours. This behavior reflects spring transitional dynamics, where increasing solar heating and changing synoptic conditions enhance atmospheric variability. During the morning, the breakdown of the nocturnal BL and the development of the convective BL promote vertical mixing and momentum exchange, producing rapid directional changes with height. Afternoon surface heating further intensifies turbulence and boundary-layer growth, allowing stronger winds aloft to interact with near-surface flows. In addition, spring frontal systems and pressure-gradient variations over Baghdad contribute to temporal fluctuations in WD. Consequently, absolute shear rates commonly range from ~0.1–0.3 °/m, with localized maxima approaching ~0.4–0.45 °/m, indicating frequent but short-duration directional changes. In July (Figure 5c), the weakest directional shear among all analyzed months was observed, with the contour field dominated by very low values, indicating persistent vertical alignment of WD. This behavior can be attributed to the dominance of the northwesterly Shamal flow associated with subtropical high-pressure systems and the development of a deep, well-mixed convective BL under intense summer heating. Strong daytime turbulent mixing enhances momentum exchange between surface and elevated layers, reducing vertical wind-direction differences and suppressing directional shear. Consequently, most values remained below ~0.1–0.15 °/m, with only a few isolated moderate events during early morning hours, making July the least critical month from an aviation perspective. Finally, October (Figure 5d) displays the strongest and most persistent directional shear activity among the examined months. Numerous elongated regions of moderate to high shear extend across broad portions of the diurnal cycle, particularly during night-time and early morning hours, with several events persisting continuously for multiple hours. This enhanced activity is physically associated with the transition from the stable summer circulation regime toward more dynamic autumn atmospheric conditions. During October, the gradual weakening of the strong summer thermal low over Baghdad and the increasing influence of mid-latitude synoptic systems creates greater variability in wind structure. The increasing frequency of frontal passages, pressure-gradient changes, and upper-level trough disturbances introduces directional differences between near-surface and elevated atmospheric layers. BL processes also play an important role in enhancing the observed shear. During night-time, radiative cooling of the land surface promotes the formation of a stable BL, which suppresses vertical turbulent mixing near the surface. Under these conditions, surface winds tend to weaken due to frictional effects, while winds aloft remain relatively stronger and retain their larger-scale synoptic direction. This vertical decoupling between lower and upper layers enhances directional contrasts and produces stronger directional shear. In addition, the development of nocturnal low-level jets may further intensify the differences between surface and elevated wind directions. During the transition period after sunrise, the growth of the convective BL and intermittent turbulent mixing can create temporary fluctuations in wind direction, leading to localized shear enhancements. Background shear values commonly range between ~0.15 and 0.35 °/m, while many events exceed 0.5 °/m, with pronounced peaks approaching ~0.9–0.95 °/m. Such sustained and intense directional contrasts indicate substantial vertical wind structure variability and can significantly increase turbulence intensity and wind unpredictability during aircraft takeoff and landing phases.
Overall, the directional shear change rate shows a pronounced seasonal signal. July represents the most stable conditions with minimal shear, followed by January with slightly higher but still generally weak values punctuated by occasional winter disturbances. April marks a transitional regime with enhanced temporal variability and frequent moderate shear driven by BL processes. October stands out as the most dynamically unstable month, exhibiting both the highest magnitudes and greatest persistence of directional shear, making it the most critical period for aviation safety considerations.
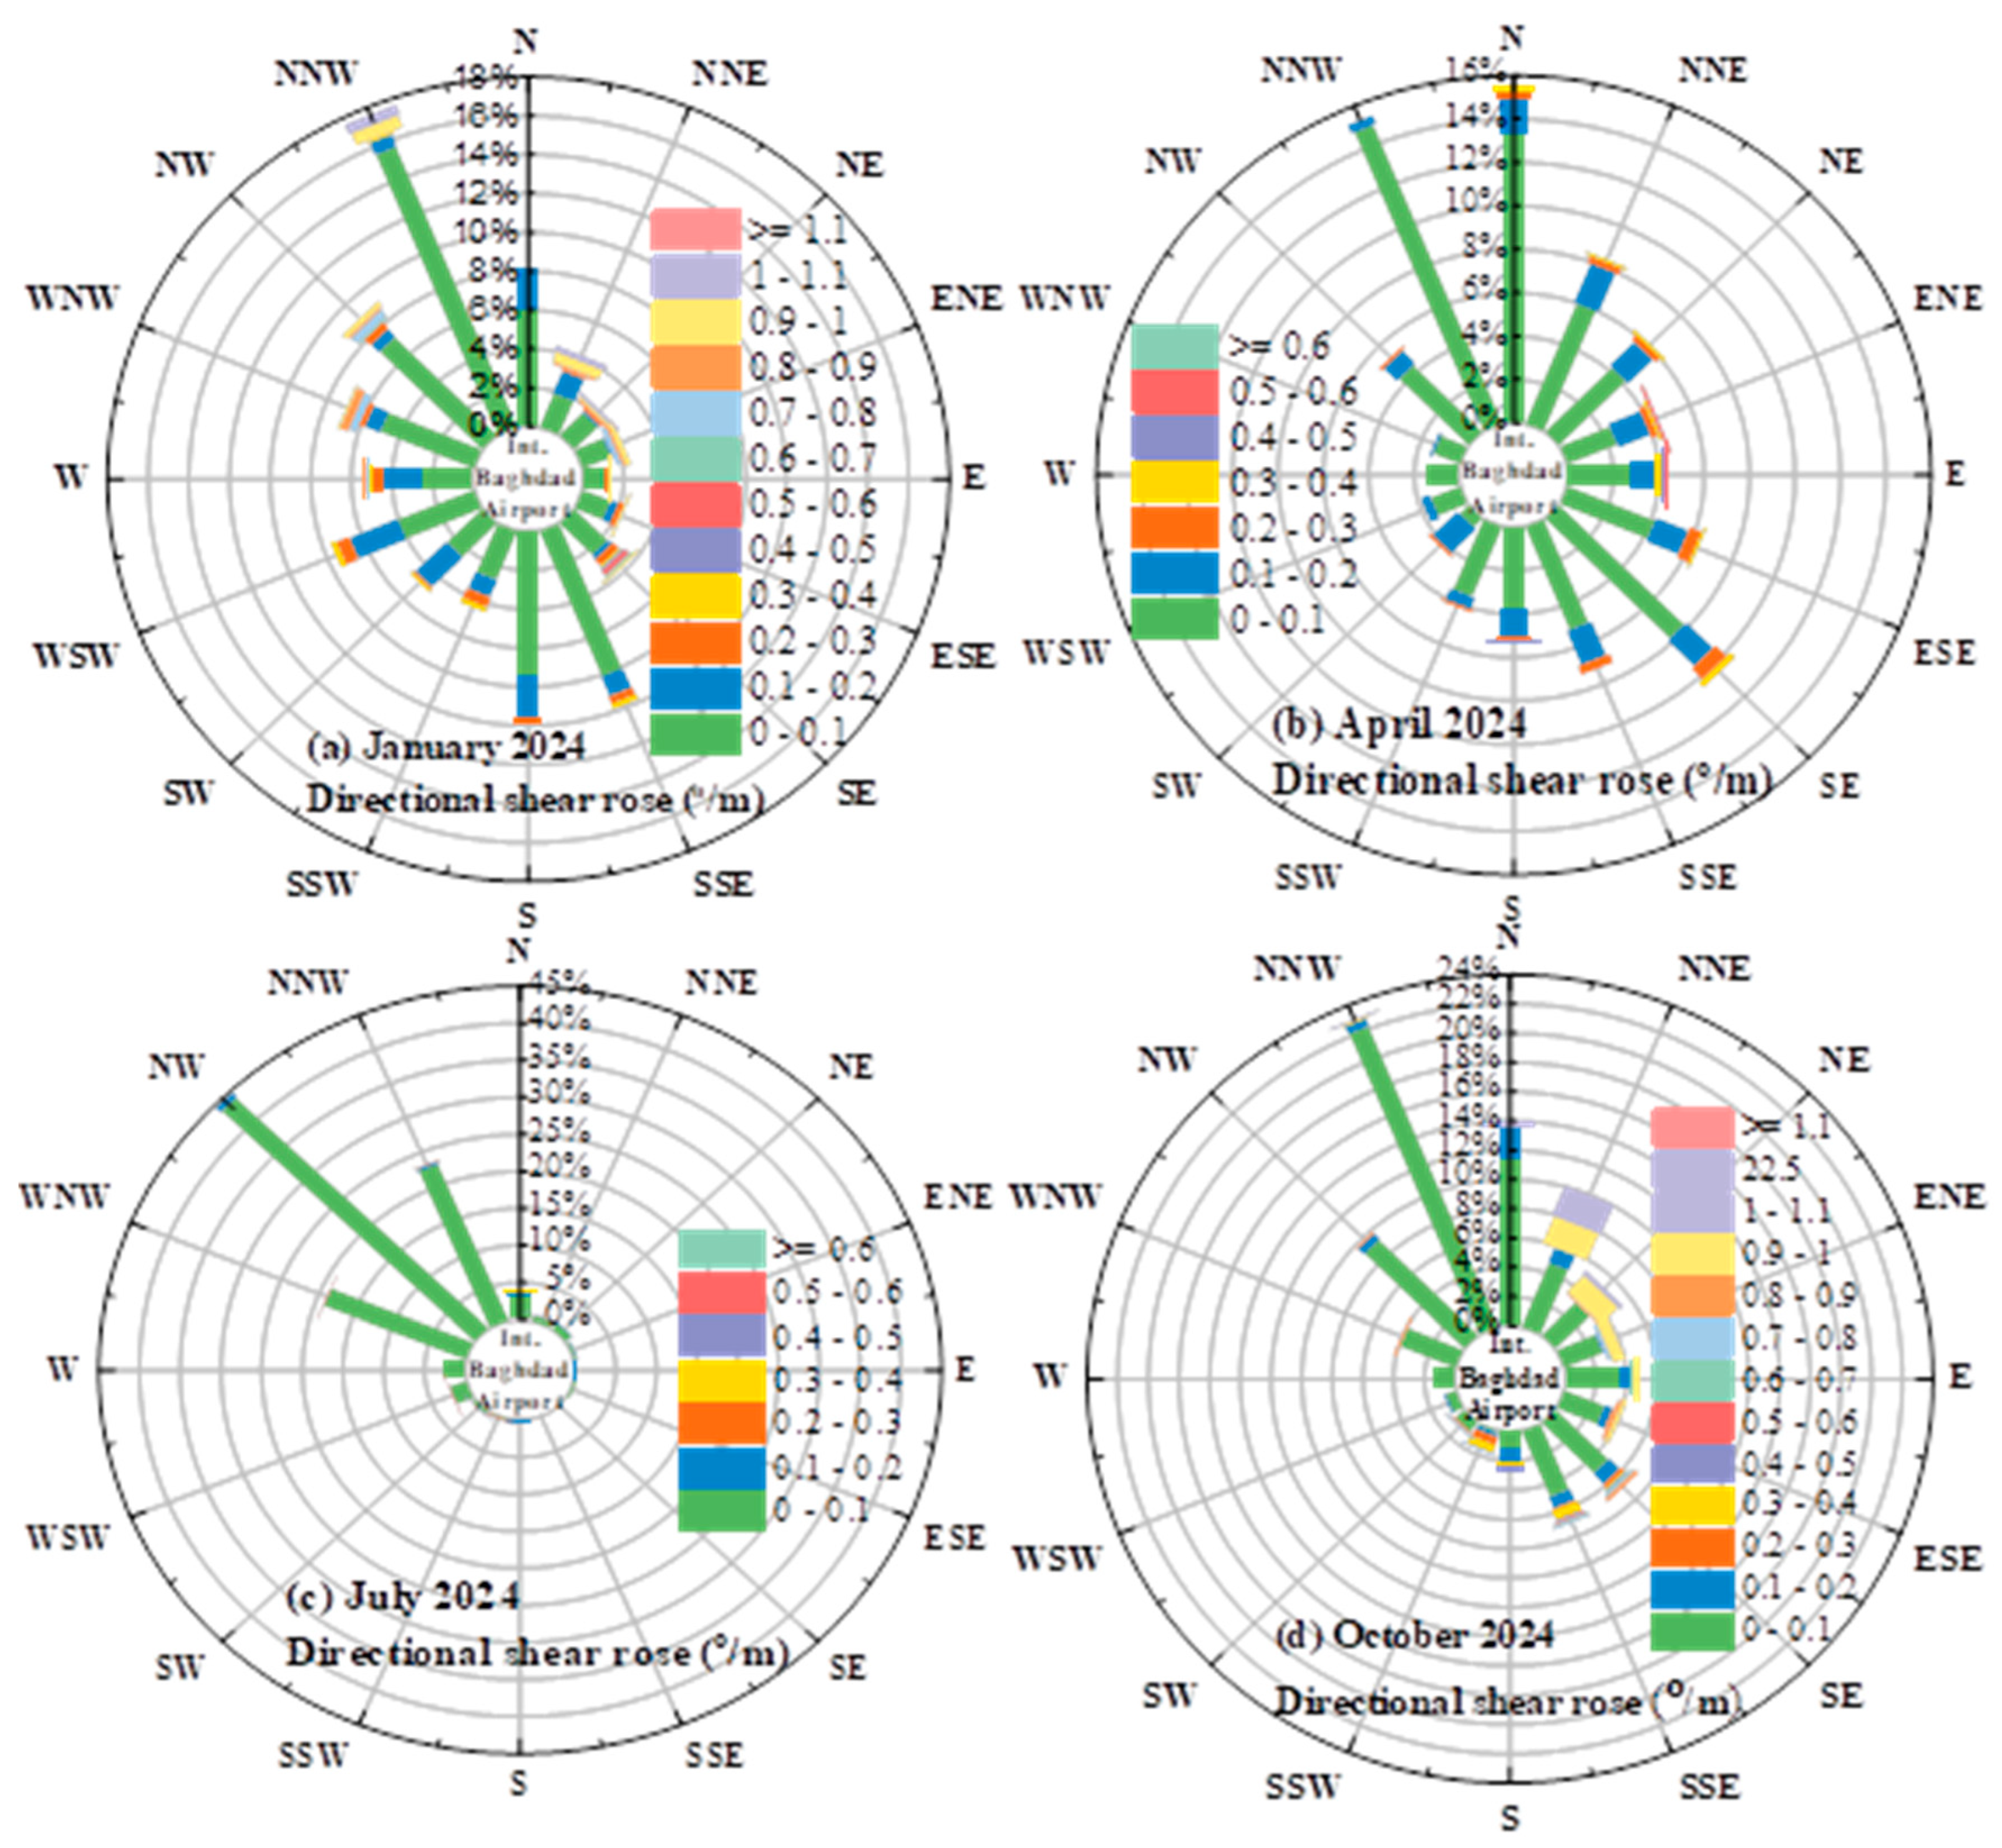
The directional shear roses for Baghdad in 2024 shown in Figure 6 indicate a clear dominance of low directional shear across all analyzed months, implying generally weak vertical wind turning within the lower atmosphere. The two numerical scales displayed in the figure represent different variables: the radial axis values indicate the frequency percentage of wind occurrence for each directional sector, whereas the colored blocks correspond to the normalized values of the associated parameter represented in the legend. In January, as shown in Figure 6a, low shear conditions prevail across nearly all directional sectors, reflecting strong winter synoptic control and vertically coherent flow between 10 and 540 m. This coherence is most pronounced in the northerly and northwesterly sectors, consistent with large-scale westerly circulation that promotes uniform wind direction with height. Moderate and high shear occur only rarely and are confined to isolated sectors, suggesting short-lived disturbances rather than persistent shear-generating processes. During April, low directional shear remains prevalent but spans a broader range of wind directions (Figure 6b), indicating that vertical wind-direction coherence is largely maintained despite the seasonal transition. A slight increase in moderate shear frequency appears, particularly in the northerly and northwesterly sectors, pointing to enhanced but still limited vertical variability associated with evolving synoptic conditions. High shear remains uncommon, confirming that springtime directional changes are generally weak to moderate. From Figure 6c, July displays the most stable directional wind structure of the year, with low shear overwhelmingly concentrated within a narrow directional range. This pattern reflects the dominance of persistent summer circulation over BIA, characterized by steady prevailing winds and minimal vertical turning. The near absence of moderate and high shear highlights a highly uniform vertical wind profile under strong thermal mixing and weak synoptic forcing, making July the period of minimum annual directional shear. In contrast, October shows increased directional variability compared to the other months as illustrated in Figure 6d, although low shear continues to dominate the overall wind regime. Moderate shear becomes more widely distributed across directional sectors, particularly from easterly to northerly flows, indicating the breakdown of summer circulation and the onset of autumn synoptic activity. While high shear remains secondary, its reappearance signals enhanced vertical directional turning during this transitional period.
A pronounced seasonal contrast is evident in the directional shear roses for BIA in 2024, although low directional shear remains dominant throughout the year. January and July exhibit the highest vertical coherence of the wind field: January is characterized by widespread low shear across nearly all directions, particularly in the northerly and northwesterly sectors under strong winter synoptic control, whereas July records the minimum annual shear, with low values confined to a narrow directional range and an almost complete absence of moderate and high shear under persistent summer circulation. April represents a transitional regime, maintaining predominantly weak shear while showing a modest increase in moderate shear frequencies, mainly in northerly sectors. In contrast, October displays the broadest directional spread and a relative increase in moderate shear, especially in easterly and northerly sectors, reflecting the breakdown of summer circulation and the onset of autumn synoptic disturbances.

5. Conclusions

This study investigated the temporal variability of wind direction and vertical directional shear over the BIA in representative months of 2024, using circular wind statistics, directional shear roses and hourly absolute directional shear change rates. The results revealed pronounced seasonal modulation in horizontal WD stability and vertical directional alignment within the lower atmosphere. Summer (July) was identified as the period most favorable for aerodynamic conditions for aviation operations at BIA. Wind direction showed strong persistence (mean σdir < 17°), minimal diurnal variability and weak vertical directional shear, with absolute shear change rates typically below ~0.1–0.15 °/m.
In contrast, the transitional seasons, particularly autumn (October), present the most challenging wind environments. October was characterized by the highest variability in wind direction, reduced directional persistence, and the strongest and most frequent directional shear events. Background shear commonly ranged between ~0.15 and 0.35 °/m, with repeated peaks approaching ~0.9–0.95 °/m, particularly during the night-time and early morning. Winter (January) and spring (April) represent intermediate regimes. January generally exhibited coherent wind profiles with low background shear (<~0.2 °/m), although isolated high-shear episodes were observed during synoptic disturbances. April showed increased variability due to transitional dynamics and boundary-layer mixing, with moderate directional shear frequently occurring in the range of ~0.1–0.3 °/m. These conditions may lead to intermittent approach instability, particularly during periods of strong diurnal forcing or rapidly evolving weather systems.
Across all months, low directional shear was the dominant condition, indicating that the lower atmosphere over Baghdad is usually characterized by weak vertical wind shear. However, the episodic intensification of directional shear during transitional seasons highlights the importance of continuous monitoring. Incorporating directional shear diagnostics into routine forecasting, approach planning and pilot briefings—particularly during autumn and spring—can enhance situational awareness and mitigate potential approach instability. Overall, combining circular wind statistics and directional shear metrics provides a robust framework for identifying critical wind regimes for aviation in arid environments. It should be noted that this study is based on observations from 2024 only. While multi-year datasets are more suitable for evaluating climatological variability, the present study focuses on low-level wind shear events, which are rapidly evolving microscale phenomena occurring over short timescales. Therefore, the analysis aims to characterize event behavior within the selected period rather than establish long-term climatological trends. Future studies incorporating multiple years of observations would further improve the assessment of interannual variability.

Author Contributions

T.A.-R. and M.H.A.-J.: Conceptualization, methodology, data curation, visualization, formal analysis, writing original draft and review; O.T.A.-T.: Editing and supervision. All authors have read and agreed to the published version of the manuscript.

Funding

This research received no external funding.

Institutional Review Board Statement

Not applicable.

Informed Consent Statement

Not applicable.

Data Availability Statement

The original contributions presented in this study are included in the article. Further inquiries can be directed to the corresponding author.

Acknowledgments

The authors are grateful to Mustansiriyah University for acceptance of this work. The authors also thank the anonymous reviewers for their constructive comments for improvement of the paper.

Conflicts of Interest

The authors declare no conflict of interest.

References

  1. Stull, R.B. An Introduction to Boundary Layer Meteorology; Springer: Dordrecht, The Netherland, 1988. [Google Scholar]
  2. Kahsay, M.B.; Enday, P.G.; Kiross, H.A.; Nurhussien, F.F.; Mahmud, A.M. Analysis of turbulence and wind shear characteristics in the Hilly Terrain of the Geba Catchment Tigray, North Ethiopia. Atmosphere 2025, 16, 1374. [Google Scholar] [CrossRef] [Scilit]
  3. US Department of Transportation. Aviation Weather Handbook; Federal Aviation Administration: New York, NY, USA, 2022.
  4. Wu, J.; Shi, Z.; Lu, M.; Li, X.; Zhang, T.; Luo, W. Comparative study of low-level wind fields characteristics at two critical locations in the terminal area of Plateau Mountain Airports During the dry-season using coherent doppler wind lidars. Remote Sens. 2026, 18, 1224. [Google Scholar] [CrossRef] [Scilit]
  5. International Civil Aviation Organization (ICAO). Manual on Low-Level Wind Shear, 1st ed.; WMO 9817; Document Sales Unit: Montréal, QC, Canada, 2005. [Google Scholar]
  6. Chan, P.W.; Lai, K.K.; Li, Q.S. High-resolution simulation of a severe case of low-level windshear at the Hong Kong International Airport: Turbulence intensity and sensitivity to turbulence parameterization scheme. Atmos. Sci. Lett. 2022, 23, e1090. [Google Scholar] [CrossRef] [Scilit]
  7. WMO. Aviation-Hazards-Turbulence and Wind Shear. 2026. Available online: https://community.wmo.int/site/knowledge-hub (accessed on 14 May 2026).
  8. Ryan, M.; Saputro, A.H.; Sopaheluwakan, A. Review of low-level wind shear: Detection and prediction. In Proceedings of the 3rd International Seminar of Science and Technology, Palu, Indonesia, 19 October 2023. [Google Scholar]
  9. Mohsen, A.A.; Al-Jiboori, M.H.; Al-Timimi, Y.K. Investigating the aerodynamic surface roughness length over Baghdad city utilizing remote sensing and GIS techniques. Baghdad Sci. J. 2021, 18, 35. [Google Scholar] [CrossRef] [Scilit]
  10. Mohowes, Z.T.; Al-Jiboori, M.H. Assessing urbanization in the surroundings of International Baghdad Airport using Landsat data. In IOP Conference Series: Earth and Environmental Science; IOP Publishing: Bristol, UK, 2023. [Google Scholar]
  11. Stull, R. Practical Meteorology: An Algebra-Based Survey of Atmospheric Science; Sundog Publishing, LLC: Vancouver, BC, Canada, 2018. [Google Scholar]
  12. Mahrt, L. Surface wind direction variability. J. Appl. Meteorol. Climatol. 2011, 50, 144–152. [Google Scholar] [CrossRef] [Scilit]
  13. Gomez, M.S.; Lundquist, J.K. The effect of wind direction shear on turbine performance in a wind farm in central Iowa. Wind Energy Sci. 2020, 5, 125–139. [Google Scholar] [CrossRef] [Scilit]
  14. Bretschneider, L.; Hankers, R.; Schönhals, S.; Heimann, J.-M.; Lampert, A. Wind Shear of Low-Level Jets and Their Influence on Manned and Unmanned Fixed-Wing Aircraft during Landing Approach. Atmosphere 2022, 13, 35. [Google Scholar]
  15. Zamreeg, A.O.; Hasanean, H.M. Windshear analysis over six airports in Saudi Arabia. Discov. Sustain. 2024, 5, 233. [Google Scholar] [CrossRef] [Scilit]
  16. Salih, A.A.A.; Zhahir, A.; Hashim, S.J.B.; Ahmad, M.T. Review and evaluation of the performance and limitations of aircraft landing systems. J. Aeronaut. Astronaut. Aviat. 2025, 57, 1845–1861. [Google Scholar]
  17. Erdoğan, M.Y.; Yavuz, V.; Kara, Y. Characterization of convective weather and atmospheric environments over Turkish airports. Acta Geophys. 2026, 74, 130. [Google Scholar] [CrossRef] [Scilit]
  18. Al-Jiboori, M.H.; Mohowes, Z.T. Impact of built-up areas surroundings the International Baghdad Airport on aviation meteorology. Environ. Prot. Nat. Resour. 2023, 34, 1–8. [Google Scholar] [CrossRef] [Scilit]
  19. Al-Rbayee, T.; Al-Jiboori, M.H.; Al-Taai, O.T. Some statistical wind speed characteristics and low-level wind shear over international baghdad airport. J. Aeronaut. Astronaut. Aviat. 2025, 57, 1923–1935. [Google Scholar]
  20. Haraj, S.A.; Al-Jiboori, M.H. Study of aerodynamic surface roughness for Baghdad City using signal-level measurements. Baghdad Sci. J. 2019, 16, 215–220. [Google Scholar] [CrossRef] [Scilit]
  21. Mishaal, A.K.; Ali, A.M.A.; Khamees, A.B. Wind distribution map of Iraq—A comparative study. In Proceedings of the 2nd International Scientific Conference of Al-Ayen University, Thi-Qar, Iraq, 15–16 July 2020. [Google Scholar]
  22. Hersbach, H.; Bell, B.; Berrisford, P.; Hirahara, S.; Horányi, A.; Muñoz-Sabater, J.; Nicolas, J.; Peubey, C.; Radu, R.; Schepers, D.; et al. The ERA5 global reanalysis. Q. J. R. Meteorol. Soc. 2020, 146, 1999–2049. [Google Scholar] [CrossRef] [Scilit]
  23. Al-Jiboori, M.H.; Abu-Shaeer, M.J.; Ahmed, M.M. Impact of land surface changes on air temperatures in Baghdad. Kuwait J. Sci. 2019, 47, 118–126. [Google Scholar]
  24. Schober, P.; Boer, C.; Schwarte, L.A. Correlation coefficients: Appropriate use and interpretation. Anesth. Analg. 2018, 126, 1763–1768. [Google Scholar] [CrossRef] [Scilit] [PubMed]
  25. Archer, C.L. Brief communication: A note on the variance of wind speed and turbulence intensity. Wind Energy Sci. 2025, 10, 1433–1438. [Google Scholar] [CrossRef] [Scilit]
Figure 1. Study area of the paper. (A) Map of Iraq, (B) Baghdad province, (C) BIA, and (D) its photograph.
Wind 06 00037 g001
Figure 2. Comparison of hourly WD observed at the Baghdad station and ERA5 reanalysis at 10 m in four months (a) January, (b) April, (c) July, and (d) October; diagonal lines indicate perfect agreement.
Wind 06 00037 g002
Figure 3. Temporal variation of WD at 10 and 540 m in (a) January, (b) April, (c) July, and (d) October.
Wind 06 00037 g003
Figure 4. Daily variation of σdir at 10 and 540 m in (a) January, (b) April, (c) July, and (d) October.
Wind 06 00037 g004
Figure 5. Hourly variation of directional shear change rate in (a) January, (b) April, (c) July, and (d) October.
Wind 06 00037 g005
Figure 6. Variations of directional shear change rate roses at (a) January, (b) April, (c) July, and (d) October over IBA.
Wind 06 00037 g006
Table 1. r values and p-values for hourly WD comparing BIA station observations with ERA5 10 m data.
Statistical ValidationJanuaryAprilJulyOctoberAnnual
R0.790.640.620.840.72
p-value2.2 × 10−72.5 × 10−85.2 × 10−84.8 × 10−115.5 × 10⁻⁷
Table 2. Minimum, maximum, and average σdir in studied months of 2024 in BIA.
MonthsJanuaryAprilJulyOctober
Statistics 10 m540 m10 m540 m10 m540 m10 m540 m
Minimum2.86.17.17.23.54.34.66.8
Maximum100.3108.5110.976.0715084.892.4
Average σdir38.531.033.929.116.815.427.733.4
Disclaimer/Publisher’s Note: The statements, opinions and data contained in all publications are solely those of the individual author(s) and contributor(s) and not of MDPI and/or the editor(s). MDPI and/or the editor(s) disclaim responsibility for any injury to people or property resulting from any ideas, methods, instructions or products referred to in the content.