


Abstract
Wind is a significant contributor to global energy requirement, with technological advancements in this industry enabling its rapid growth over the last few decades. The rise in demand for clean energy provides the driving factor to make wind more efficient and widespread. One such solution involves mitigating the aerodynamic noise of wind turbine rotors to harness untapped energy and improve turbine efficiency. Quieter wind turbines gain community acceptance, promoting their widespread application. This article explores passive compliant coatings applied to a flat plate under fully turbulent conditions through Computational Fluid Dynamics (CFD) and wind tunnel testing. It extends prior flat plate investigations by evaluating the noise mitigation potential of passive compliant coatings in the context of wind turbine trailing edge (TE) noise. Two coatings with distinct material properties were investigated through Computational Aeroacoustics Analysis (CAA) and Fluid–Structure Interaction (FSI). While coating-1 (Dow Corning Silastic S-2) increased the overall sound pressure level (OASPL) by 2.89 dB, coating-2 (Dow Corning Sylgard 184) reduced TE noise by 2–4 dB/Hz between 600 and 1575 Hz and lowered the OASPL by 1.85 dB. Within the two configurations investigated, the differences in noise mitigation characteristics may be attributed to variations in coating stiffness and geometric compliance. Based on these simulations, wind tunnel tests were conducted to record noise measurements using coating-2 which revealed a 3.23 dB OASPL reduction, suggesting its suitability for wind turbine noise mitigation applications.
1. Introduction
Wind has long been harnessed and converted into useful forms of energy, with evidence of primitive windmills traced back to ancient civilizations [1]. In the late 19th century, Charles F. Brush, an Ohio-based engineer, designed the first wind turbine with 144 wooden slats to generate a power of 12 kW [2]. In 1891, Poul la Cour developed a horizontal-axis wind turbine rated at 18 kW in Askov, Denmark [3]. He also played a key role in establishing the Danish Wind Electricity Company, which led to the installation of approximately 120 wind turbines in Denmark in the early 20th century [4].
In 1920, Albert Betz, director of the Aerodynamic Research Institute (Aerodynamische Versuchsantalt) in Göttingen, Germany, demonstrated that the maximum theoretical efficiency of a wind turbine is limited to 59.3% of the kinetic energy in the wind [5]. A decade later, in 1931, the French aeronautical engineer Georges Darrieus introduced the vertical-axis Darrieus turbine [6]. In 1958, Ulrich Hütter developed the W-34 turbine, featuring a 34 m rotor and a rated power of 100 kW, which was erected near Stuttgart, Germany [5]. Over subsequent decades, wind technology evolved steadily.
The 1973 oil crisis served as a turning point, prompting both Europe and the United States to recognize the need for energy diversification and invest in wind turbine research and development [7]. Subsequently, the National Aeronautics and Space Administration (NASA) introduced the 2 MW MOD-1 wind turbine, but its downwind design generated thumping sounds and led to noise complaints [8]. To address this, the MOD-2 turbines were designed with upwind configuration [9]. In the 1980s, technology transferred from research laboratories to the commercial sectors, with development of wind farms in California, USA [10]. Research at the National Renewable Energy Laboratory (NREL) and the Sandia National Laboratories (SNL) further advanced wind turbine design through efficient airfoil development, wind tunnel studies of three-dimensional aerodynamics, and the adoption of lightweight and high-strength composite blades [11]. By 2019, the rotor blade and tower height had doubled, increasing the swept area and aerodynamic efficiency, though longer blades led to increased turbine noise [12]. In 2024, the global wind power capacity expanded by 117 GW, with 109 GW from onshore projects, reaching 1136 GW in total. This was driven largely by the Asia-Pacific region, which accounted for 75% of the global market share. China, the USA, Germany, India and Brazil are the leading markets for new installations [13].
Wind energy currently reduces greenhouse gas emissions by over a billion tons per year [14]. The rise in demand for a clean alternative to oil is driving efforts to make wind turbines more efficient and widespread. A key challenge in this regard is mitigating turbine noise, which may harness untapped energy and improve turbine efficiency. Moreover, quieter wind turbines also gain community acceptance, promoting their widespread application.
1.1. Wind Farm Noise
Noise generated from multiple wind turbines interacts and superposes with each other, resulting in complex wind farm noise [15], which is perceived as a humming or whistling sound. A recent survey identified wind farm noise in the range of 33.7–49.9 dB as the most annoying noise source, reported by 65.2% of respondents, which exceeded noise from road traffic, power tools, and agricultural machinery. The annoyance is attributed to amplitude modulation (AM), tonal characteristics, and the persistent nature of noise during day and night [8].
While some research suggests adverse health impacts from low-frequency noise and infrasound generated by wind farms [16], studies by the National Institute of Public Health and the Environment and Mundovo Sound Research in the Netherlands report no unique health risks compared to other sound frequencies with respect to the audible range. Evidence on health impacts such as cardiovascular and metabolic effects are also inconsistent. However, their studies agree that there is a strong link between turbine noise and annoyance [17].
Even when wind farms meet acoustic compliance standards, residents living nearby may experience annoyance and sleep disturbance. This is because measuring wind farm noise compliance is challenging and is attributed to background noise measurements, which vary with wind speeds and can mask turbine noise [9]. Research in Australia and New Zealand indicates that wind farm noise can cause symptoms severe enough for residents to adopt noise-abatement measures, such as sound insulation, and in extreme cases, vacate their residences [18].
1.2. Wind Turbine Noise Mechanisms
Wind turbine noise is broadly classified into mechanical and aerodynamic noise. Mechanical noise originates from the relative motion of various components. The gearbox, cooling fans and generator are its primary contributors, which have been reduced through vibration isolation of parts, damping of transmission paths and replacing spur gears with quieter helical gears [19].
Aerodynamic noise is a major noise source. It may occur as tonal noise arising from displacement of air due to blade rotation, or as broadband noise when turbulent air interacts with the blade surface. It is further classified into inflow turbulence noise, laminar boundary layer vortex shedding noise, trailing edge (TE) noise, tip noise and stalled flow noise. Among the different noise sources, TE noise is considered dominant in modern wind turbines [20].
1.3. Wind Turbine Flow Control and Noise Mitigation
1.3.1. Trailing Edge (TE) Serrations
Oerlemans et al. [21] evaluated the noise mitigation capabilities of TE serrations on a 2.3 MW wind turbine with a 94 m rotor and observed a 3.2 dB noise reduction. Further, optimization studies were conducted on a Siemens airfoil in an acoustic wind tunnel to examine the effects of TE serration design parameters, such as tooth length and aspect ratio [22]. Serrations with optimum parameters resulted in an additional noise reduction of 1.1 dB. Avallone et al. [23] examined the noise reduction potential of combed tooth serrations applied to a NACA 0018 airfoil. The comb structure reduced wake formation between serrations and further lowered noise by 3 dB compared to conventional saw tooth serrations. Further computational analyses using curved TE serrations showed an additional 2 dB noise reduction [24].
1.3.2. TE Brushes
Finez et al. [25] investigated the noise reduction achieved using TE brushes applied to the NACA 65(12)-10 airfoil in an anechoic chamber at the Laboratoire de Mécanique des Fluides et d’Acoustique (LMFA). Their experiments showed that the brushes weakened turbulence in the wake downstream of the TE, resulting in noise reductions approaching 3 dB in the 600–2000 Hz range. Herr and Dobrzynski [26] conducted experiments in an open jet anechoic test facility of Deutsches Zentrum für Luft- und Raumfahrt (DLR) aeroacoustic wind tunnel, Braunschweig (AWB), to evaluate brush length and fiber diameter. The brush edges lowered turbulent boundary layer TE noise by about 2 dB and TE bluntness noise by approximately 14 dB.
1.3.3. Porous Airfoil
Geyer et al. [27] showed that porous airfoils were capable of reducing noise by as much as 10 dB within the lower and intermediate frequency range of the noise spectrum. In contrast, the increased surface roughness of the porous airfoil resulted in higher noise levels at high frequencies.
1.3.4. Surface Treatment
Clark et al. [28] tested finlets in a stability wind tunnel at Virginia Tech and observed that TE noise decreased by as much as 10 dB, as the finlets promoted the breakdown of turbulence in the boundary layer.
1.3.5. Vortex Generators and Riblets
Wetzel and Farokhi [29] conducted wind tunnel tests to evaluate the effectiveness of vortex generators on the S807 airfoil under clean and rough surface conditions. Vortex generators produce streamwise vortices that energize the flow boundary layer and delay separation. Their studies revealed that vortex generators restored 10–15% of the lift coefficient lost due to surface roughness and increased the stall angle from 13° to 17–18°. However, these gains were accompanied by increased drag. Thus, further studies [30] incorporated V-groove riblets as a passive drag reduction technique which could reduce airfoil drag by up to 5% when oriented 45° downstream of the vortex generators.
1.3.6. Active Flow Control (AFC)
The effects of AFC were evaluated by the Institute of Aerodynamics and Gas Dynamics (IAG) [31] using boundary layer suction on a NACA 643-418 airfoil. The AFC system reduced flow disturbances near the airfoil and achieved a noise reduction of 3.5 dB. The approach was further applied to the N117 turbine [32], reducing noise by 3.6 dB while increasing the rotor power by 4.75%. Increasing the pump power further reduced noise up to 5 dB. However, further noise reduction was achieved at the expense of aerodynamic performance.
1.4. Passive Compliant Coatings
Passive compliant coatings are bio-inspired designs modeled after the dolphin’s epidermis [33]. They have been studied for their ability to modify the boundary layer, delaying laminar–turbulent transition [34] and reducing skin friction in turbulent flow.
Choi et al. [35] performed tests on compliant coatings in hydrodynamic flow conditions and found that the coatings reduced turbulence intensity by 5% and lowered drag by 7%. Similar investigations were also extended to aerodynamic flow conditions. Studies at Johns Hopkins University in their low-turbulence wind tunnel demonstrated that compliant coatings could relaminarize the boundary layer on a flat plate [36]. Boiko et al. [37] reported a 4–5% drag reduction in wind tunnel tests using Dow Corning Silastic S-2, a compliant coating based on polydimethylsiloxane. Further, Lee, Fisher and Schwarz [38] found that Dow Corning Sylgard 184, another coating based on polydimethylsiloxane, reduced flow disturbances by 40% and suppressed the Tollmien-Schlichting instabilities (TSI).
Extending insights from earlier studies, the mechanism that enables compliant coatings to reduce turbulent drag has the potential to influence flow-induced noise. When flow interacts with a compliant-coated surface, the coating deforms to damp turbulent stresses and reduce turbulent kinetic energy (TKE) in the boundary layer. This behavior depends on coating stiffness, geometric compliance, Reynolds number, and freestream turbulence, leading to reductions in drag and noise.
Passive compliant coatings offer a practical and low-cost alternative to other noise mitigation techniques. Their simplicity and compatibility with other noise mitigation techniques make them promising candidates for large-scale wind turbine applications.
From the literature, passive compliant coatings have primarily been investigated for their ability to favorably modulate flow behavior and reduce drag. However, their potential to mitigate flow-induced noise, particularly in the context of wind turbine applications, remains largely unexplored. In prior work by Giridhar et al. [39], preliminary investigations examined the influence of two compliant coatings on flat plate noise characteristics. The present study extends that work by evaluating the noise mitigation potential of these coatings in the context of wind turbine noise. Computational modeling was performed using Fluid–Structure Interaction (FSI) to simulate coating deformation, and noise characteristics were evaluated through Computational Aeroacoustics Analyses (CAA). The coating exhibiting comparatively favorable performance was subsequently validated through wind tunnel testing at the University of Kansas.
2. Materials and Methods
CFD simulations were first performed to investigate two compliant coatings with distinct material properties and their influence on TE noise. The study was organized as follows.
2.1. Validation
As shown in Figure 1, a flat plate under fully turbulent conditions was analyzed in the present study. The plate has a 200 mm chord, 5 mm thickness, 2.5 mm leading-edge (LE) radius and 12° TE apex angle. Farfield noise predictions were compared with experimental data from Moreau et al. [40] and prior computational predictions to validate the CFD method.
Figure 1.
Flat plate used for validation (All dimensions are in mm).
The computational geometry was created using the 3D-CAD Modeler within STAR-CCM+ v15.02.009, a CFD software package. The CAD drawings presented in this paper were generated using Onshape v1.214, a CAD software package, for illustration purposes only.
The semi-circular LE trips the flow boundary layer, promoting fully turbulent flow over the flat plate. For these conditions, the SST k-ω RANS model with near-wall y+ treatment, which accurately predicts viscous flow behavior [41], was used for steady-state CFD initialization. The segregated flow solver in STAR-CCM+ with the pressure-based SIMPLE algorithm was used. The ideal gas equation was used to determine air density. Convective terms in the conservation of energy equation were discretized with the third order MUSCL scheme. The k and ω transport equations were discretized using a second order upwind scheme.
The SST k-ω IDDES model [42], which captures flow unsteadiness more effectively than the SST k–ω RANS turbulence model, was used for the unsteady CFD simulations. An adaptive time step control determined the time step size, with a minimum value of 1 × 10⁻⁷ s and 30 sub-iterations per time step. The time step was adjusted such that CFLMEAN < 0.5 and CFLMAX < 1.0. The unsteady simulation was run for 0.084 s. This duration corresponded to the time required for the flow to pass through a domain of 14.5 chord lengths. A second-order temporal scheme was applied. Near-wake flow characteristics predicted 0.6 mm downstream of the TE were compared with experimental data and previous computational results.
The Ffowcs Williams–Hawkings (FW-H) acoustic analogy with Farassat’s Formulation 1-A was used to predict farfield noise due to its proven accuracy [43]. Moreau et al. [40] conducted experiments on a flat plate under fully turbulent conditions in an anechoic test facility effective above 250 Hz. Farfield noise was recorded up to 8000 Hz using a microphone placed 0.585 m above the TE. Consistent with their setup, pressure fluctuations were sampled at the same location in the present CFD analysis from 0.042 to 0.084 s. This data was processed using discrete fourier transform to obtain the power spectral density.
The power spectral density is given by
where is the reference acoustic pressure for air (20 µPa).
The sampling period was divided into three analysis blocks, providing a frequency resolution of 75 Hz up to 8000 Hz. A Hann window with 50% overlap was applied to minimize spectral leakage [44]. The overall sound pressure level (OASPL) was obtained by integrating the power spectral density over frequency using the trapezoidal method.
OASPL is defined as
where
and
2.2. Baseline
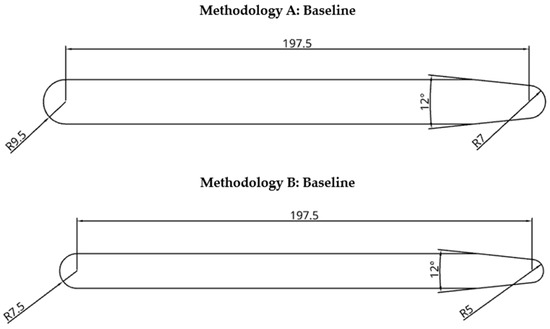
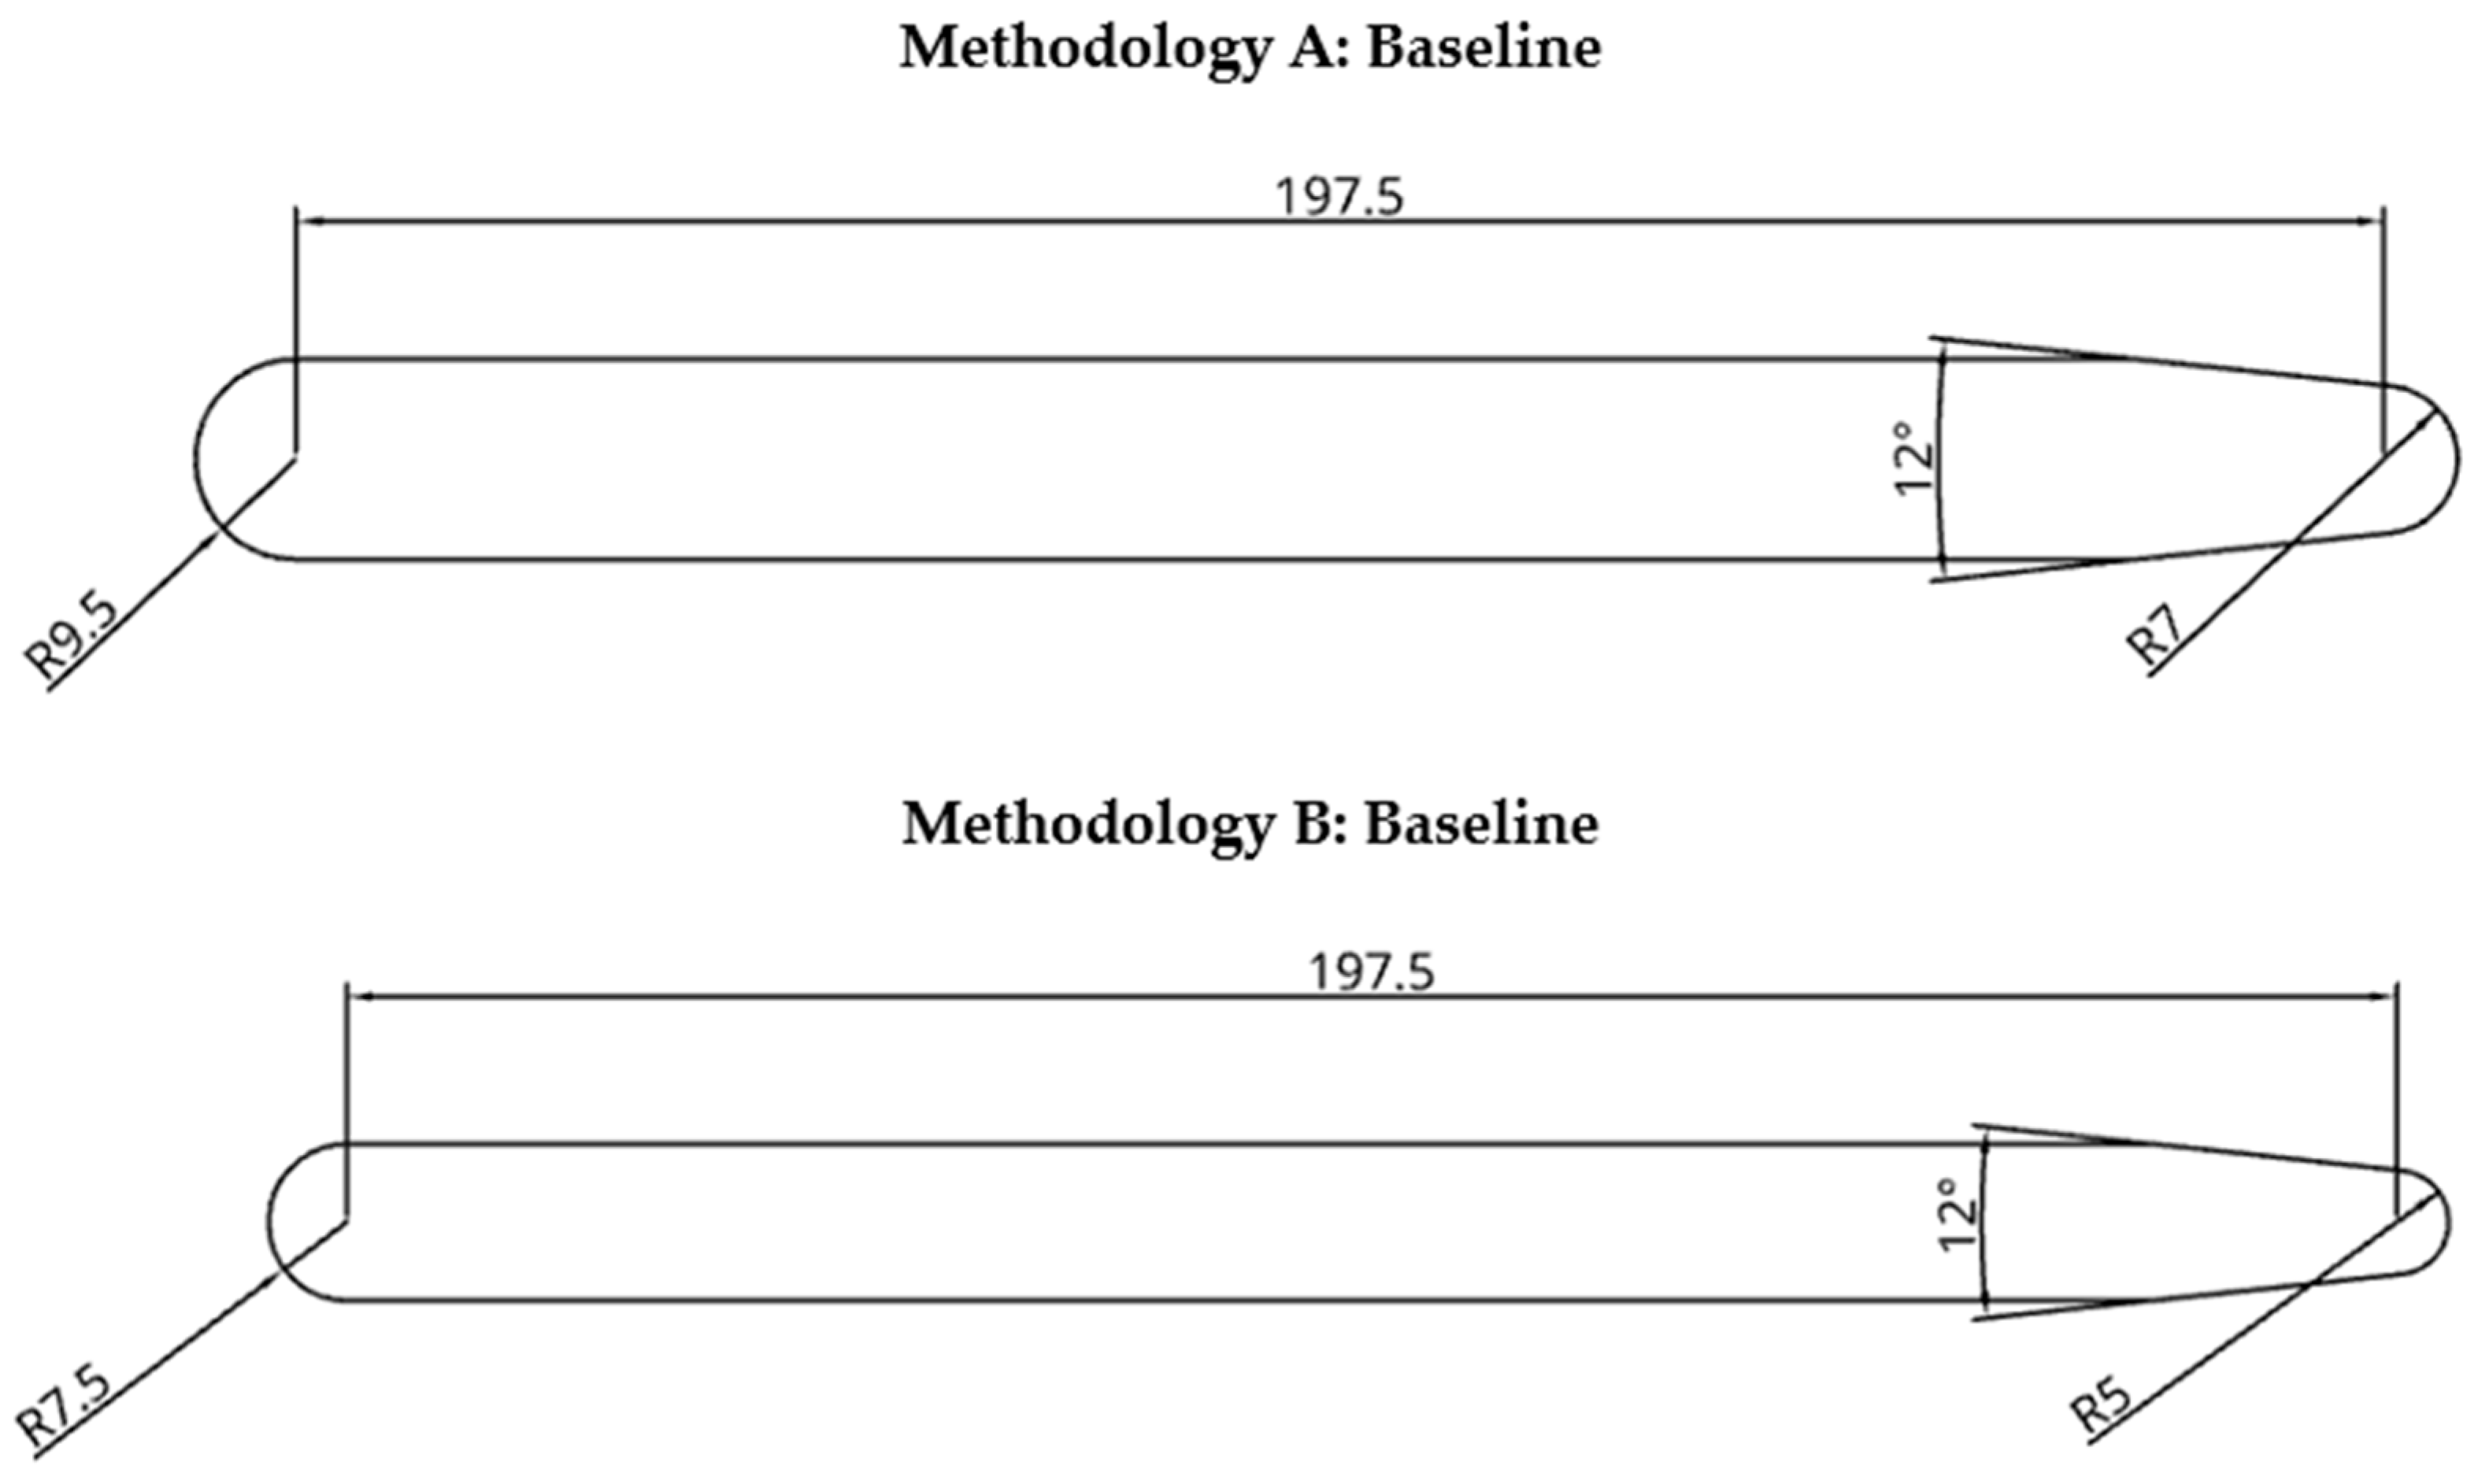
When the flat plate shown in Figure 1 has the coating applied on its surface, its outer geometry and TE shape are altered. This change affects its aerodynamic performance. To account for this, a rigid flat plate model with the same outer profile as the coated plate was introduced. This flat plate with rounded TE, as shown in Figure 2, served as a baseline. Two baseline cases were considered, corresponding to two coatings with distinct thicknesses and material properties. Baseline farfield noise predictions served as a reference for comparison with the coated flat plates.
Figure 2.
Baseline flat plate. (All dimensions are in mm.)
The unsteady CFD simulations for the baseline cases were performed using a time step of 5 × 10⁻⁶ s with 28 sub-iterations per time step, which ensured residual convergence to the order of 10−10 for continuity, 10−9 for momentum, and 10−7 for energy at each time step.
2.3. Flat Plate with Compliant Coating
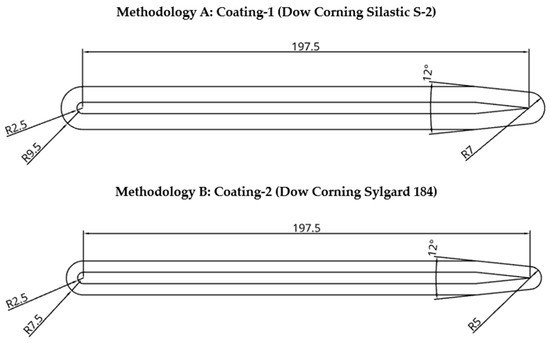
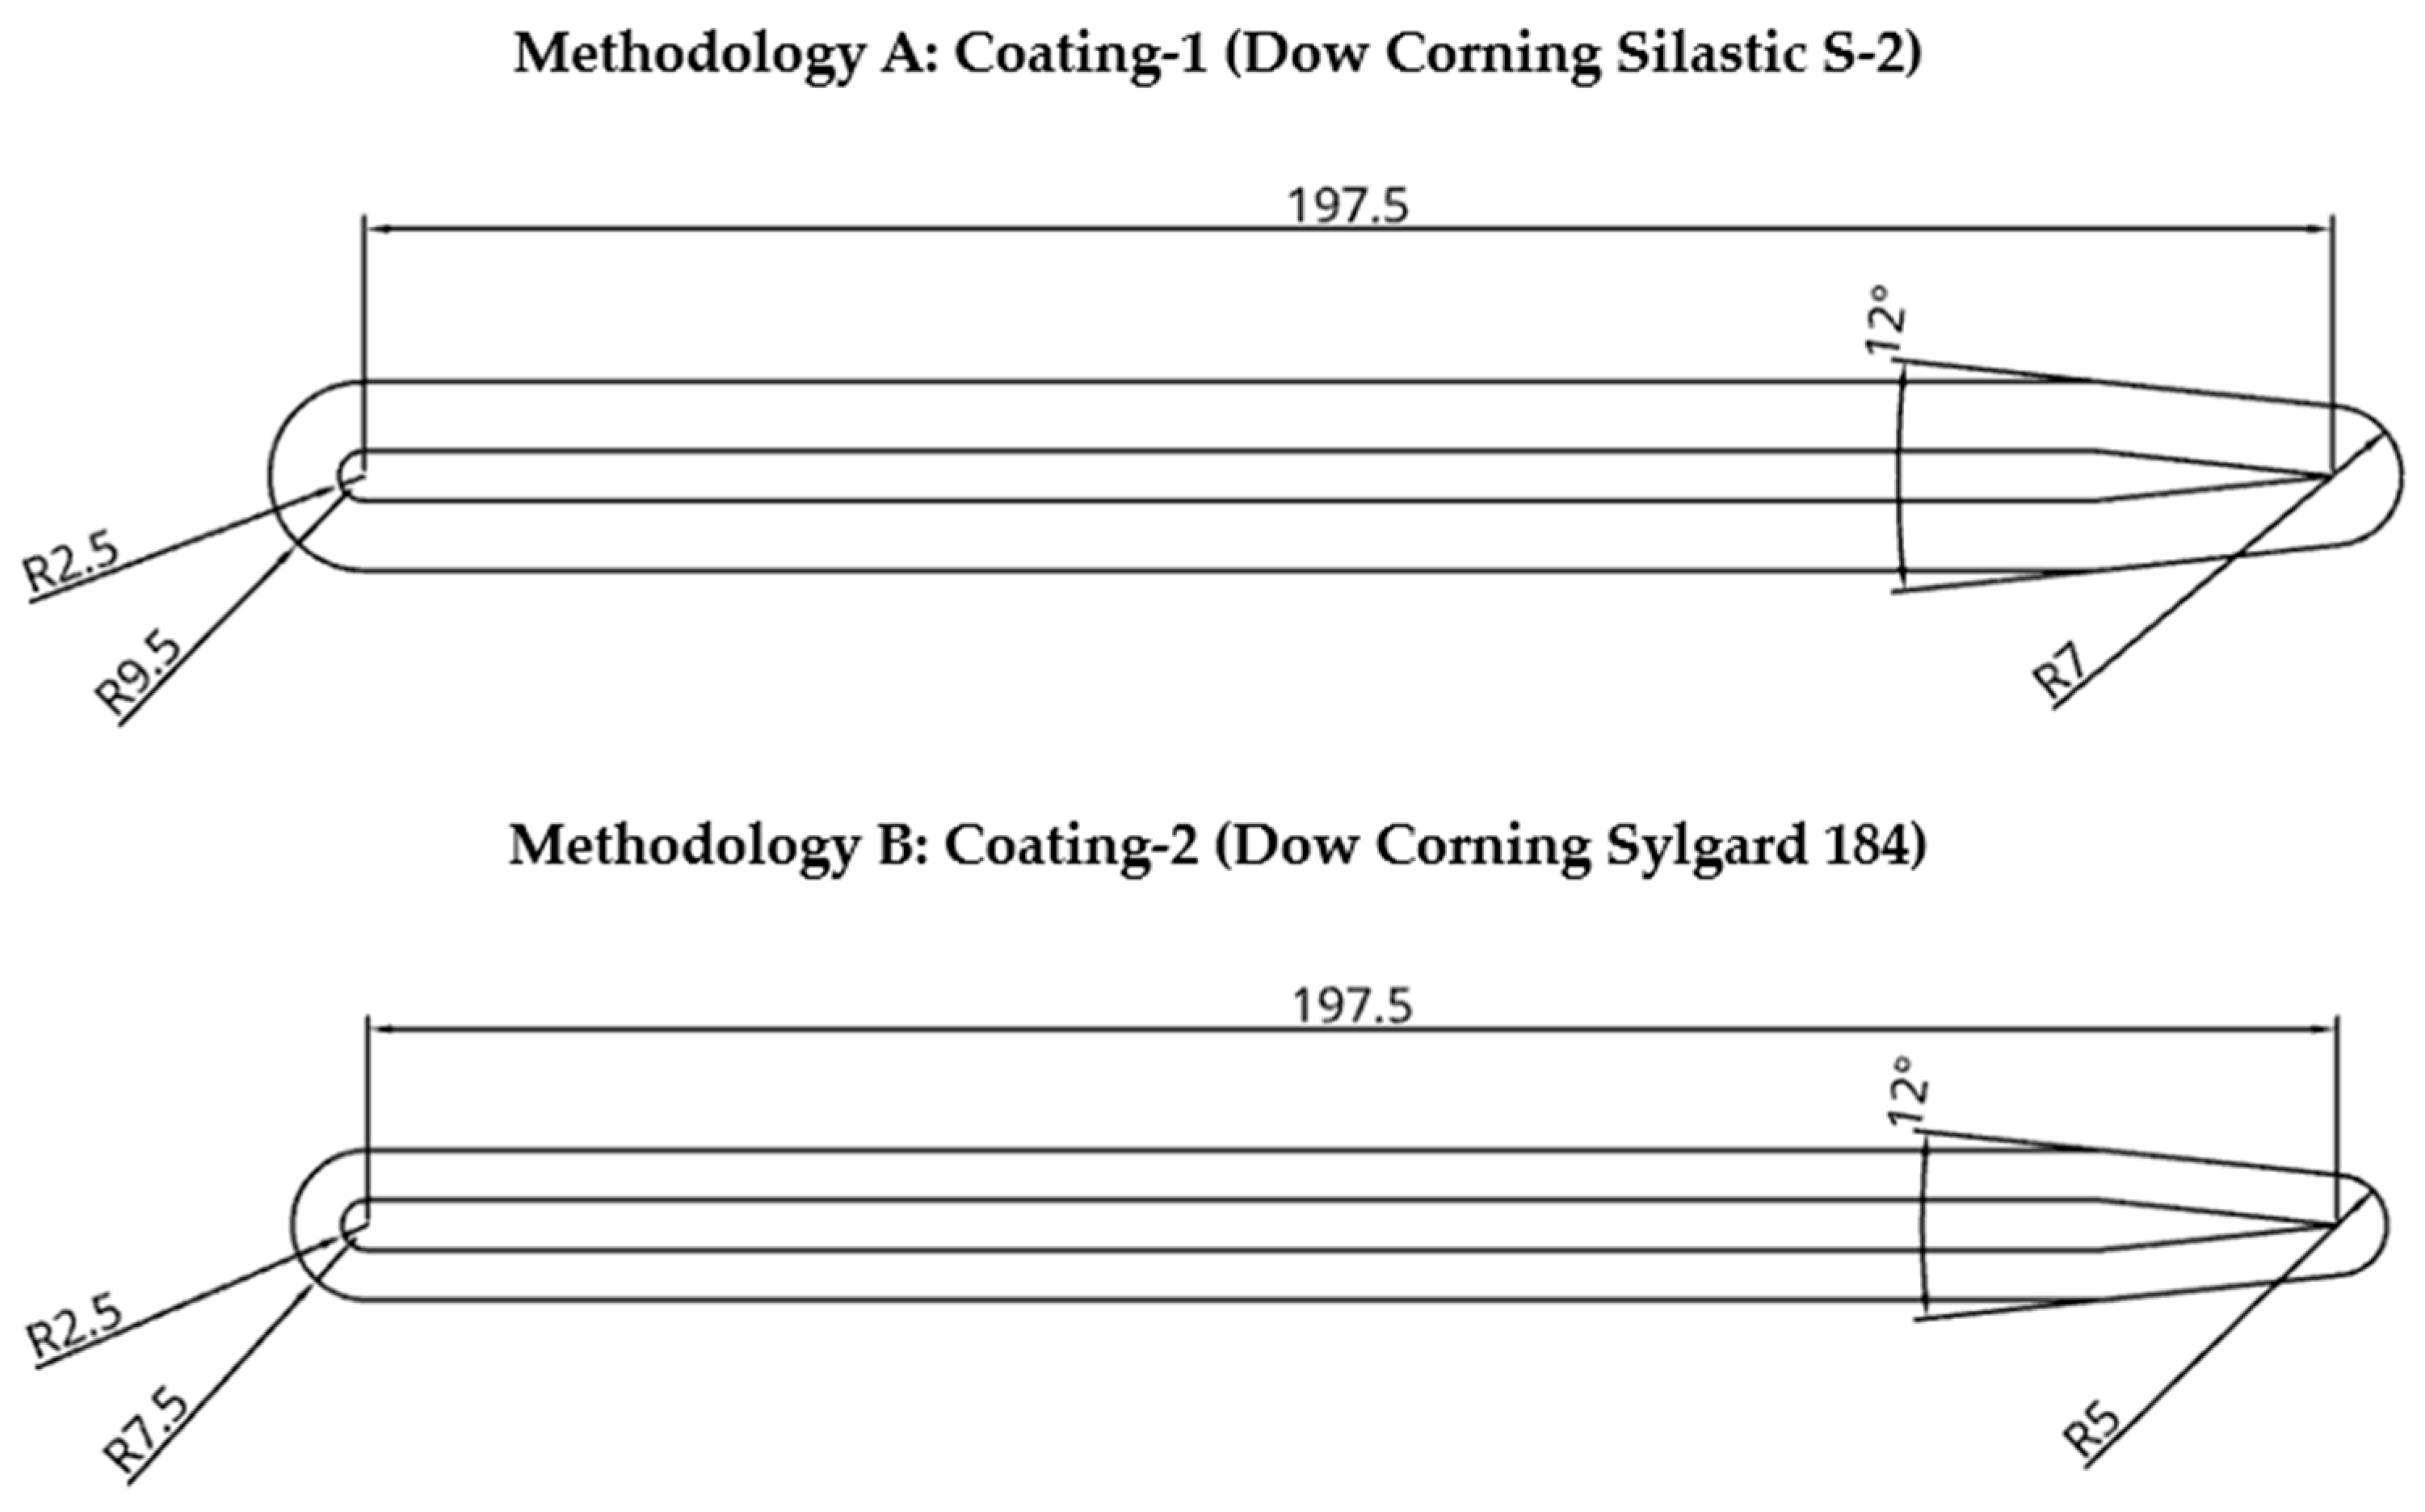
Figure 3 shows the flat plate with compliant coatings. Two compliant coatings, listed in Table 1, were analyzed in the present study. Two-way coupled FSI was used to model coating deformation. This approach accounts for momentum and energy exchange between the fluid and the coating.
Figure 3.
Flat plate with compliant coating. (All dimensions are in mm.)
Table 1.
Coating material properties.
A solid stress solver based on an isotropic linear elastic constitutive model was used for structural analysis. Frequency-dependent viscoelastic damping and loss tangent effects were not incorporated into the simulations. First, a steady SST k–ω RANS simulation was run to residual convergence. The fluid and solid stress solvers were subsequently coupled to obtain a converged steady-state solution, which was used to initialize the unsteady CFD–FSI simulation.
The unsteady analysis employed a two-way coupled implicit FSI scheme with a time step of 5 × 10⁻⁶ s and 28 sub-iterations per time step. Within each time step, the fluid and solid stress solver were coupled until convergence. At the fluid–solid interface, pressure and wall shear stress were transferred as fluid loads. FSI dynamic stabilization was set to Auto to ensure stable coupling. The residuals converged to the order of 10−10 for continuity, 10−9 for momentum and 10−7 for energy at each time step. At the fluid–solid interface, force and displacement residuals converged to the order of 10−8 and 10−12, respectively.
Default under-relaxation factors in STAR-CCM+ were applied to the fluid solver. In the segregated flow solver, under-relaxation factors of 0.8 and 0.2 were used for velocity and pressure, respectively. In the segregated energy solver, fluid and solid under-relaxation factors of 0.9 and 0.99 were specified. For the k-ω turbulence model, under-relaxation factors of 0.8 and 1.0 were applied to the turbulence quantities and turbulence viscosity, respectively. No additional relaxation factors were specified for the FSI coupling beyond the implicit scheme with automatic dynamic stabilization.
2.4. Experiments
Computational studies indicated that coating-2 (Dow Corning Sylgard 184, The Dow Chemical Company, Midland, MI, USA) exhibited comparatively better noise-reduction characteristics and was selected for experimental testing. A 5 mm thick sample was prepared by mixing silicone oil with Dow Corning Sylgard 184 at a 9:1 mass ratio [47]. The mixture was cured at room temperature for two days and used after seven days [48]. The coating was applied to the flat plate shown in Figure 1 and tested in a closed-loop wind tunnel at the University of Kansas. Farfield noise from the coated plate was compared with the baseline, and the results are presented in Section 3.3.
2.4.1. Microphone Calibration
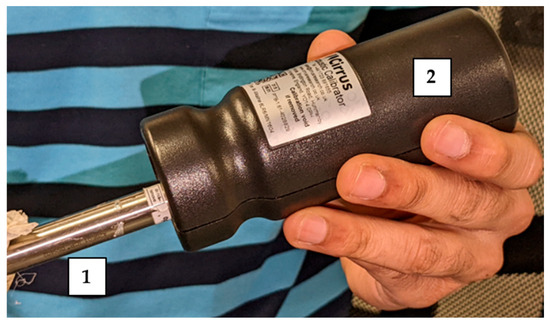
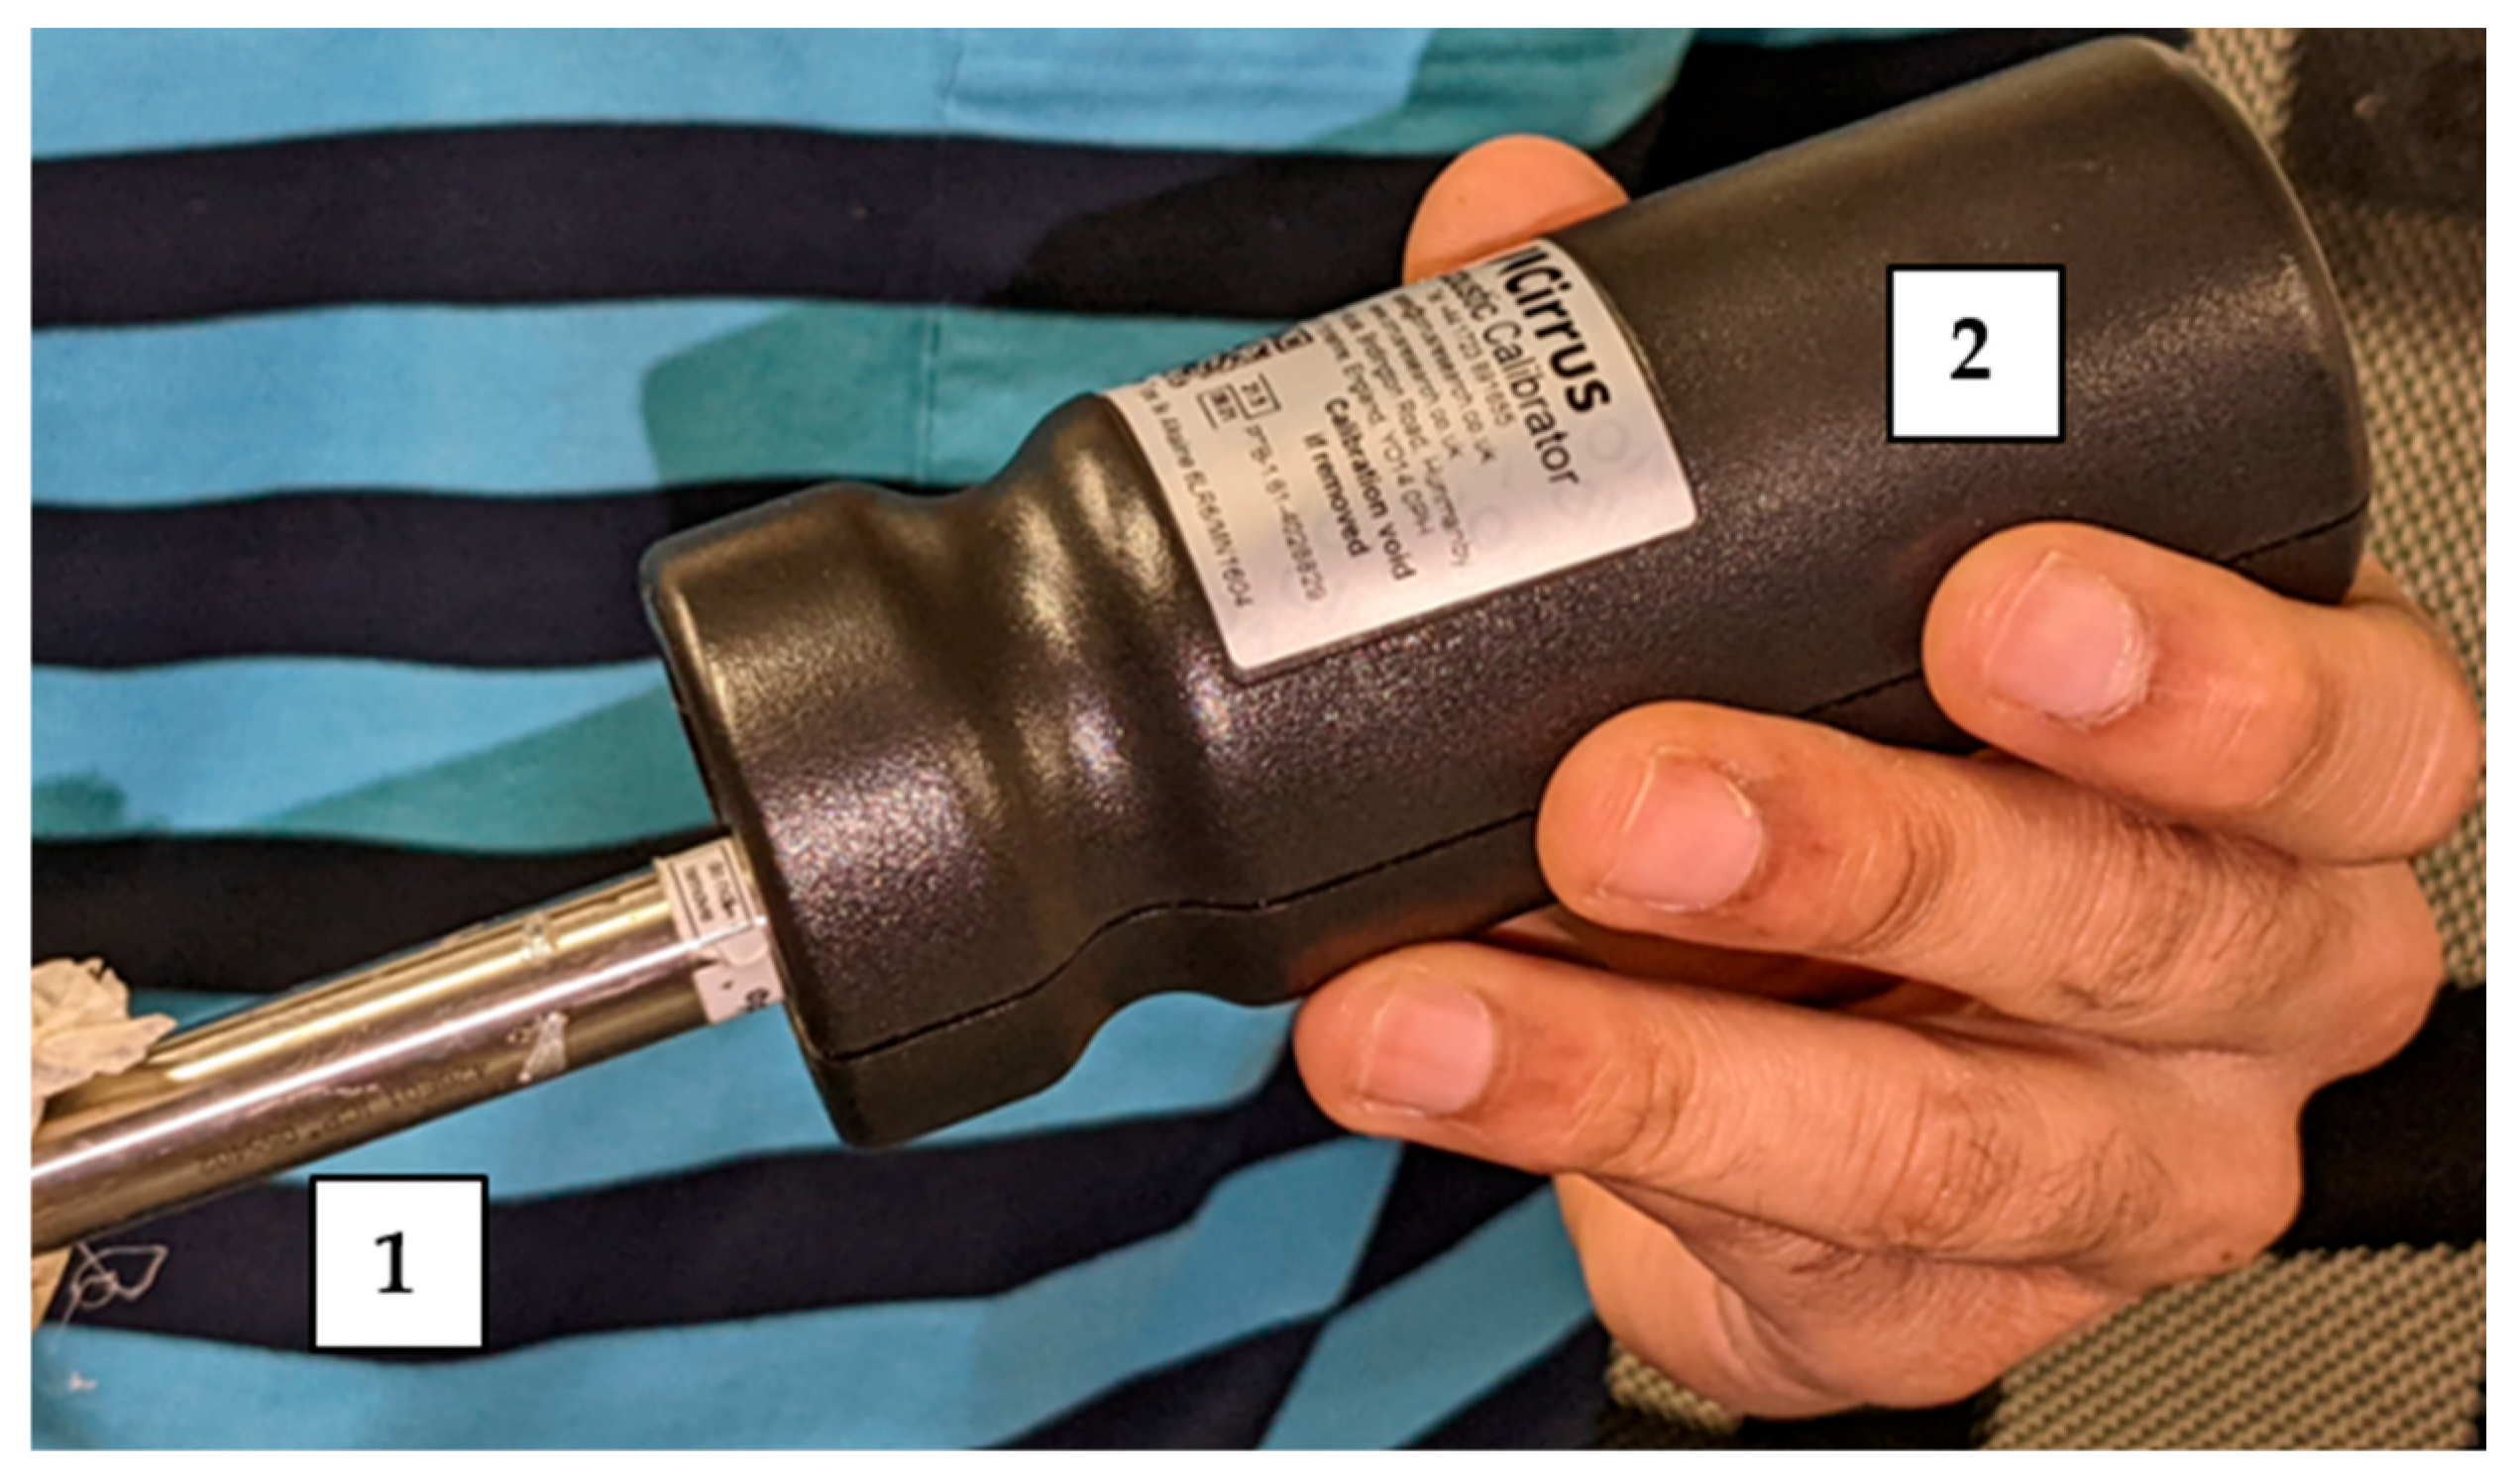
Noise data were recorded at a sampling interval of 5 × 10⁻⁵ s over 20 s using a microphone (Model 378A06, PCB Piezotronics, Depew, NY, USA). Each trial produced 400,000 data points, of which 218 samples were used for Fast Fourier Transform. The signal was divided into 0.05 s analysis blocks to achieve a frequency resolution of 20 Hz. Hann window was applied to reduce spectral leakage. As shown in Figure 4, the microphone was calibrated to 94 dB at 1000 Hz using an acoustic calibrator (Cirrus Research plc, Hunmanby, UK).
Figure 4.
Calibration of the microphone. (1) PCB Piezotronics 378A06 microphone; (2) Cirrus acoustic calibrator.
2.4.2. Noise Measurements
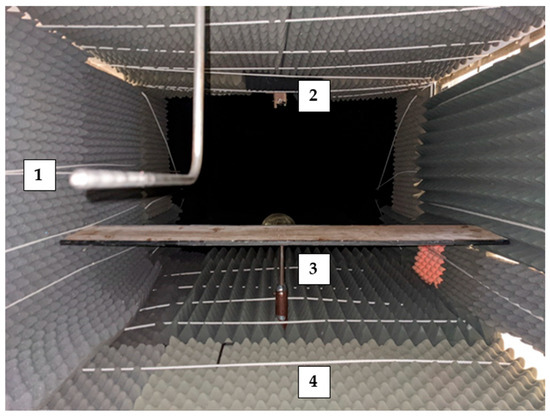
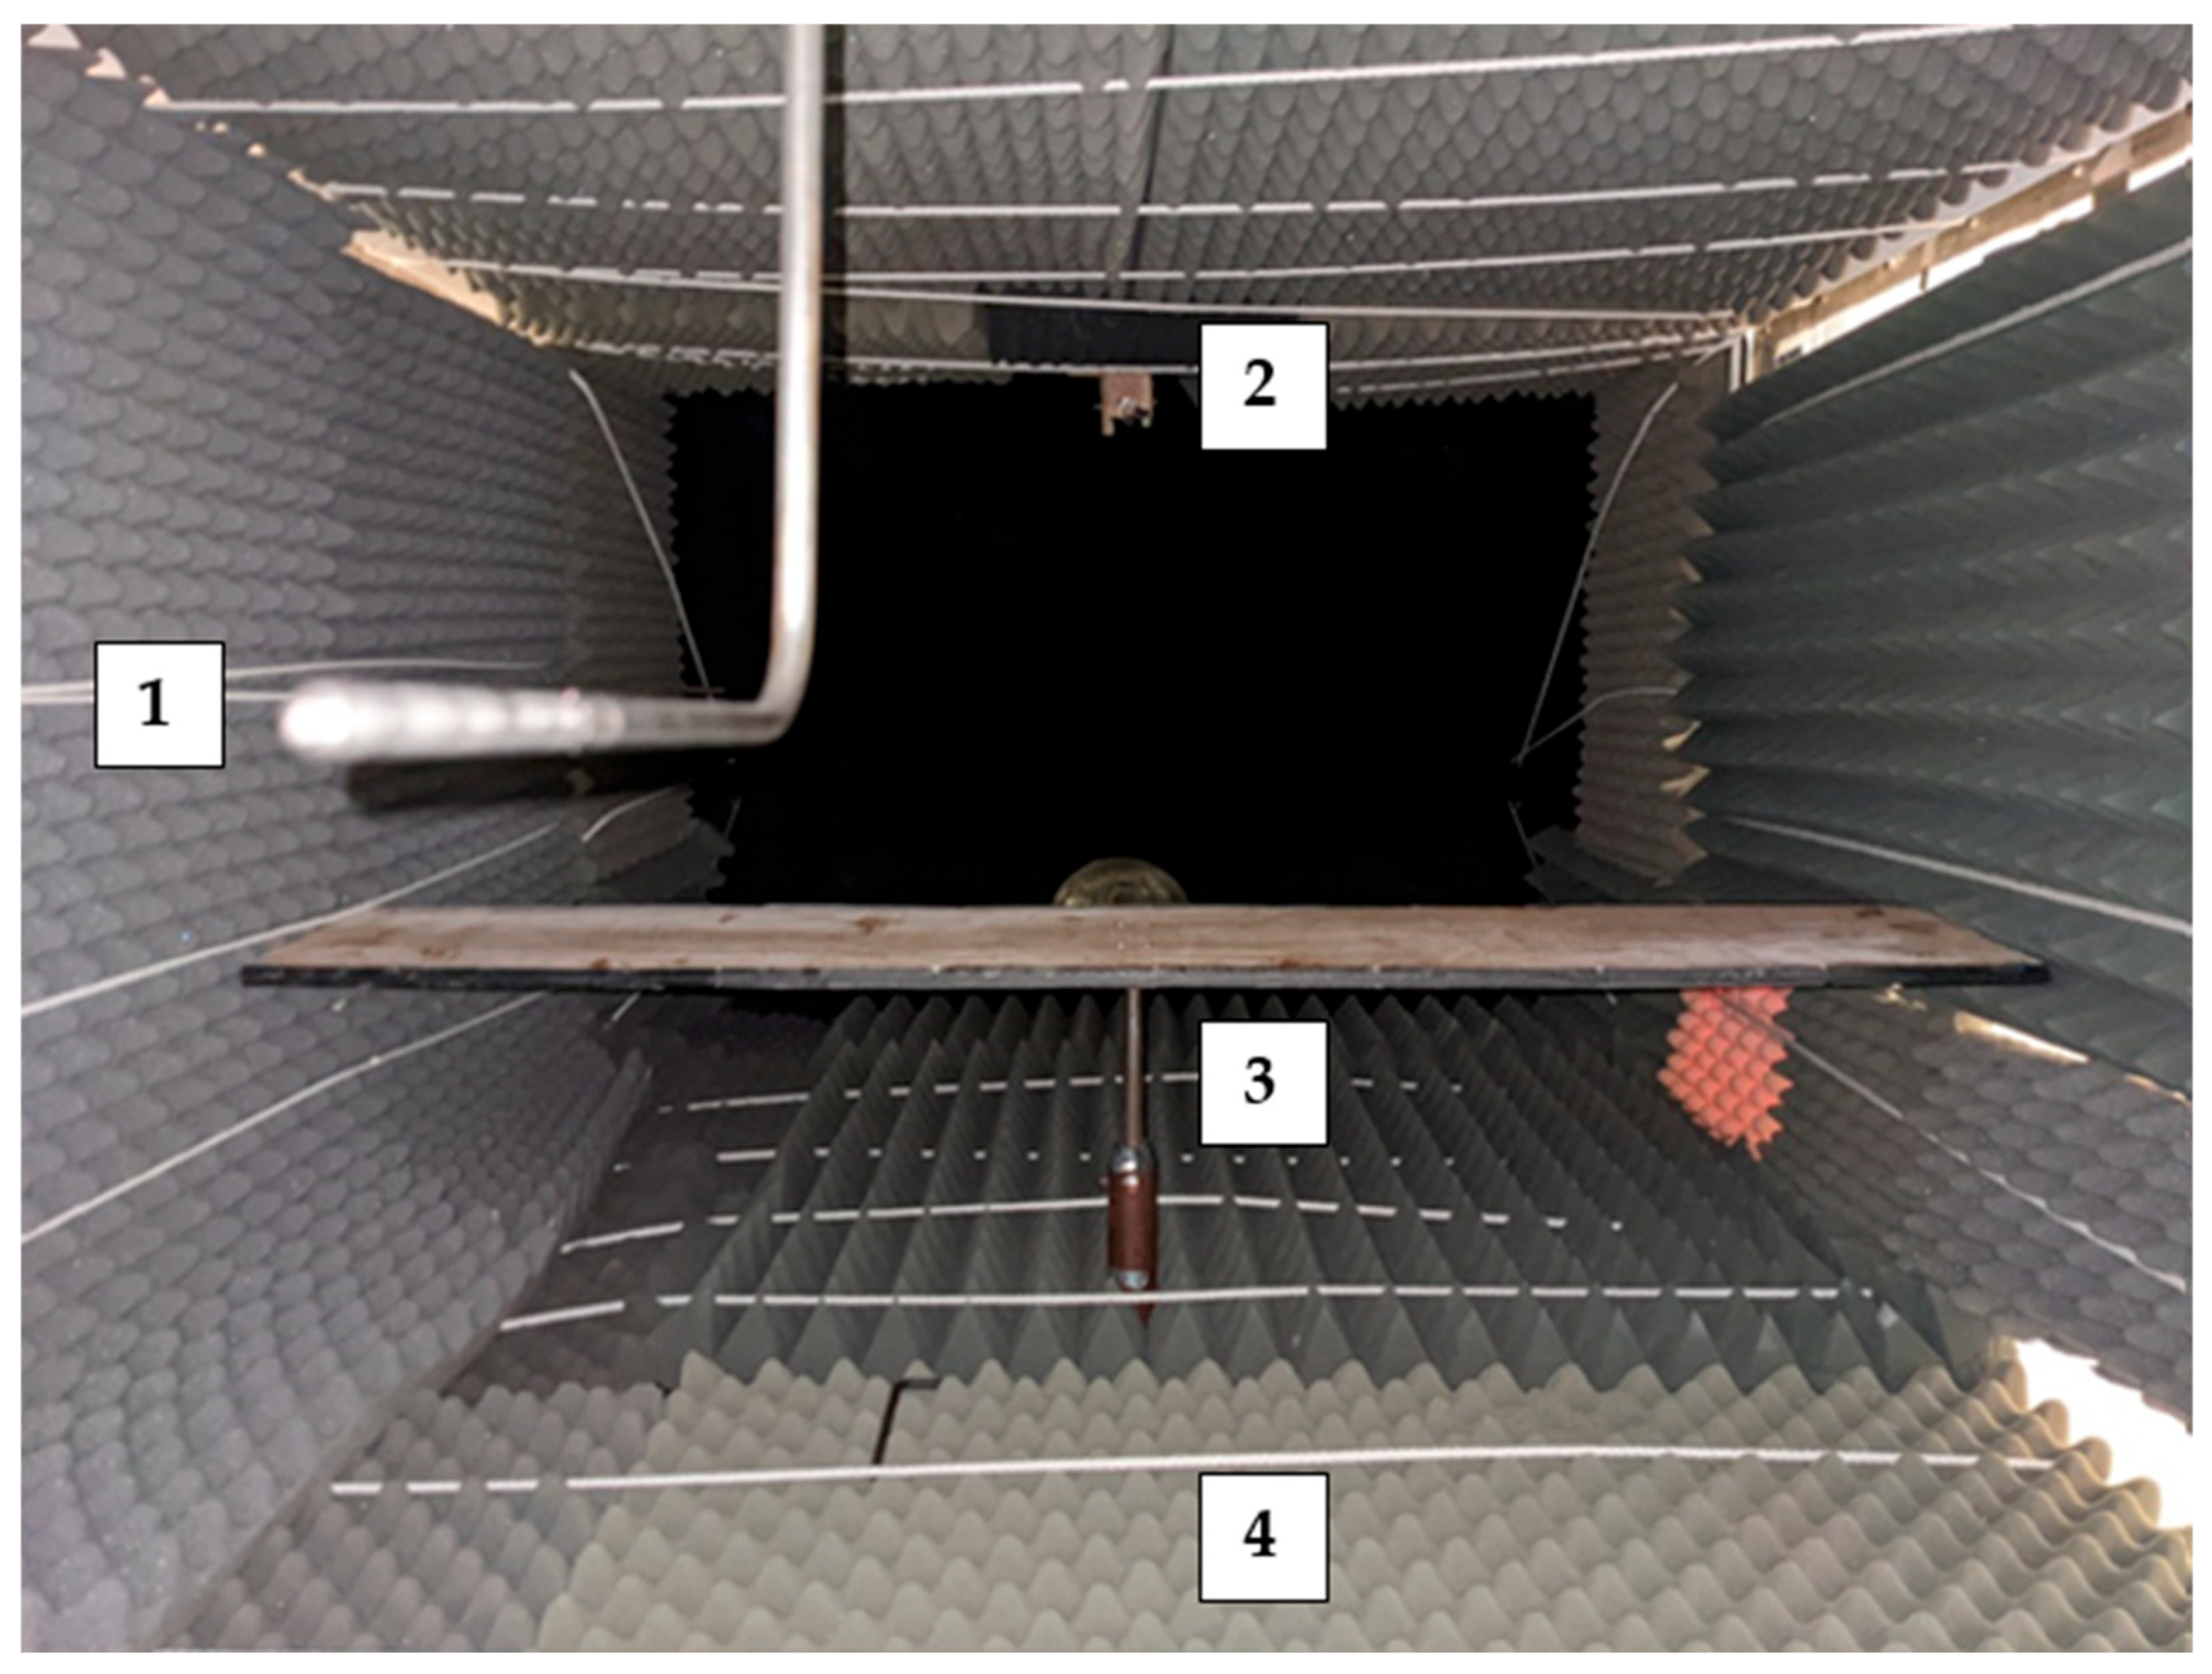
Background noise measurements were conducted at a flow speed of 15 m/s, first without acoustic liners and then with liners installed on all four sides of the wind tunnel test section. The microphone was mounted on the top wall, 26 in. downstream and 21 in. above the flat plate’s TE, through an opening in the test section and oriented 90° to the incoming flow. The microphone setup was based on Moreau et al. [40]. OASPL was calculated over 250–8000 Hz using power spectral density data with the trapezoidal method (Equations (2)–(4)). Subsequently, flat plate models with and without the compliant coating were tested in the wind tunnel, as shown in Figure 5.
Figure 5.
Wind tunnel test configuration. (1) Pitot–static probe; (2) microphone; (3) flat plate model (4) acoustic liners.
3. Results and Discussion
3.1. Validation
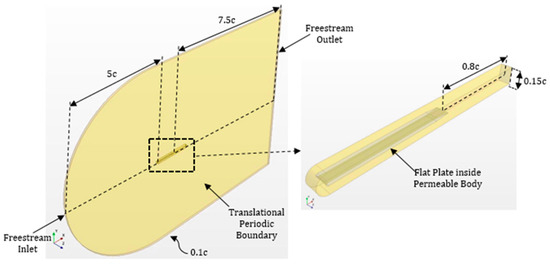
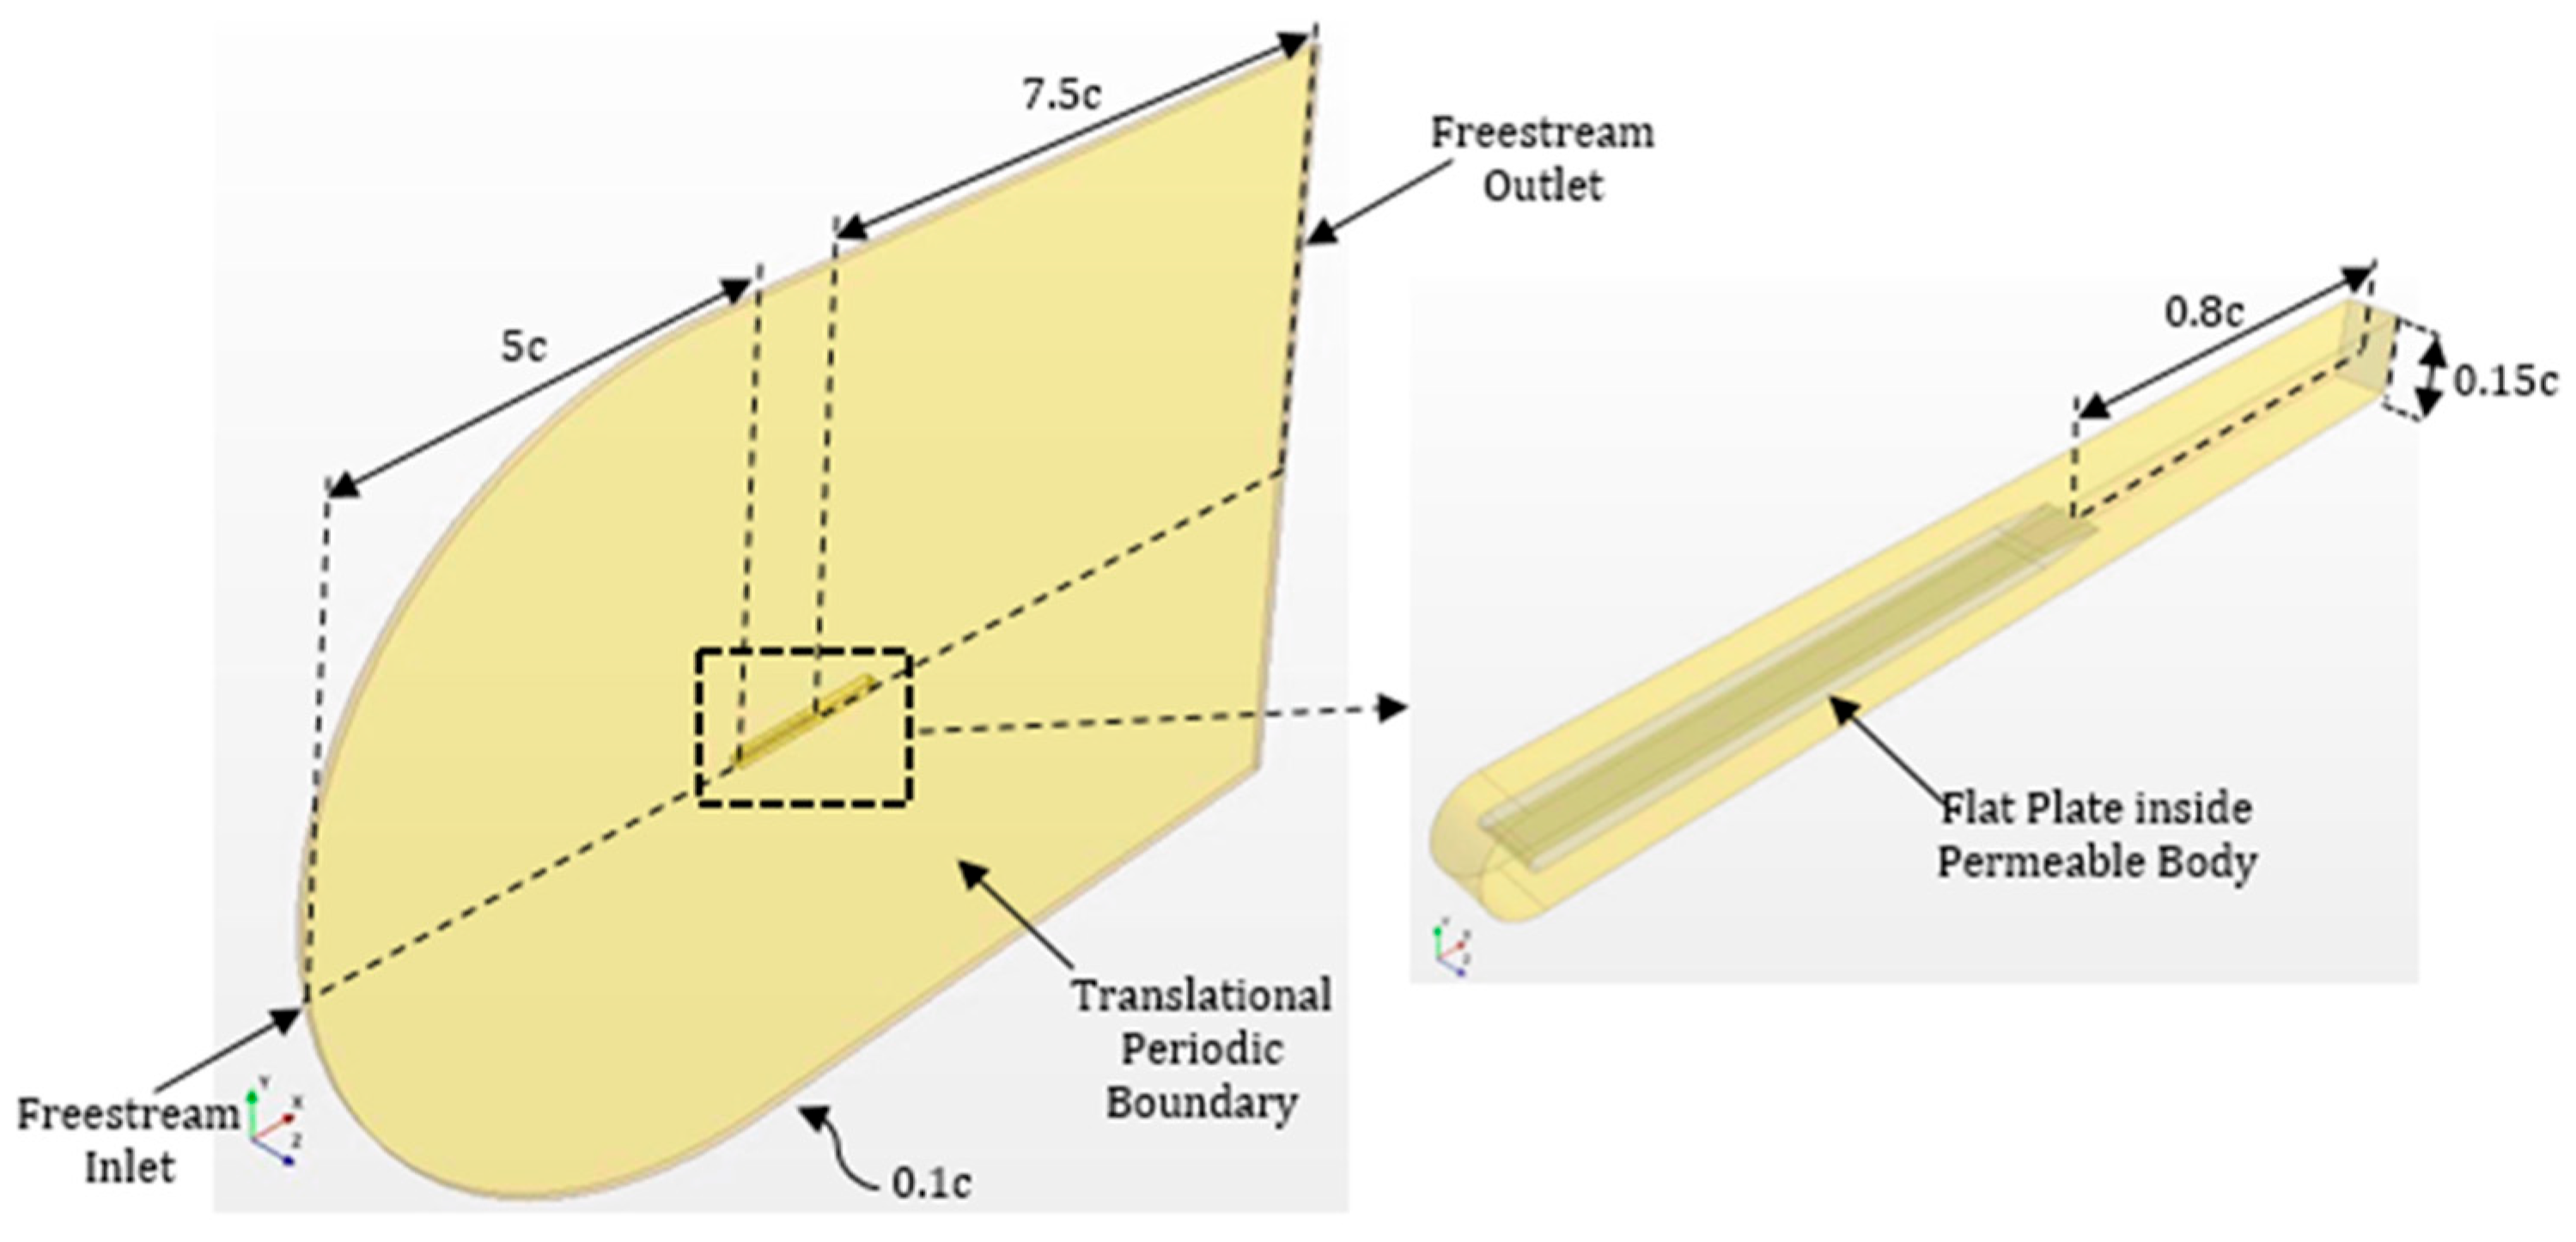
The computational domain comprises a fluid region surrounding a permeable surface, as shown in Figure 6. The permeable surface encompasses flow-induced noise sources around the flat plate and serves as the FW-H integration surface for farfield noise prediction. The freestream inlet is placed 1 m (5 c) upstream of the LE, while the outlet is positioned 1.5 m (7.5 c) downstream of the TE. The permeable surface extends 0.16 m (0.8 c) downstream of the TE and 0.03 m (0.15 c) in height. A no-slip wall boundary condition was applied to all flat plate surfaces. The inlet turbulence was specified using turbulence intensity and viscosity ratio. Based on the experiments by Moreau et al. [40], a freestream turbulence intensity of 0.3% was applied in the simulation, and the viscosity ratio was set to 10.
Figure 6.
CFD simulation domain and boundary conditions.
Karimi et al. [49] conducted CFD simulations on a flat plate of identical profile using a spanwise length of 10% chord with periodic side boundaries. Following their approach, the present study adopts the same spanwise extent to capture the three-dimensional turbulent structures within the boundary layer. Translational periodic boundary conditions are imposed on the side planes to maintain a fully correlated flowfield. This provides a more accurate representation than symmetry boundary conditions, which neglect the spanwise flow components [50].
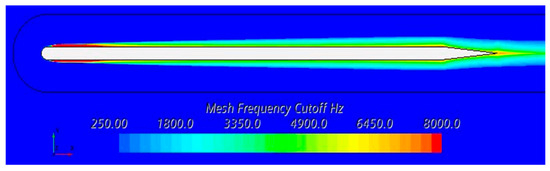
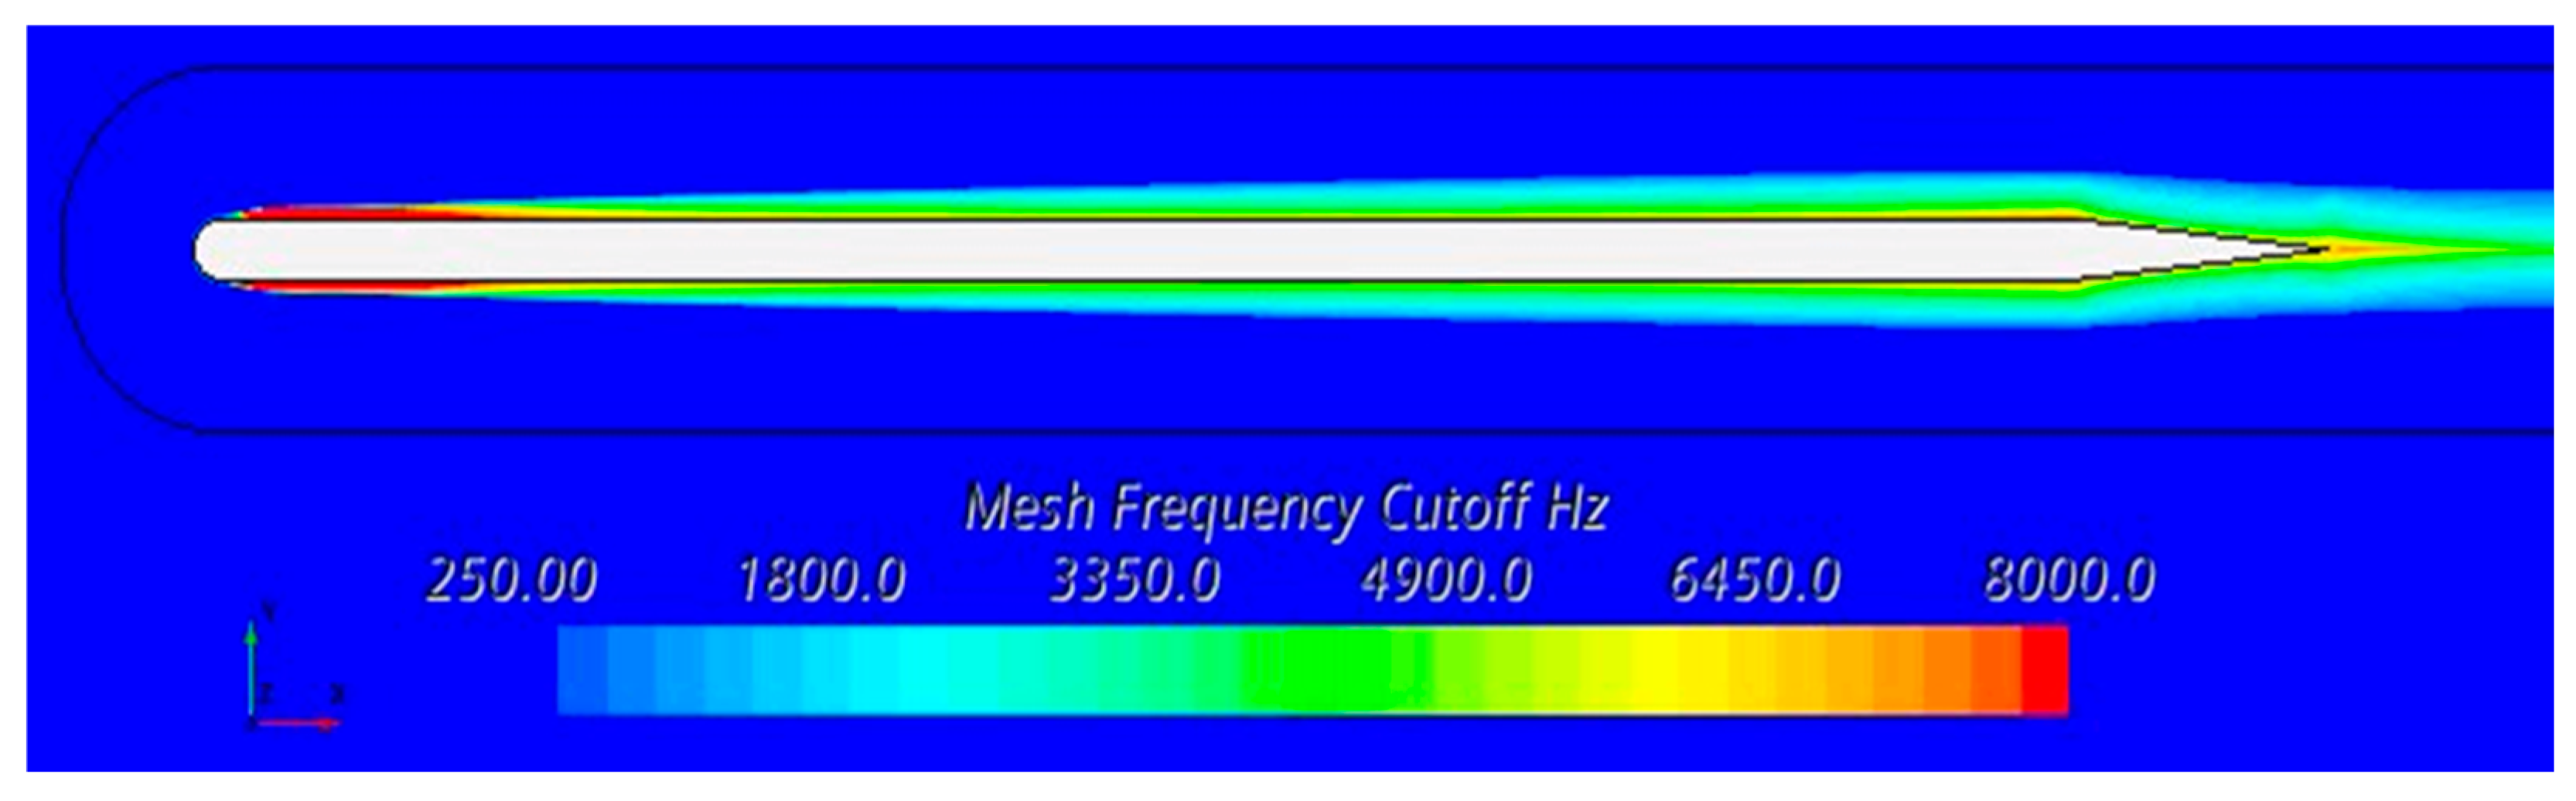
A structured mesh with hexahedral cells was generated, with a near-wall thickness of 4 µm to ensure y+ < 1 for adequate near-wall resolution. At a freestream velocity of 35 m/s (Rec ≈ 460,000), a grid refinement study was performed to ensure the mesh could resolve flow-induced noise sources. The mesh frequency cutoff parameter, fmc [51], was used to evaluate mesh refinement. It is defined in terms of the turbulent kinetic energy k and the local grid spacing Δ and is given by
Here, fmc denotes the mesh frequency cutoff and Δ represents the local grid spacing.
The turbulent kinetic energy is given by
where u′, v′, and w′ denote the velocity fluctuations in the streamwise, wall-normal and spanwise directions, respectively.
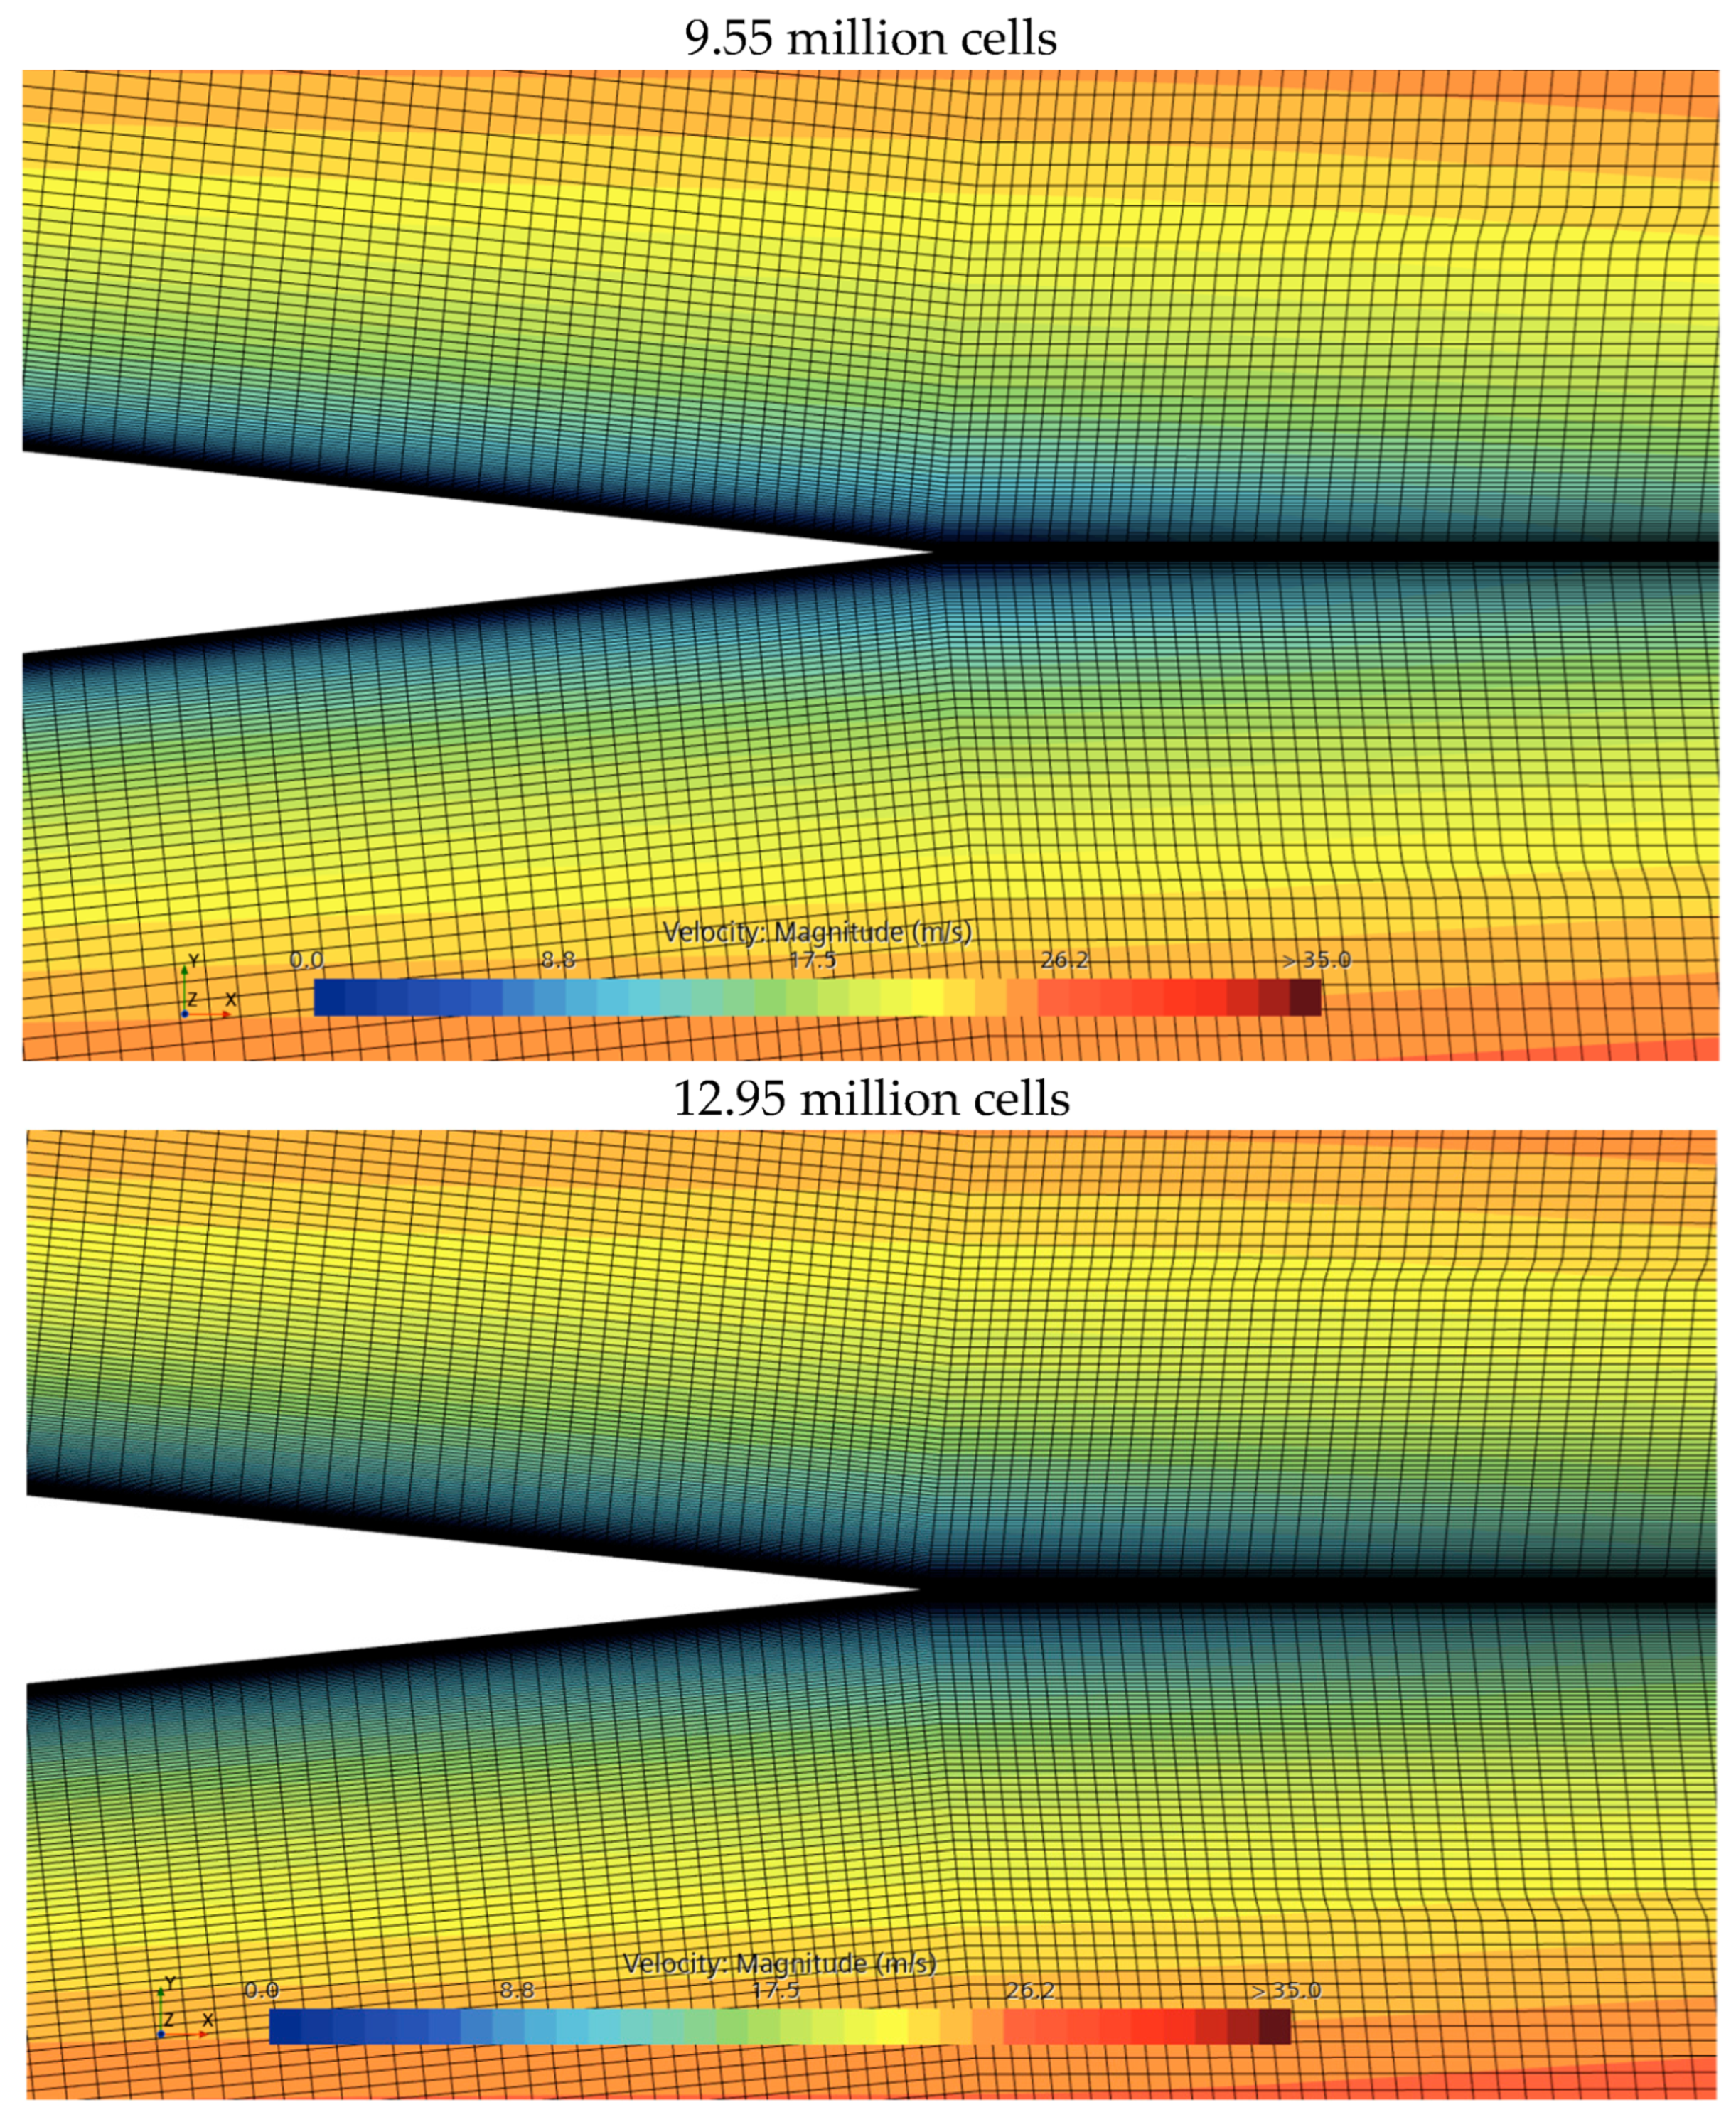
Moreau et al. [40] conducted experiments on a flat plate under fully turbulent conditions in an anechoic test facility effective above 250 Hz, with farfield noise recorded up to 8000 Hz. Accordingly, the mesh was refined to 9.55 million cells to resolve noise sources in the 250–8000 Hz range, as shown in Figure 7.
Figure 7.
Mesh frequency cutoff.
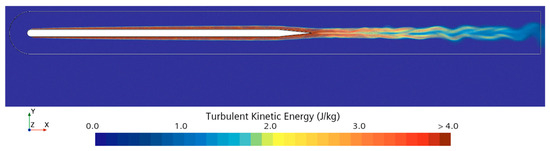
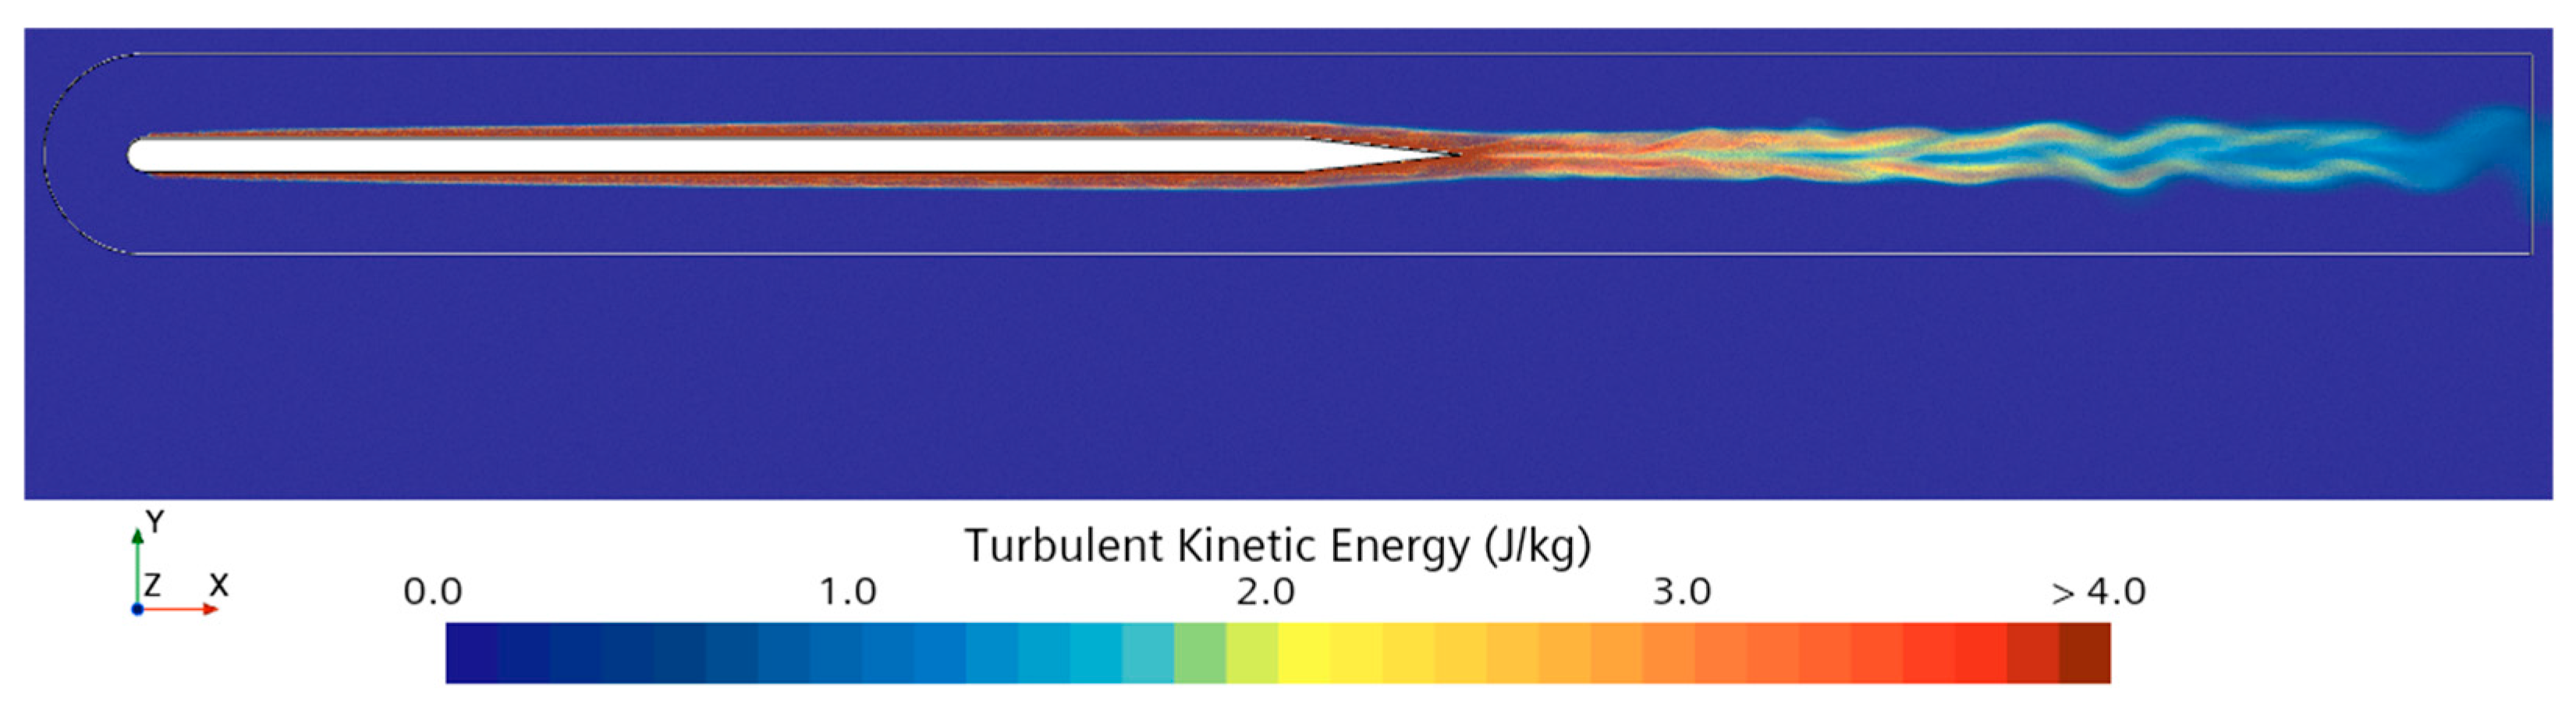
Figure 8 shows that the TKE is concentrated within the flow boundary layer and just downstream of the TE. TKE distribution represents noise sources around the flat plate. At 0° AOA, these sources are symmetrically distributed above and below the plate, and a permeable surface with height of 0.15 c is sufficient to capture them.
Figure 8.
Turbulent kinetic energy distribution.
3.1.1. Flowfield Downstream of the TE
Moreau et al. [40] recorded unsteady velocity measurements 0.6 mm downstream of the TE. The predicted mean and root mean square (RMS) velocities are compared with measurements and previous computational studies. The RMS of fluctuating velocity is calculated using Equation (7).
RMS of fluctuating velocity is given by
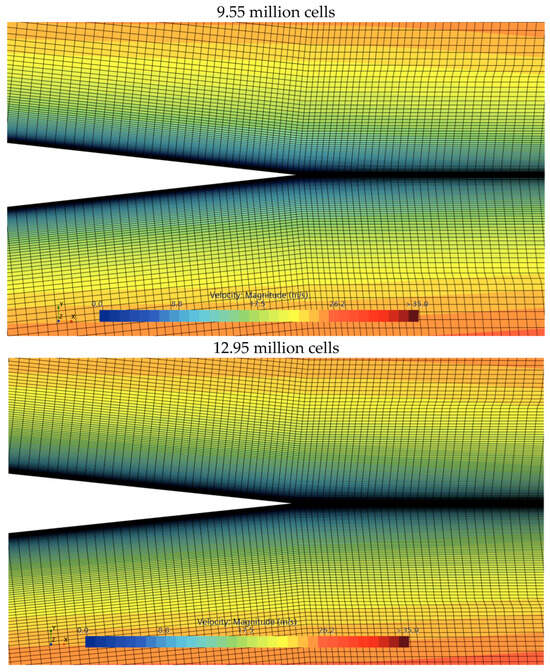
To evaluate mesh independence downstream of the TE, the mesh was refined in the direction normal to the chord from the TE centerline to the permeable surface. The resolution was increased from 100 to 150 cells. This increased the mesh size from 9.55 million to 12.95 million, as shown in Figure 9.
Figure 9.
Mesh resolution downstream of the TE.
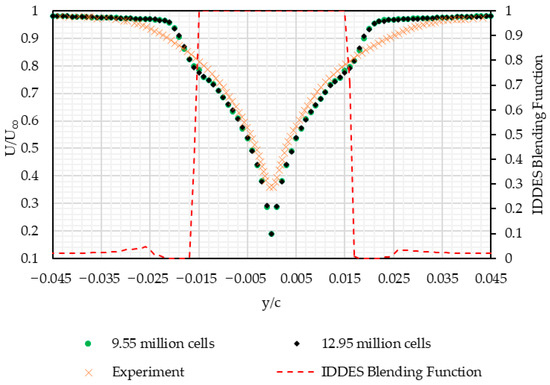
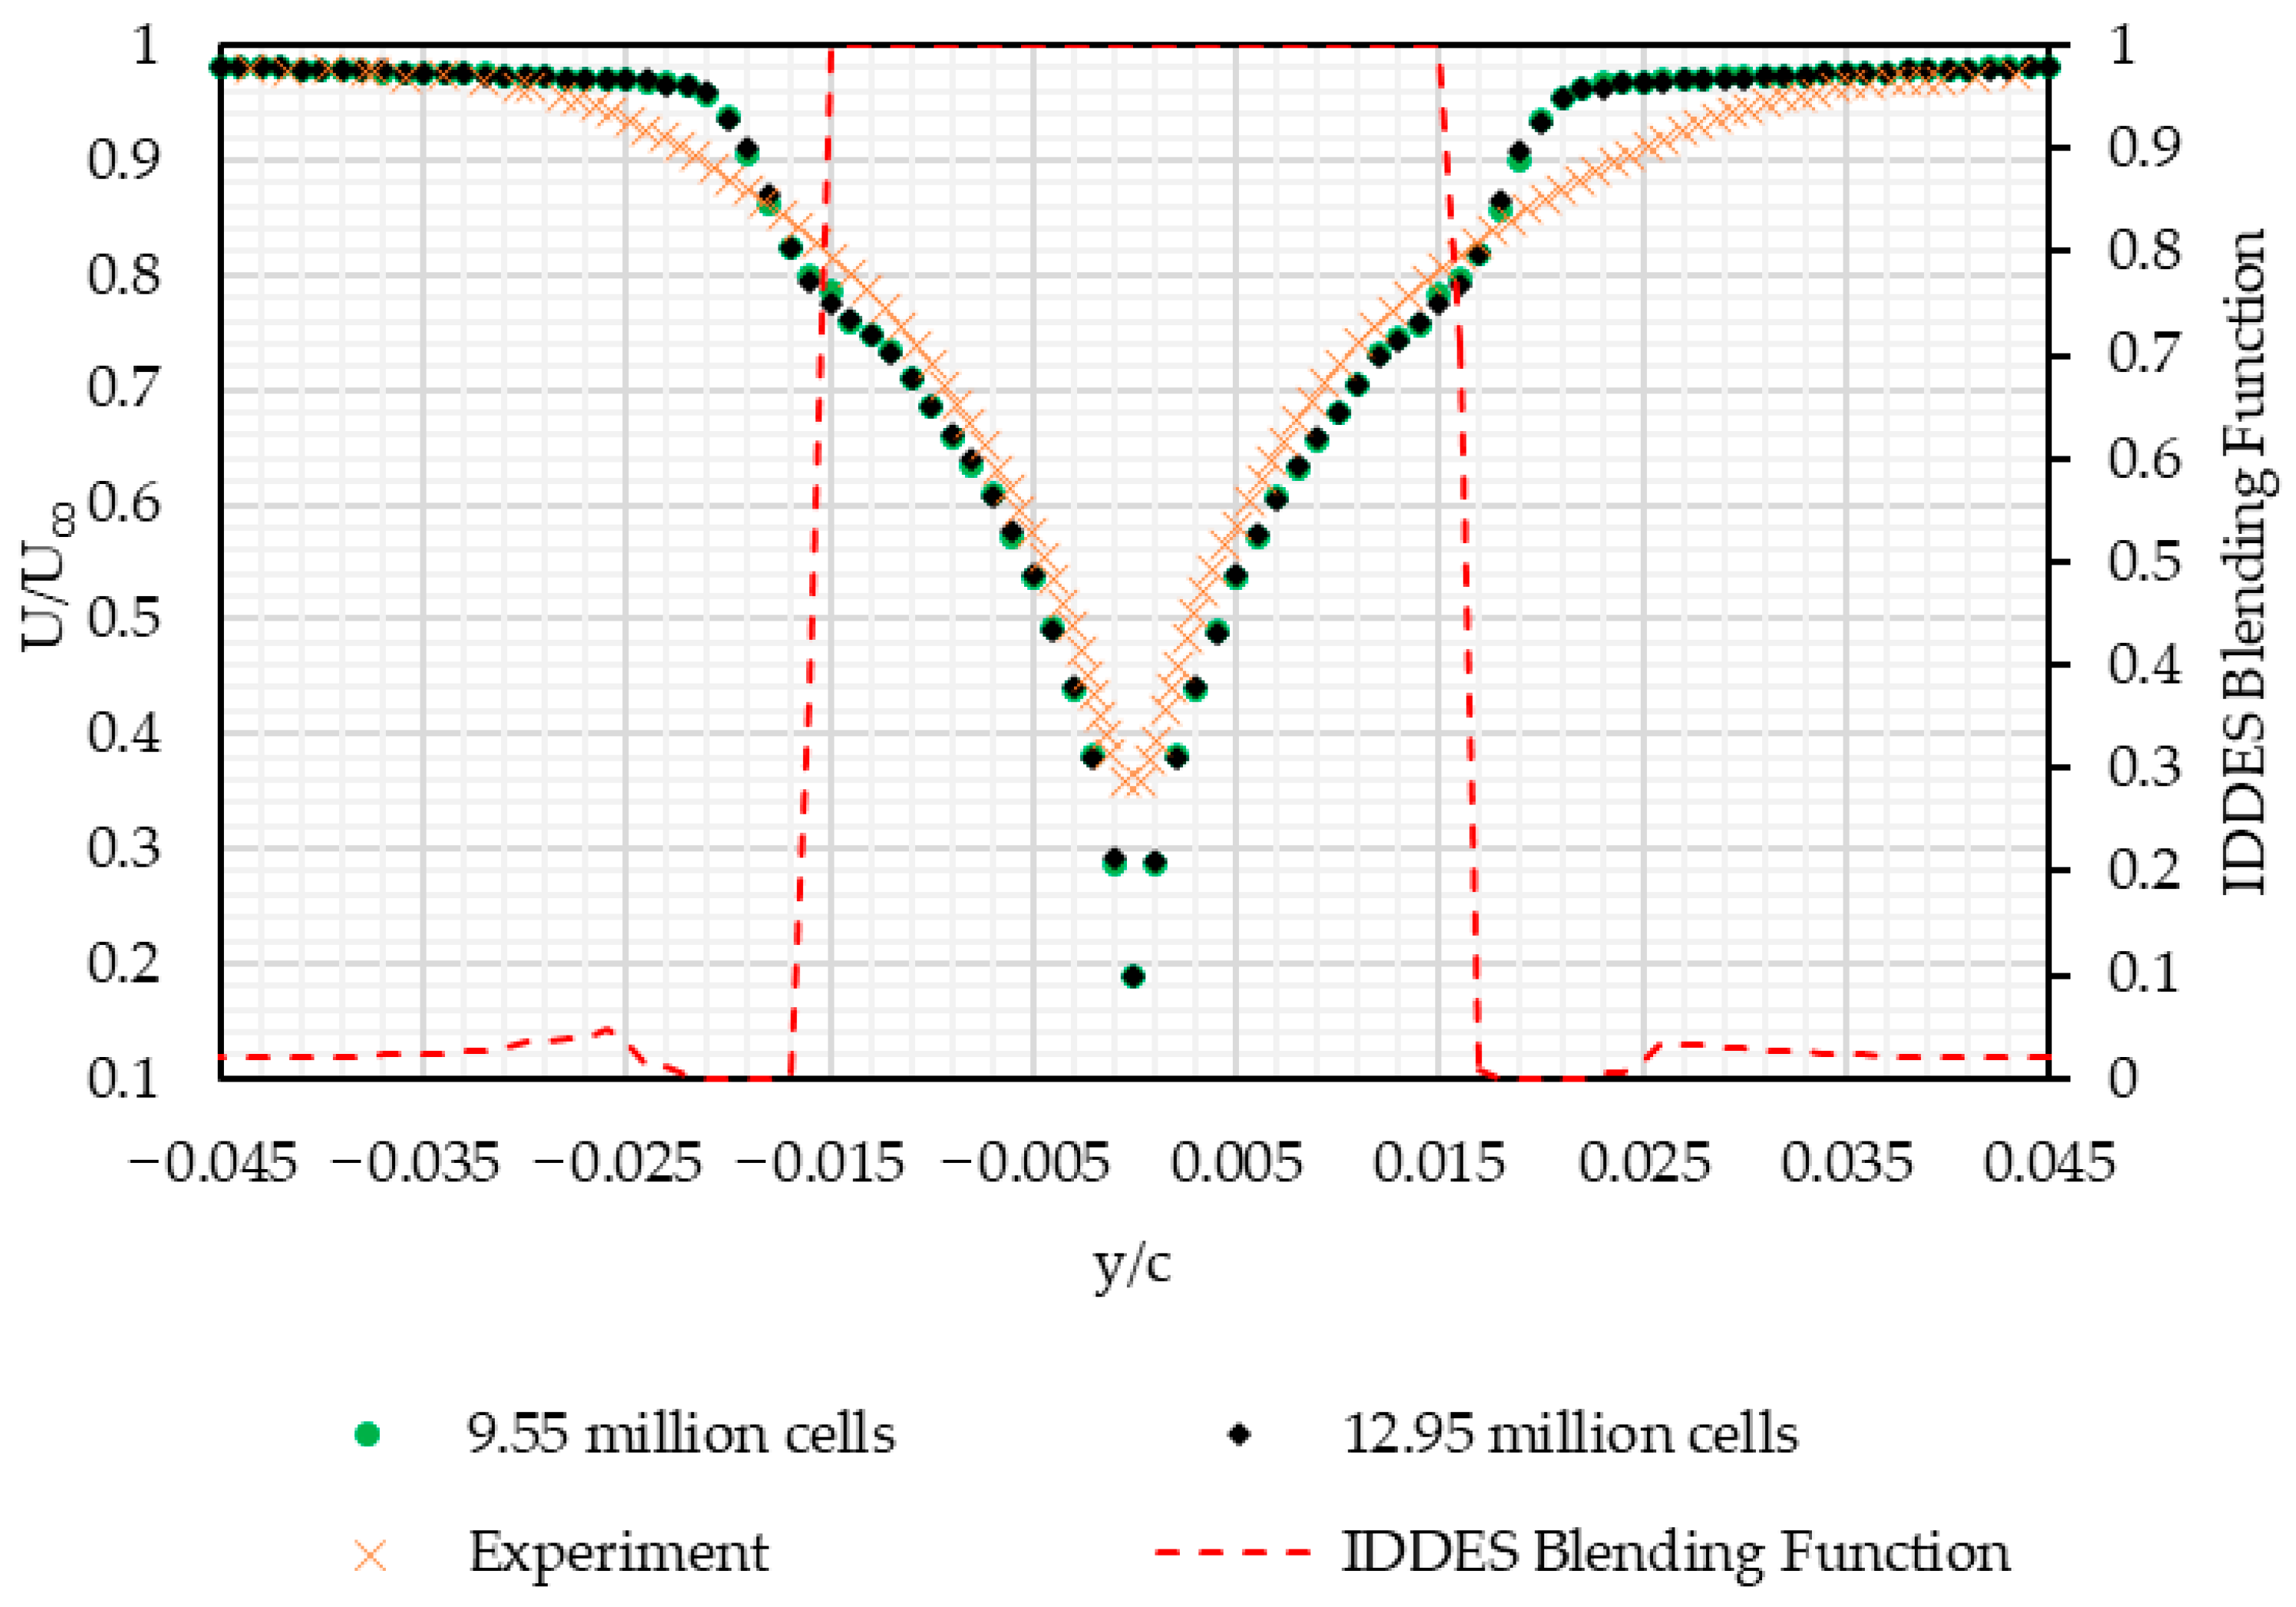
The mean velocity distribution 0.6 mm downstream of the TE is predicted using meshes with 9.55 million and 12.95 million cells and compared with the measurements of Moreau et al. [40], as shown in Figure 10. The predicted near-wake velocity profile is symmetric about the TE. Both meshes yield comparable results and agree well with the experimental data within −0.015 < y/c < 0.015. However, the prediction accuracy decreases away from the TE centerline compared to the experimental data.
Figure 10.
Mean velocity distribution downstream of the TE: Mesh comparison.
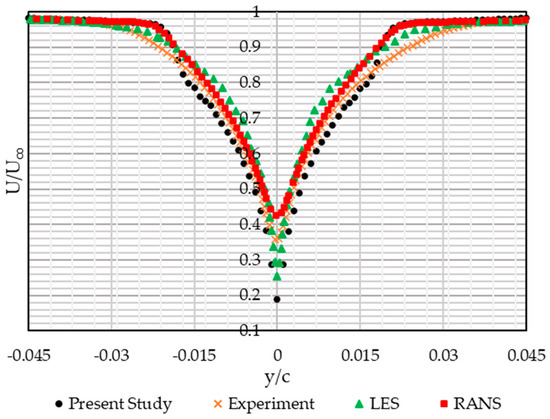
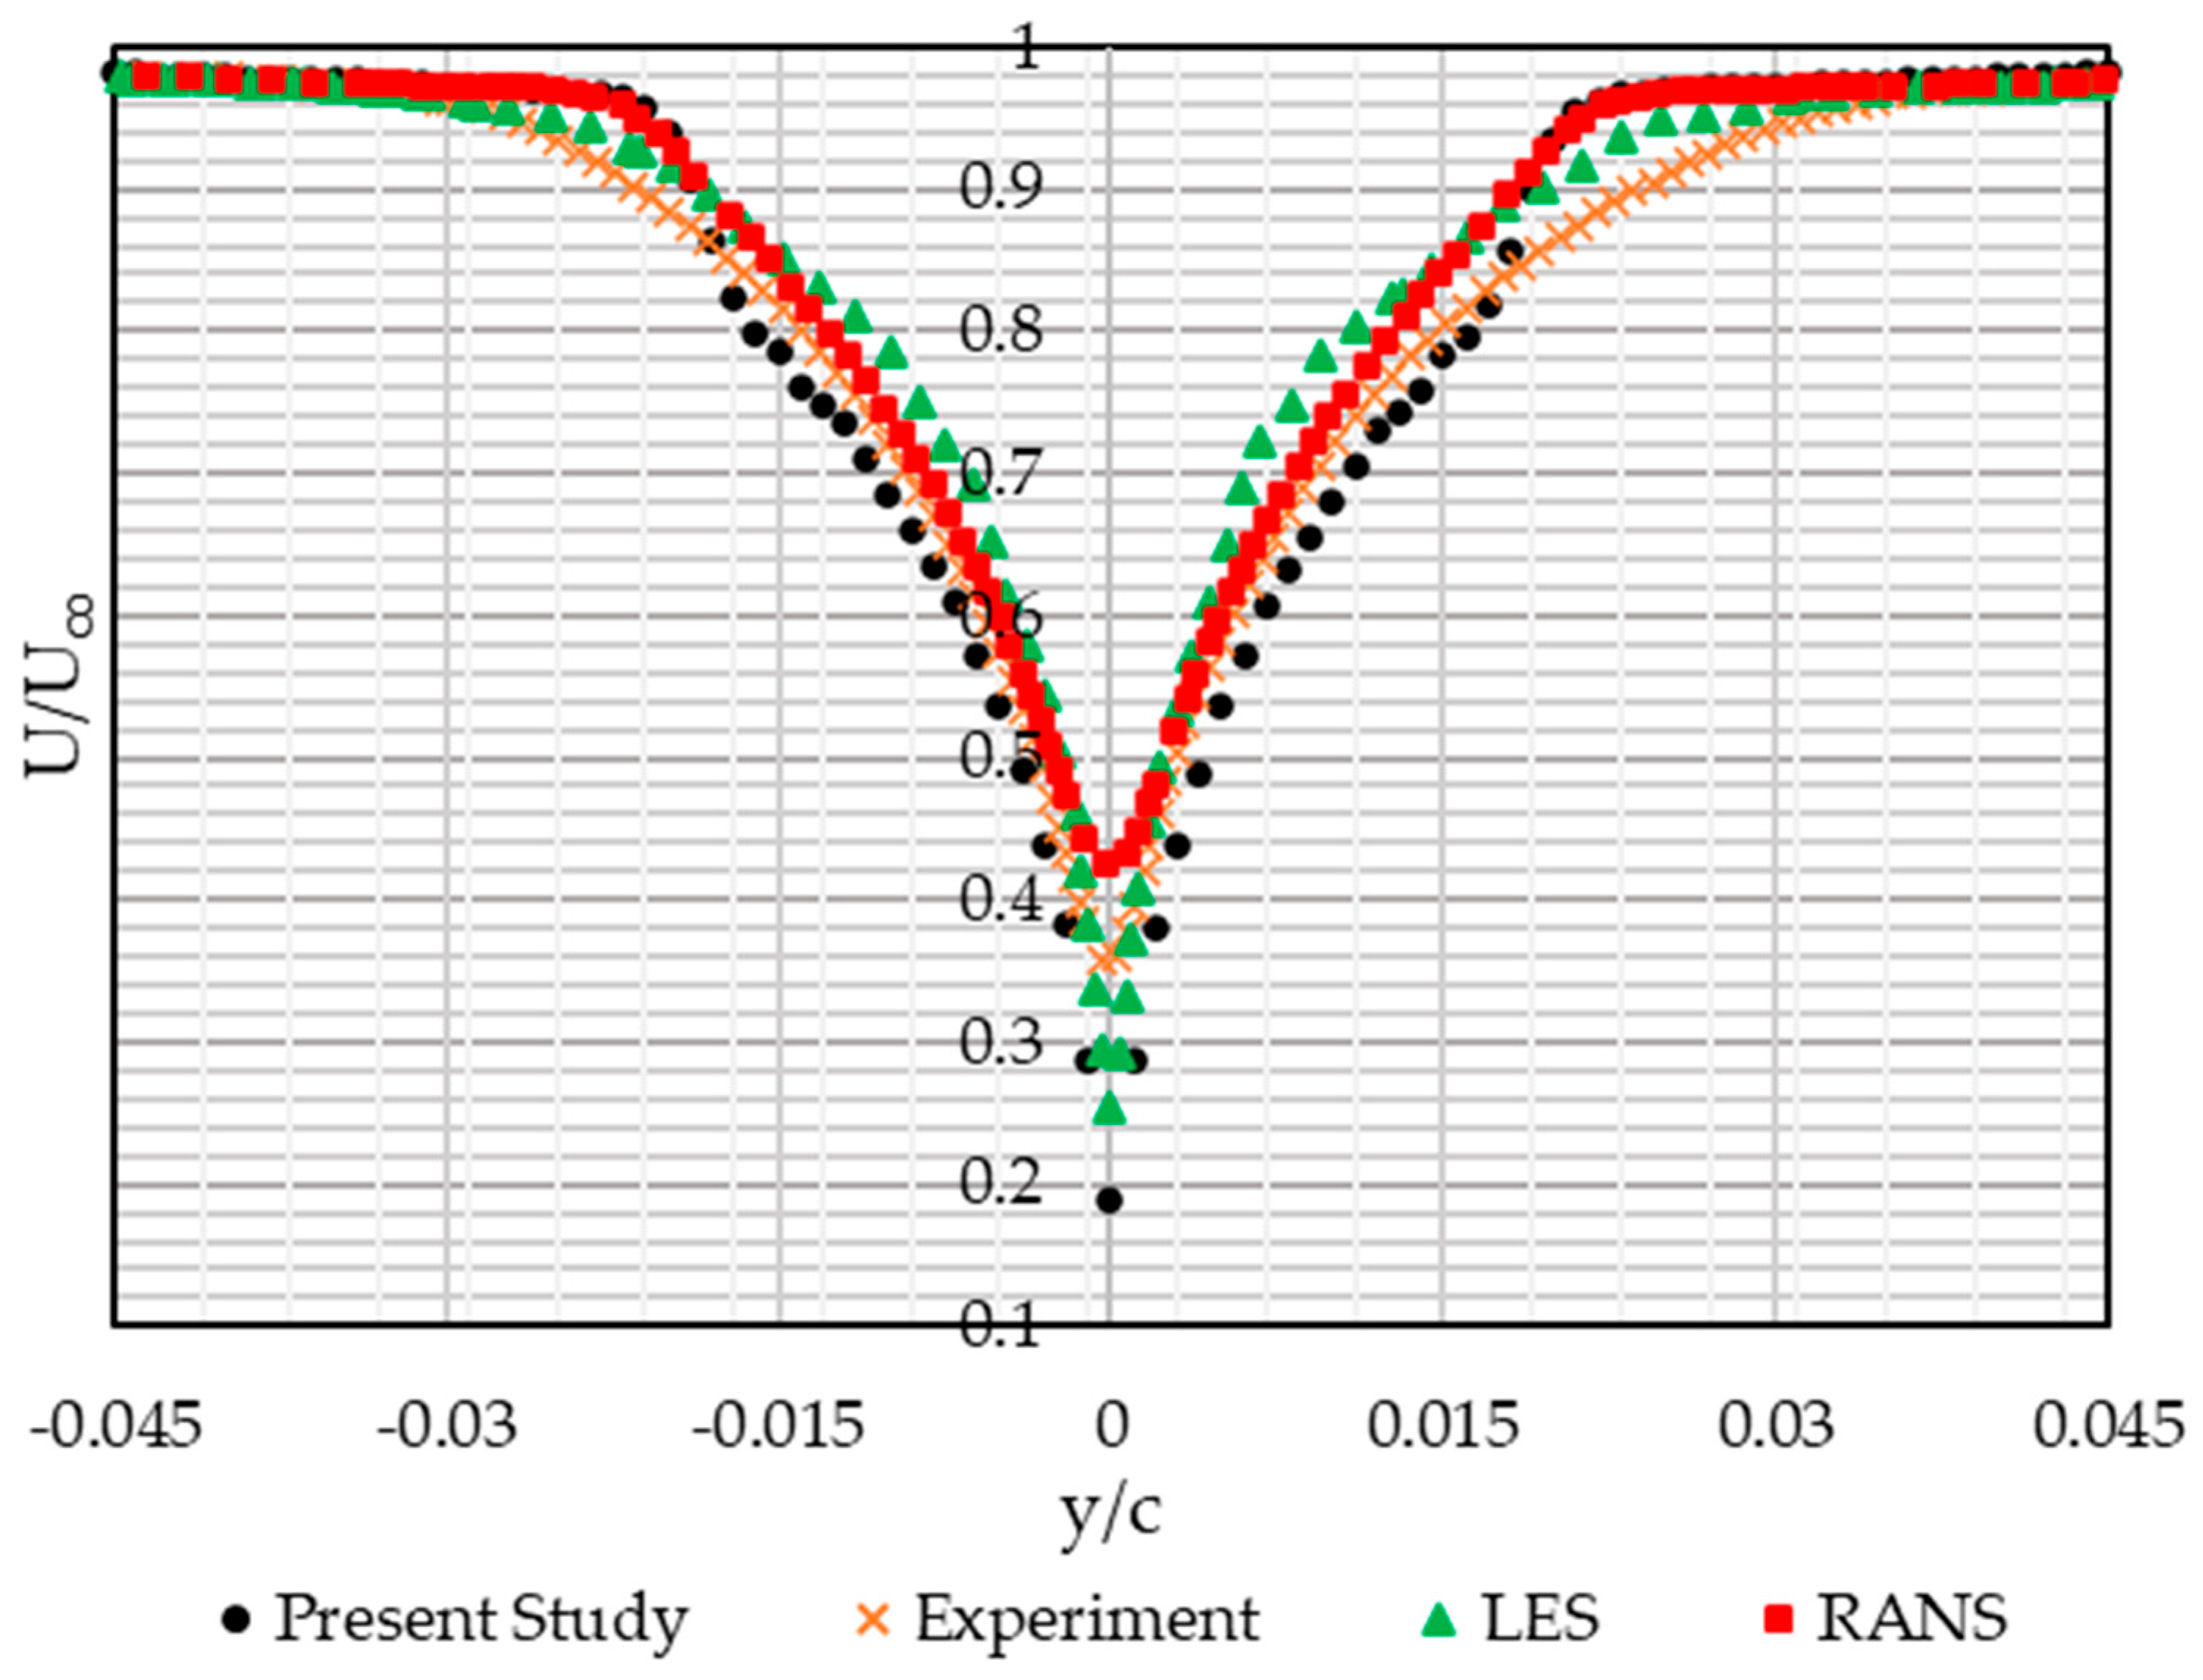
To further examine the results, the present predictions are compared with previously published RANS and LES simulations of the same flat plate model, as shown in Figure 11. Within −0.015 < y/c < 0.015, the present results closely match with the LES results of Karimi et al. [49]. Away from the TE centerline, the predictions align more closely with the RANS results [49].
Figure 11.
Mean velocity 0.6 mm downstream of the TE. Sources: Experiment [40]; LES [49]; RANS [49].
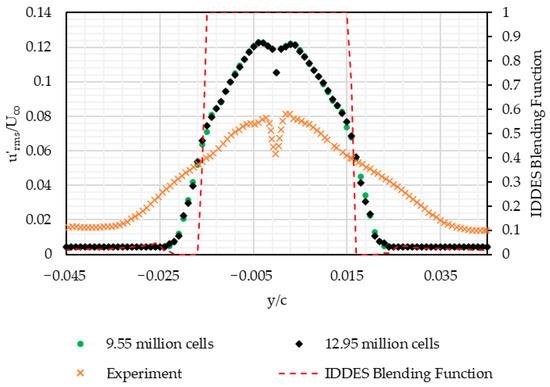
This behavior reflects the characteristics of the IDDES model, which uses a blending function to combine the RANS (blending function = 0) and LES (blending function = 1) models [44]. As shown in Figure 10 and Figure 11, IDDES operates using the SST k–ω RANS model in attached flow and freestream regions to reduce the computational cost, while switching to a basic LES sub-grid scale model within the boundary layer and separated flow regions where unsteadiness is present. Higher-fidelity methods such as DNS could improve accuracy, but at substantially greater computational cost.
Lighthill [52] established that fluctuating velocity or turbulence is the source of aerodynamic noise. These sources are intensified near the flat plate surfaces and their TEs. Experiments on various TE geometries [53] show that broadband TE noise is driven by small scale turbulence in this region. Figure 12 compares the RMS of fluctuating velocity predicted 0.6 mm downstream of the TE using mesh of 9.55 million and 12.95 million cells with measurements by Moreau et al. [40]. Although both meshes yield comparable results, the present simulations overpredict the fluctuating velocity near y/c = 0 compared to experimental data.
Figure 12.
RMS of fluctuating velocity 0.6 mm downstream of the TE: Mesh comparison.
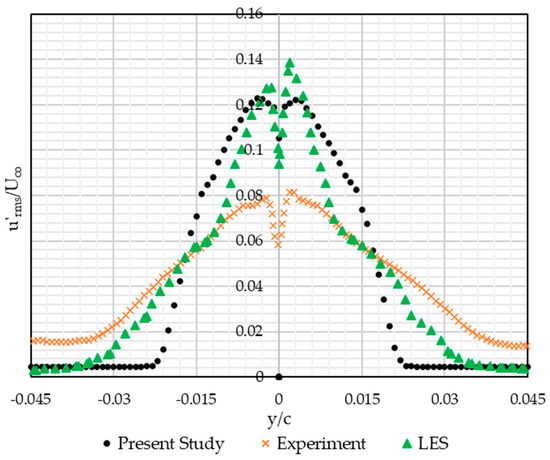
To further examine this behavior, the present predictions are compared with previously published LES results for the same flat plate model [49], as shown in Figure 13. The prior LES study exhibits a similar level of overprediction compared to the experimental data. This may suggest the presence of measurement uncertainty at this location. In particular, the hot-wire anemometer probe was positioned 0.6 mm downstream of the TE, where high velocity gradients and turbulence are present. Fluctuating velocity measurements recorded this close to the TE may be sensitive to the probe location, which may contribute to the differences between the measurements and CFD predictions.
Figure 13.
RMS of fluctuating velocity 0.6 mm downstream of the TE. Sources: Experiment [40]; LES [49].
Since the flow predictions from both meshes are comparable and align with prior computational studies, the results are considered acceptable, and the mesh with 9.55 million cells was selected for subsequent analysis.
3.1.2. Farfield Noise Above the TE
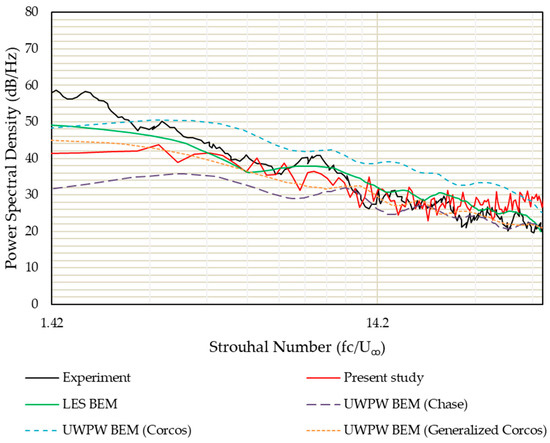
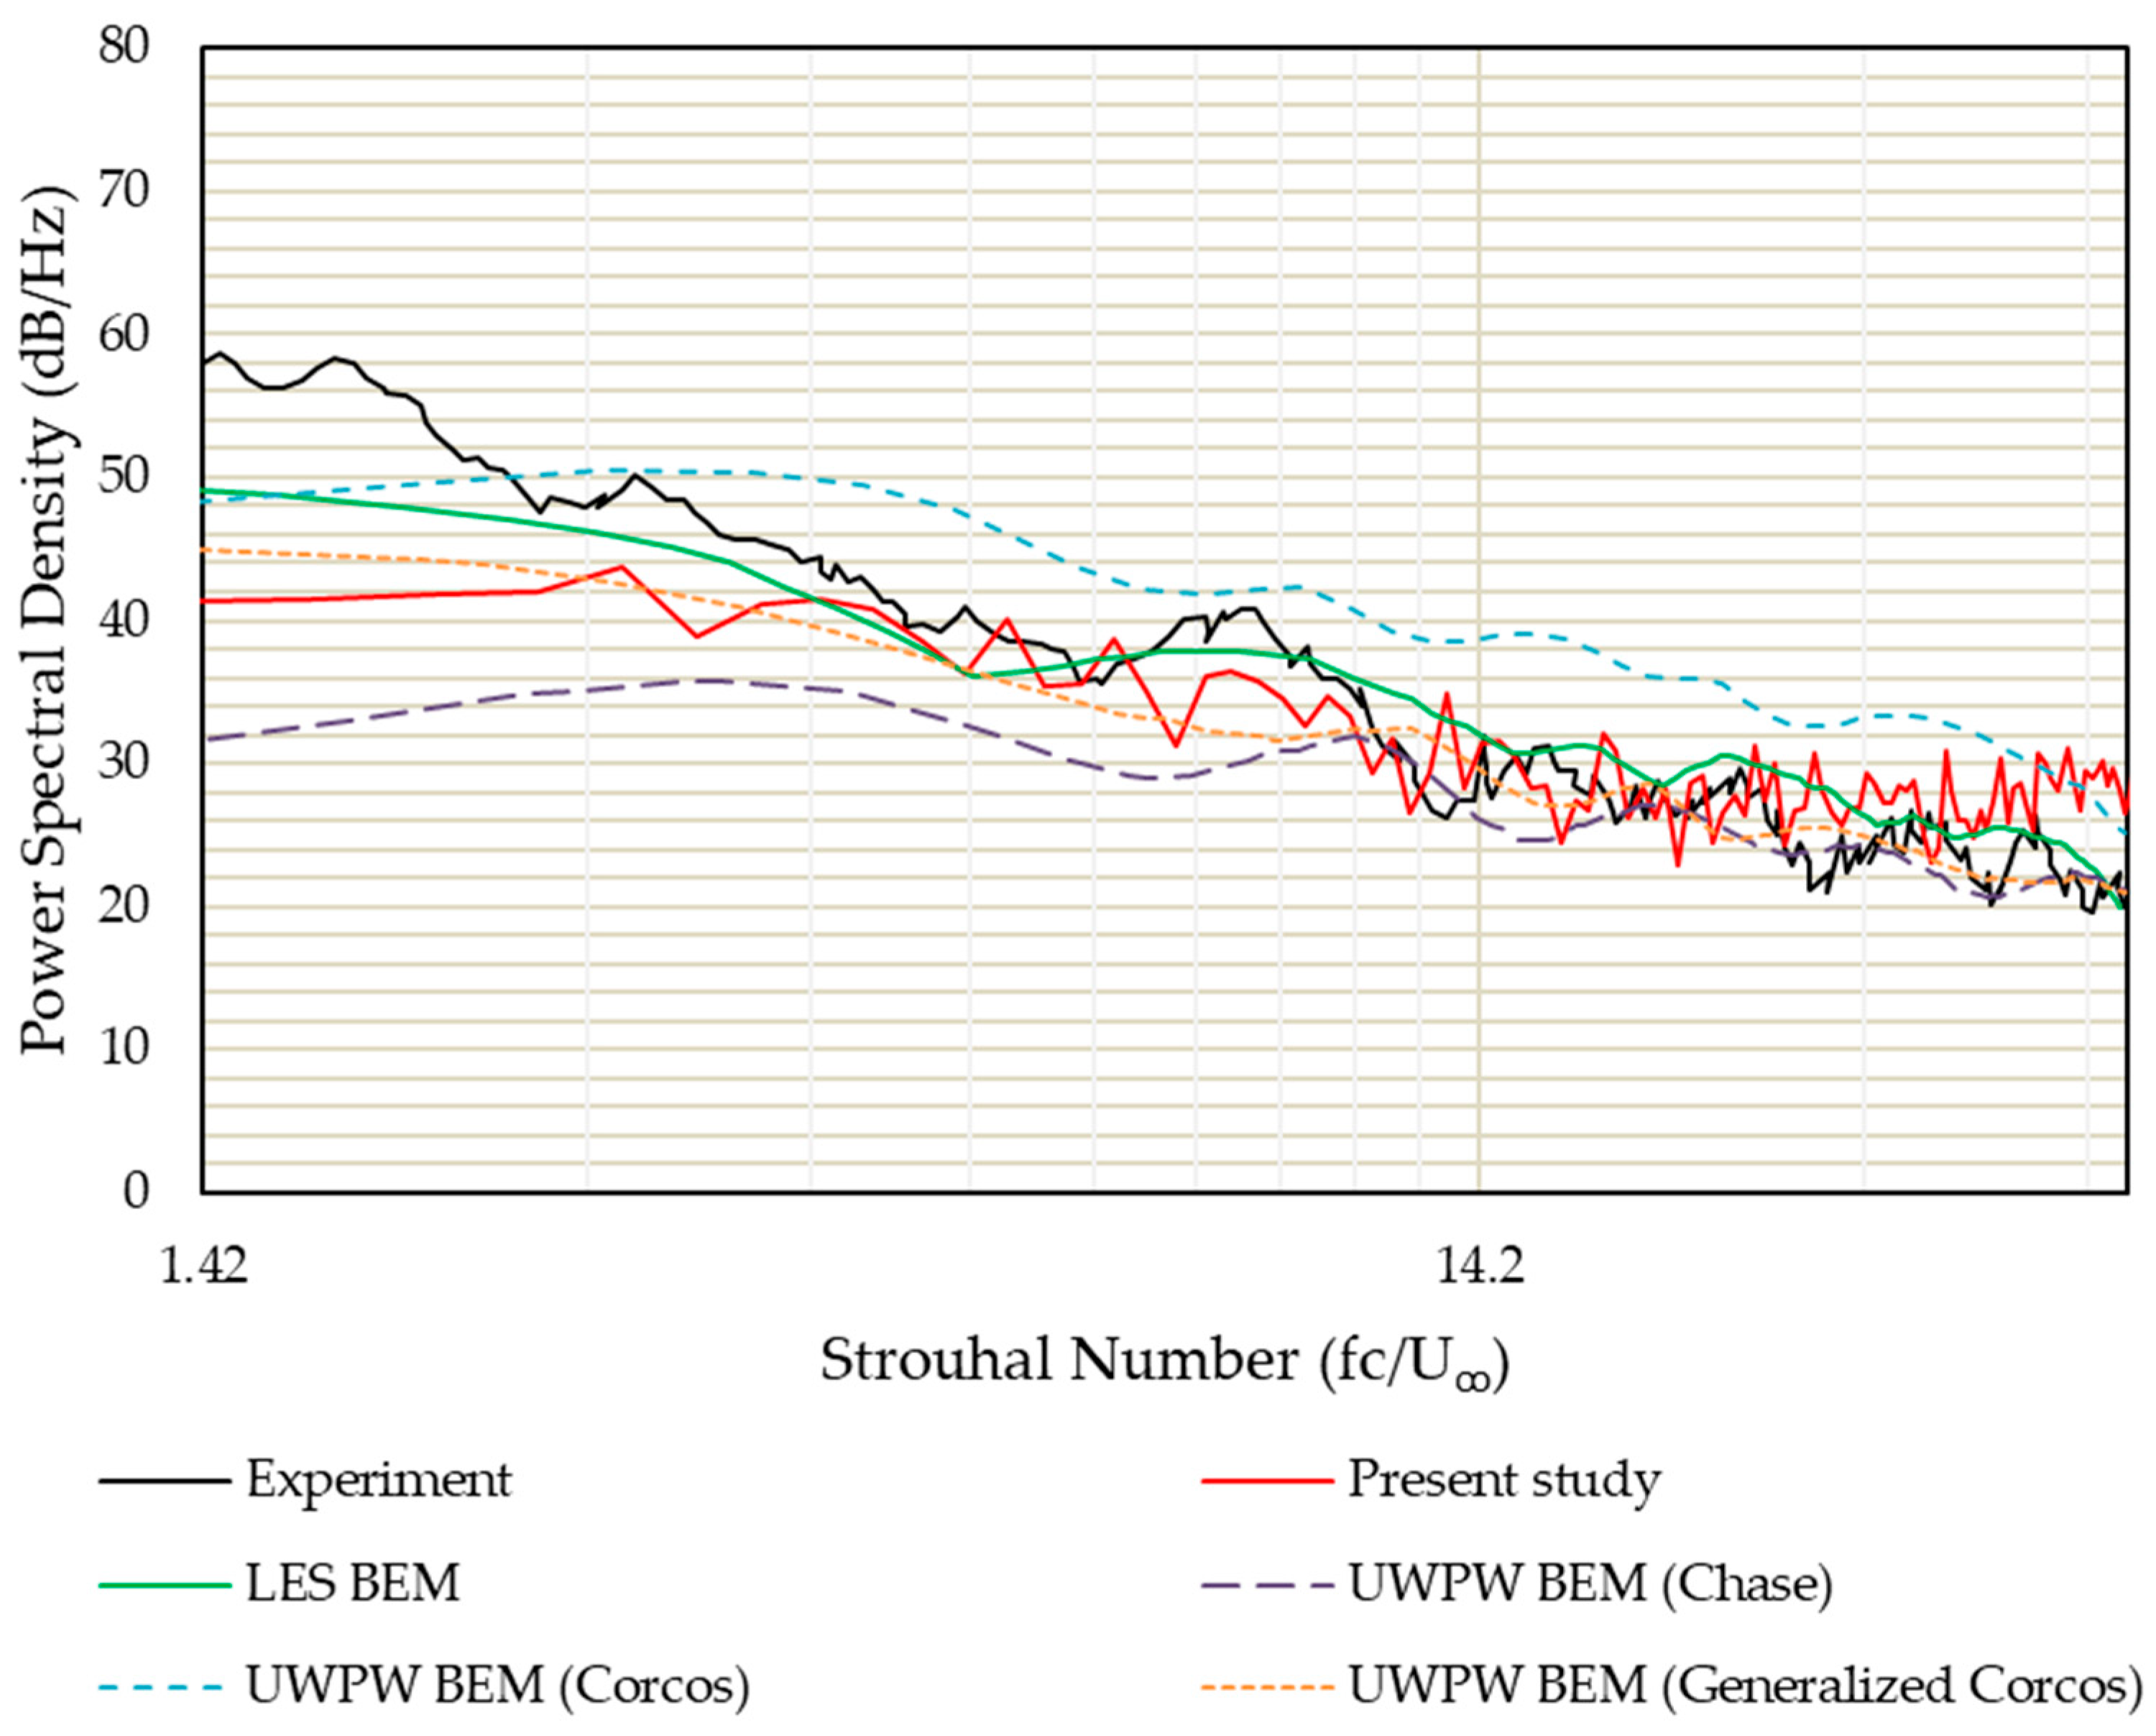
The Strouhal number was calculated using a reference chord length of 0.2 m and a freestream velocity of 35 m/s. The power spectral density was plotted against the Strouhal number, as shown in Figure 14, and the predictions agree with previous computational studies. Relative to measurements, farfield noise is underpredicted below 750 Hz (St = 4.28) and overpredicted above 7000 Hz (St = 40.00). The predictions are consistent with measurements between 900 and 2500 Hz (St = 5.14–14.28), where TE noise is dominant [49,53]. Compared to experiments, discrepancies in the prediction may arise from limitations of IDDES in resolving flow downstream of TE. Although higher-fidelity methods such as DNS could improve accuracy, they require substantially greater computational resources. Overall, the present farfield noise predictions fall within the accuracy bounds of prior computational studies.
Figure 14.
Farfield noise 0.585 m above the TE. Sources: Experiment [40]; LES BEM [49], UWPW BEM (Chase) [49], UWPW BEM (Corcos) [49]; UWPW BEM (Generalized Corcos) [49].
3.2. Comparison of Compliant Coating Performance
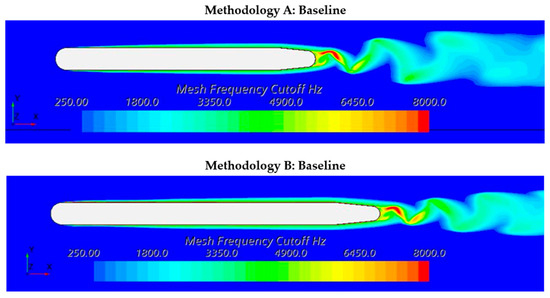
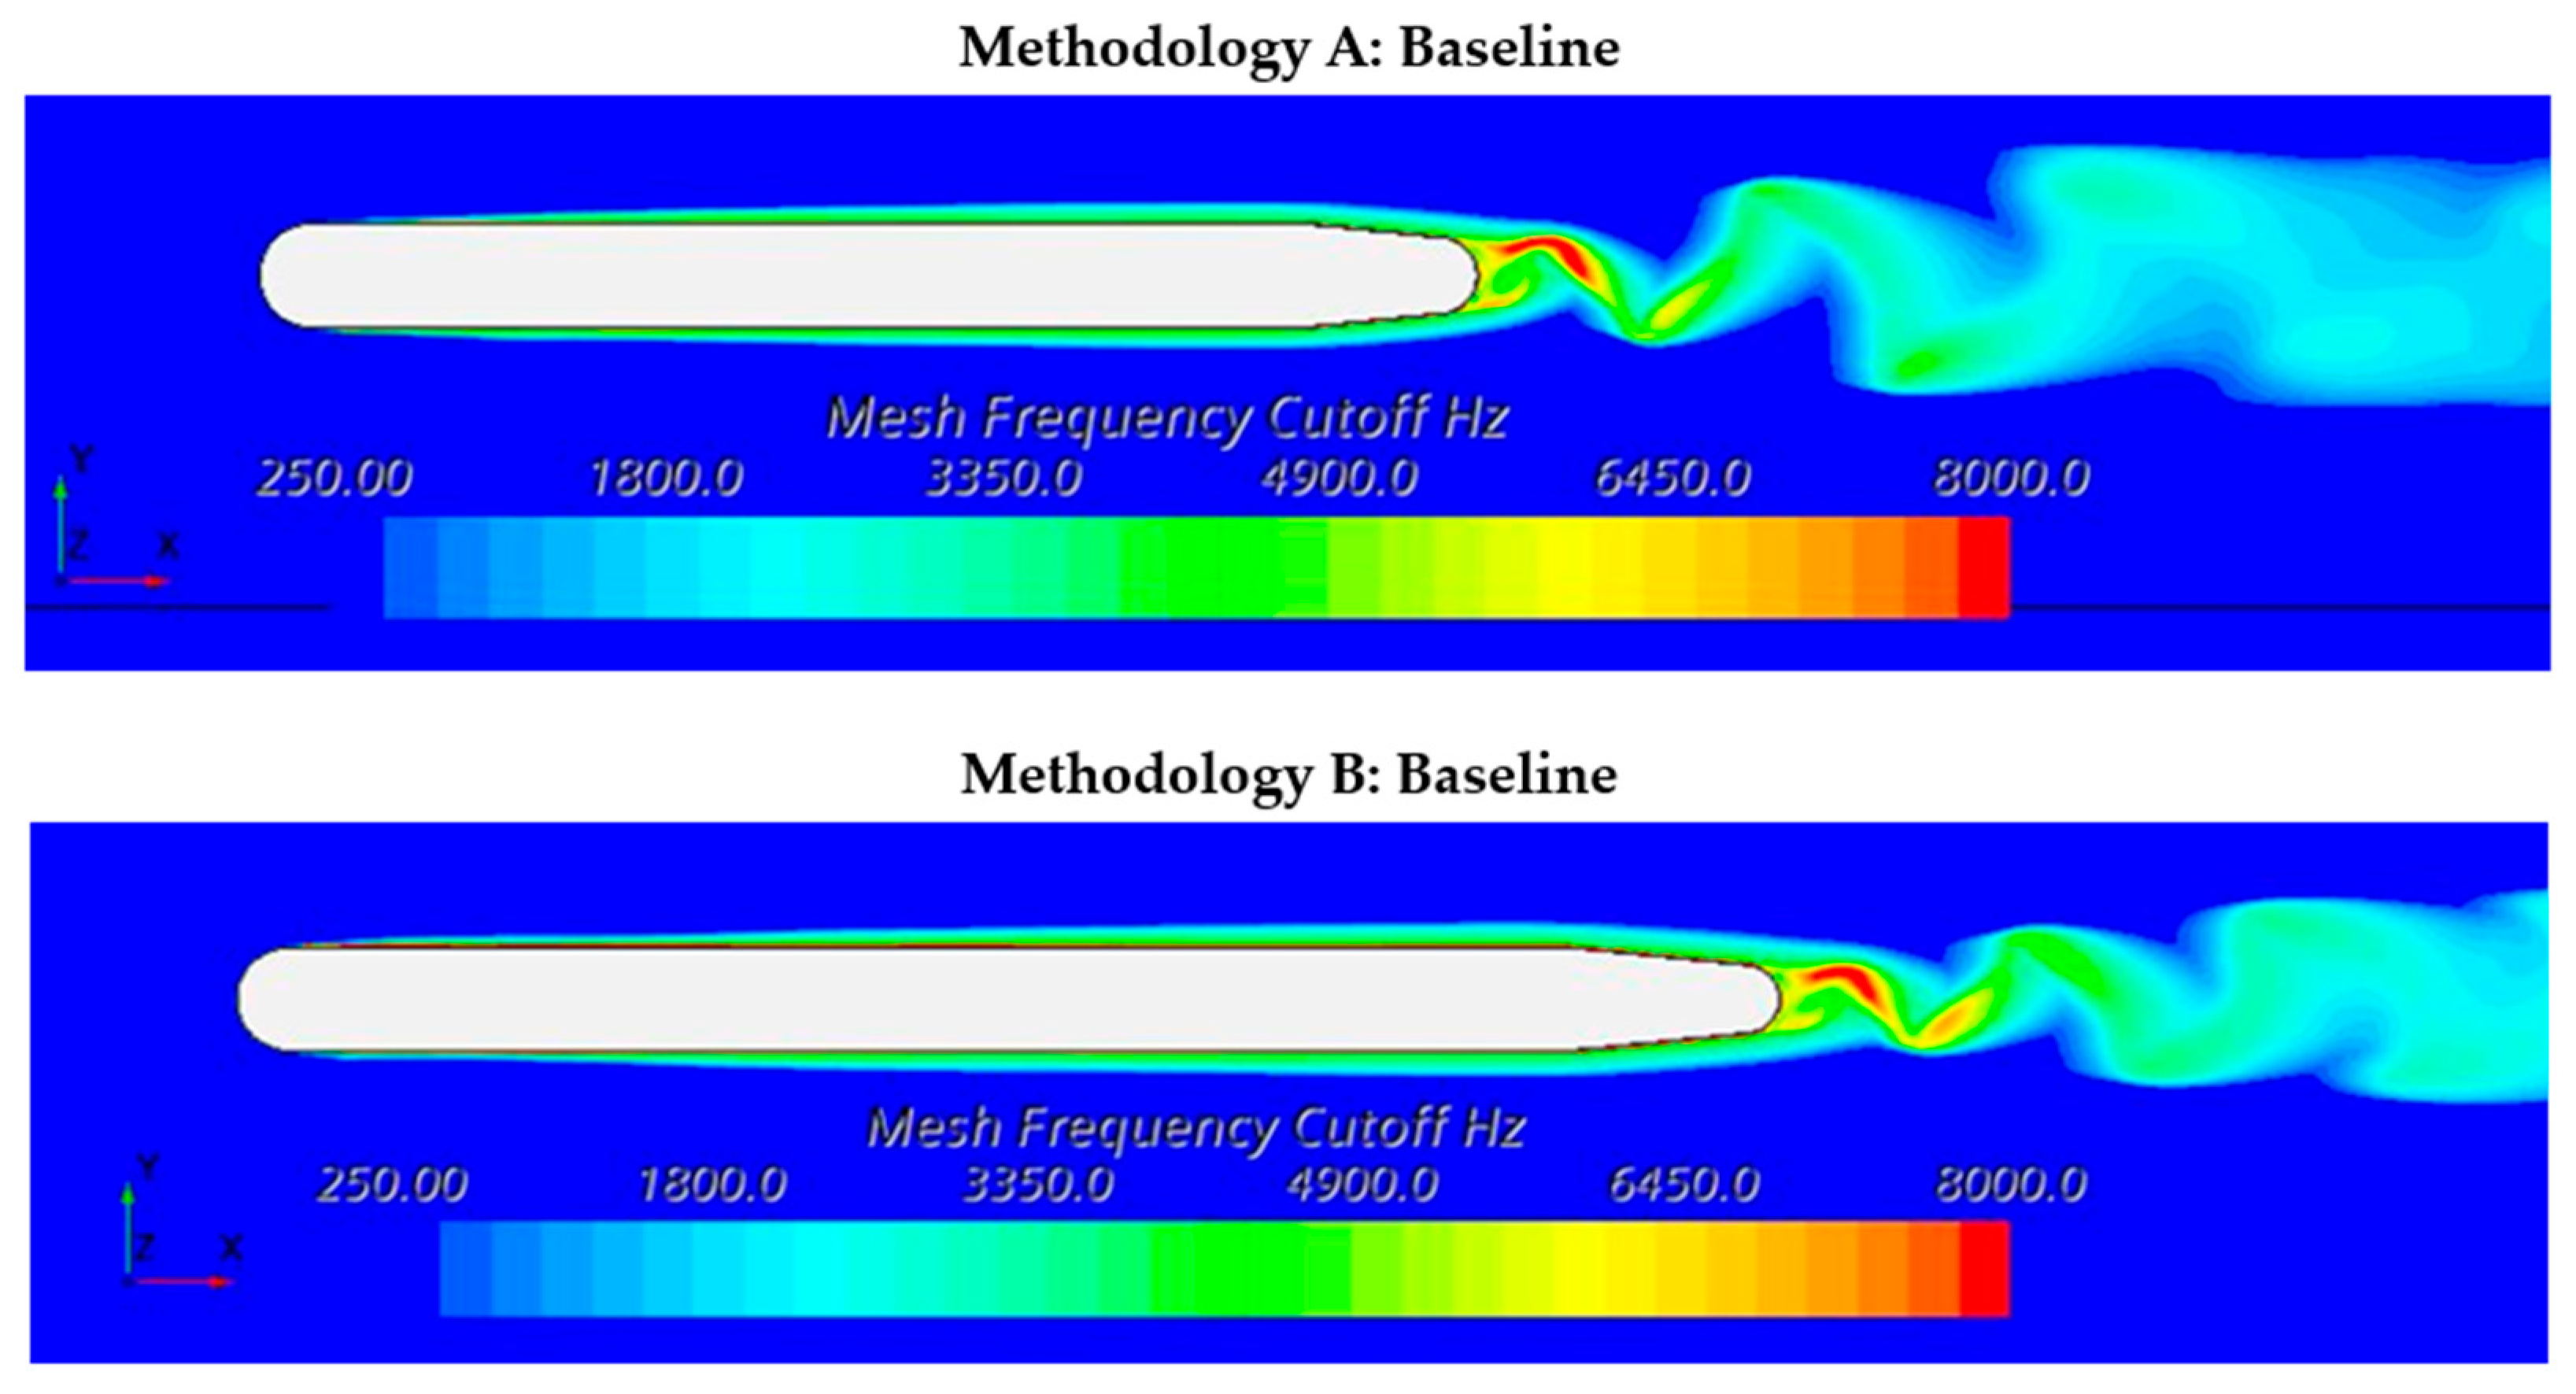
As shown in Figure 15, the mesh frequency cutoff parameter was used to refine the baseline-1 and baseline-2 grids to approximately 17.8 million and 18.5 million cells, respectively. This ensured resolution of noise sources up to 8000 Hz.
Figure 15.
Mesh frequency cutoff.
3.2.1. Compliant Coating Applied on the Flat Plate
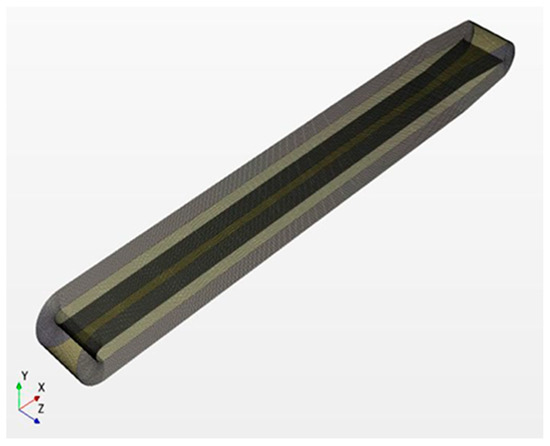
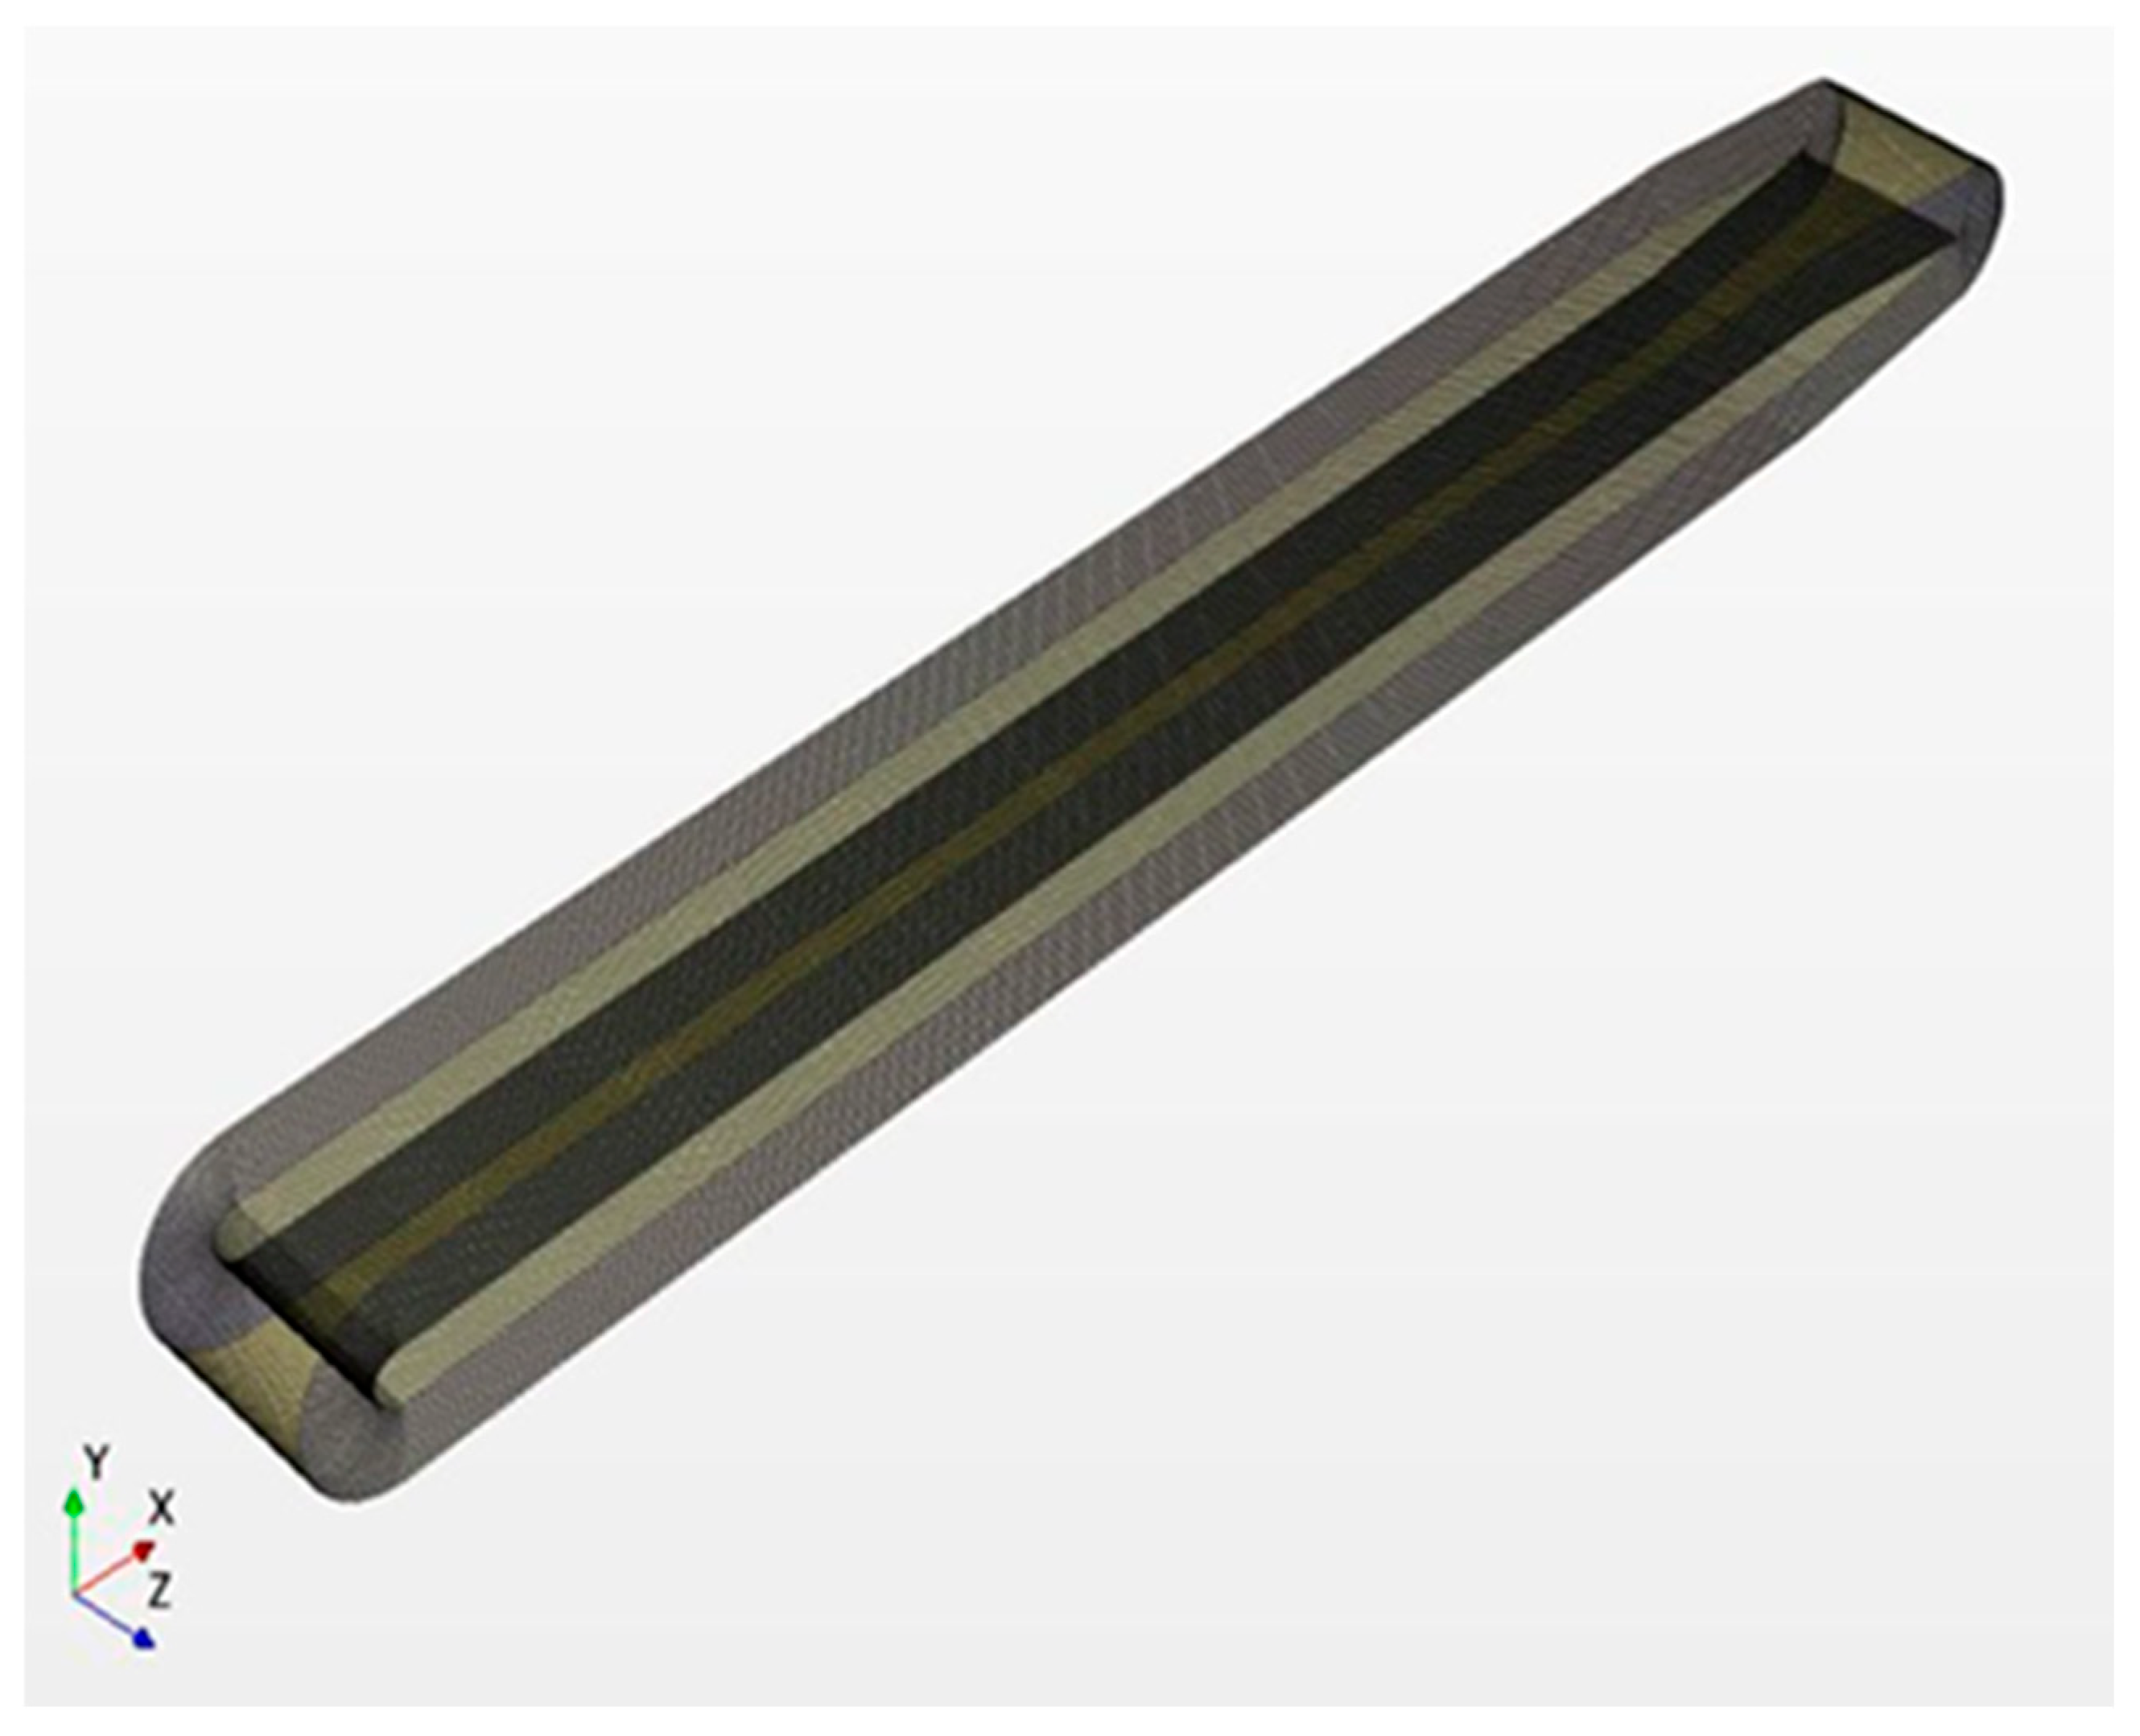
The computational domain and fluid boundary conditions were the same as the baseline cases. A hexahedral mesh with 50 cells distributed along the coating thickness was generated (Figure 16). A mapped contact interface at the coating’s outer surface enabled Fluid–Structure Interaction with the surrounding air. Symmetry conditions were applied on the coating side planes, while the inner surface was fixed and the outer surface deformed via mesh morphing.
Figure 16.
Compliant coating mesh.
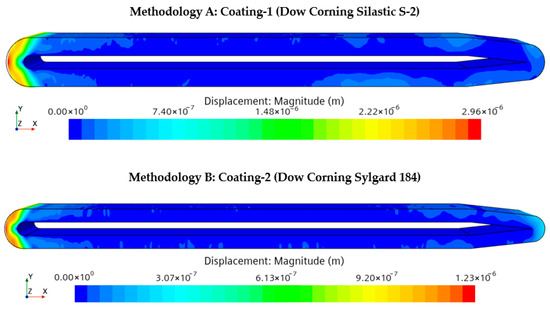
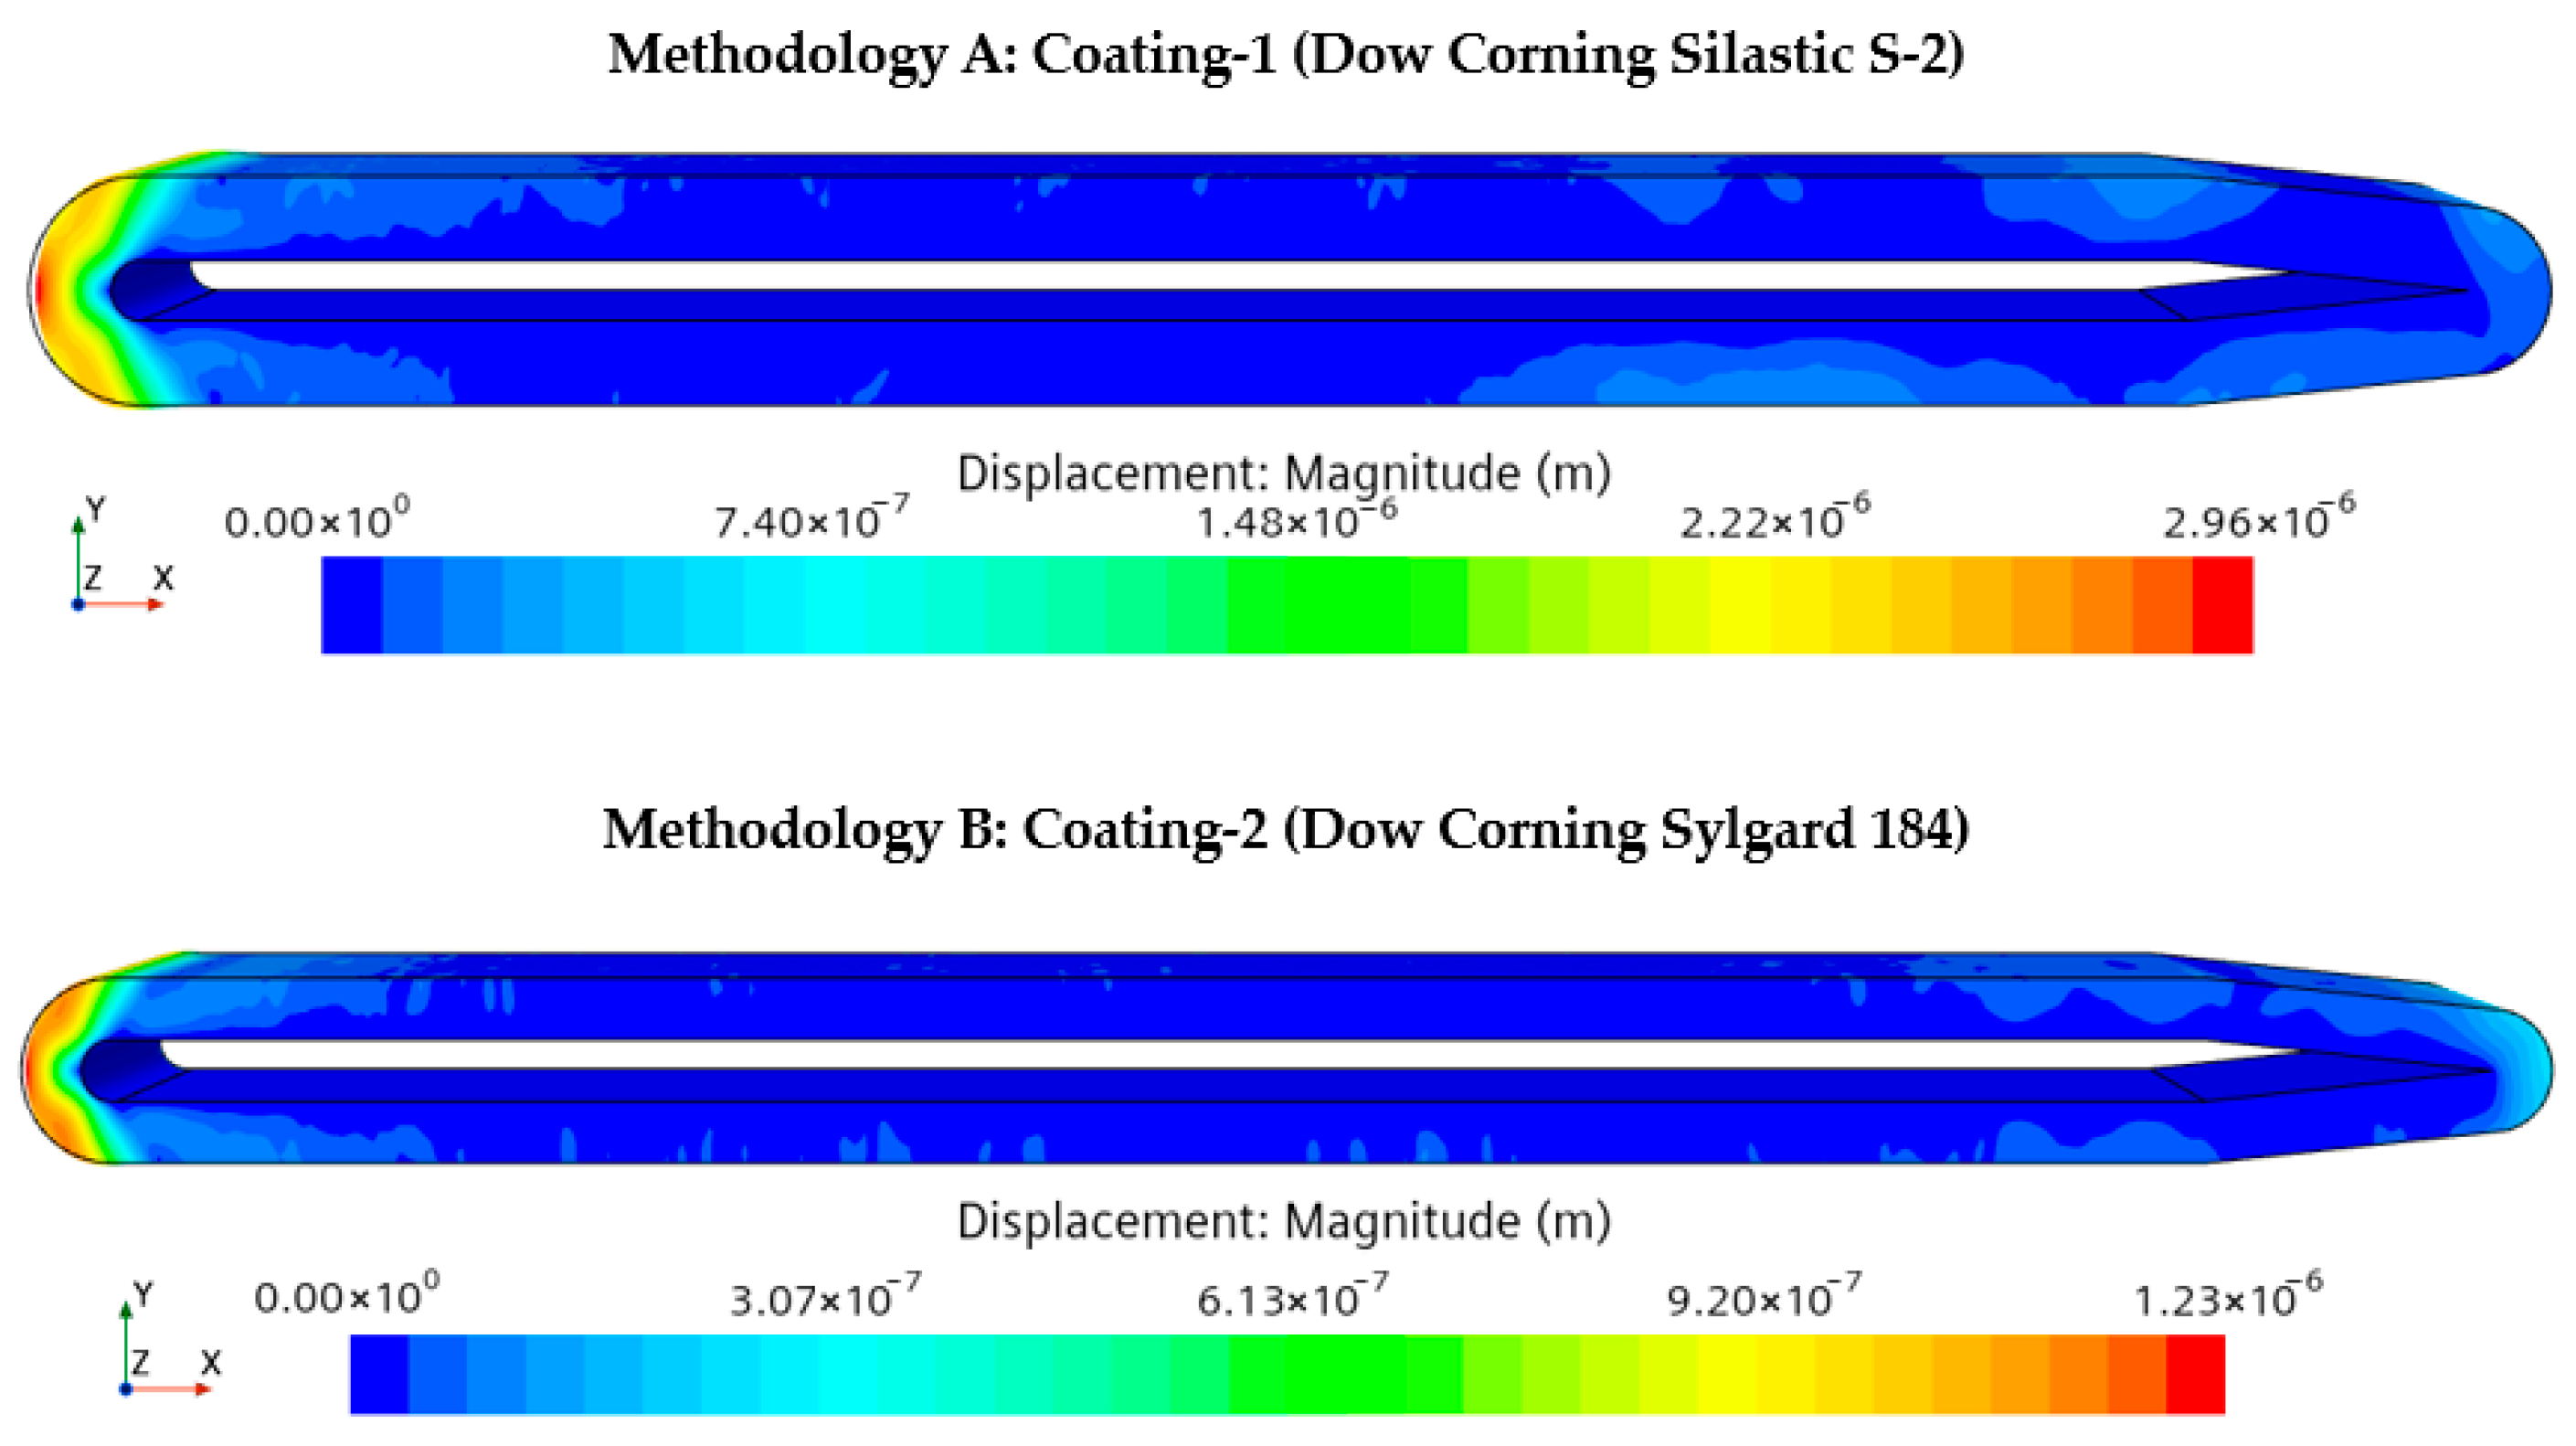
The unsteady CFD–FSI simulation was performed using the methodology described in Section 2.3. Coating-1 exhibited micron-scale deformation along the chord, with a maximum of 2.96 μm at the LE, while coating-2 showed a maximum deformation of 1.23 μm at the LE, as shown in Figure 17. These values are consistent with measurements by Lee et al. [36], who reported displacement ranges of 1.67–3.82 μm and RMS values of 0.32–0.72 μm for homogeneous isotropic compliant coatings.
Figure 17.
Compliant coating deformation (scaled 200 times).
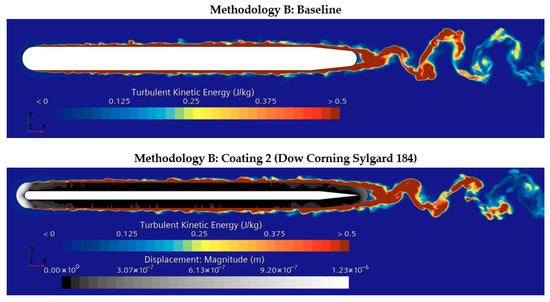
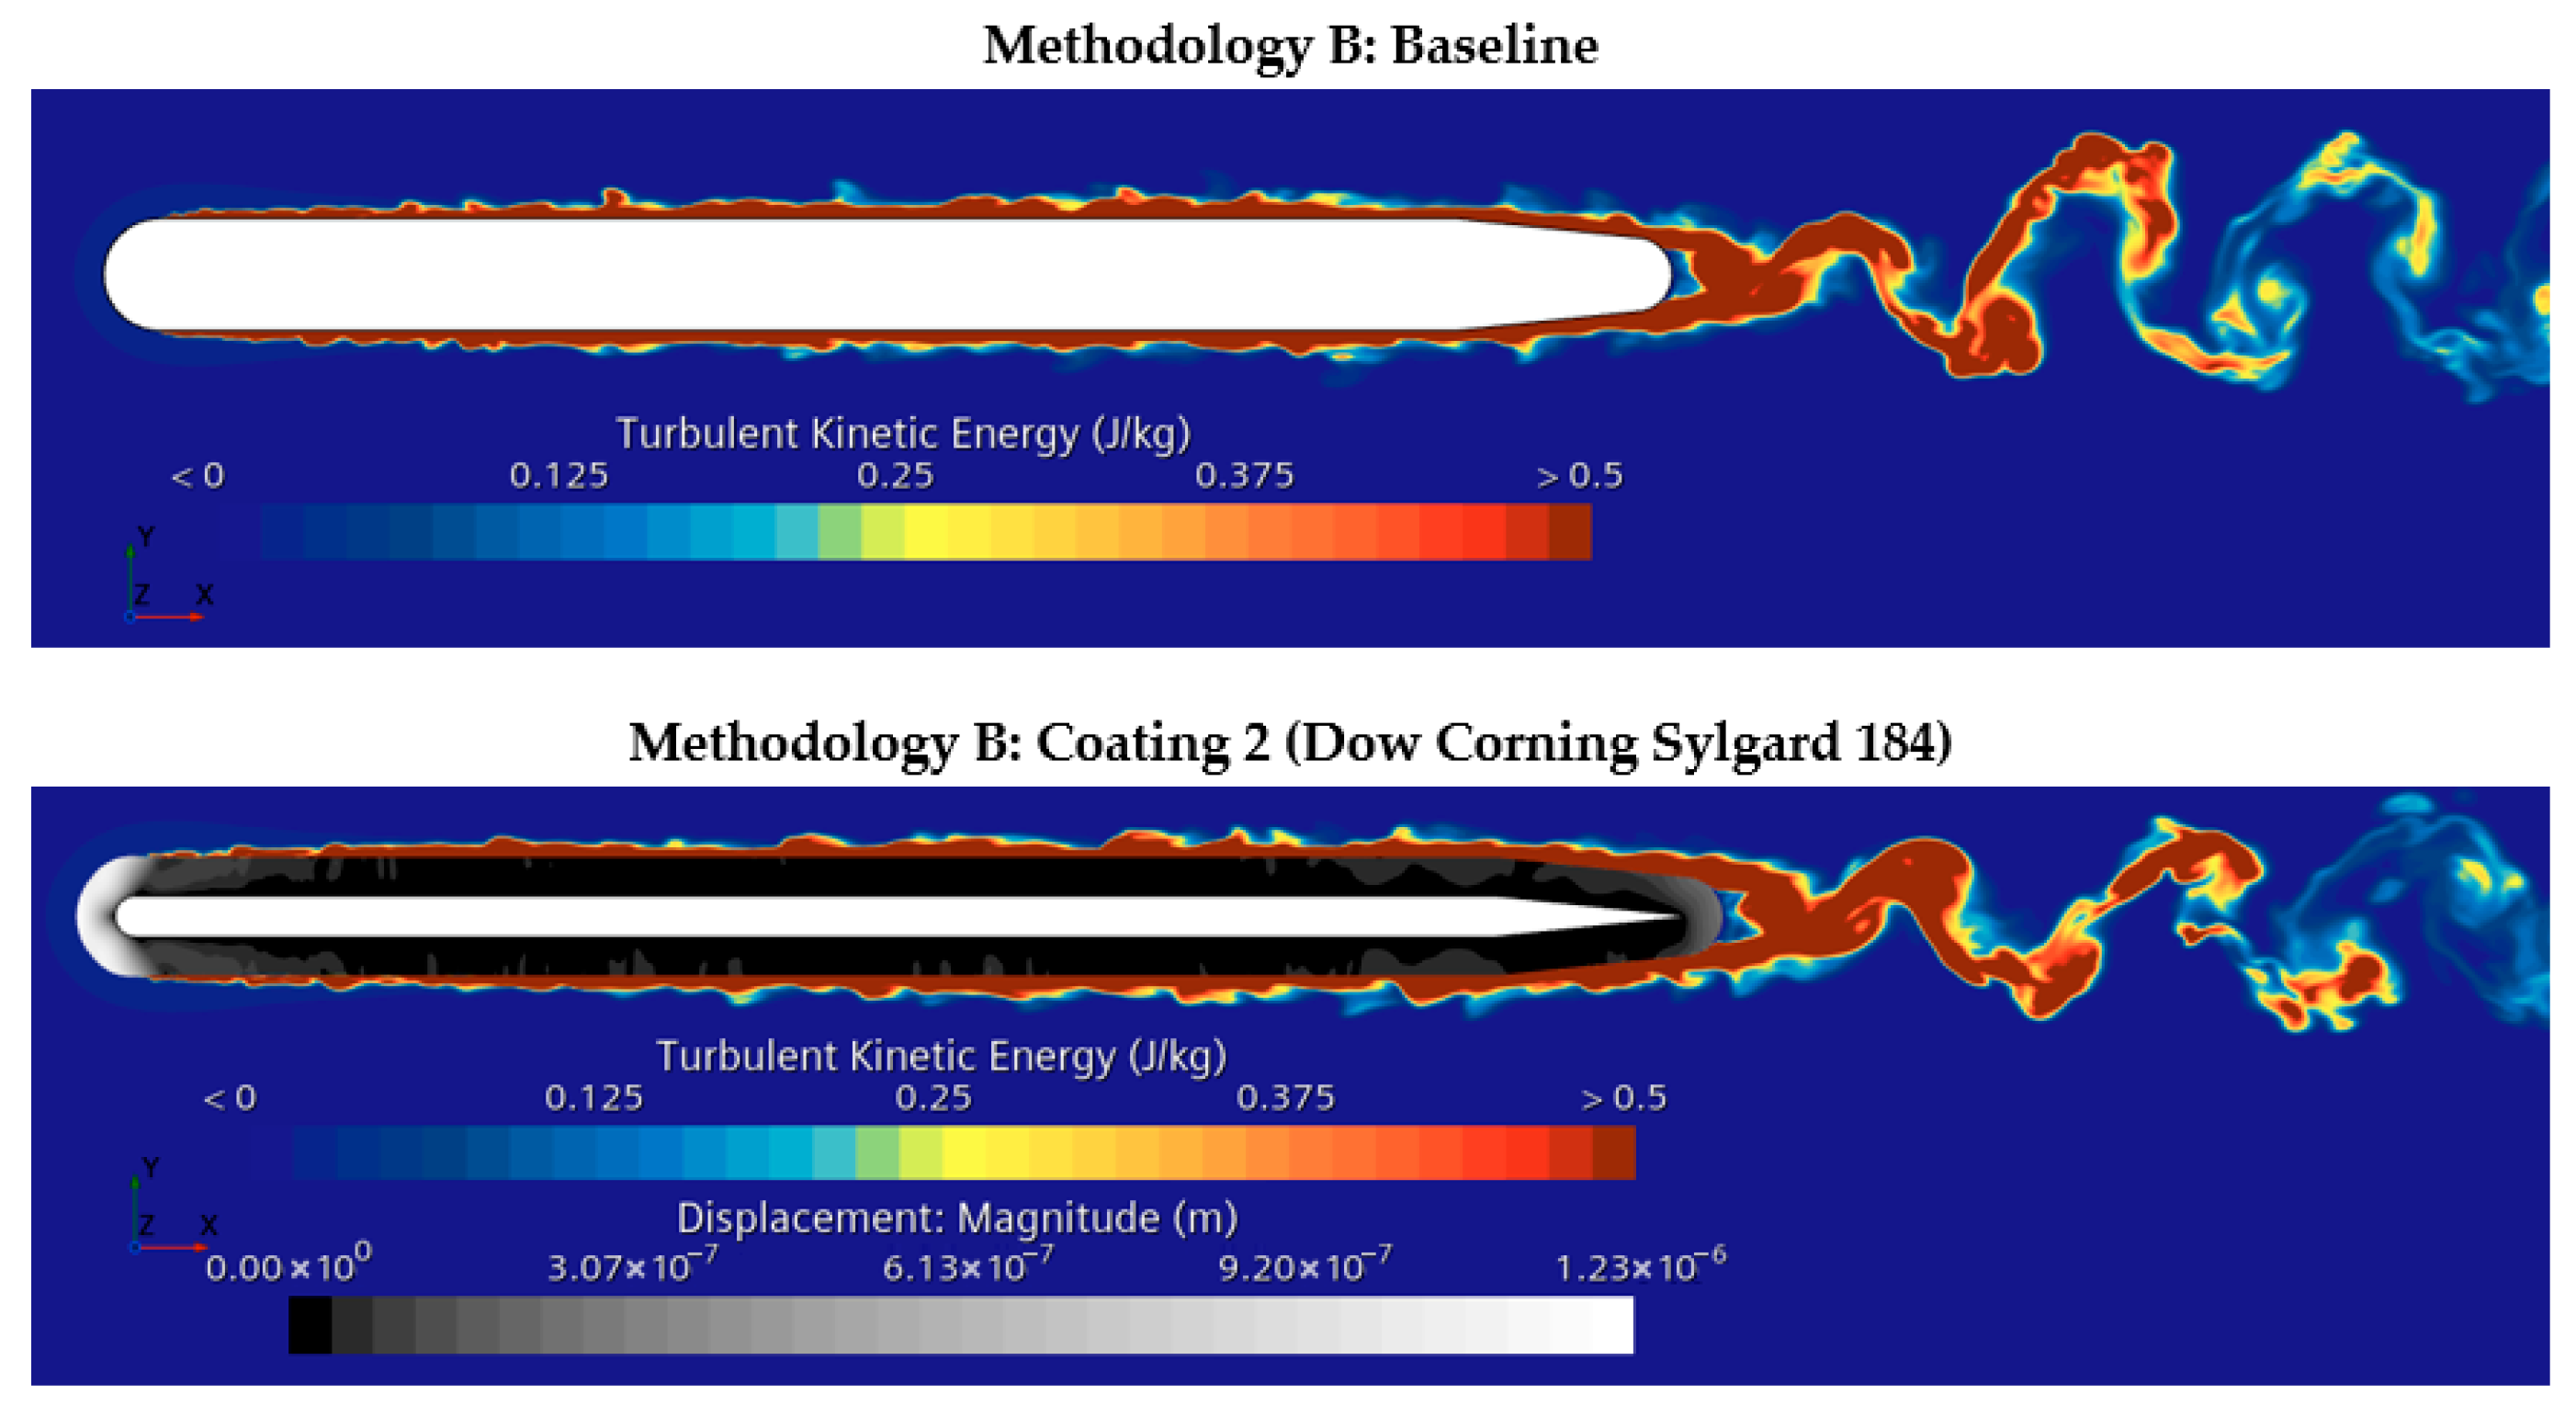
Figure 18 compares the TKE distributions for the baseline and the plate coated with Dow Corning Sylgard 184. A slight reduction in the TKE spread along the direction normal to the chord downstream of the TE is observed, indicating weakening of noise sources. This reduction may contribute to the favorable effects in farfield noise when the coating is applied.
Figure 18.
Turbulent kinetic energy distribution.
3.2.2. Farfield Noise
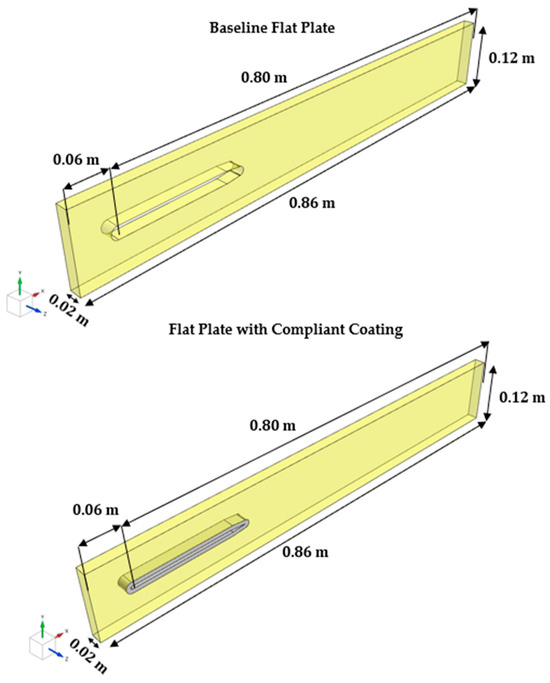
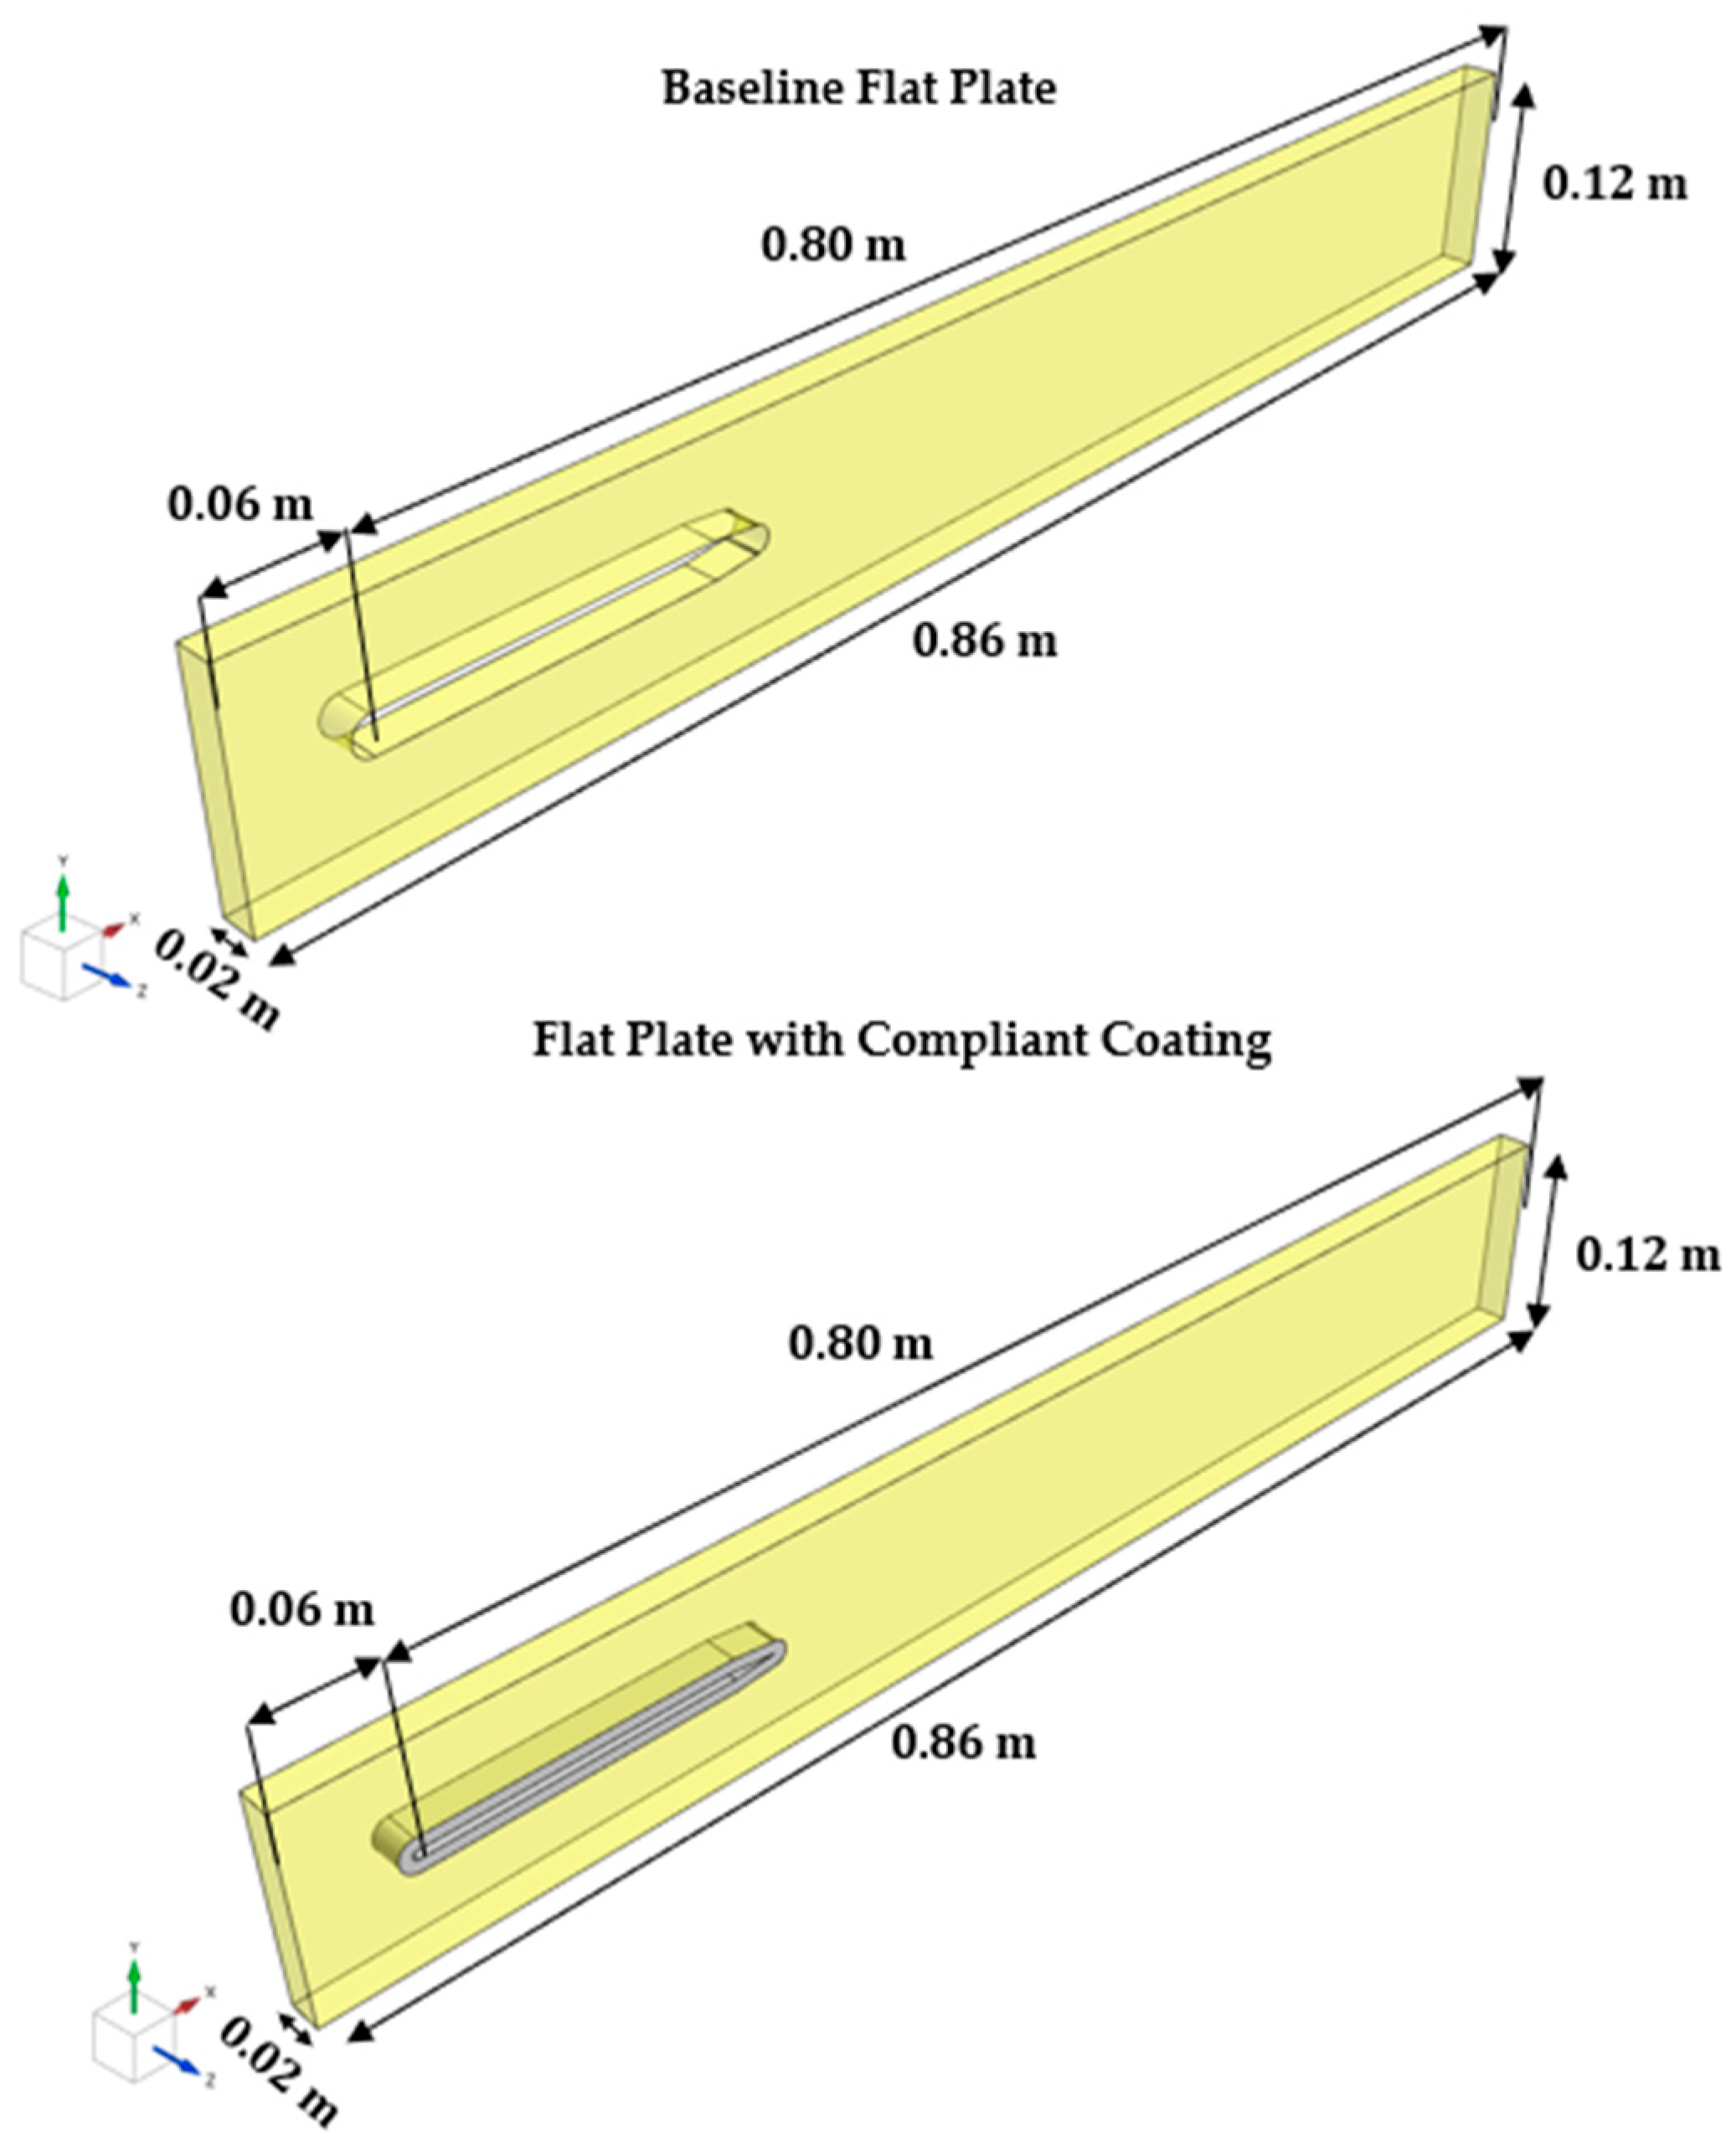
The FW-H formulation described in Section 2.1 was employed for farfield noise prediction. The permeable surfaces used for the baseline and compliant coating cases are shown in Figure 19. Each surface has a length of 0.86 m, a width of 0.02 m, and a height of 0.12 m. Their front and rear surfaces are located 0.06 m upstream and 0.80 m downstream of the center of curvature of the semicircular leading edge, respectively.
Figure 19.
Permeable surface dimensions for baseline and compliant coating cases.
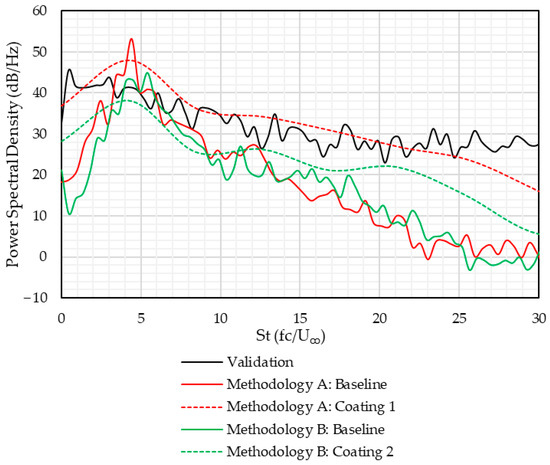
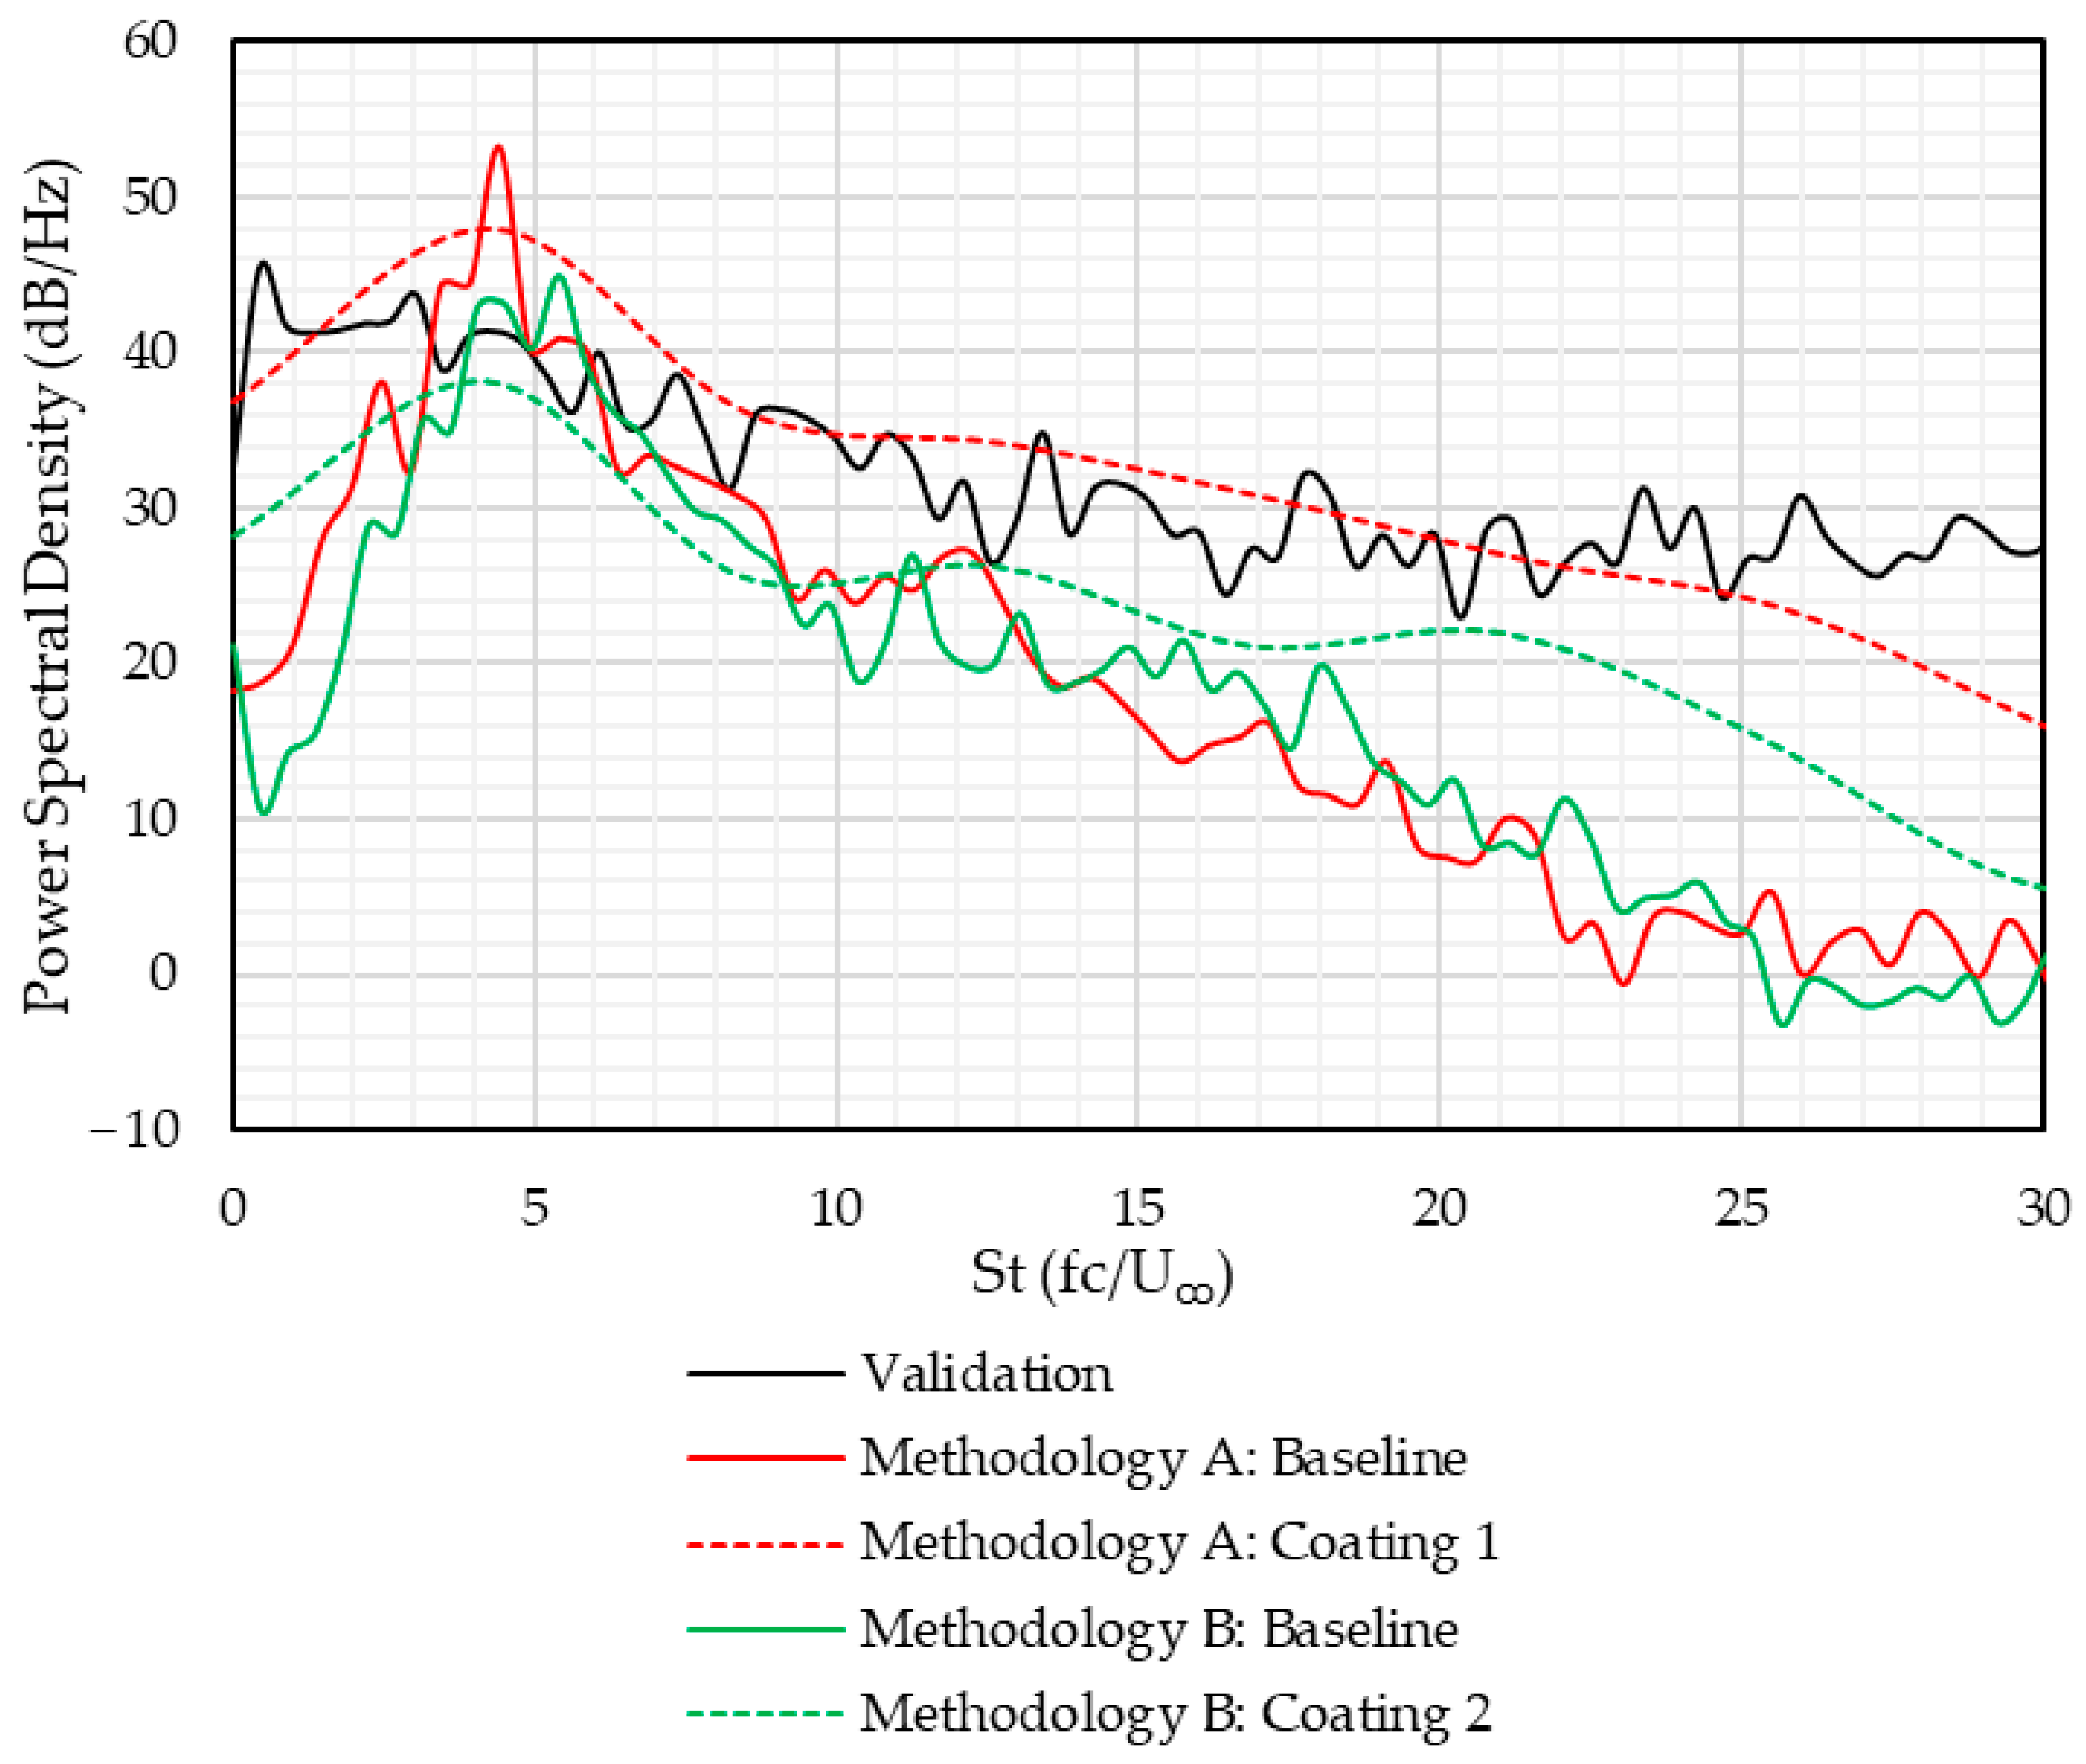
Farfield noise predictions (Figure 20) show that coating-1 increases noise by 10–15 dB/Hz across most of the frequency range, with only a 6 dB/Hz reduction at 700 Hz (St = 4.00), making it unsuitable for noise mitigation. In contrast, coating-2 achieves a 2–4 dB/Hz reduction over 600–1575 Hz (St = 3.50–9.00), with a peak drop of 5 dB/Hz at 700 Hz (St = 4.00), and slightly shifts noise energy towards lower frequencies. However, coating-2 also causes an 8–10 dB/Hz increase in noise for f > 3150 Hz (St > 18.00). Overall, the results indicate that coating material properties strongly influence TE noise behavior.
Figure 20.
Comparison of farfield noise predicted 0.585 m above the TE.
Table 2 summarizes the OASPL calculated using Equations (2)–(4). Both baseline cases lie within the range of the validation results. Coating-1 increases OASPL by 2.89 dB and raises the RMS of fluctuating pressure by a factor of 1.39, whereas coating-2 reduces the OASPL by 1.85 dB with a corresponding decrease in RMS of fluctuating pressure by a factor of 0.808. These results indicate that coating-2 exhibits favorable noise mitigation behavior.
Table 2.
Overall sound pressure level.
Choi et al. [35] showed that favorable flow modulation requires the coating’s resonant frequency to satisfy Equations (8) and (9). Further studies are needed to investigate its relationship with coating material properties and TE noise.
where
- f0 is the resonant frequency in Hz.
- ν is the kinematic viscosity.
- u∗ is the friction velocity.
3.3. Experimental Measurements on Compliant Coating Performance
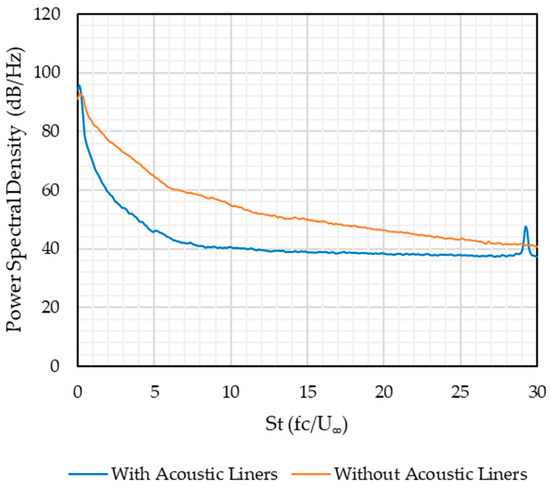
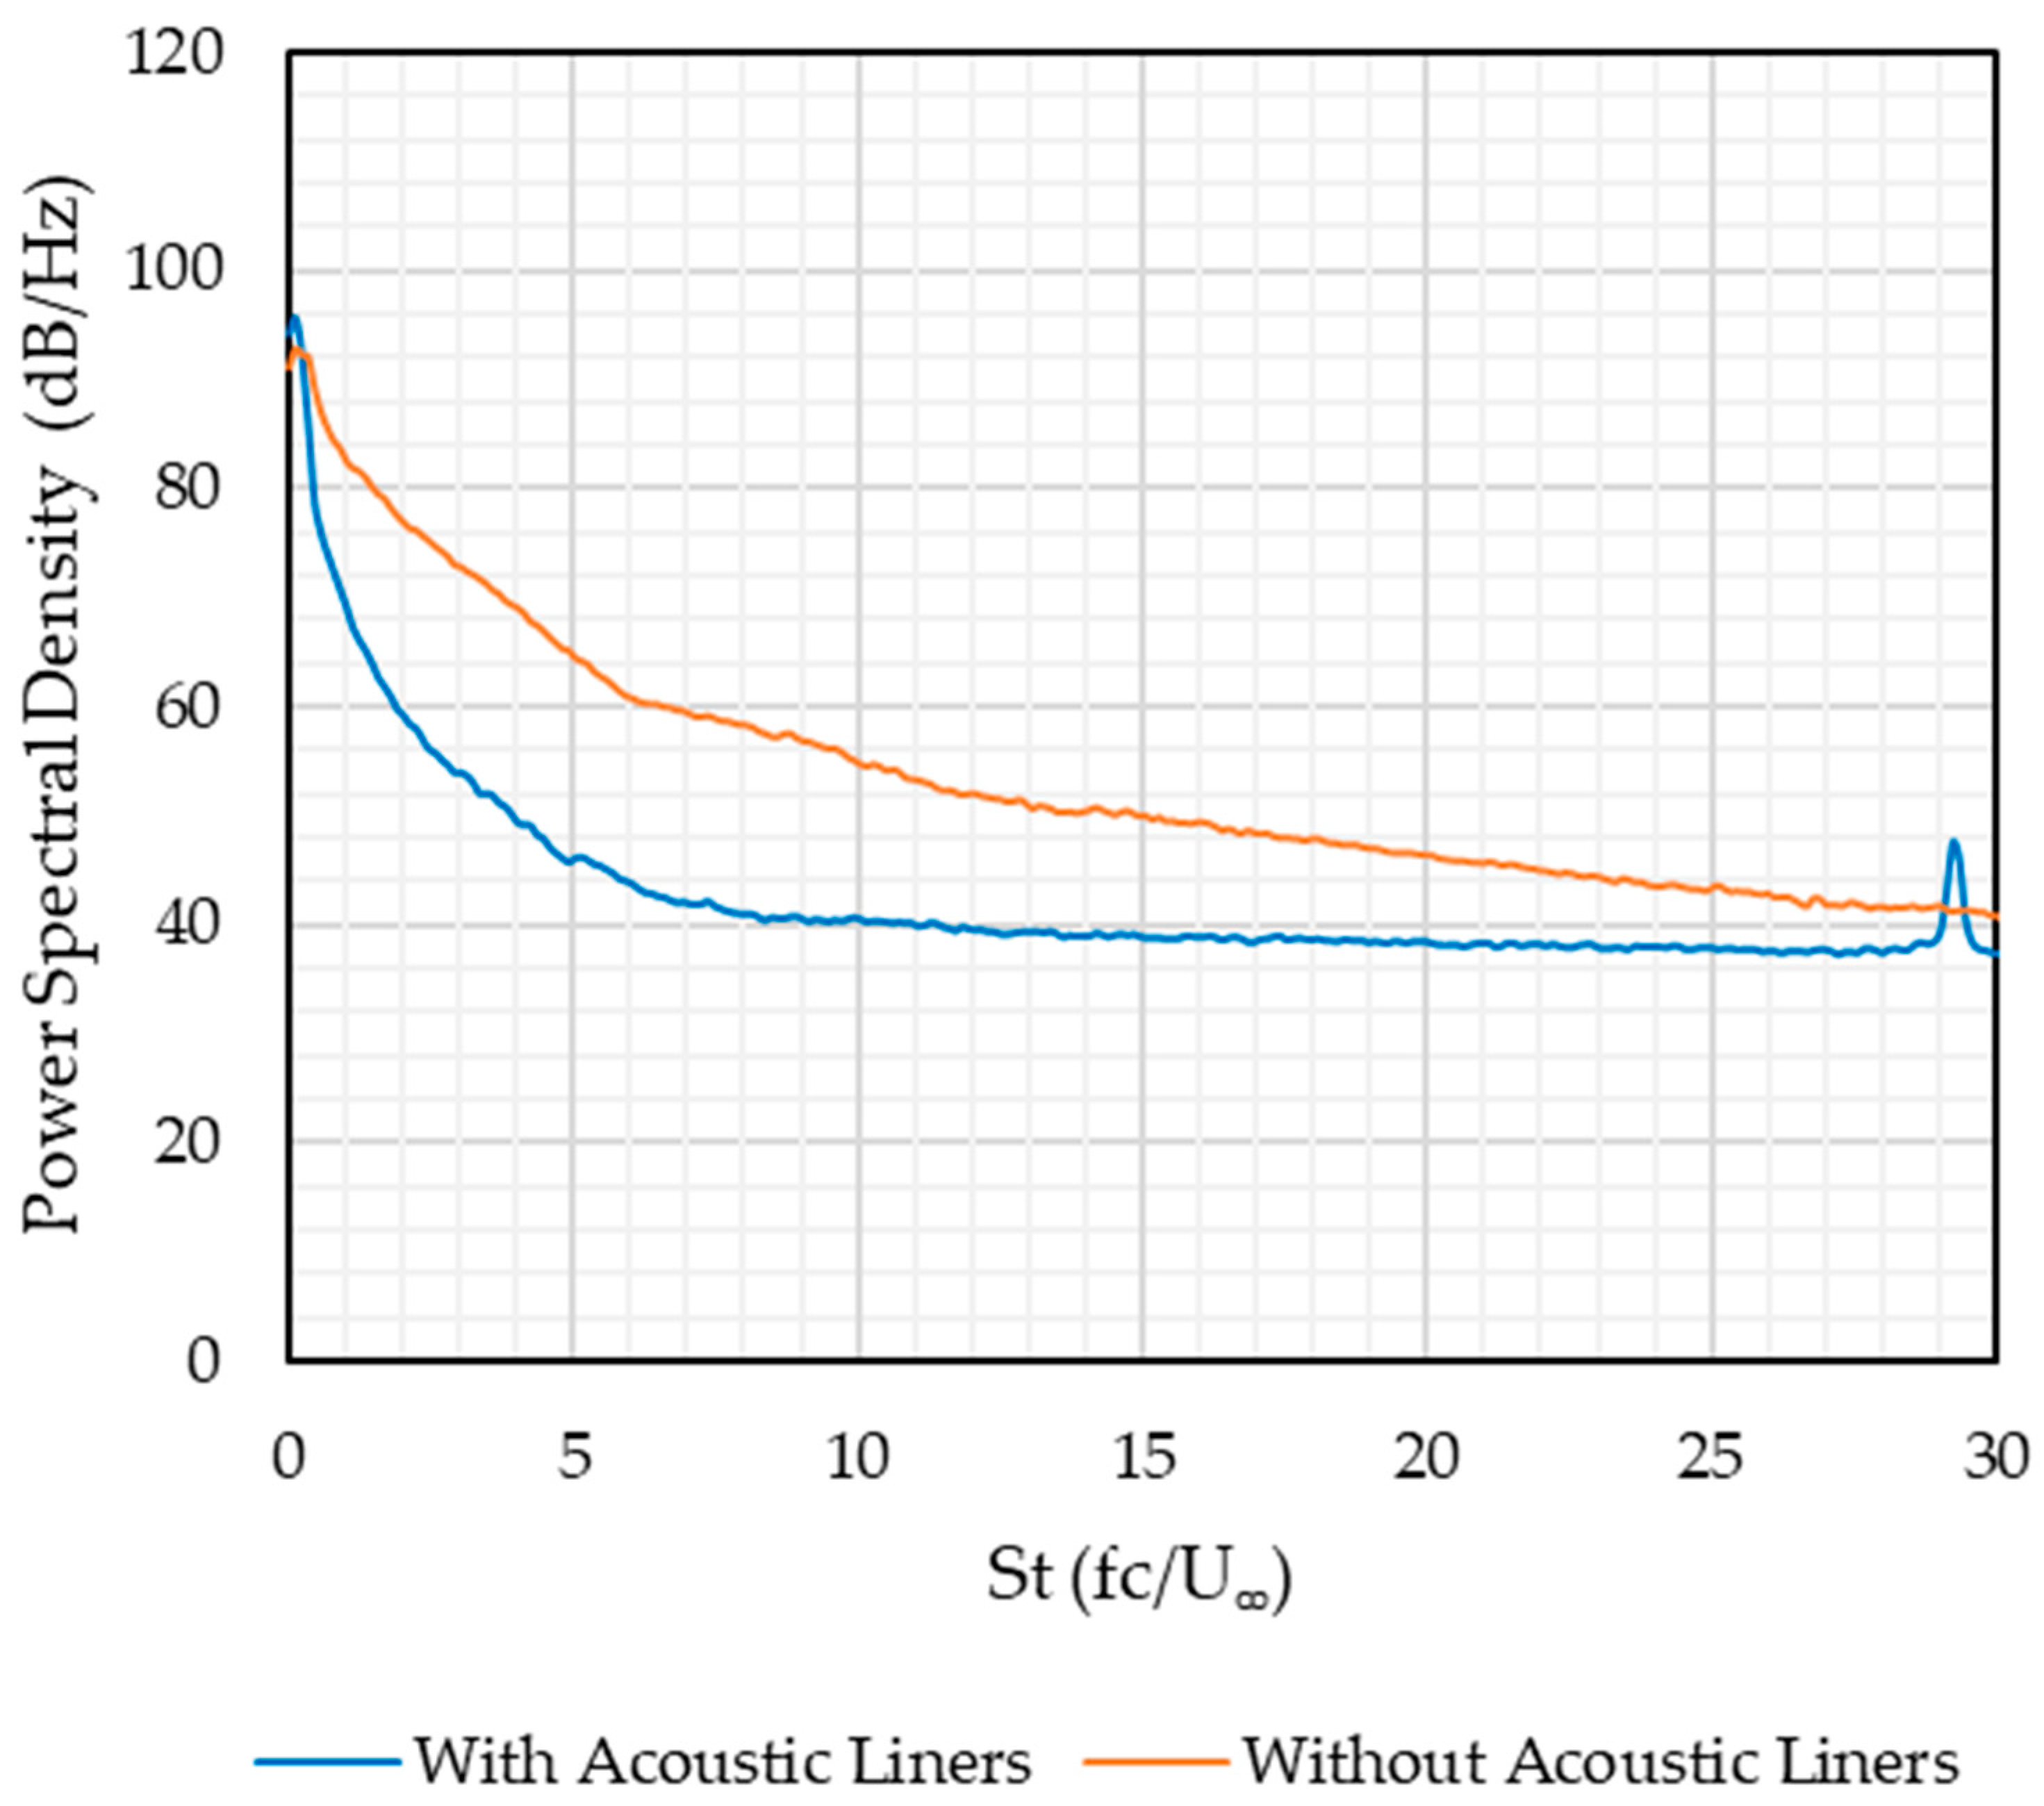
Wind tunnel tests were conducted at 15 m/s. As shown in Figure 21, acoustic liners reduced background noise across the frequency range of interest, with a peak drop of 19.85 dB/Hz at 703 Hz (St = 4.01). Given these improvements, subsequent noise measurements were taken with the acoustic liners in place.
Figure 21.
Background noise measurements.
Moreau et al. [40] conducted anechoic wind tunnel experiments with a flat plate under fully turbulent conditions to measure noise from regions such as the LE and TE and identify dominant noise sources. They showed that the cross-correlation magnitude ΔtTE was significantly larger than ΔtLE, indicating that TE noise was dominant. Based on their experiments, the present study employs a flat plate with the same dimensions and wind speed, and therefore the farfield noise measured in the present study is also expected to be dominated by TE noise.
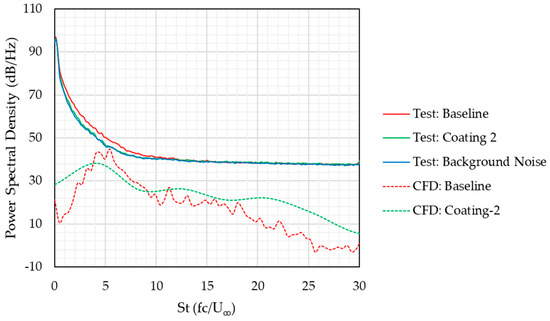
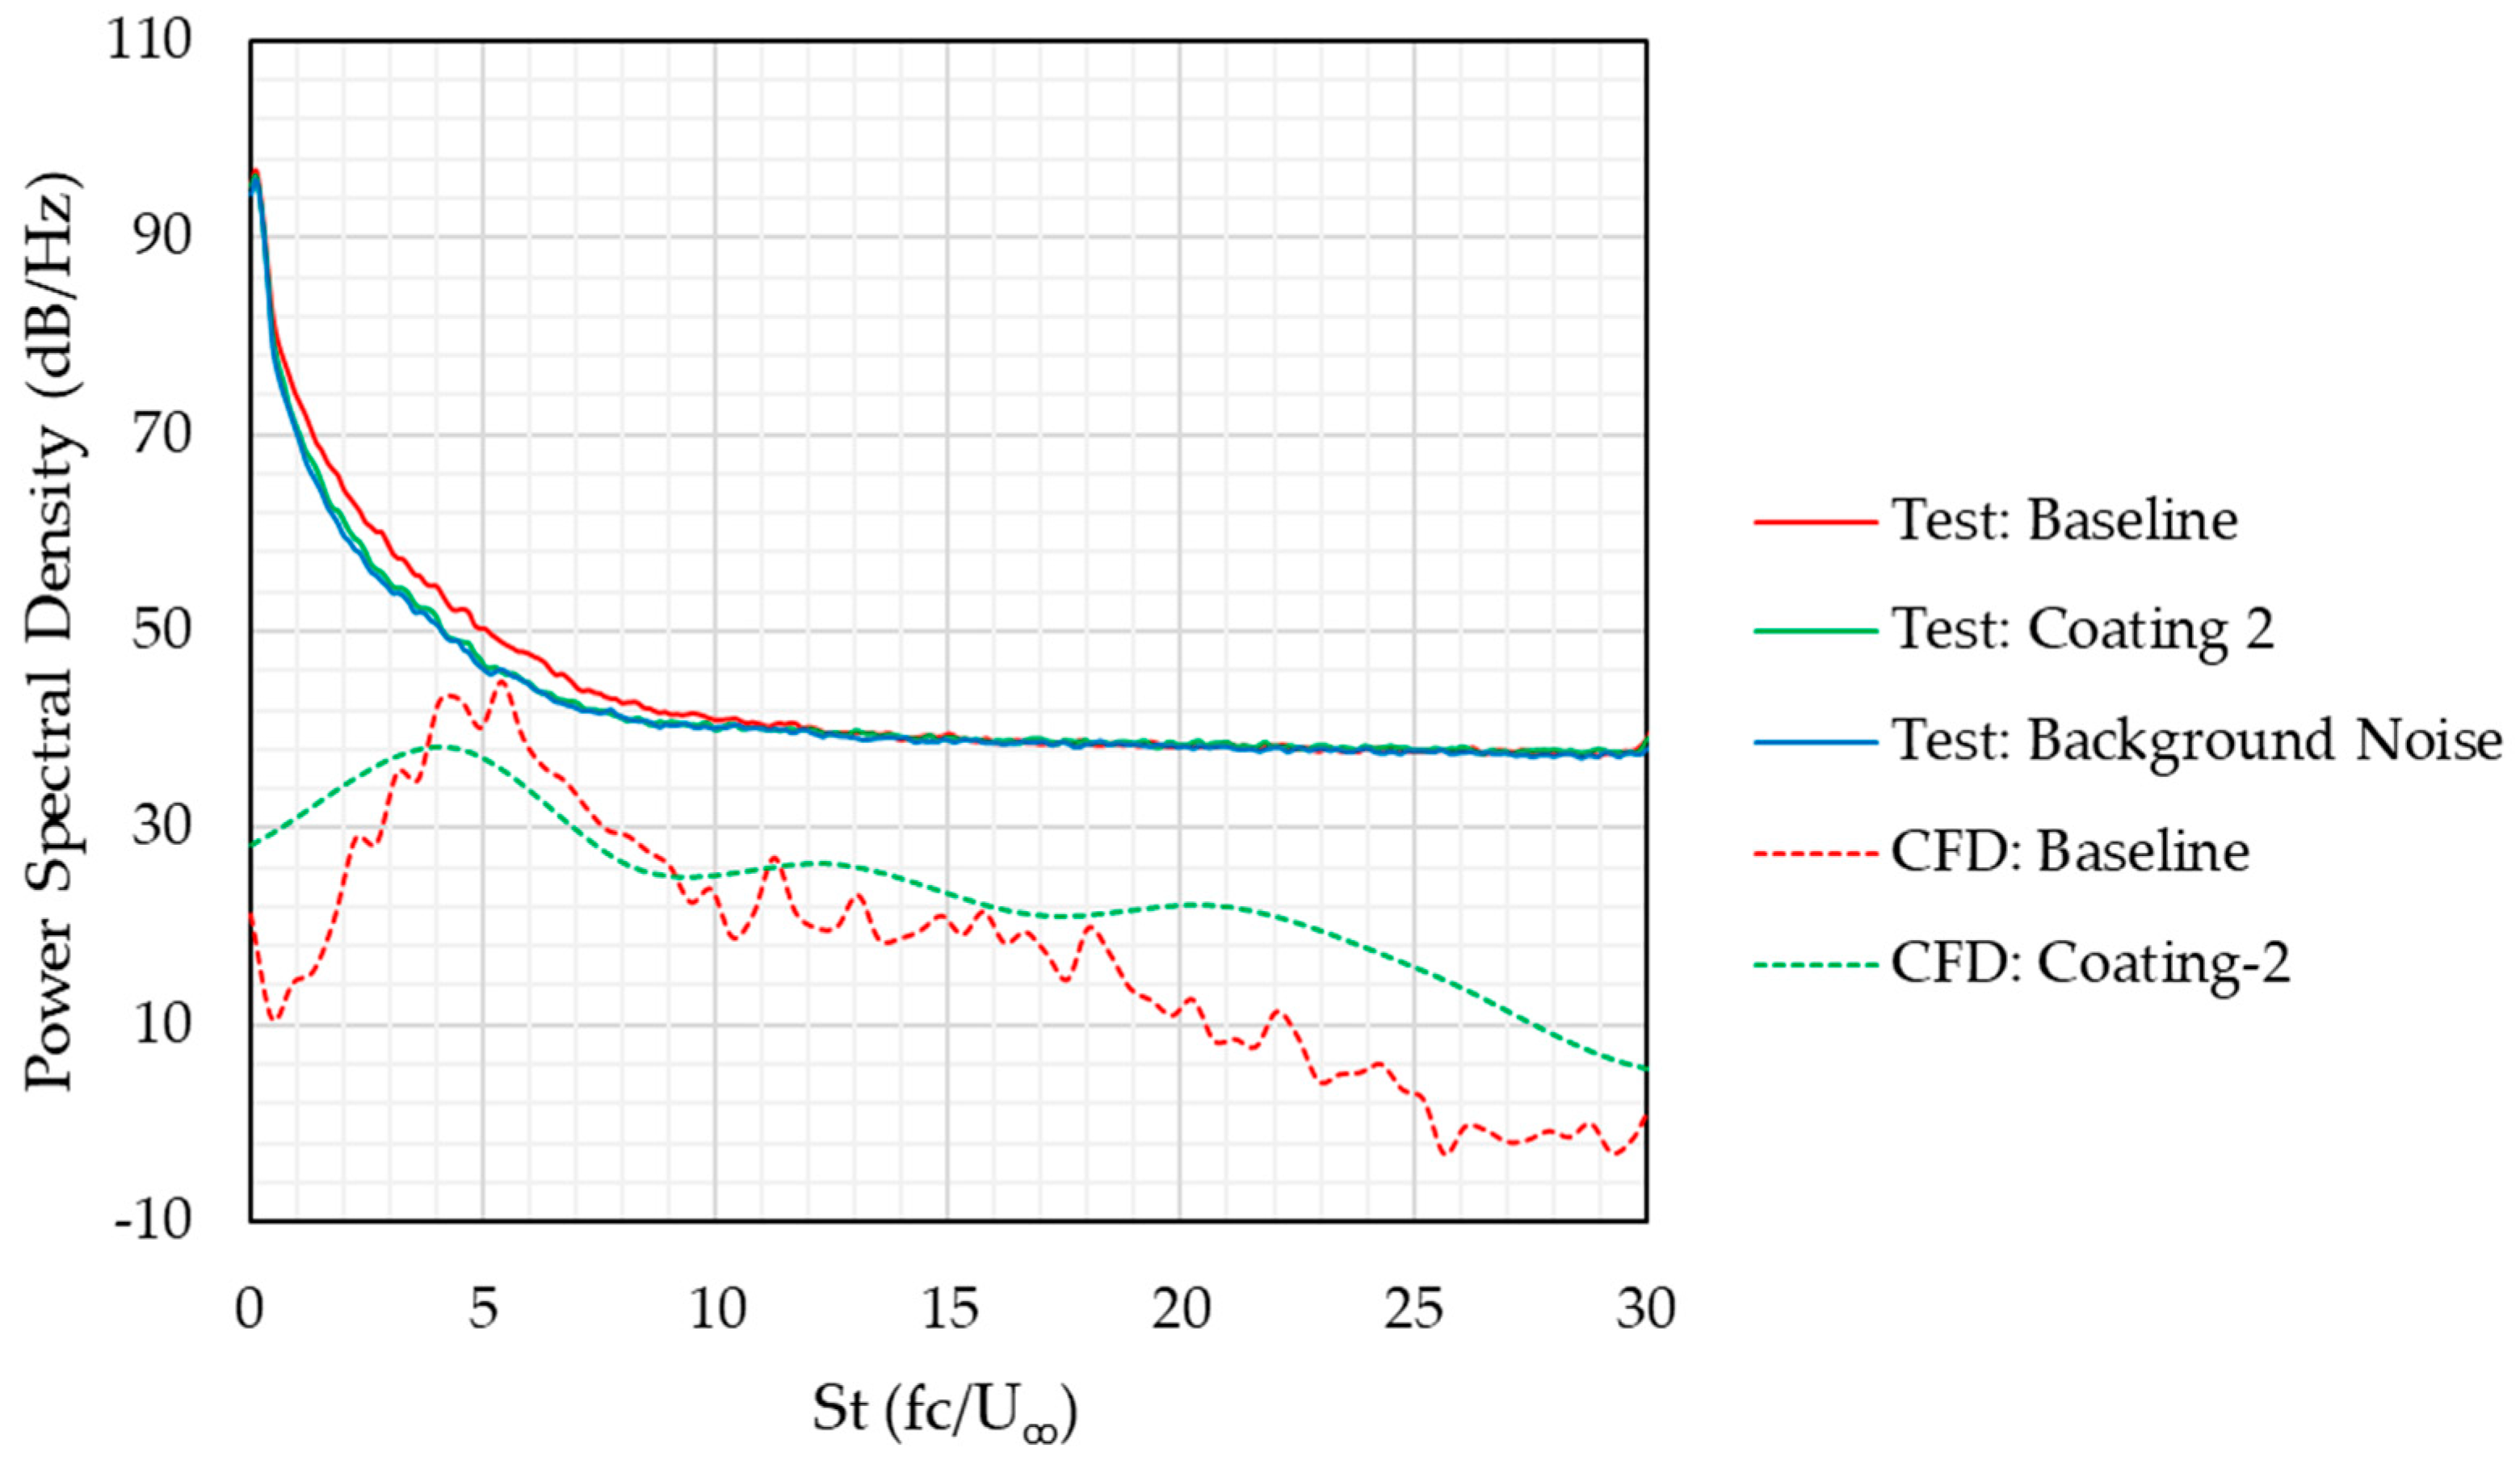
As shown in Figure 22, simulations and experiments exhibit similar trends over 600–1367 Hz (St = 3.50–8.20). Experiments show a 2–4 dB/Hz reduction over 253–1367 Hz (St = 1.51–8.20) using coating-2, while simulations predict a comparable reduction over 600–1575 Hz (St = 3.50–9.00). Experiments further indicate negligible influence of coating-2 above 2500 Hz (St = 15.00).
Figure 22.
Coating effects on TE noise.
Table 3 compares the OASPL from simulations and experiments. Measurements show that coating-2 reduces OASPL by 3.23 dB and decreases the RMS of fluctuating pressure by a factor of 0.689 relative to the baseline. Similarly, simulations predict an OASPL reduction of 1.85 dB with an RMS of fluctuating pressure decrease by a factor of 0.808, indicating that coating-2 may have noise mitigation potential. However, background noise measurements in the wind tunnel at 15 m/s are comparable to the noise from the coated flat plate, suggesting that additional tests are required in an anechoic test facility with lower background noise to confirm these results.
Table 3.
Comparison of overall sound pressure levels.
4. Limitations of the Study
4.1. Limitations of the Numerical and Structural Modeling
To reduce computational cost, the simulations employed the IDDES turbulence model, a hybrid RANS–LES approach. Although computationally efficient, this model may limit the accuracy of flow predictions and associated noise sources. Higher-fidelity methods such as DNS could improve accuracy but were not feasible for the present study.
The simulations were computationally expensive due to small time steps in the order of 10−7 s and fine meshes (9.55–19.21 million cells). Each CAA case required 4–5 weeks on 200 cores, and the FSI cases incurred additional cost due to mesh morphing at sub-iterations of each time step. As a result, the study was constrained to a single flow condition.
Structural modeling was performed using an isotropic linear elastic constitutive model. Frequency-dependent viscoelastic damping effects were not incorporated into the simulations.
4.2. Limitations of Coating Material Modeling
The coating material was modeled using stiffness, thickness, density and Poisson’s ratio. Loss tangent effects were not incorporated into the simulations. Furthermore, the influence of individual material properties on noise characteristics has not been isolated through a parametric analysis. Therefore, the conclusions apply to the specific configurations investigated in the present study and should not be generalized to broader classes of compliant or viscoelastic materials.
4.3. Limitations of the Experimental Methodology
The simulations were performed at a freestream velocity of 35 m/s (Rec ≈ 460,000), while experiments were conducted at a significantly lower speed (Rec ≈ 197,000). At higher wind speeds (≥20 m/s), background noise masked the noise from the coated flat plate. Although direct comparison is not possible, the results provide qualitative insight into the noise mitigation potential of compliant coatings under the tested conditions.
5. Conclusions
In the pursuit of quieter wind turbine designs, the present study investigated passive compliant coatings as potential surface treatments to address flow-induced noise. A flat plate under fully turbulent conditions was used to investigate this technique through CFD and wind tunnel testing. The computational methodology was validated by comparing farfield noise predictions with measurements from Moreau et al. [40].
Two compliant coatings with distinct material properties were then examined through CAA and FSI. Results showed that coating-1 (Dow Corning Silastic S-2) increased OASPL by 2.89 dB, whereas coating-2 (Dow Corning Sylgard 184) reduced TE noise by 2–4 dB/Hz between 600 and 1575 Hz (St = 3.50–9.00) and lowered the OASPL by 1.85 dB. Within the two configurations investigated, the differences in noise mitigation characteristics may be attributed to variations in coating stiffness and geometric compliance. Based on these simulations coating-2 (Dow Corning Sylgard 184) was selected for wind tunnel testing, which further demonstrated a 3.23 dB OASPL reduction and a 2–4 dB/Hz noise decrease from 253 to 1367 (St = 1.51–8.20). Although absolute noise levels differed between simulations and experiments, both exhibited comparable trends between 600 and 1367 Hz (St = 3.50–8.20). These conclusions are limited to the specific coating configurations investigated in the present study.
Future work may examine how coating material properties and resonant frequency influence TE noise. Prior studies have shown that compliant coatings may delay boundary layer transition [34] by suppressing the Tollmien–Schlichting instabilities [38]. This could be further extended to understand the impact of delaying boundary layer transition on farfield noise. Investigating this mechanism requires a high-fidelity transition model such as the eN method [54,55]. Flow visualization techniques may also be employed to identify delays in laminar to turbulence transition point with the use of compliant coatings and to correlate these delays with changes in farfield noise.
Extending the present study from a flat plate to a wind turbine airfoil is the next step. Datasets from NREL, which include pressure distributions, lift and drag coefficients at various angles of attack [56], and corresponding farfield noise spectra [57], offer a valuable baseline for future studies.
Author Contributions
Conceptualization, R.T. and S.F.; methodology, R.T., S.F. and R.G.; software, R.G.; validation, R.G.; formal analysis, R.G.; investigation, R.G.; resources, R.T. and S.F.; data curation, R.G.; writing—original draft preparation, R.G.; writing—review and editing, R.T. and S.F.; visualization, R.G.; supervision, R.T. and S.F.; project administration, R.G. All authors have read and agreed to the published version of the manuscript.
Funding
This research received no external funding.
Institutional Review Board Statement
Not applicable.
Informed Consent Statement
Not applicable.
Data Availability Statement
Data supporting the findings of this study are available within the article.
Conflicts of Interest
The authors declare no conflicts of interest.
Abbreviations
The following abbreviations are used in this manuscript:
| AFC | Active Flow Control |
| AWB | Aeroacoustic Wind Tunnel, Braunschweig |
| BEM | Boundary Element Method |
| CAA | Computational Aeroacoustics Analysis |
| CAD | Computer Aided Design |
| CFD | Computational Fluid Dynamics |
| CFL | Courant–Friedrichs–Lewy Condition |
| DLR | Deutsches Zentrum für Luft- und Raumfahrt |
| DNS | Direct Numerical Simulation |
| FW-H | Ffowcs Williams and Hawkings acoustic analogy |
| FISI | Flow-Induced Surface Instabilities |
| FSI | Fluid–Structure Interaction |
| IDDES | Improved Delayed Detached Eddy Simulation |
| LES | Large Eddy Simulation |
| LMFA | Laboratoire de Mécanique des Fluides et d’Acoustique |
| MUSCL | Monotonic Upwind Scheme for Conservation Laws |
| NREL | National Renewable Energy Laboratory |
| OASPL | Overall Sound Pressure Level, dB |
| PDMS | Polydimethylsiloxane |
| PSD | Power Spectral Density, Pa2/Hz |
| PFC | Passive Flow Control |
| RANS | Reynolds Averaged Navier Stokes |
| SIMPLE | Semi-Implicit Method for Pressure-Linkage Equations |
| SPL | Sound Pressure Level, dB |
| SST | Shear Stress Transport |
| TE | Trailing Edge |
| TSI | Tollmien–Schlichting Instabilities |
| UAV | Unmanned Aerial Vehicles |
| URANS | Unsteady Reynolds-Averaged Navier–Stokes |
| UWPW | Uncorrelated Wall Plane Wave |
References
- Fleming, P.D.; Probert, S.D. The evolution of wind turbines: An historical review. Appl. Energy 1984, 18, 163–177. [Google Scholar] [CrossRef] [Scilit]
- Gipe, P.; Möllerström, E. An overview of the history of wind turbine development: Part I—The early wind turbines until the 1960s. Wind Eng. 2022, 46, 1973–2004. [Google Scholar] [CrossRef] [Scilit]
- Möllerström, E.; Gipe, P.; Ottermo, F. Wind power development: A historical review. Wind Eng. 2024, 49, 499–512. [Google Scholar] [CrossRef] [Scilit]
- Johansen, K. Blowing in the wind: A brief history of wind energy and wind power technologies in Denmark. Energy Policy 2021, 152, 112139. [Google Scholar] [CrossRef] [Scilit]
- Friedrich, K.; Lukas, M. History of wind energy and an outlook for the future. In Energy and Sustainability V; Springer: Cham, Switzerland, 2017; pp. 401–418. [Google Scholar] [CrossRef] [Scilit]
- Mohan Kumar, P.; Sivalingam, K.; Lim, T.C.; Ramakrishna, S.; Wei, H. Review on the evolution of darrieus vertical axis wind turbines: Large wind turbines. Clean Technol. 2019, 1, 205–223. [Google Scholar] [CrossRef] [Scilit]
- Kaldellis, J.K.; Zafirakis, D. The wind energy (r)evolution: A short review of a long history. Renew. Energy 2011, 36, 1887–1901. [Google Scholar] [CrossRef] [Scilit]
- Hansen, C.; Hansen, K. Recent advances in wind turbine noise research. Acoustics 2020, 2, 171–206. [Google Scholar] [CrossRef] [Scilit]
- Cooper, S.; Chan, C. Determination of acoustic compliance of wind farms. Acoustics 2020, 2, 416–450. [Google Scholar] [CrossRef] [Scilit]
- Gipe, P.; Möllerström, E. An overview of the history of wind turbine development: Part II—The 1970s onwards. Wind Eng. 2022, 47, 220–248. [Google Scholar] [CrossRef] [Scilit]
- Nix, R.G. Wind Energy as a Significant Source of Electricity; National Renewable Energy Laboratory: Golden, CO, USA, 1995. Available online: http://www.nrel.gov/docs/legosti/old/8162.pdf (accessed on 14 October 2025).
- Enevoldsen, P.; Xydis, G. Examining the trends of 35 years growth of key wind turbine components. Energy Sustain. Dev. 2019, 50, 18–26. [Google Scholar] [CrossRef] [Scilit]
- Global Wind Energy Council. GWEC’s Global Wind Report 2025—The Definitive Guide to the Wind Industry. Available online: https://www.gwec.net/reports/globalwindreport/2025 (accessed on 14 October 2025).
- Barthelmie, R.J.; Pryor, S.C. Climate change mitigation potential of wind energy. Climate 2021, 9, 136. [Google Scholar] [CrossRef] [Scilit]
- Josimović, B.; Bezbradica, L.; Manić, B.; Srnić, D.; Srebrić, N. Cumulative impact of wind farm noise. Appl. Sci. 2023, 13, 8792. [Google Scholar] [CrossRef] [Scilit]
- Freiberg, A.; Schefter, C.; Girbig, M.; Murta, V.C.; Seidler, A. Health effects of wind turbines on humans in residential settings: Results of a scoping review. Environ. Res. 2019, 169, 446–463. [Google Scholar] [CrossRef] [Scilit] [PubMed]
- Van Kamp, I.; Van den Berg, F. Health effects related to wind turbine sound: An update. Int. J. Environ. Res. Public Health 2021, 18, 9133. [Google Scholar] [CrossRef] [Scilit] [PubMed]
- Botelho, A.; Arezes, P.; Bernardo, C.; Dias, H.; Costa Pinto, L.M. Effect of wind farm noise on local residents’ decision to adopt mitigation measures. Int. J. Environ. Res. Public Health 2017, 14, 753. [Google Scholar] [CrossRef] [Scilit] [PubMed]
- Wagner, S.; Bareiss, R.; Guidati, G. Wind Turbine Noise; Springer: Berlin, Germany, 1996; Available online: https://link.springer.com/book/10.1007/978-3-642-88710-9 (accessed on 7 March 2026).
- Giridhar, R.; Farokhi, S.; Taghavi, R. Trailing-edge noise with passive compliant coating: A computational study. In Proceedings of the AIAA SciTech 2022 Forum, San Diego, CA, USA, 3–7 January 2022. [Google Scholar] [CrossRef] [Scilit]
- Oerlemans, S.; Fisher, M.; Maeder, T.; Kögler, K. Reduction of wind turbine noise using optimized airfoils and trailing-edge serrations. AIAA J. 2009, 47, 1470–1481. [Google Scholar] [CrossRef] [Scilit]
- Oerlemans, S. Reduction of wind turbine noise using blade trailing edge devices. In Proceedings of the 22nd AIAA/CEAS Aeroacoustics Conference, Lyon, France, 30 May–1 June 2016. [Google Scholar] [CrossRef] [Scilit]
- Avallone, F.; Van Der Velden, W.C.P.; Ragni, D.; Casalino, D. Noise reduction mechanisms of sawtooth and combed sawtooth trailing edge serrations. J. Fluid Mech. 2018, 848, 560–571. [Google Scholar] [CrossRef] [Scilit]
- Avallone, F.; Van Der Velden, W.C.P.; Ragni, D. Benefits of curved serrations on broadband trailing-edge noise reduction. J. Sound Vib. 2017, 400, 167–177. [Google Scholar] [CrossRef] [Scilit]
- Finez, A.; Jacob, M.; Jondeau, E.; Roger, M. Broadband noise reduction with trailing edge brushes. In Proceedings of the 16th AIAA/CEAS Aeroacoustics Conference, Stockholm, Sweden, 7–9 June 2010. [Google Scholar] [CrossRef] [Scilit]
- Herr, M.; Dobrzynski, W. Experimental investigations in low-noise trailing edge design. AIAA J. 2005, 43, 1167–1175. [Google Scholar] [CrossRef] [Scilit]
- Geyer, T.; Sarradj, E.; Fritzsche, C. Measurement of the noise generation at the trailing edge of porous airfoils. Exp. Fluids 2009, 48, 291–308. [Google Scholar] [CrossRef] [Scilit]
- Clark, I.A.; Alexander, W.N.; Devenport, W.; Glegg, S.; Jaworski, J.W.; Daly, C.; Peake, N. Bioinspired trailing-edge noise control. AIAA J. 2017, 55, 740–754. [Google Scholar] [CrossRef] [Scilit]
- Wetzel, K.K.; Farokhi, S. Influence of vortex generator on NREL S807 airfoil aerodynamic characteristics and aerodynamic performance. Wind Eng. 1995, 19, 157–165. Available online: https://www.jstor.org/stable/43749575 (accessed on 26 October 2025).
- Wetzel, K.K.; Farokhi, S. Interaction of riblets and vortex generators on an airfoil. In Proceedings of the 14th Applied Aerodynamics Conference, New Orleans, LA, USA, 17–20 June 1996. [Google Scholar] [CrossRef] [Scilit]
- Wolf, A.; Lutz, T.; Würz, W.; Krämer, E.; Stalnov, O.; Seifert, A. Trailing edge noise reduction of wind turbine blades by active flow control. Wind Energy 2014, 18, 909–923. [Google Scholar] [CrossRef] [Scilit]
- Arnold, B.; Lutz, T.; Krämer, E.; Rautmann, C. Wind turbine trailing-edge noise reduction by means of boundary-layer suction. AIAA J. 2018, 5, 1843–1854. [Google Scholar] [CrossRef] [Scilit]
- Fitzgerald, W.; Fitzgerald, E.R.; Carey, W.M.; Winkle, W.A. Blubber and compliant coatings for drag reduction in water II. Matched shear impedance for compliant layer drag reduction. Mater. Sci. Eng. 1995, 4, 215–220. [Google Scholar] [CrossRef] [Scilit]
- Carpenter, P.W.; Gerrad, A.D. The hydrodynamic stability of flow over Kramer-type compliant surfaces. Part 1. Tollmien-Schlichting instabilities. J. Fluid Mech. 1985, 155, 465–510. [Google Scholar] [CrossRef] [Scilit]
- Choi, K.S.; Yang, X.; Clayton, B.; Glover, E.; Atlar, M.; Semenov, B.; Kulik, V. Turbulent drag reduction using compliant coatings. Proc. Math. Phys. Eng. Sci. 1997, 453, 2229–2240. [Google Scholar] [CrossRef] [Scilit]
- Lee, T.; Fisher, M.; Schwarz, W.H. Investigation of the stable interaction of a passive compliant surface with a turbulent boundary layer. J. Fluid Mech. 1993, 257, 373–401. [Google Scholar] [CrossRef] [Scilit]
- Boiko, A.V.; Kulik, V.M.; Chun, H.; Lee, I. Verification of drag-reduction capabilities of stiff compliant coatings in air flow at moderate speeds. Int. J. Nav. Archit. Ocean. Eng. 2011, 4, 242–253. [Google Scholar] [CrossRef] [Scilit]
- Lee, T.; Fisher, M.; Schwarz, W.H. Investigation of the effects of a compliant surface on boundary-layer stability. J. Fluid Mech. 1995, 288, 37–58. [Google Scholar] [CrossRef] [Scilit]
- Giridhar, R.; Taghavi, R.; Farokhi, S. A study of passive compliant coatings on trailing edge noise through simulations and experiments. Int. J. Aeroacoust. 2025, 24, 381–405. [Google Scholar] [CrossRef] [Scilit]
- Moreau, D.J.; Brooks, L.A.; Doolan, C.J. Broadband trailing edge noise from a sharp-edged strut. J. Acoust. Soc. Am. 2011, 129, 2820–2829. [Google Scholar] [CrossRef] [Scilit]
- Giridhar, R.; Farokhi, S.; Taghavi, R. Aerodynamic noise generated by the NREL phase VI wind turbine rotor. In Proceedings of the AIAA SciTech 2019 Forum, San Diego, CA, USA, 7–11 January 2019. [Google Scholar] [CrossRef] [Scilit]
- Ghasemian, M.; Nejat, A. Aerodynamic noise prediction of a horizontal axis wind turbine using improved delayed detached eddy simulation and acoustic analogy. Energy Convers. Manag. 2015, 99, 210–220. [Google Scholar] [CrossRef] [Scilit]
- Tadamasa, A.; Zangeneh, M. Numerical prediction of wind turbine noise. Renew. Energy 2011, 36, 1902–1912. [Google Scholar] [CrossRef] [Scilit]
- Siemens Digital Industries Software. STAR-CCM+ User Guide. Available online: https://www.sw.siemens.com/en-US/ (accessed on 11 November 2025).
- Khanafer, K.; Duprey, A.; Schlicht, M.; Berguer, R. Effects of strain rate, mixing ratio, and stress-strain definition on the mechanical behavior of the polydimethylsiloxane (PDMS) material as related to its biological applications. Biomed. Microdevices 2008, 11, 503–508. [Google Scholar] [CrossRef] [Scilit] [PubMed]
- Dogru, S.; Aksoy, B.; Bayraktar, H.; Alaca, B.E. Poisson’s ratio of PDMS thin films. Polym. Test. 2018, 69, 375–384. [Google Scholar] [CrossRef] [Scilit]
- SYLGARDTM 184 Silicone Elastomer Kit. Available online: https://www.dow.com/en-us/pdp.sylgard-184-silicone-elastomer-kit.01064291z.html#overview (accessed on 11 November 2025).
- Giridhar, R. Investigating the Effects of Passive Compliant Coatings on Trailing-Edge Noise. Ph.D. Thesis, The University of Kansas, Lawrence, KS, USA, 2022. Available online: https://www.proquest.com/dissertations-theses/investigating-effects-passive-compliant-coatings/docview/2700000000 (accessed on 7 March 2026).
- Karimi, M.; Croaker, P.; Skvortsov, A.; Moreau, D.J.; Kessissoglou, N. Numerical Prediction of Turbulent Boundary Layer Noise from a Sharp-edged Flat Plate. Int. J. Numer. Methods Fluids 2019, 90, 522–543. [Google Scholar] [CrossRef] [Scilit]
- Tong, F.; Qiao, W.; Chen, W.; Wang, L.; Wang, X. Broadband noise prediction using large eddy simulation and a frequency domain method. Appl. Acoust. 2017, 117, 94–105. [Google Scholar] [CrossRef] [Scilit]
- Lee, F.; Cheong, C. Frequency-domain prediction of broadband trailing edge noise from a blunt flat plate. J. Sound Vib. 2013, 332, 5322–5344. [Google Scholar] [CrossRef] [Scilit]
- Lighthill, M. On sound generated aerodynamically: General theory. Proc. R. Soc. Lond. 1952, 231, 564–587. [Google Scholar] [CrossRef] [Scilit]
- Solis-Gallego, I.; Meana-Fernandez, A.; Oro, J.F.; Diaz, K.A.; Velarde-Suarez, S. LES-based numerical prediction of trailing-edge noise in a small wind turbine airfoil at different angles of attack. Renew. Energy 2018, 120, 241–254. [Google Scholar] [CrossRef] [Scilit]
- Farokhi, S. Future Propulsion Systems and Energy Sources in Sustainable Aviation; John Wiley: Ltd.: Chichester, UK, 2020. [Google Scholar] [CrossRef] [Scilit]
- Cebeci, T. An Engineering Approach to the Calculation of Aerodynamic Flows; Springer: Verlag, Berlin, Germany, 1999; Available online: https://link.springer.com/book/9783540661818 (accessed on 7 March 2026).
- Selig, M.S.; Mcgranaham, B.D. Wind tunnel aerodynamic tests of six airfoils for use on small wind turbines. J. Sol. Energy Eng. 2004, 126, 986–1001. [Google Scholar] [CrossRef] [Scilit]
- Migliore, P.; Oerlemans, S. Wind Tunnel Aeroacoustic Tests of six Airfoils for use on Small Wind Turbines. In Proceedings of the 42nd AIAA Aerospace Sciences Meeting and Exhibit, Reno, NV, USA, 5–8 January 2004. [Google Scholar] [CrossRef] [Scilit]



Disclaimer/Publisher’s Note: The statements, opinions and data contained in all publications are solely those of the individual author(s) and contributor(s) and not of MDPI and/or the editor(s). MDPI and/or the editor(s) disclaim responsibility for any injury to people or property resulting from any ideas, methods, instructions or products referred to in the content. |
© 2026 by the authors. Licensee MDPI, Basel, Switzerland. This article is an open access article distributed under the terms and conditions of the Creative Commons Attribution (CC BY) license.