

Lightning Damage Detection Method Using Autoencoder: A Case Study on Wind Turbines with Different Blade Damage Patterns


Abstract
1. Introduction
2. The Accident Overview and SCADA Data
2.1. SCADA Data
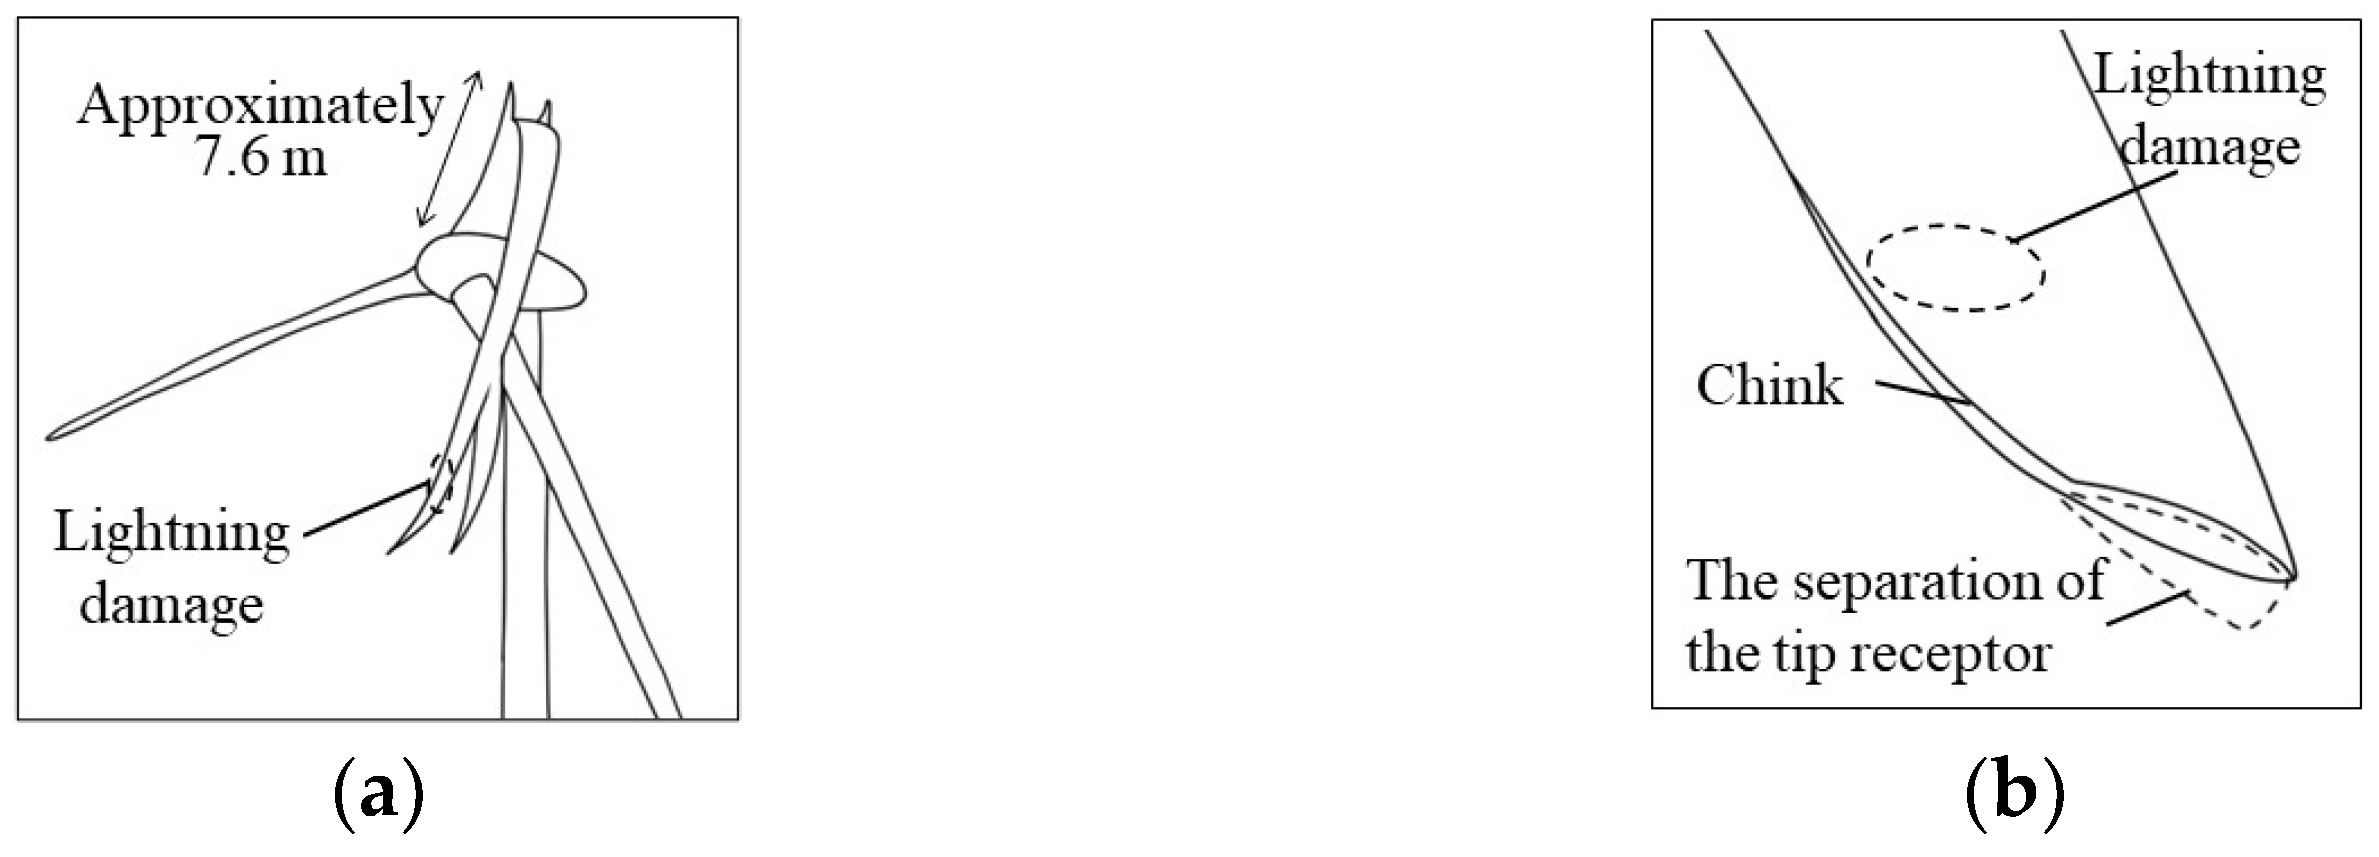
2.2. Lightning Damage to Wind Turbines
3. Anomaly Detection Model
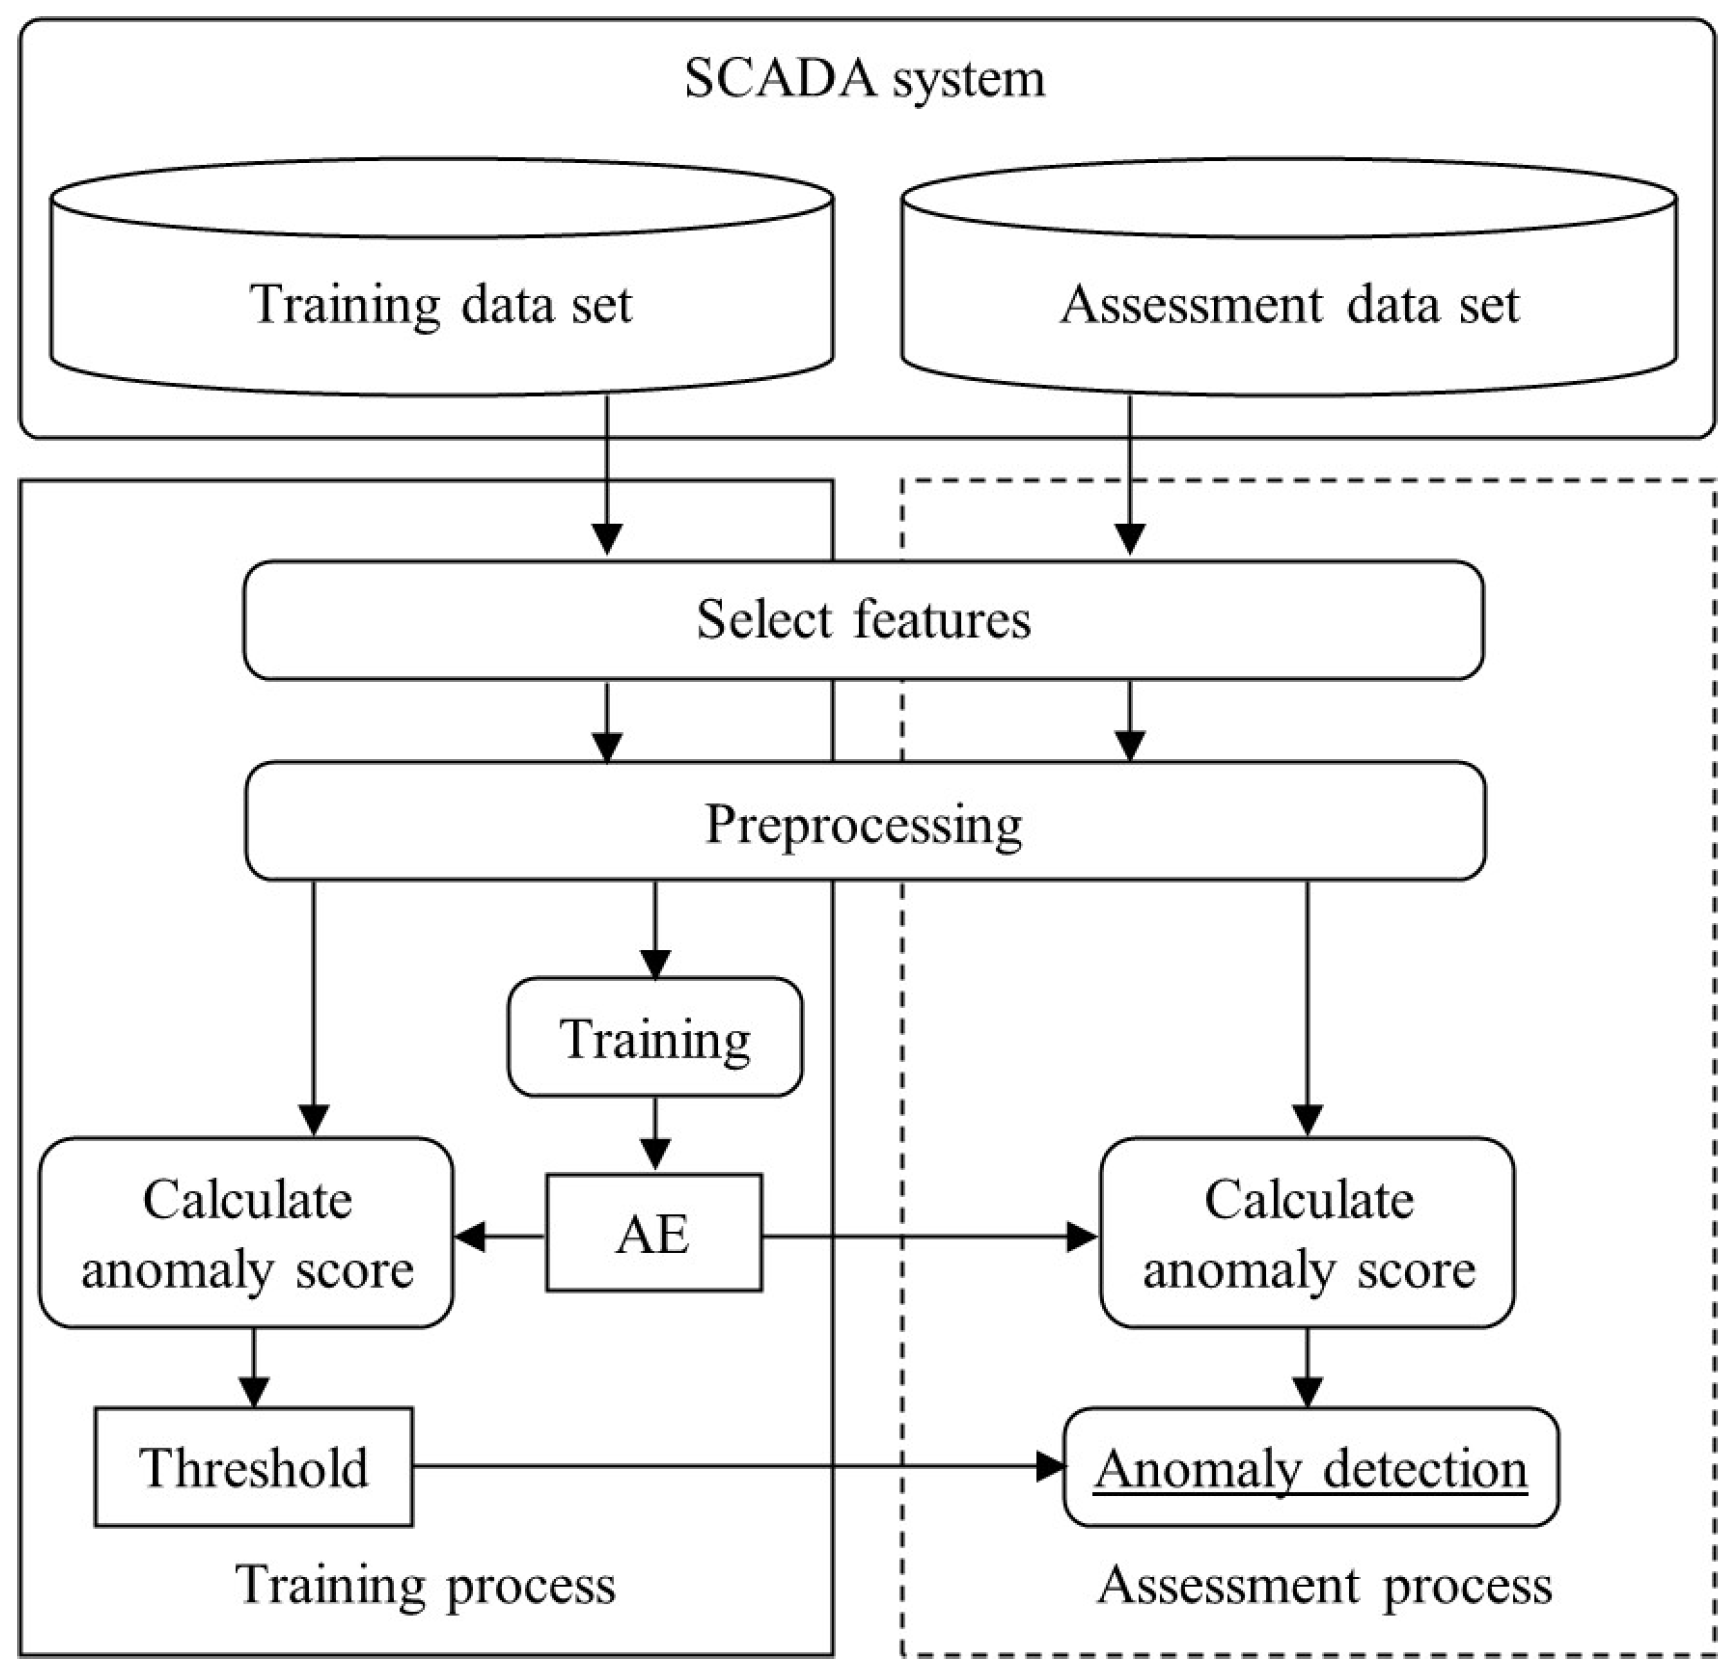
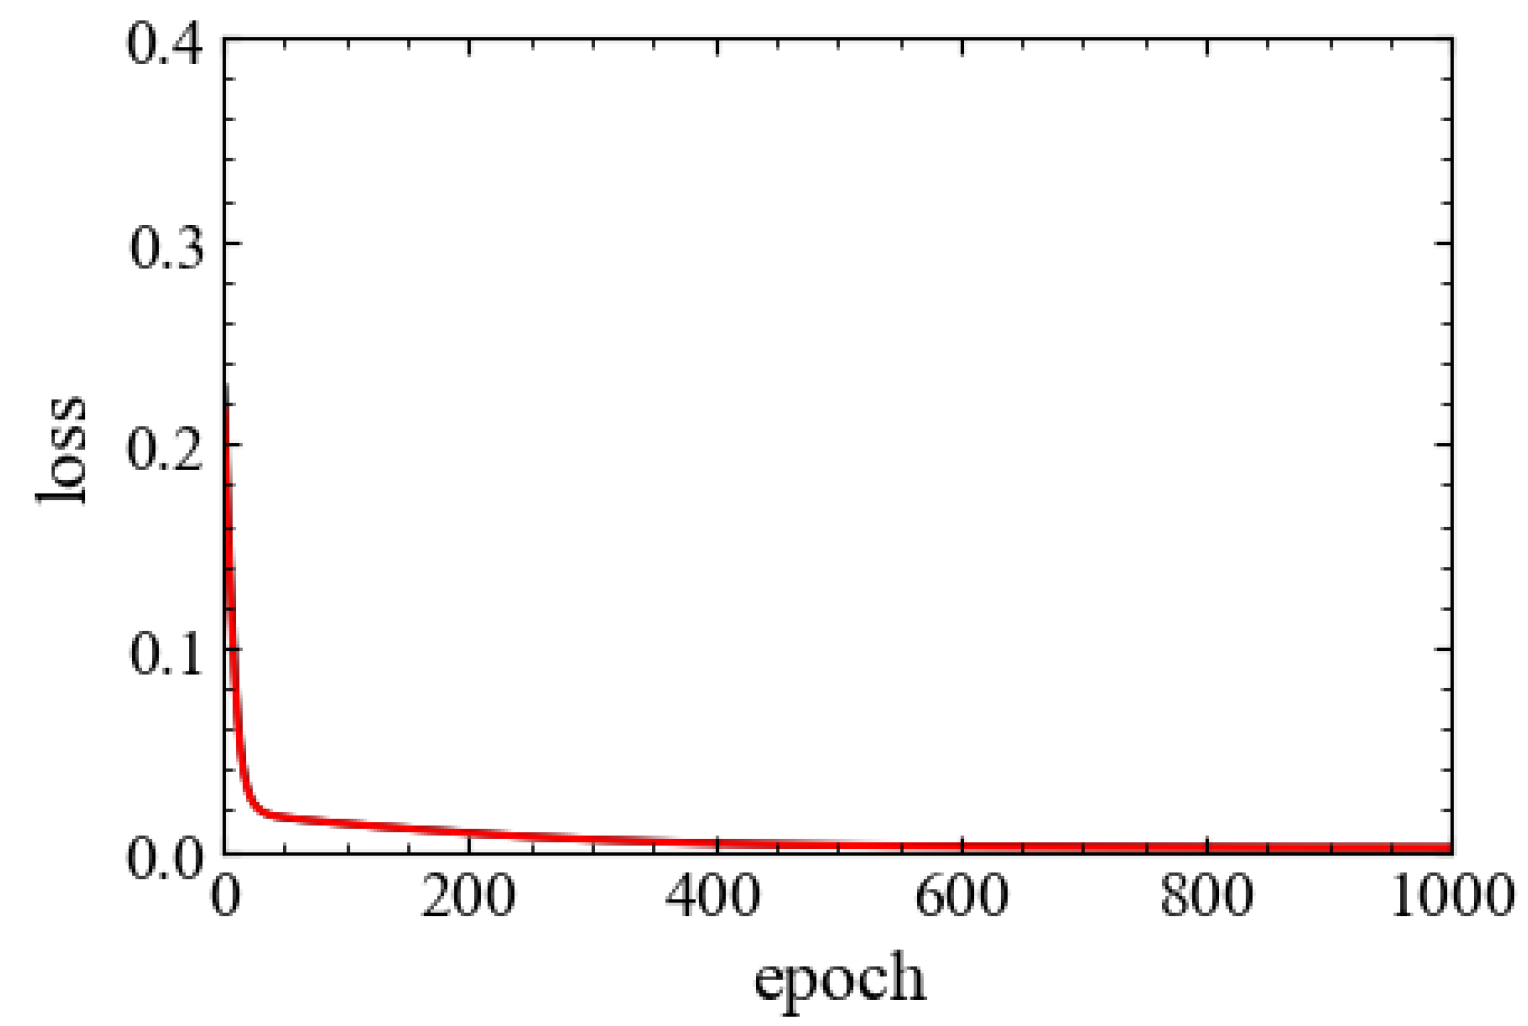
3.1. Training Process and Assessment Process
3.2. Features and Pre-Processing
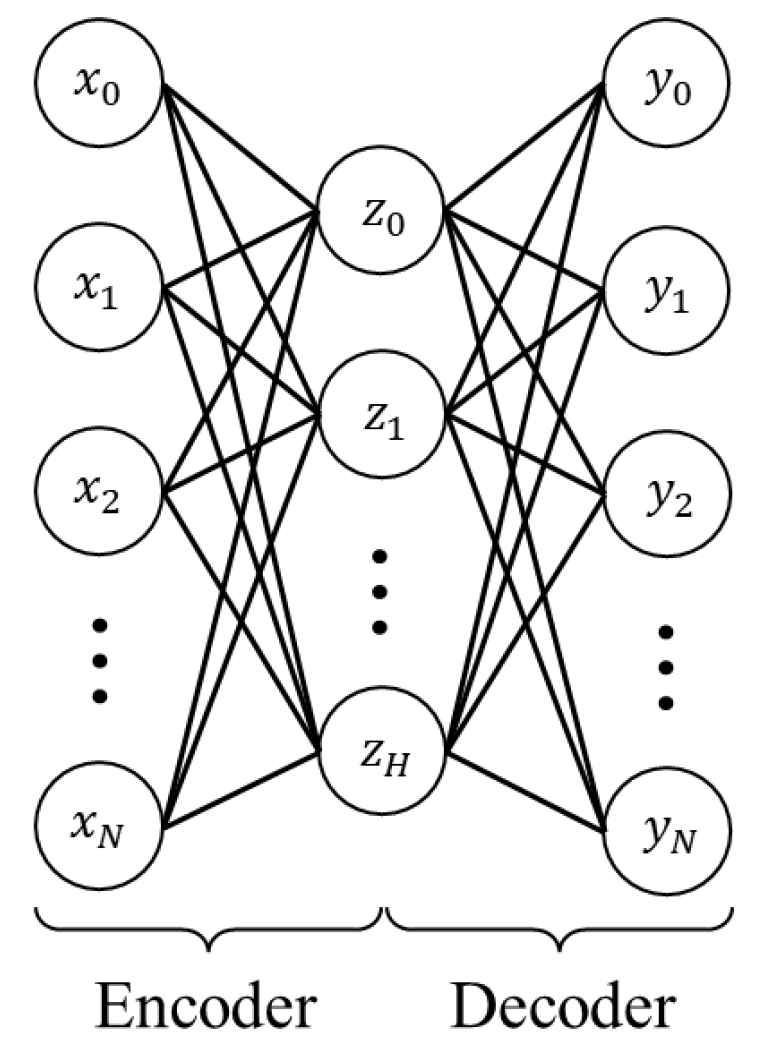
3.3. Autoencoder
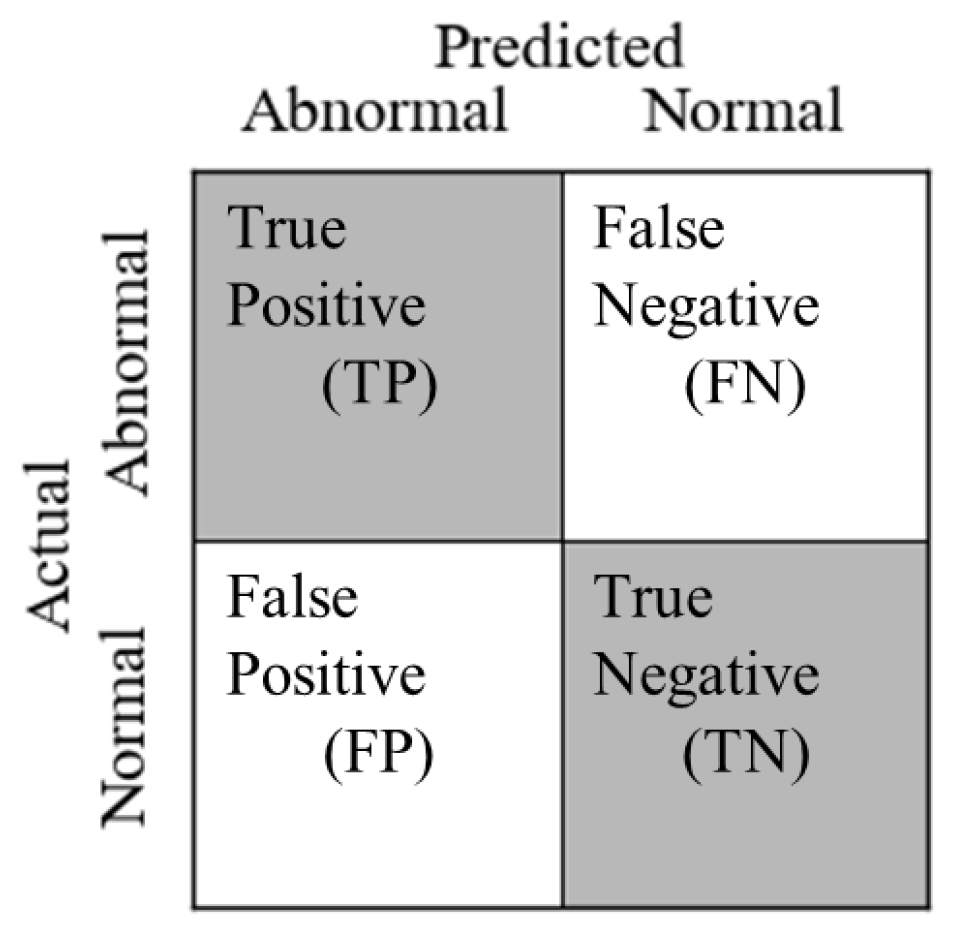
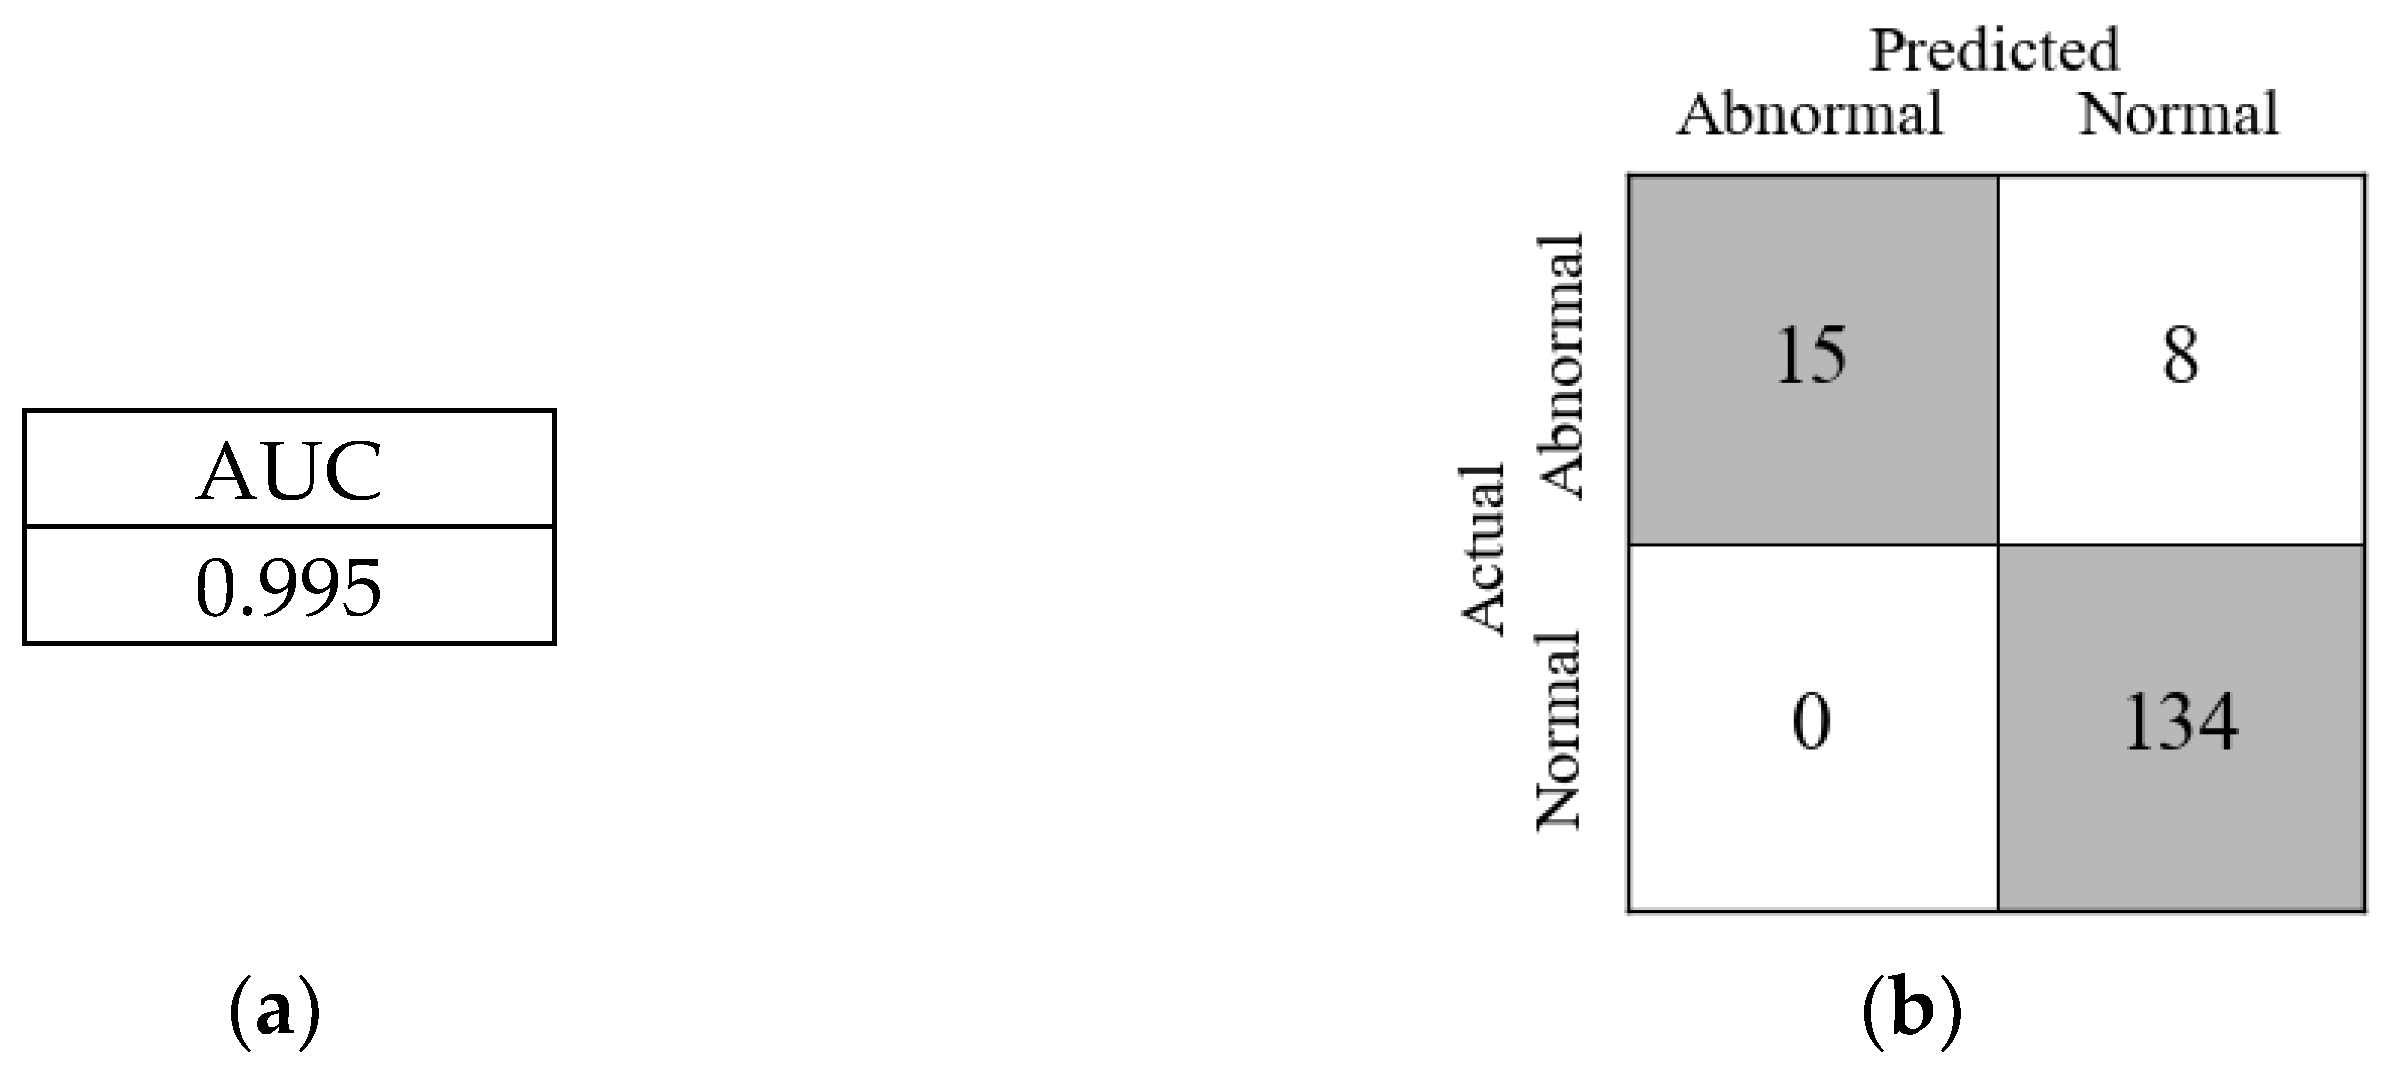
3.4. Assessment Method
4. Assessment Result
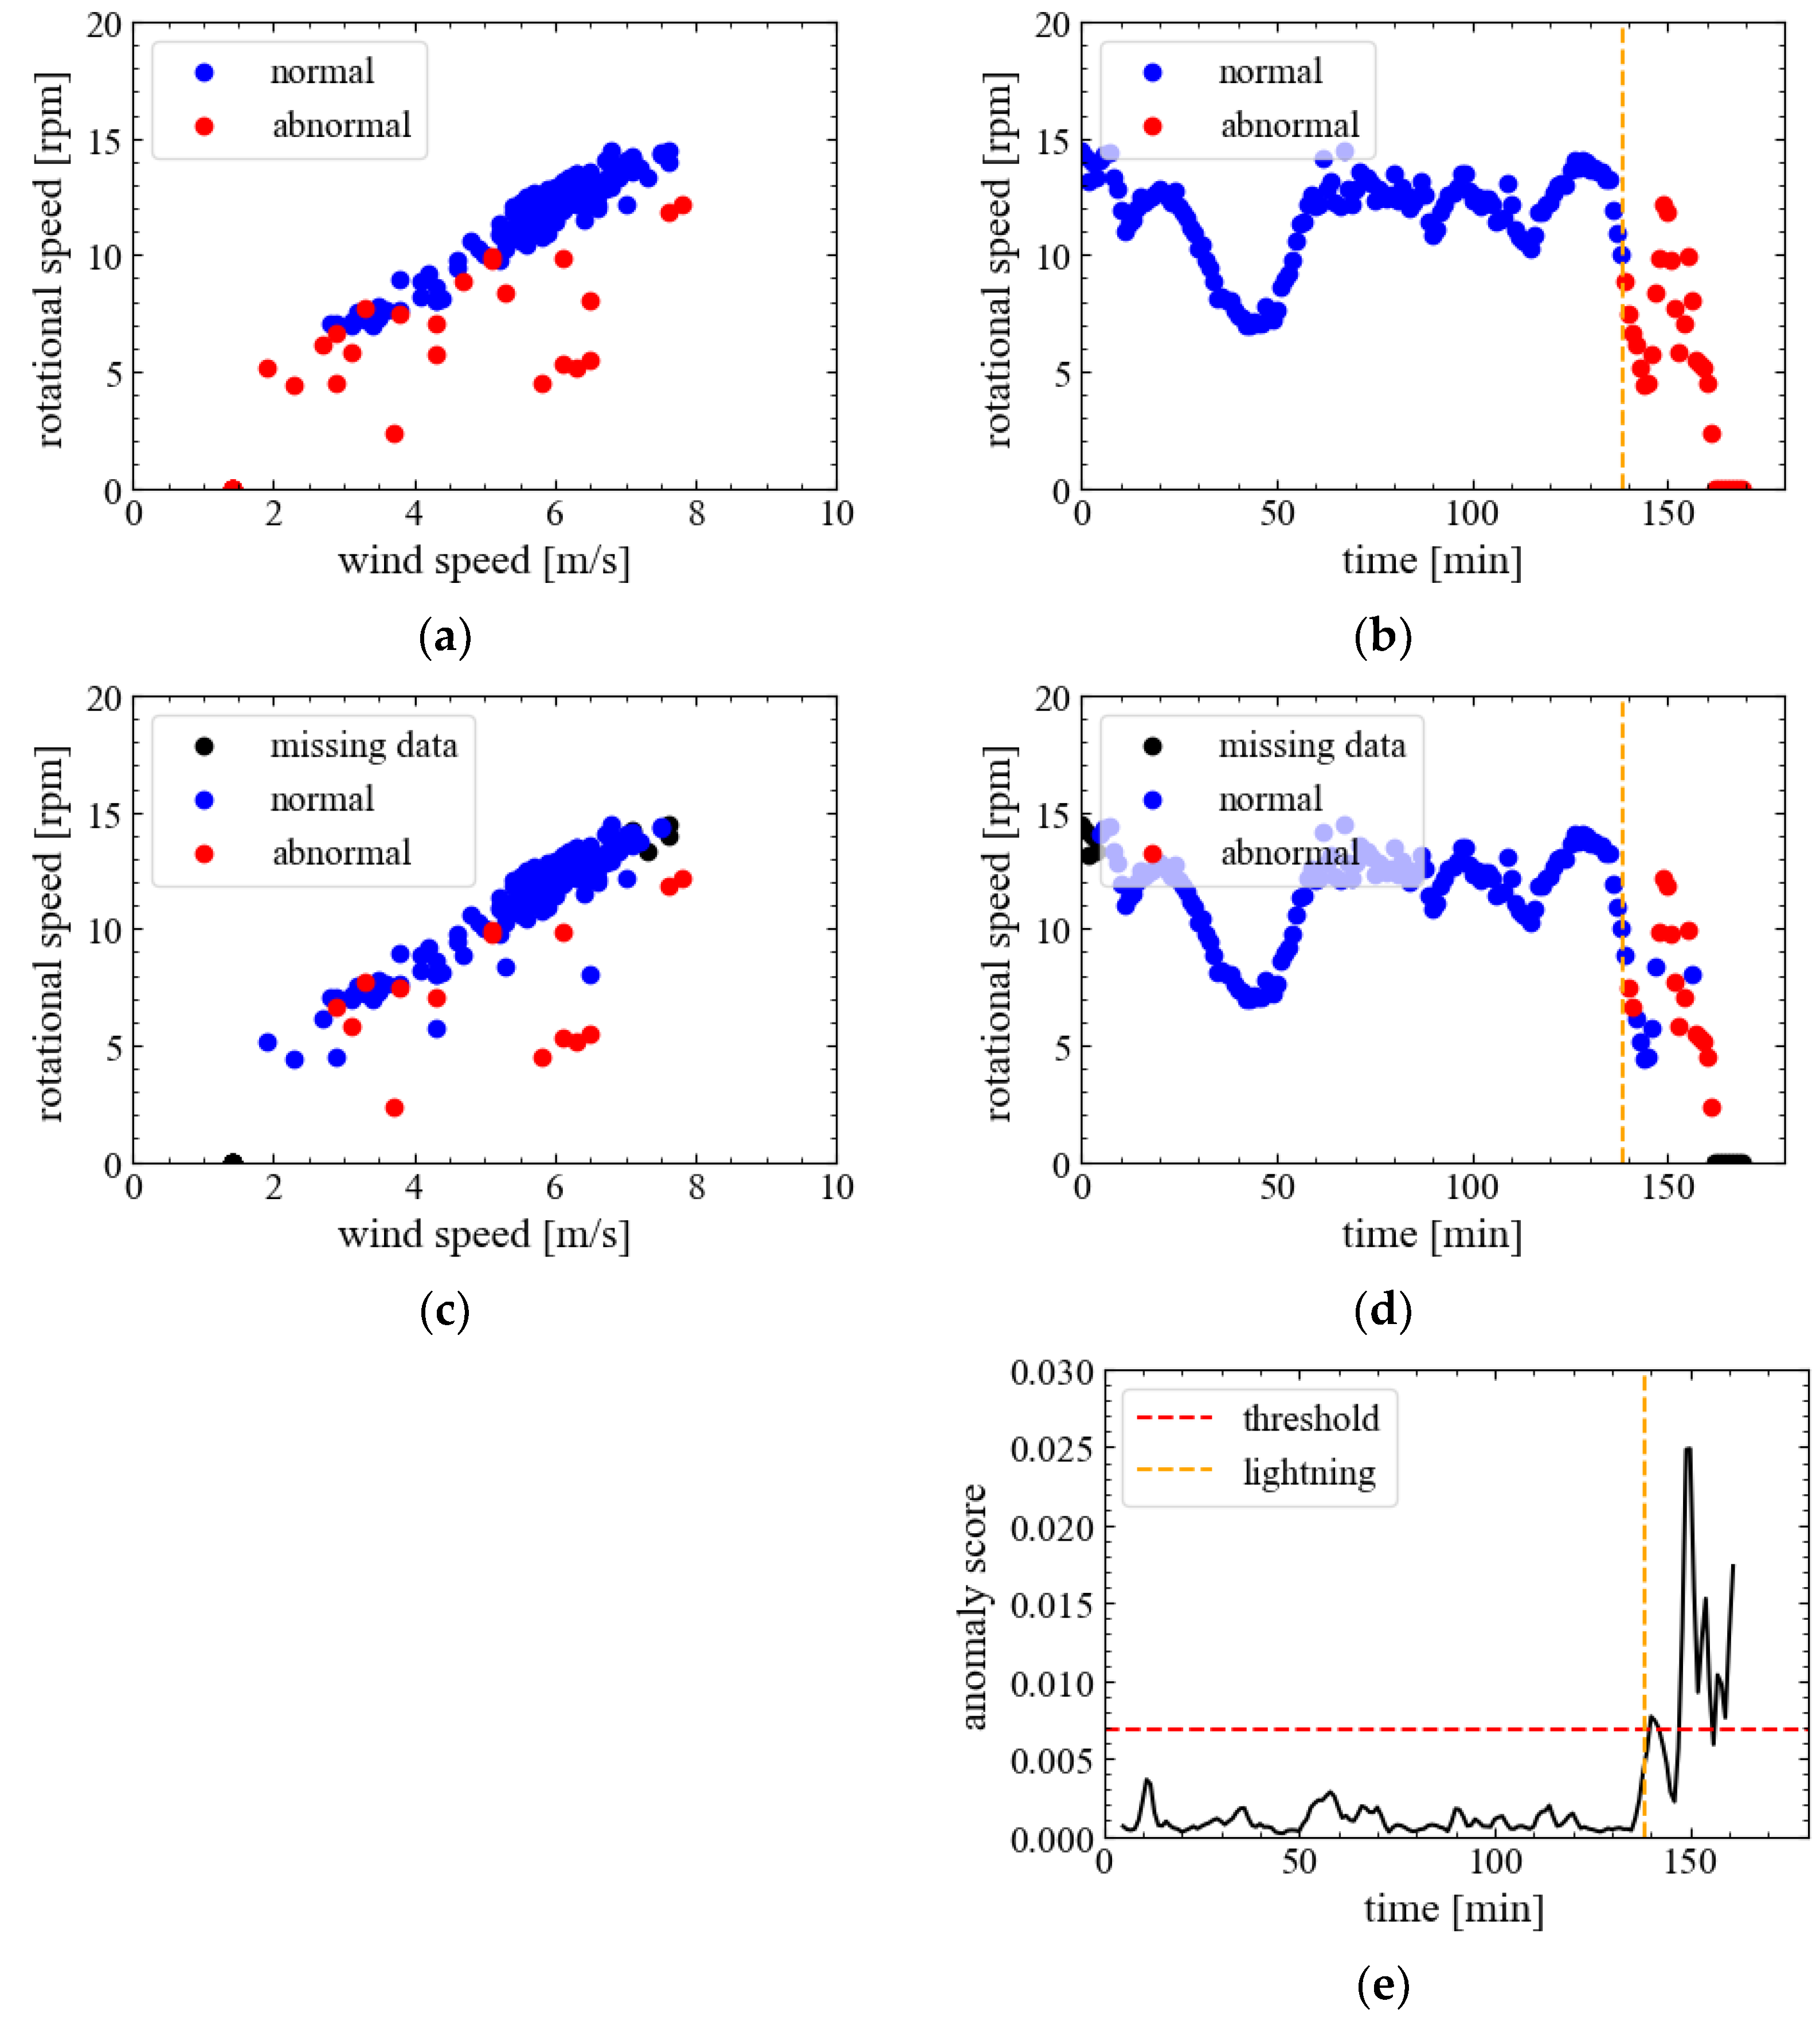
4.1. Wind Turbine A
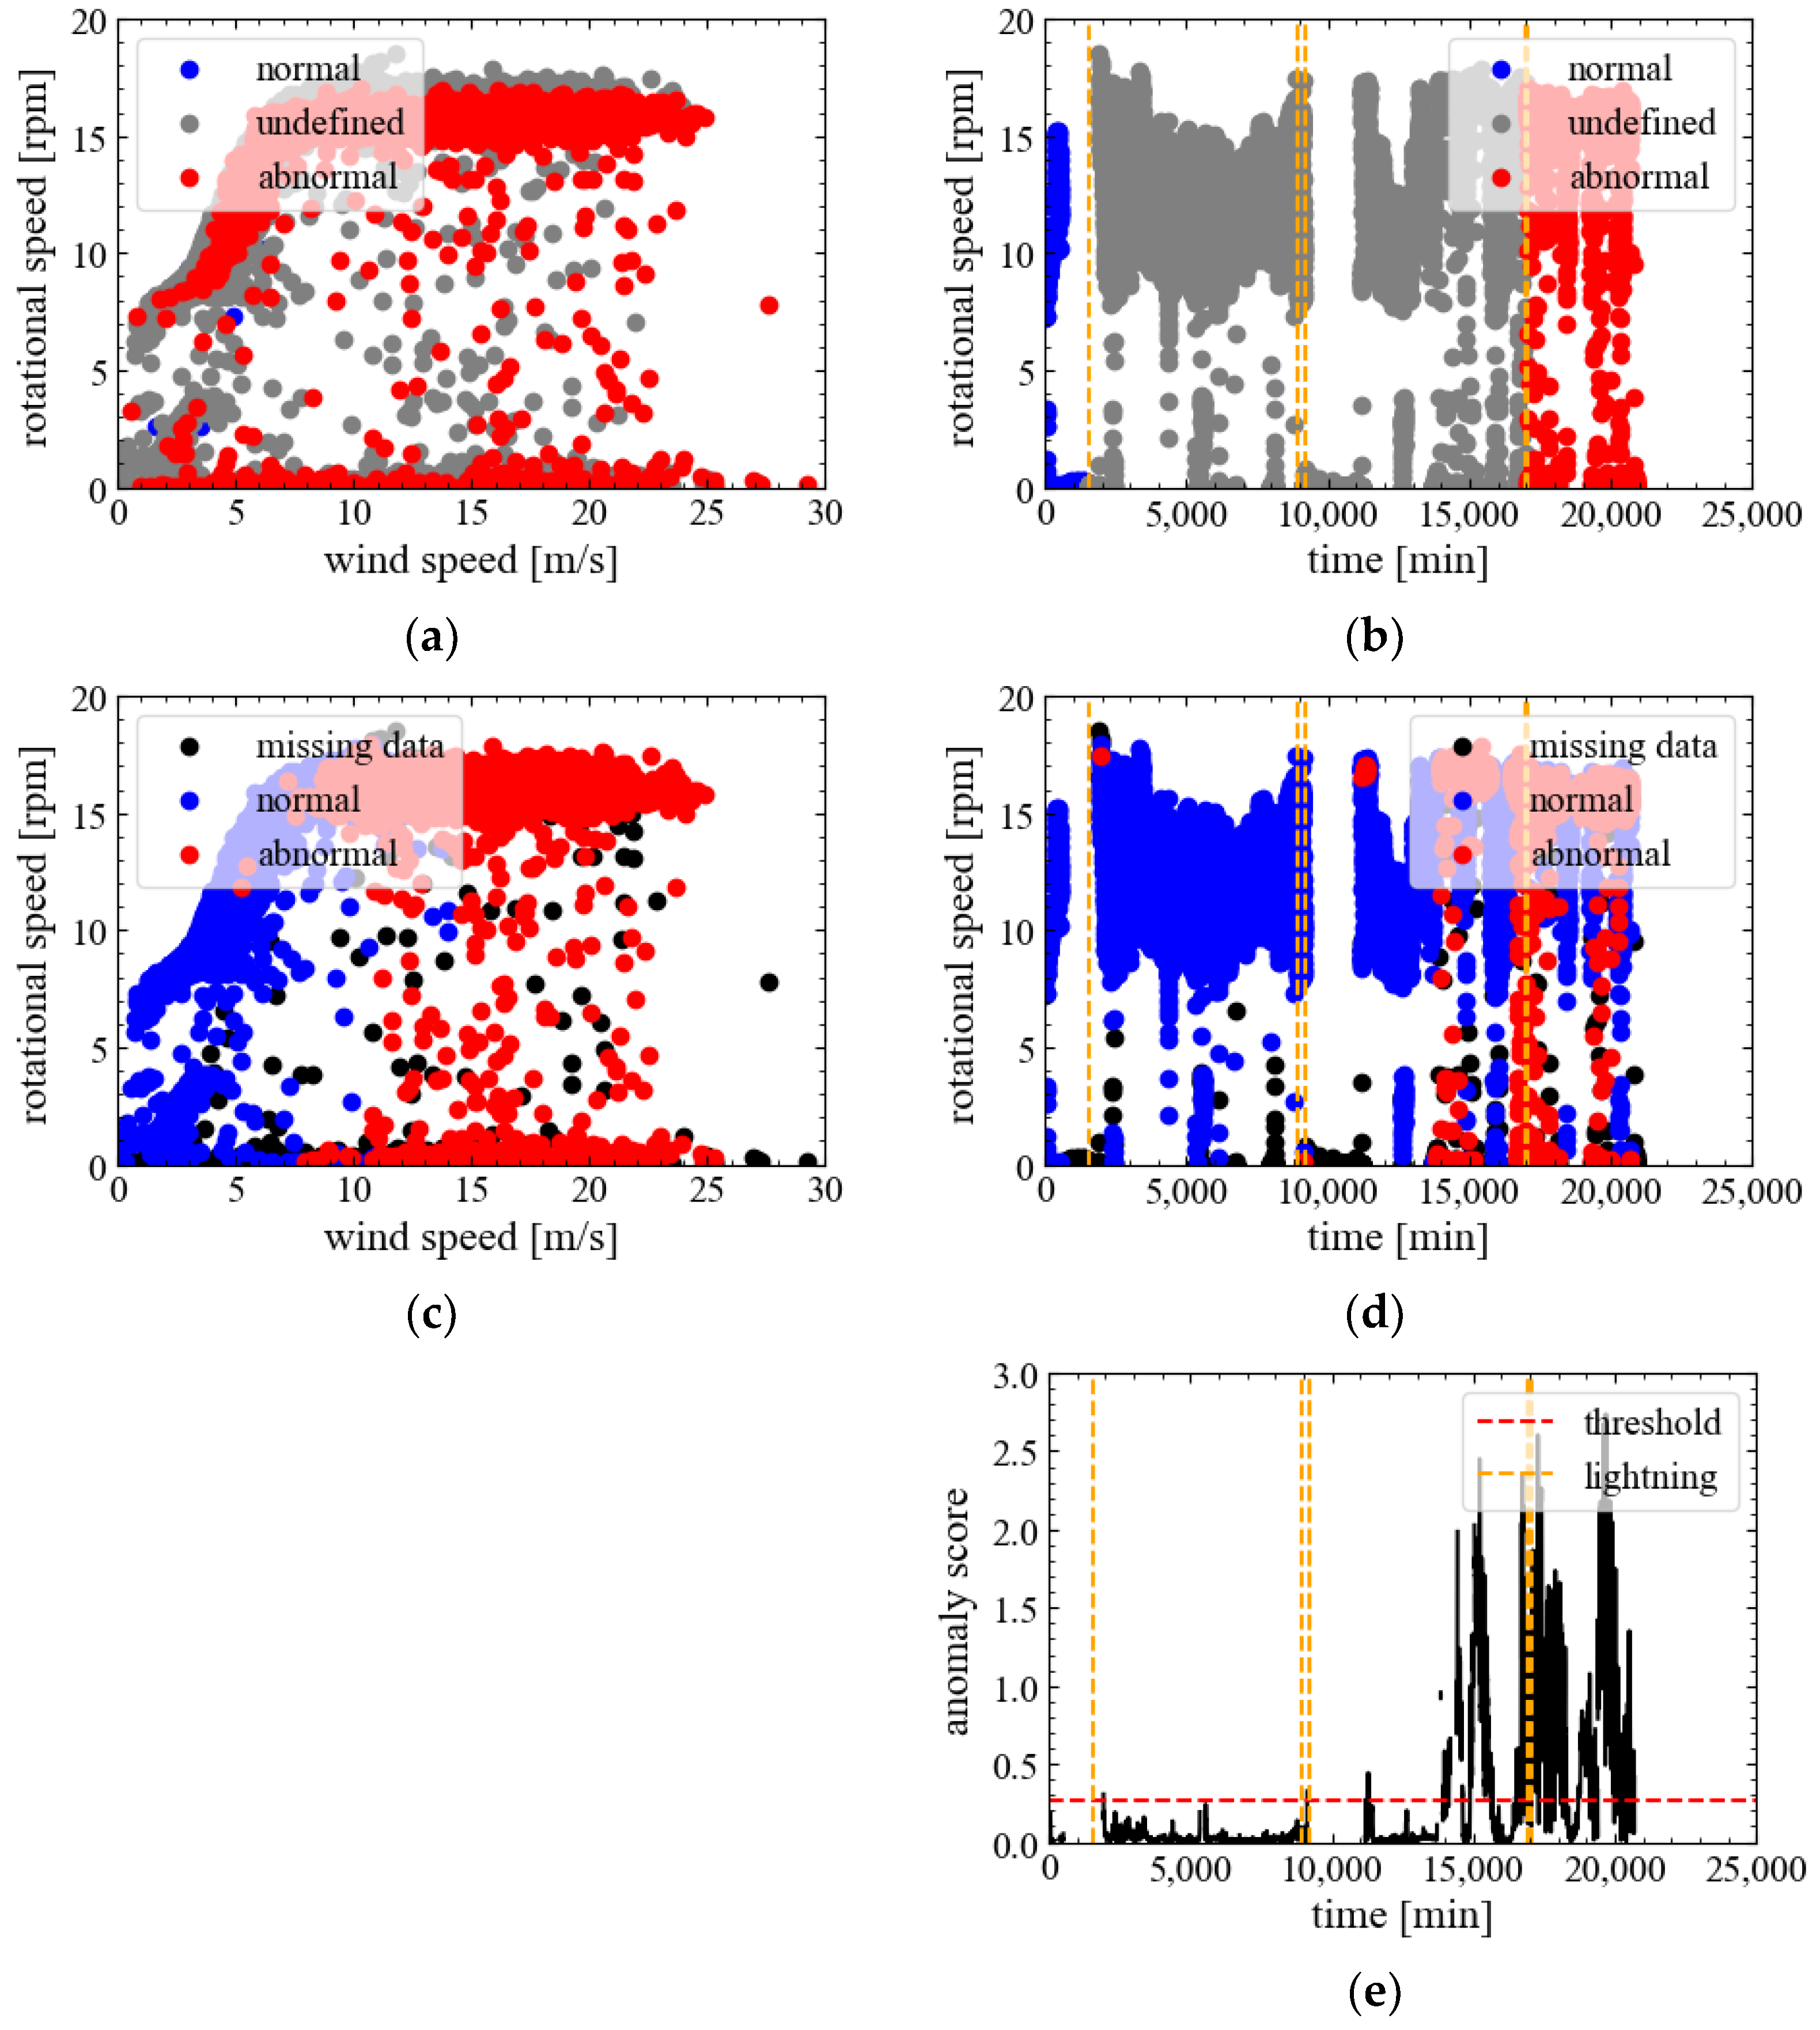
4.2. Wind Turbine B
5. Conclusions
Author Contributions
Funding
Data Availability Statement
Acknowledgments
Conflicts of Interest
Abbreviations
| LDS | Lightning detection system |
| SCADA | Supervisory Control and Data Acquisition |
| AE | Autoencoder |
| GPU | Graphics processing unit |
| MSE | Mean squared error |
| ReLU | Rectified linear unit |
| SGD | Stochastic gradient descent |
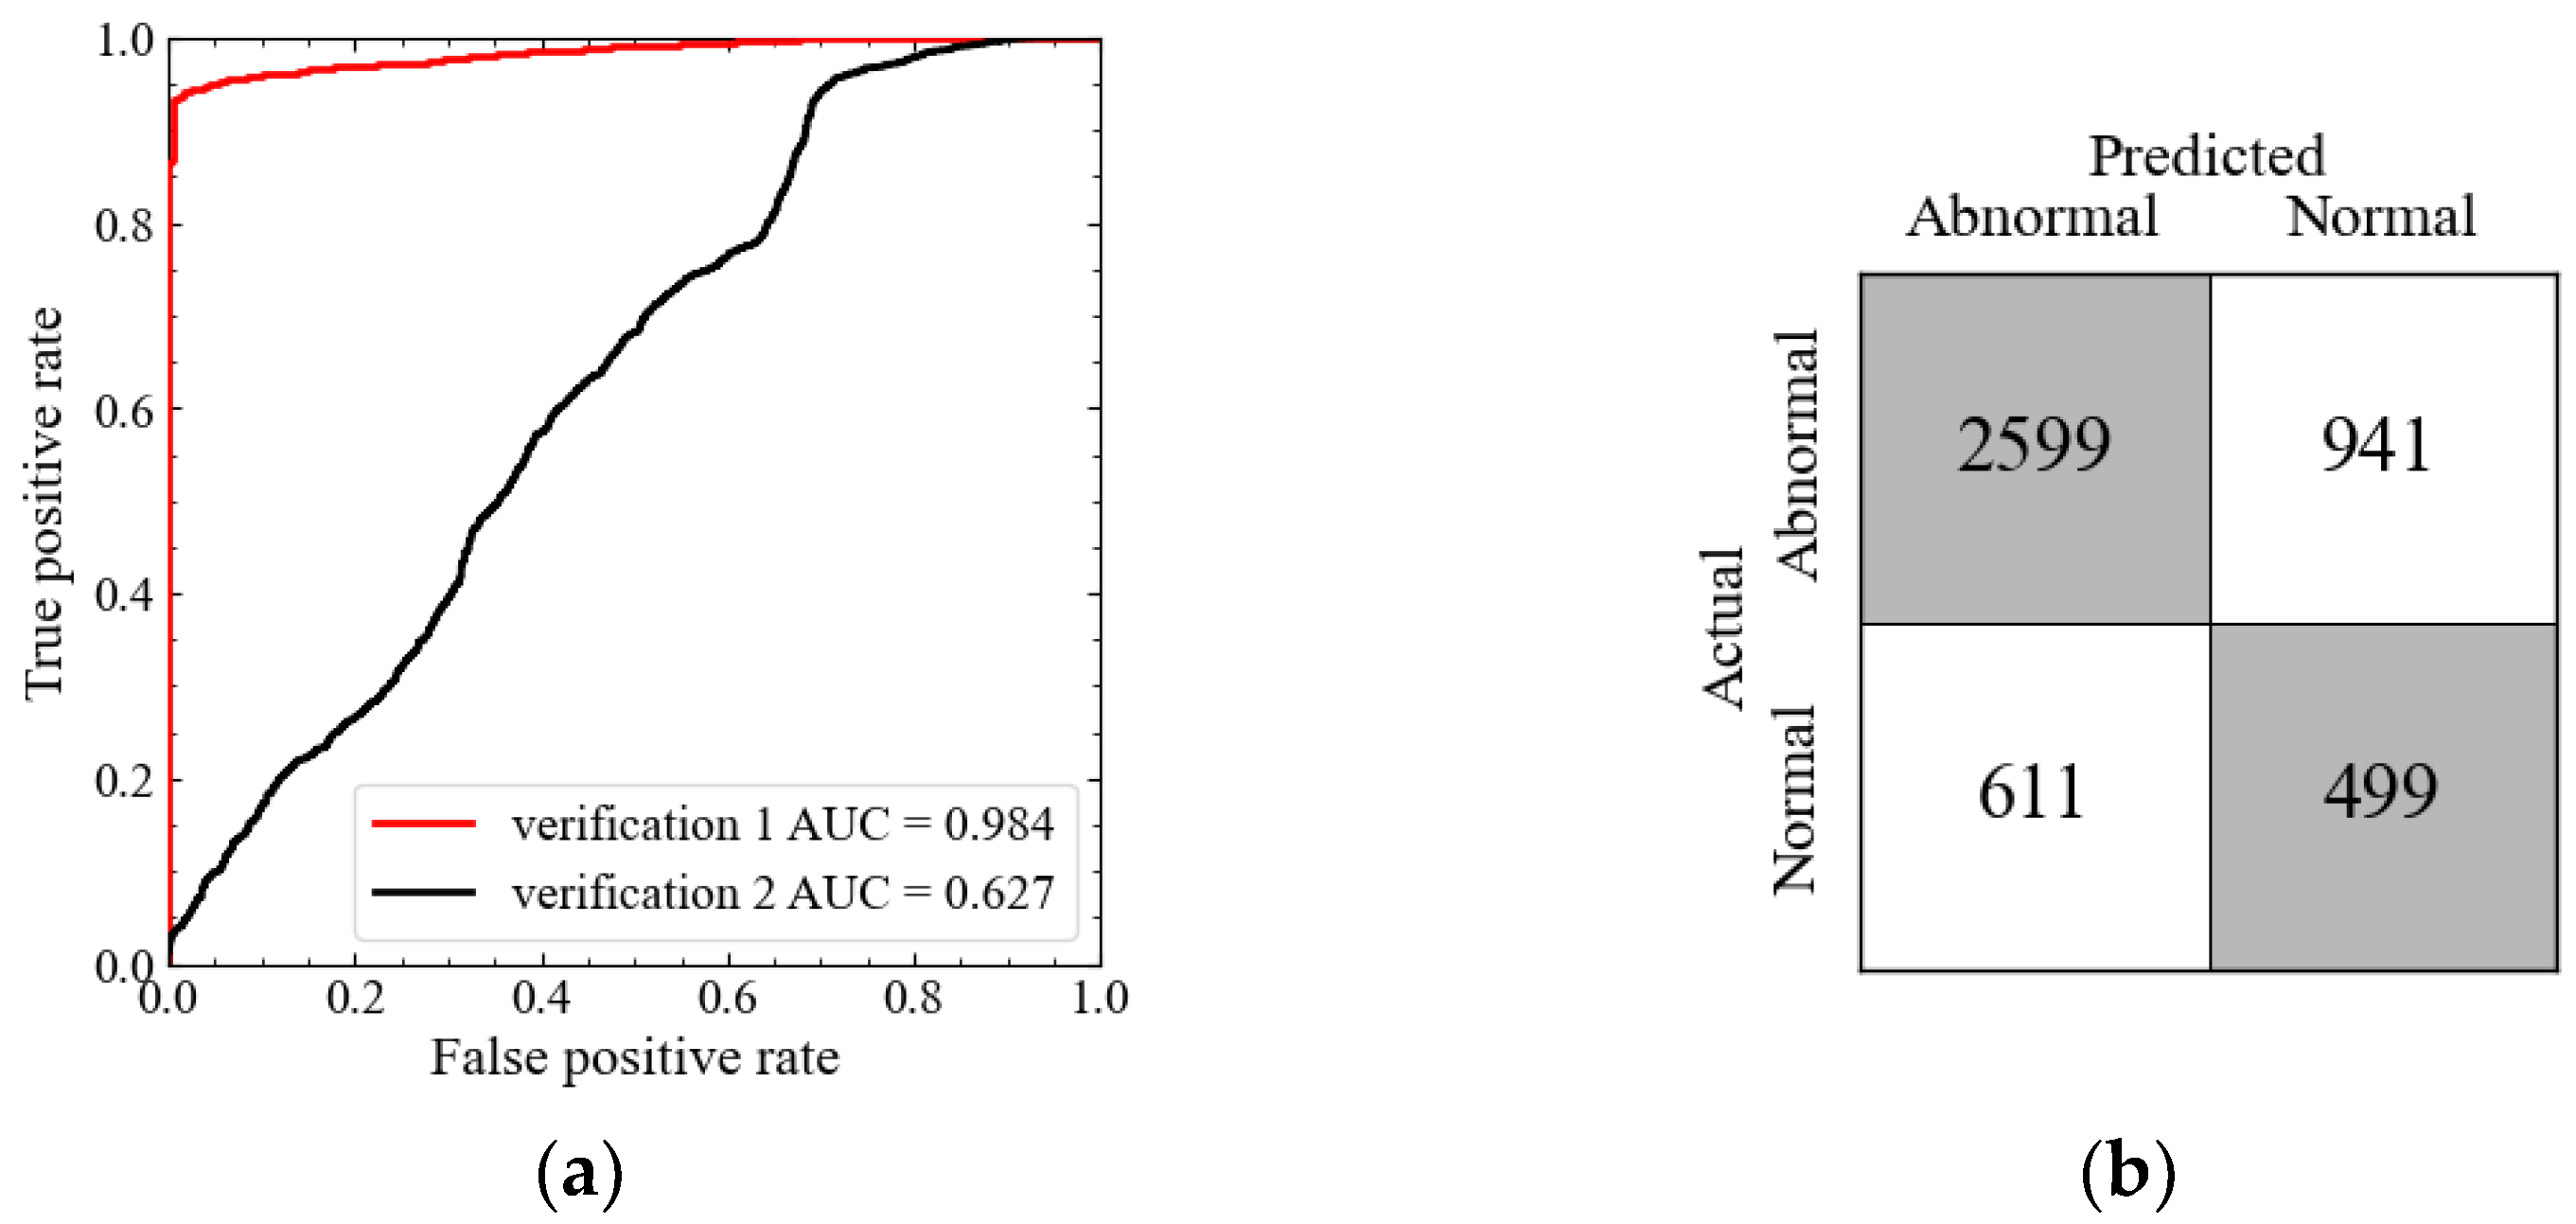
| ROC | Receiver operating characteristic |
| FPR | False positive rate |
| TPR | True positive rate |
| AUC | Area under the curve |
References
- REN21. Renewables 2022 Global Status Report. Available online: https://www.ren21.net/gsr-2022/ (accessed on 21 May 2025).
- Ishii, M.; Saito, M.; Natsuno, D.; Sugita, A. Lightning Incidence on Wind Turbines in Winter. In Proceedings of the 2014 International Conference on Lightning Protection (ICLP), Shanghai, China, 11–18 October 2014. [Google Scholar] [CrossRef]
- Yasuda, Y.; Yokoyama, S.; Minowa, M.; Satoh, T. Classification of Lightning Damage to Wind Turbine Blades. IEEJ Trans. Electr. Electron. Eng. 2012, 7, 559–566. [Google Scholar] [CrossRef]
- Ministry of Economy Trade and Industry New Energy Power Generation Facility Accident Response and Structural Strength Working Group. Available online: https://www.meti.go.jp/shingikai/sankoshin/hoan_shohi/denryoku_anzen/newenergy_hatsuden_wg/index.html (accessed on 21 May 2025).
- Garolera, A.C.; Madsen, S.F.; Nissim, M.; Myers, J.D.; Holboell, J. Lightning Damage to Wind Turbine Blades from Wind Farms in U.S. IEEE Trans. Power Deliv. 2016, 31, 1043–1049. [Google Scholar] [CrossRef]
- Miki, M.; Miki, T.; Asakawa, A.; Shindo, T.; Yokoyama, S. Characteristics of Upward Leaders of Winter Lightning in the Coastal Area of the Sea of Japan. IEEJ Trans. Power Energy 2012, 132, 560–567. [Google Scholar] [CrossRef]
- Wang, D.; Wu, T.; Takagi, N. Charge Structure of Winter Thunderstorm in Japan: A Review and an Update. IEEJ Trans. Power Energy 2018, 138, 310–314. [Google Scholar] [CrossRef]
- Goto, Y.; Narita, K. Electrical Characteristics of Winter Lightning. J. Atmos. Sol.-Terr. Phys. 1995, 57, 449–458. [Google Scholar] [CrossRef]
- Ishii, M. Research on Winter Lightning in Japan. IEEJ Trans. Power Energy 2012, 132, 524–528. [Google Scholar] [CrossRef]
- Wang, D.; Takagi, N. Characteristics of Winter Lightning that Occurred on a Windmill and Its Lightning Protection Tower in Japan. IEEJ Trans. Power Energy 2012, 132, 568–572. [Google Scholar] [CrossRef]
- Takada, Y. Wind Farm and Lightning; Seizandou Shoten: Tokyo, Japan, 2015. [Google Scholar]
- Investigating R&D Committee on Maintenance of the Lightning Resistance and Regulations/Standards of Wind Power Generation Facilities Latest Trends in Technologies for Maintaining Lightning Resistance and Improving the Availability of Wind Power Generation Facilities; The Institute of Electrical Engineers of Japan: Tokyo, Japan, 2021.
- Study Committee of Lightning Protection for Electrical and Electronic Equipment Lightning Protection for Electrical and Electronic Equipment; The Institute of Electrical Installation Engineers of Japan: Tokyo, Japan, 2011.
- Yokoyama, S. Lightning Protection of Wind Turbine Blades. Electr. Power Syst. Res. 2013, 94, 3–9. [Google Scholar] [CrossRef]
- Kose, M.; Tanaka, S.; Yamamoto, K.; Sekioka, S.; Baba, Y.; Nagaoka, N. Effective Length of Counterpoises Connected to Wind Turbine Foundation. IEEE Trans. Power Deliv. 2021, 36, 3956–3963. [Google Scholar] [CrossRef]
- Wang, Y.; Hu, W. Investigation of the Effects of Receptors on the Lightning Strike Protection of Wind Turbine Blades. IEEE Trans. Electromagn. Compat. 2017, 59, 1180–1187. [Google Scholar] [CrossRef]
- Ministry of Economy Trade and Industry Rules to Revise Part of Interpretation of Technical Standards for Wind Power Generation Facilities. Available online: https://www.meti.go.jp/policy/safety_security/industrial_safety/oshirase/2022/06/20220624.html (accessed on 5 February 2025).
- Fujioka, H. Preventing the Spread of Blade Lightning Damage with a Lightning Detection System. J. JWEA 2022, 46, 410. [Google Scholar]
- Miyamoto, K.; Oobayashi, K.; Suzuki, J.; Yamamoto, K.; Kogo, H.; Tsuchida, T. Performance Evaluations of Lightning Detection System for Wind Turbine. In Proceedings of the 12th Asia-Pacific International Conference on Lightning (APL), Langkawi, Malaysia, 12–15 June 2023. [Google Scholar] [CrossRef]
- Yamamoto, K.; Kazui, H.; Izuchi, S. Influence of Lightning Strike on Availability of Wind Turbine and its Damage Analysis. In Proceedings of the 36th International Conference on Lightning Protection (ICLP), Cape Town, South Africa, 2–7 October 2022. [Google Scholar] [CrossRef]
- Anderson, M. Supervisory Control and Data Acquisition. Available online: https://www.realpars.com/blog/scada (accessed on 10 April 2025).
- Yasuda, A.; Ogata, J.; Furusawa, Y.; Narusue, Y.; Murakawa, M.; Morikawa, H.; Iida, M. Wind Turbine Degradation Assessment Based on Condition Monitoring Model. Jpn. Wind Energy Assoc. 2018, 42, 53–62. [Google Scholar]
- Pandit, R.K.; Infield, D. SCADA Based Wind Turbine Anomaly Detection Using Gaussian Process (GP) Models for Wind Turbine Condition Monitoring Purposes. IET Renew. Power Gener. 2018, 12, 1249–1255. [Google Scholar] [CrossRef]
- Cui, Y.; Bangalore, P.; Tjernberg, L.B. An Anomaly Detection Approach Based on Machine Learning and SCADA Data for Condition Monitoring of Wind Turbines. In Proceedings of the 2018 IEEE International Conference on Probabilistic Methods Applied to Power Systems (PMAPS), Boise, ID, USA, 24–28 June 2018; pp. 1–6. [Google Scholar]
- Liu, X.; Lu, S.; Ren, Y.; Wu, Z. Wind Turbine Anomaly Detection Based on SCADA Data Mining. Electronics 2020, 9, 751. [Google Scholar] [CrossRef]
- Mehmood, Z.; Wang, Z. Enhanced Anomaly Detection and Normal Behaviour Power Curve Modelling in Wind Farm SCADA Data: A Hybrid Approach. Res. Sq. 2024. [Google Scholar] [CrossRef]
- Letzgus, S. Change-Point Detection in Wind Turbine SCADA Data for Robust Condition Monitoring with Normal Behaviour Models. Wind Energy Sci. 2020, 5, 1375–1397. [Google Scholar] [CrossRef]
- Matsui, T.; Yamamoto, K.; Sumi, S.; Triruttanapiruk, N. Detection of Lightning Damage on Wind Turbine Blades Using the SCADA System. IEEE Trans. Power Deliv. 2021, 36, 777–784. [Google Scholar] [CrossRef]
- Matsui, T.; Yamamoto, K.; Ogata, J. Study on Improvement of Lightning Damage Detection Model for Wind Turbine Blade. Machines 2021, 10, 9. [Google Scholar] [CrossRef]
- Hinton, G.; Salakhutdinov, R. Reducing the Dimensionality of Data with Neural Networks. Science 2006, 313, 504–507. [Google Scholar] [CrossRef] [PubMed]
- Sugiyama, S. Introduction to Analytical Models for Capturing the Essence of Data Analysis; Socym Co., Ltd.: Tokyo, Japan, 2022; ISBN 9784802613774. [Google Scholar]
- Fawcett, T. An Introduction to ROC Analysis. Pattern Recognit. Lett. 2006, 27, 861–874. [Google Scholar] [CrossRef]


| Wind Turbine | Type of SCADA Data | Data Period | |
|---|---|---|---|
| Training Data | Assessment Data | ||
| A | 1 min average data | The data after repair for about 32 days (rated operation) | The data at the accident for about 170 min (rated operation) |
| B | 1 min average data | The data before the accident for about 33 days (including rated and suppressed operation) | The data at the accident for about 16 days (suppressed operation) |
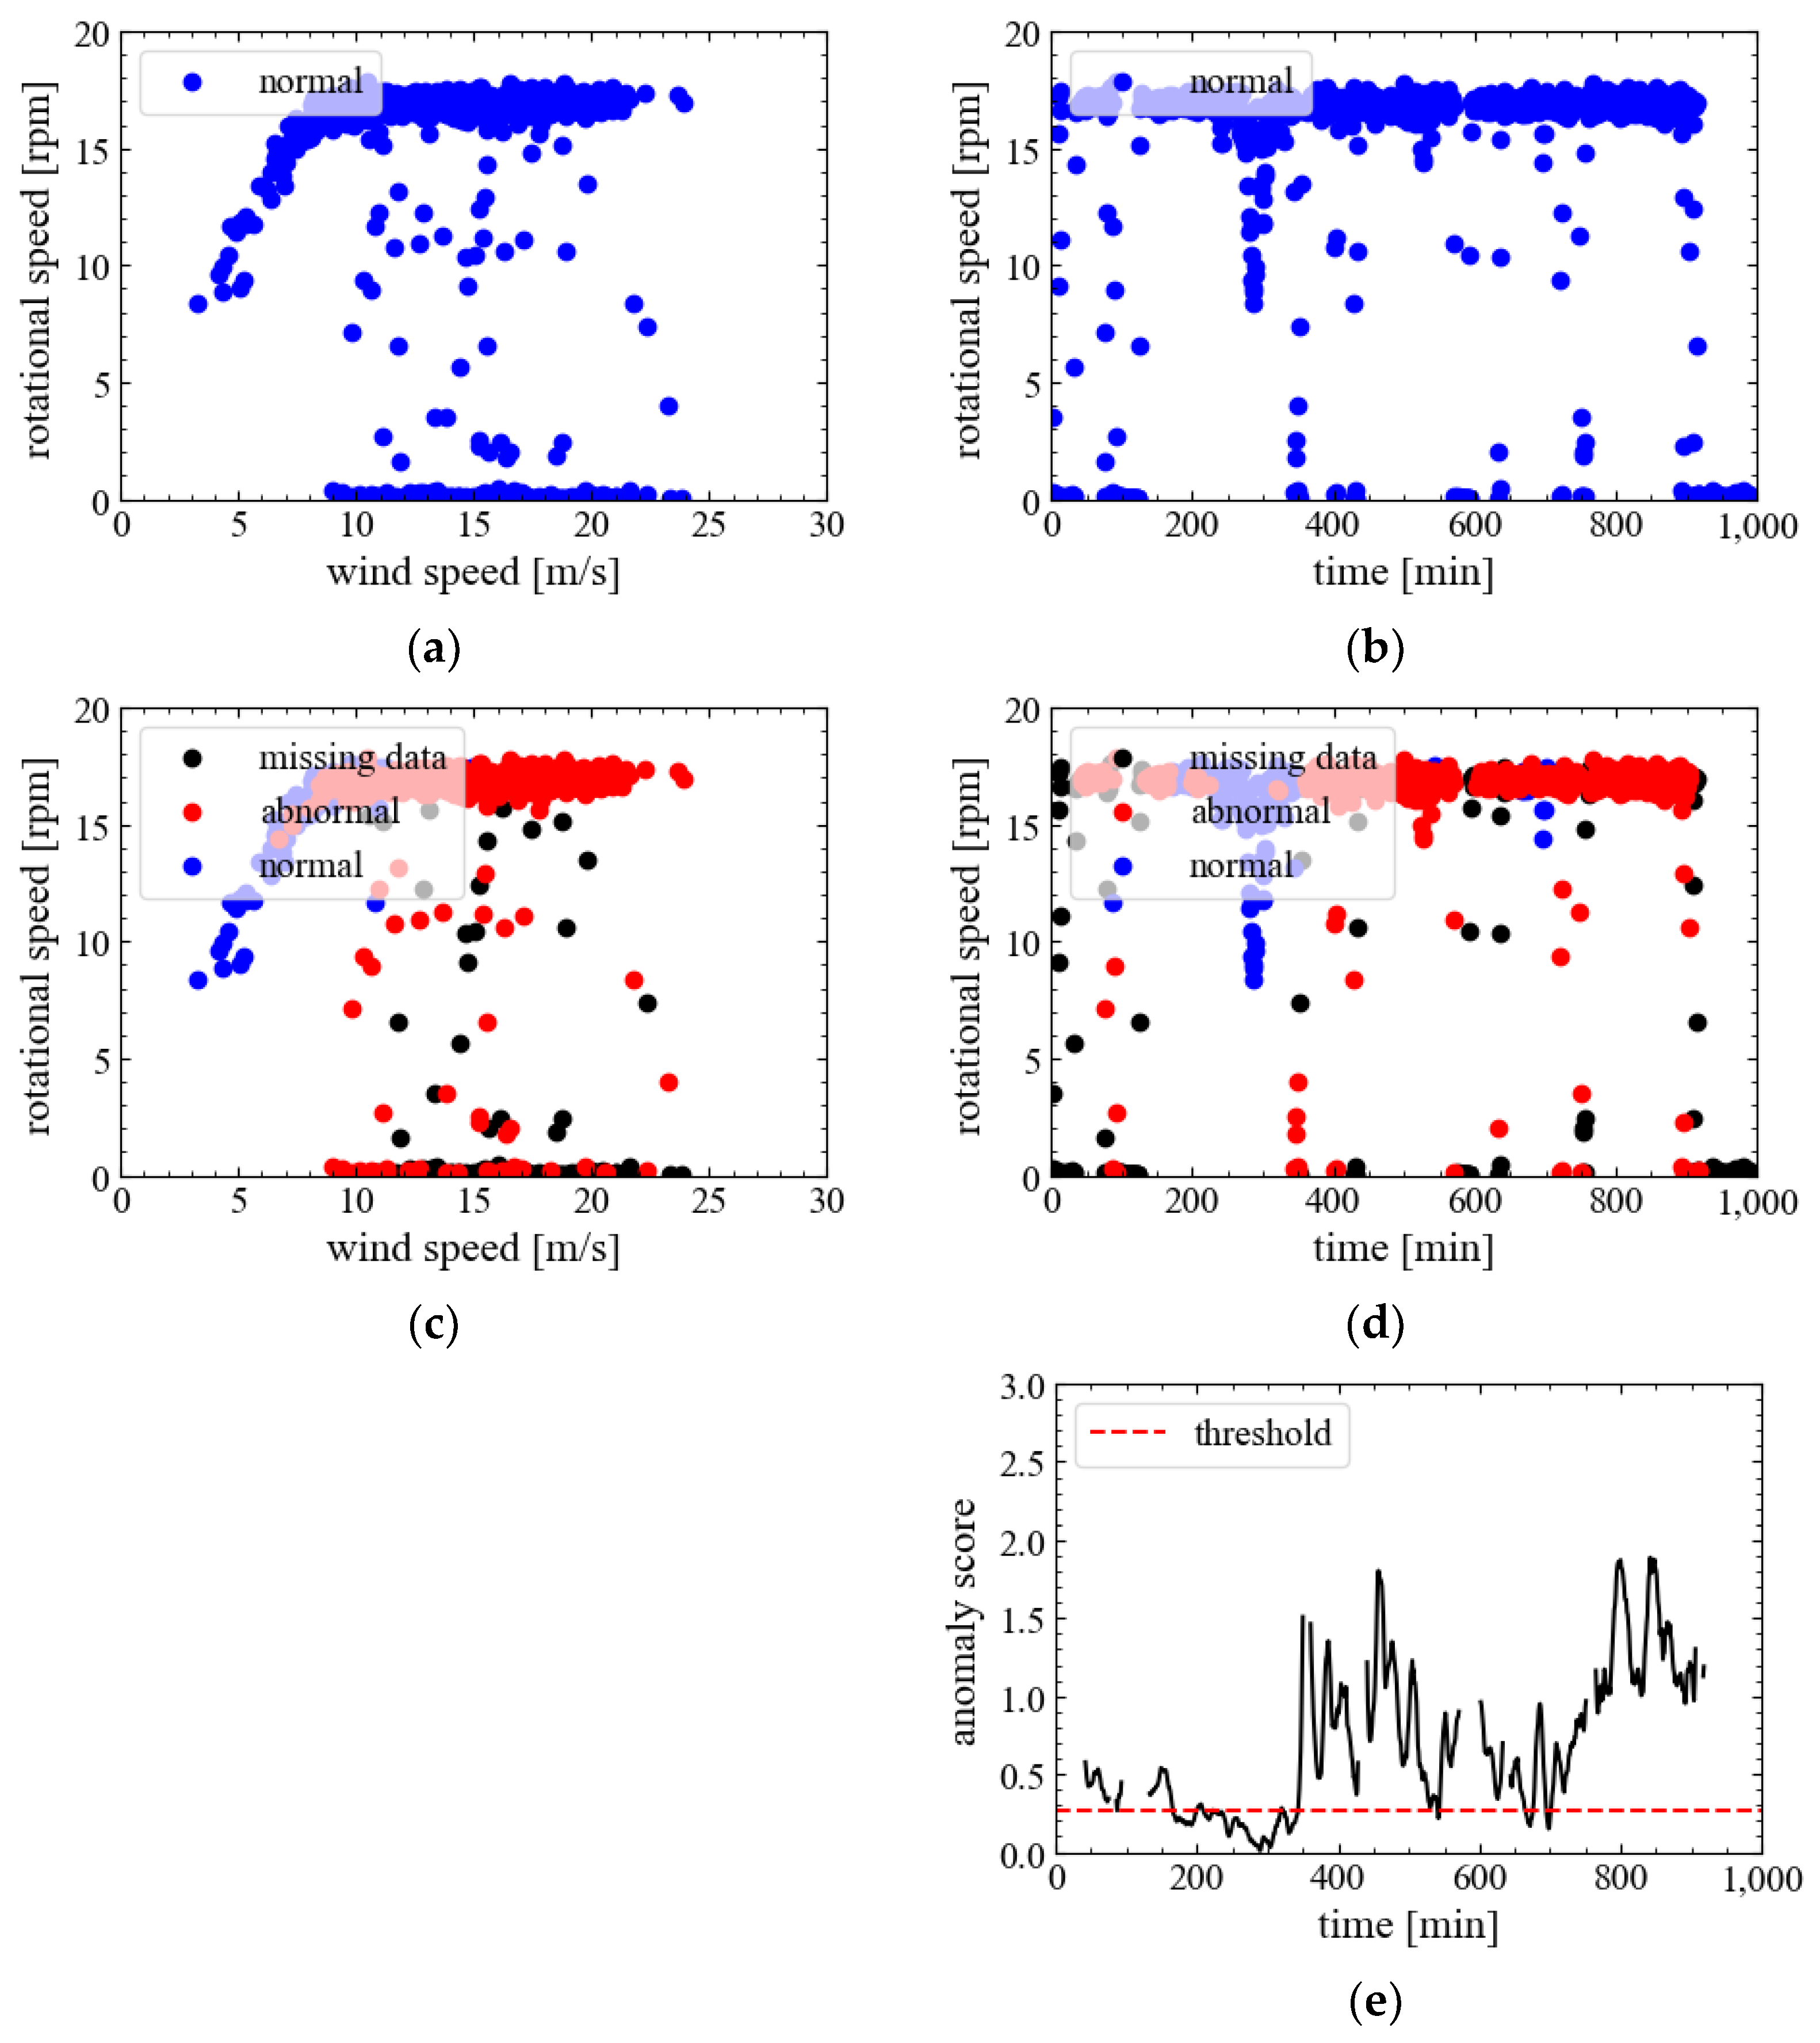
| The data before the accident for about 1000 min (suppressed operation) | |||
| Hyperparameter | Value/Description |
|---|---|
| Number of input layer nodes | 12 |
| Number of hidden layers | 1 |
| Number of hidden layers nodes | 4 |
| Activation function | ReLU |
| Iterative method | SGD |
| Batch size | 128 |
| Learning rate | 0.01 |
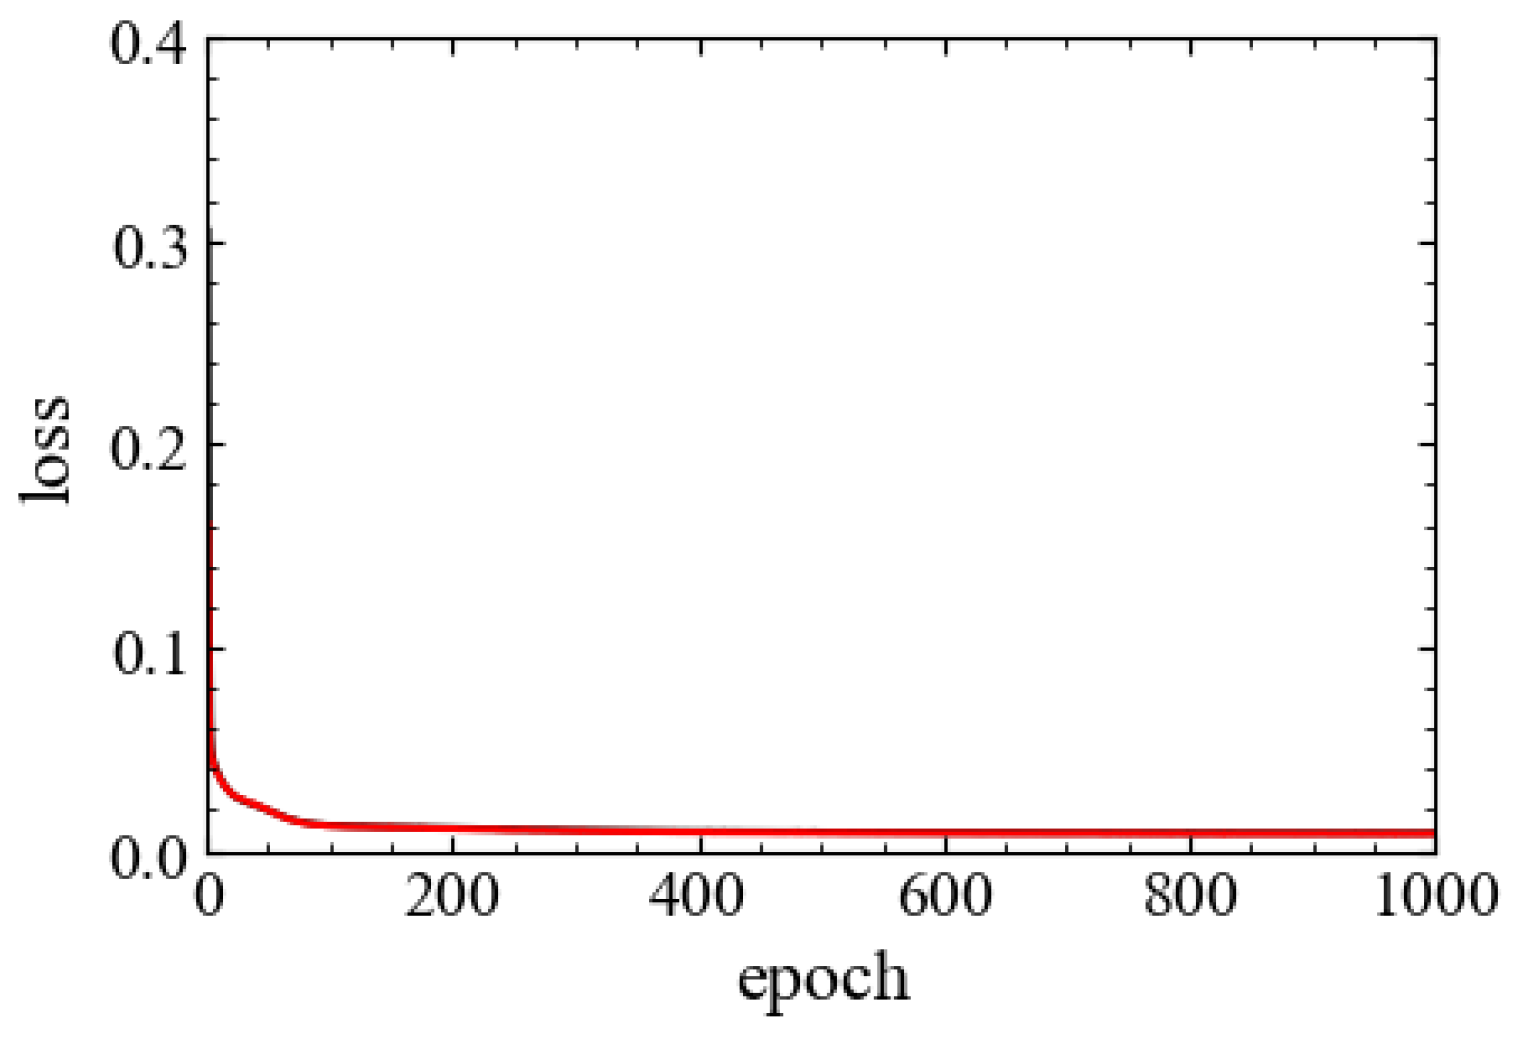
| Number of epochs | 1000 |
Disclaimer/Publisher’s Note: The statements, opinions and data contained in all publications are solely those of the individual author(s) and contributor(s) and not of MDPI and/or the editor(s). MDPI and/or the editor(s) disclaim responsibility for any injury to people or property resulting from any ideas, methods, instructions or products referred to in the content. |
© 2025 by the authors. Licensee MDPI, Basel, Switzerland. This article is an open access article distributed under the terms and conditions of the Creative Commons Attribution (CC BY) license (https://creativecommons.org/licenses/by/4.0/).
Share and Cite
Matsui, T.; Matsuoka, K.; Yamamoto, K. Lightning Damage Detection Method Using Autoencoder: A Case Study on Wind Turbines with Different Blade Damage Patterns. Wind 2025, 5, 12. https://doi.org/10.3390/wind5020012
Matsui T, Matsuoka K, Yamamoto K. Lightning Damage Detection Method Using Autoencoder: A Case Study on Wind Turbines with Different Blade Damage Patterns. Wind. 2025; 5(2):12. https://doi.org/10.3390/wind5020012
Chicago/Turabian StyleMatsui, Takuto, Kazuki Matsuoka, and Kazuo Yamamoto. 2025. "Lightning Damage Detection Method Using Autoencoder: A Case Study on Wind Turbines with Different Blade Damage Patterns" Wind 5, no. 2: 12. https://doi.org/10.3390/wind5020012
APA StyleMatsui, T., Matsuoka, K., & Yamamoto, K. (2025). Lightning Damage Detection Method Using Autoencoder: A Case Study on Wind Turbines with Different Blade Damage Patterns. Wind, 5(2), 12. https://doi.org/10.3390/wind5020012