1. Introduction
Decarbonisation is a critical global goal for reducing or limiting carbon dioxide (CO
2) emissions to mitigate the threat of climate catastrophe [
1]. It is considered imperative that businesses that rely on fossil fuels transition to energy sources that maintain an environmental balance, especially in the energy sector. Numerous studies have proposed a variety of remedies including substituting green hydrogen for fossil gas, utilising carbon capture technologies [
2], and investigating decarbonisation in transportation and other sectors [
3].
We present the results of a feasibility study conducted in Lutak, Iran, which offers a comprehensive technical and economic analysis concerning the switch to solar and/or wind power from fossil fuel as a means of generating electricity. The analysis emphasises their potential as workable substitutes that reduce carbon emissions and address other environmental issues [
4] and highlights the extremely high investment required by petrochemical, construction, and other energy-intensive industries to achieve these goals.
Further, we highlight how global multi-objective optimisation frameworks and standardised, globally recognised taxonomies are essential for evaluating and comparing these costs [
5]. This paper also identifies potential trade-offs between aggressive decarbonisation goals and their costs, demonstrating the importance of carefully weighing strategic decisions on decarbonisation and emissions to minimise adverse long-term economic effects [
6].
Numerous studies emphasise the urgent necessity and cost advantages of implementing low-carbon heating options such as thermal insulation, heat pumps, and hydrogen [
7]. Hydrogen currently appears a feasible option for the decarbonisation of global energy systems because it has good potential to replace the current gas infrastructure. Hydrogen gas can be produced from the surplus electricity generated by renewable sources, stored, and used when required [
8].
Delaying implementation of these measures could result in significantly higher energy costs and overall inefficiencies, even delaying the UK meeting its net-zero targets [
9]. In the UK, hybrid energy systems—especially those that include hydropower and wind—provide affordable options for producing renewable energy, with wind turbines having been shown to be profitable [
10]. A comprehensive strategy that incorporates consumer engagement, business model innovation, and policy assistance is necessary to unlock the heating sector’s green economic potential while maintaining sustainability and cost-effectiveness [
11]. The UK is currently passionately committed to reaching net-zero emissions by 2050, and its plan is supported by an estimated GBP 321 billion in spending and GBP 1.3 trillion in total investment. Savings of GBP 991 billion are anticipated to balance this cost, with most of the benefits anticipated to materialise by the 2040s [
12]. When compared to the possible 7% decline in global GDP by 2100 if climate change is left unchecked, these initial costs are considered tolerable, despite their size [
13].
Globally, shifting from fossil fuels to renewable energy sources such as solar, wind, hydropower, and geothermal energy is essential to attain effective decarbonisation [
14]. Studies continuously emphasise the urgent need to accelerate renewable energy deployment, provide the significant investments in infrastructure that are required, and implement supportive policies [
15]. Improving energy efficiency in diverse areas is also critical to decrease emissions. Much research has highlighted the necessity of adopting energy-efficient technologies, implementing energy management systems, and encouraging sustainable behaviour in, for example, the manufacturing, construction, and transportation industries [
16].
Additionally, electrification and fuel switching are critical to decarbonise sectors such as transportation and heating. The transition from fossil fuels to low-carbon alternatives, such as electric vehicles (EVs), has attracted much attention. This has mostly been due to technological breakthroughs and legislative reforms, which have accelerated the global adoption of EVs [
17]. As a result, EVs are increasingly seen as essential to achieving a low-carbon future [
18]. Additionally, replacing fossil-fuel-based heating systems with heat pumps or sustainable bioenergy offers further potential to decarbonise the heating sector [
19]. Furthermore, carbon capture and storage technologies have emerged as a critical tool for reducing carbon emissions. Carbon capture and storage absorbs CO
2 from power stations and industrial facilities and stores it underground, providing an approach to achieving deep decarbonisation [
20]. Additionally, encouraging the transition to a more circular economy, in which resources are used more efficiently and waste is reduced, is critical for long-term decarbonisation. The literature emphasises the necessity of sustainable activities such as recycling, reusing materials, and limiting consumption, to minimise emissions associated with resource extraction and waste management [
21].
Financial mechanisms play a crucial role in supporting the shift to zero-emission transport systems, with a focus on rail and inland waterways [
22]. Studies that compare approaches to decarbonise the transportation industry through electrification and hydrogen technologies provide insights into the potential cost implications and emissions reductions [
23]. Similarly, the decarbonisation of dispersed industrial sites necessitates considering a broad range of abatement options that may be appropriate to meet the unique challenges presented [
24].
A review of the current literature indicates that despite significant efforts to reduce carbon emissions in specific sectors or regions, a comprehensive and unified analysis covering an entire national economy has not been conducted. We address this requirement and intend to fill that gap by providing a complete national-level analysis of decarbonisation measures in an oil-exporting country: Libya. In contrast to prior studies that focus on specific sectors and technologies, we present a complete analysis, which can help policymakers achieve energy self-sufficiency while also supporting global carbon reduction targets.
2. Analysis Method
The methodology used in the economic evaluation of green energy systems, such as solar farms, wind farms, and the helium cycle, necessitates a thorough study of both capital expenditure (CAPEX) and continuing operational and maintenance (O&M) costs. In this analysis, the overall capital outlay for each system has been detailed, including investments in various items such as H2CCGT (hydrogen combined-cycle gas turbine) packages, solar panels, wind turbines, electrolysis units, transmission infrastructure, and hydrogen storage, as shown in
Table 1. This rigorous financial evaluation provides stakeholders with a clear picture of the financial commitments required to build these renewable energy systems.
In addition to capital expenses, continuing O&M costs have been carefully allocated to individual components such as H2CCGTs, solar panels, wind turbines, helium combined-cycle gas turbines (HeCCGTs), electrolysis units, transmission infrastructure, and hydrogen storage. This classification enables a thorough evaluation of the long-term financial requirements associated with operating and maintaining these systems. This paper also considers two different scenarios for the solar PV farm: the first analysis presents expenses, while the second includes an updated economic model in which the cost of solar panels is predicted to fall by 50%, a not unrealistic scenario given the rate of decrease in the price of solar panels over the last decade. These economic models provide critical insights into the financial elements of renewable energy systems, emphasising both large initial investments and continuing operational expenses. They allow stakeholders to make informed decisions by considering both the economic feasibility and the long-term sustainability of these systems.
Furthermore, this analytic approach makes use of precise computations and accepted formulas to quantify capital expenditures and continuing O&M costs for each component and item of infrastructure. When using such an approach, stakeholders are provided with better knowledge of the financial implications, allowing them to make educated decisions about the deployment and operation of renewable energy systems.
Table 1 presents the national needs of Libya for three renewable approaches, solar, wind, and HeCCGT. Each approach has been evaluated and acts as the basis for the cost calculations in this research, subject to minor adjustments to the data, as made in [
25]. In the context of this research, the economic feasibility of each case for decarbonisation in Libya was explored and analysed. Solar energy is addressed in reference [
26], wind energy in [
27], and helium cycles in [
28], and improved data are given in reference [
25]. We conducted an economic comparison of the three approaches, which should be seen as an extension of the research undertaken by the authors in the linked papers (
Table 1). The distinctive aspect of this article is that it provides economic values for the total decarbonisation of an oil-exporting country, which has not been addressed previously.
3. Baseline Economic Model for Solar Farm
The economic model for a solar farm, particularly in the context of exporting energy, involves a comprehensive analysis of both CAPEX and ongoing O&M costs.
Table 2 presents the national requirements in two scenarios: meeting winter demands, and using solar PV farms to their full capacity and exporting 2100 PJ of hydrogen annually [
26].
3.1. Total Capital Cost for Equipment
The total capital cost is calculated based on components including the CAPEX of H2CCGTs, solar panels, electrolysis, hydrogen storage, and transmission elements.
The CAPEX of H2CCGTs is determined by multiplying the number of units by the cost per unit, considering a 600 MW capacity for each unit.
The number of solar panels is calculated based on the power produced and the capacity rating per panel, considering the conversion of 657 GW via a panel capacity of 330 W.
The CAPEX of solar panels is the number of panels multiplied by the price per panel.
The CAPEX of electrolysis units is computed based on the GW capacity and cost of one electrolysis unit.
The CAPEX of hydrogen storage is based on the conversion of 43,500 tonnes of H2 to kilograms and multiplied by the cost of storage per kilogram.
The CAPEX of transmission elements is determined by converting the GW capacity to MW and multiplying by the cost per MWh.
The total capital cost for equipment is summarised, providing the overall expenditure in billions of dollars and the percentage distribution of costs.
3.1.1. Breakdown of the Capital Costs for Solar Farm Equipment
The capital costs for solar PV farm equipment and accompanying equipment used to decarbonise Libya are broken down into investment costs (ICs) and operation and maintenance (O&M) expenses. The ICs are further divided into five components, with an extra level of categorisation known as “elements” added [
29].
The O&M costs are also structured novelly [
30]. The levellised cost of electricity (LCOE) for large-scale photovoltaic (PV) farms is an important factor in evaluating the economic benefits of PV generation. The LCOE for a PV farm in Qatar was found to be much lower than the LCOE of efficient combined-cycle gas turbine (CCGT) plants [
8], highlighting the economic benefits of PV farms [
31]. The cost of PV modules is around USD 4.5 to 5 per peak watt, and PV pumping system costs range from USD 7 to 15 per peak watt [
32]. PV technology has been employed in various agricultural applications, including water pumping, irrigation, crop drying, and greenhouse cultivation [
33]. The allocation of capital expenses for solar farm equipment included a thorough assessment of the numerous components that contribute to the overall investment in renewable energy infrastructure [
34].
The breakdown of costs for solar farm equipment is as follows:
3.1.2. H2CCGTs (Hydrogen Combined-Cycle Gas Turbines)
The CAPEX for H
2CCGTs is computed by multiplying the number of units by the cost per unit, with each unit possessing a 600 MW capacity. This accounts for the capital investment in advanced power generation technology when integrating hydrogen into the gas turbine cycle [
8].
3.1.3. Solar Panels
The number of solar panels is determined by considering the power produced (657 GW) and the capacity rating per panel (330 W) [
35]. The CAPEX for solar panels is calculated by multiplying the number of panels by the price per panel [
36].
3.1.4. Electrolysis
This component of the capital costs pertains to the creation of hydrogen through the electrolysis process, which is an important aspect of renewable energy storage and utilisation [
37]. The CAPEX for electrolysis is calculated considering the gigawatt (GW) capacity and the cost of a single electrolysis unit.
3.1.5. Hydrogen Storage
The CAPEX for hydrogen storage is calculated by translating 43,500 tonnes of hydrogen into kilogrammes and multiplying by the cost per kilogramme. This shows the capital expenditure associated with storing hydrogen, a crucial component in balancing the intermittent nature of renewable energy sources [
38].
3.1.6. Transmission Elements
The CAPEX for transmission elements is determined by converting the GW capacity to megawatts (MW) and multiplying by the cost per megawatt-hour (MWh) [
34]. This component represents the investment in the transmission infrastructure necessary to efficiently transport energy from the solar farm to end-users.
Finally, the total capital costs for all these components are determined and expressed as billions of US dollars. The relative distribution depicts how much funding is allocated to each of these components, providing a clear picture of where money is being invested in the development of a sustainable energy infrastructure.
3.1.7. Explanation of the Formulas and Values Used in Solar Farms
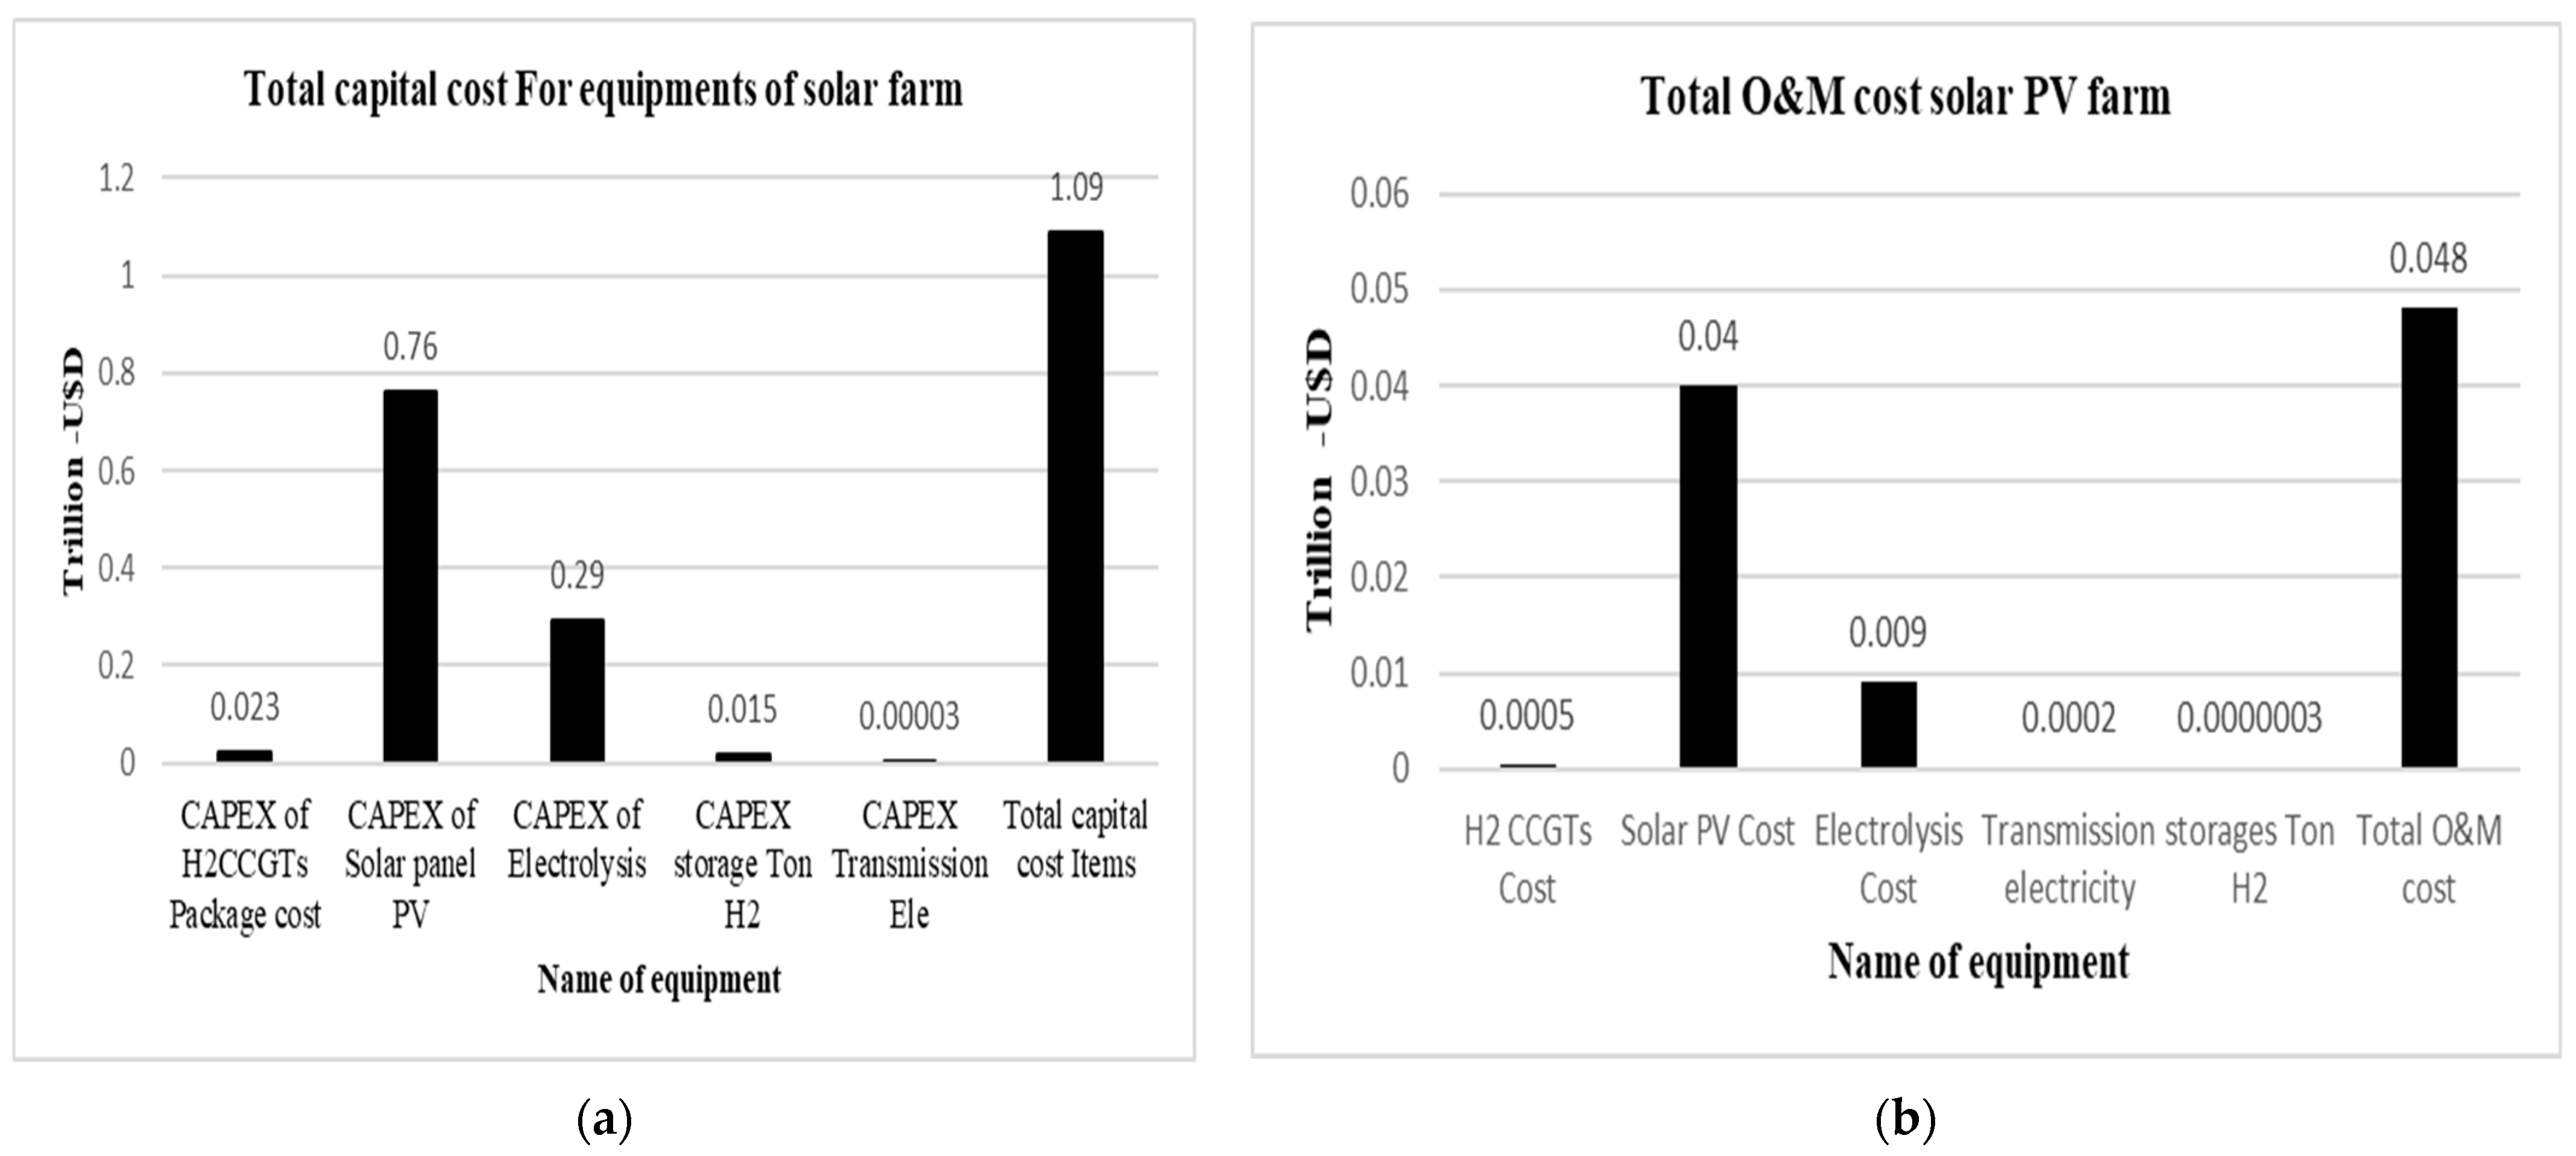
Table 3 provides a complete overview of the economic perspective of a decarbonisation solar farm for Libya, with a focus on exports and specific information on both the replacement and transition costs of decarbonisation in terms of real capital and operational expenses. In terms of capital expense, solar PV panel costs make up 67% and electrolysis contributes 26%, while the H
2CCGT package adds only 1.9% and H
2 storage only 1.3%. These four items account for just under 95% of the total capital cost, which is an astonishing USD 1.14 trillion. On the O&M side, the main costs are solar panels and H
2 storage, followed by—in order—electrolysis, transmission, and H
2CCGTs. These figures all contribute to the total operation and maintenance cost of USD 0.063 trillion.
This specific breakdown enables a clear comparison of the primary contributors, emphasising the enormous impact of solar PV panels on capital and operational expenses.
Figure 1a,b depict the CAPEX and O&M costs for all equipment in the solar farm project used in this decarbonisation analysis.
3.1.8. Improved Economic Efficiency Model for a Solar Farm (50% Cheaper Solar Panels)
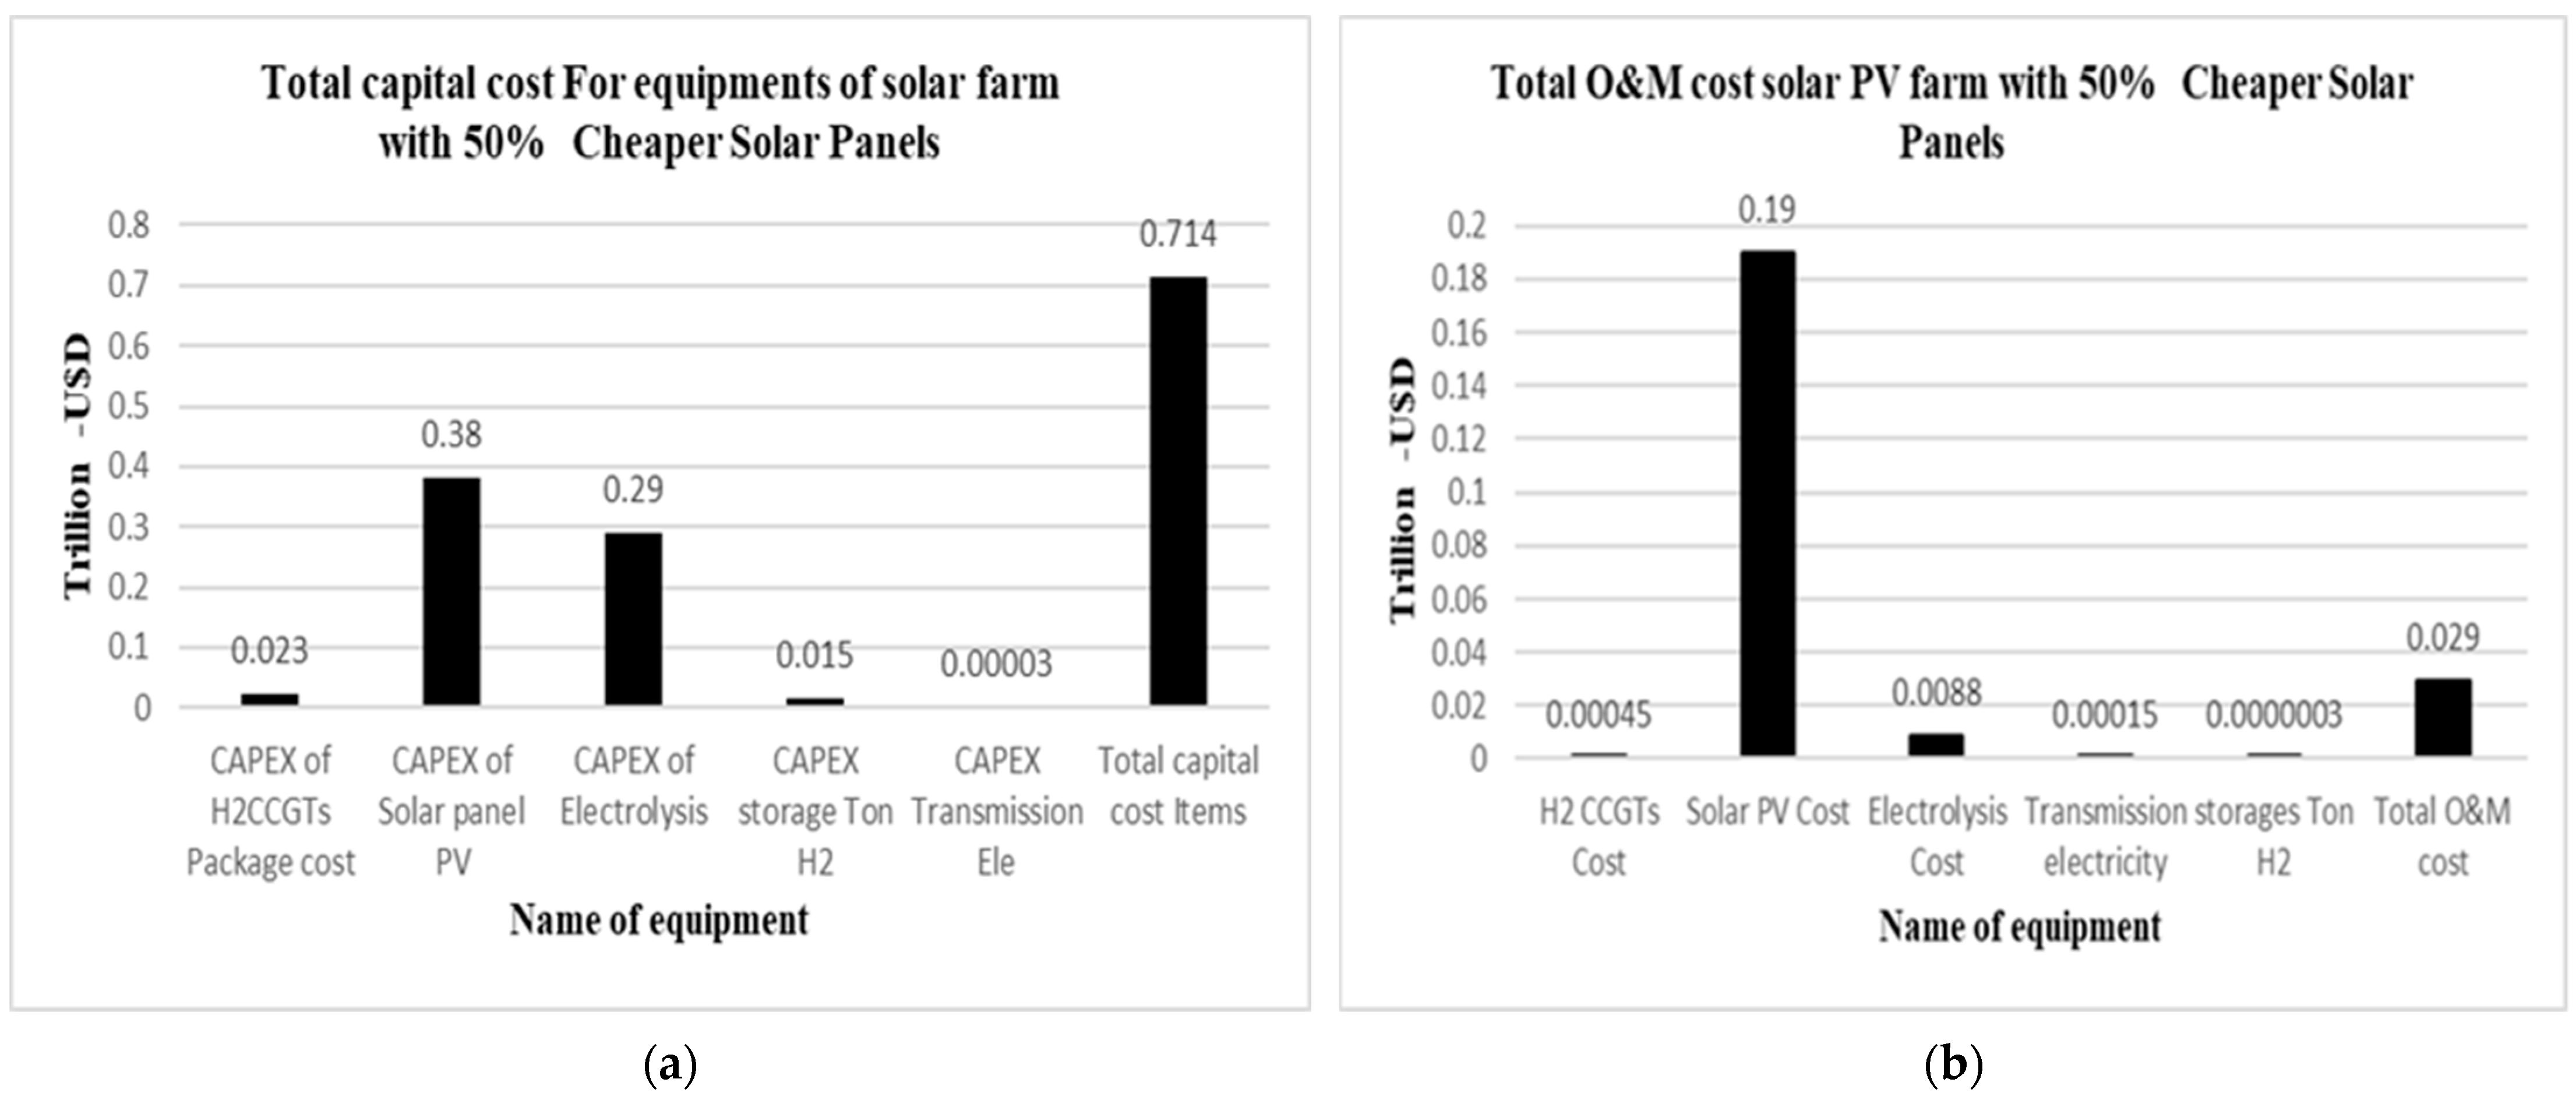
Table 4 presents the economic framework for a solar farm, assuming a 50% decrease in the price of solar panels. As would be expected, this scenario yields a notably reduced capital expenditure (CAPEX) in comparison to the scenario presented above [
39]. The solar PV panel cost, which formerly accounted for 67% of total CAPEX, has been reduced to 51%, demonstrating the huge impact of more cost-effective solar technology. The total CAPEX falls from USD 1.15 to 0.74 trillion, demonstrating the cost savings to be obtained from using less expensive solar panels. Note that the same effect could be achieved by using fewer but more efficient panels with the same cost/panel.
In terms of total upfront costs, when the price of solar panels is reduced by 50%, we see O&M costs amounting to USD 0.029 trillion, compared to USD 0.048 trillion annually with the more expensive panels.
Figure 2a,b depict the total capital and O&M costs of a solar facility using 50% cheaper solar panels. The left graphic shows that the entire capital outlay is USD 0.743 trillion, with the principal costs of USD 0.38 trillion for solar panels and USD 0.29 trillion for electrolysis. The right graphic shows that total O&M expenses are significantly lower, at USD 0.029 trillion, with solar photovoltaic (PV) expenses accounting for the majority (USD 0.019 trillion). Additional large expenditures include USD 0.023 trillion for hydrogen combined-cycle gas turbines (H
2CCGTs) and USD 0.013 trillion for storage. These data demonstrate that, despite the lower cost of solar panels, the initial capital inputs still greatly outweigh the ongoing operational costs required to maintain the solar farm.
3.1.9. Summary of Solar Farm Economics
This analysis has compared two possible scenarios for a solar farm’s economic framework. The normal scenario has a total initial investment of USD 1.14 trillion, where solar panels account for 67% of the cost and total annual operation and maintenance expenses are USD 0.048 trillion. A scenario where the solar panels were purchased at a 50% cost saving resulted in a reduction in total capital expenditures of USD 0.743 trillion. This reduction improves the accessibility and economic viability of solar infrastructure. The data also showed that the O&M costs totalled USD 0.029 trillion. These results confirm the importance of greater competitiveness in solar panel pricing for the widespread use of solar systems as a replacement for fossil fuels.
4. Wind Farm Economic Model
Table 5 presents the national requirement to produce and export 2100 PJ of hydrogen annually when using wind turbines to their full capacity [
28]. When developing an economic model for a wind farm, particularly for export purposes, both CAPEX and O&M costs are thoroughly examined.
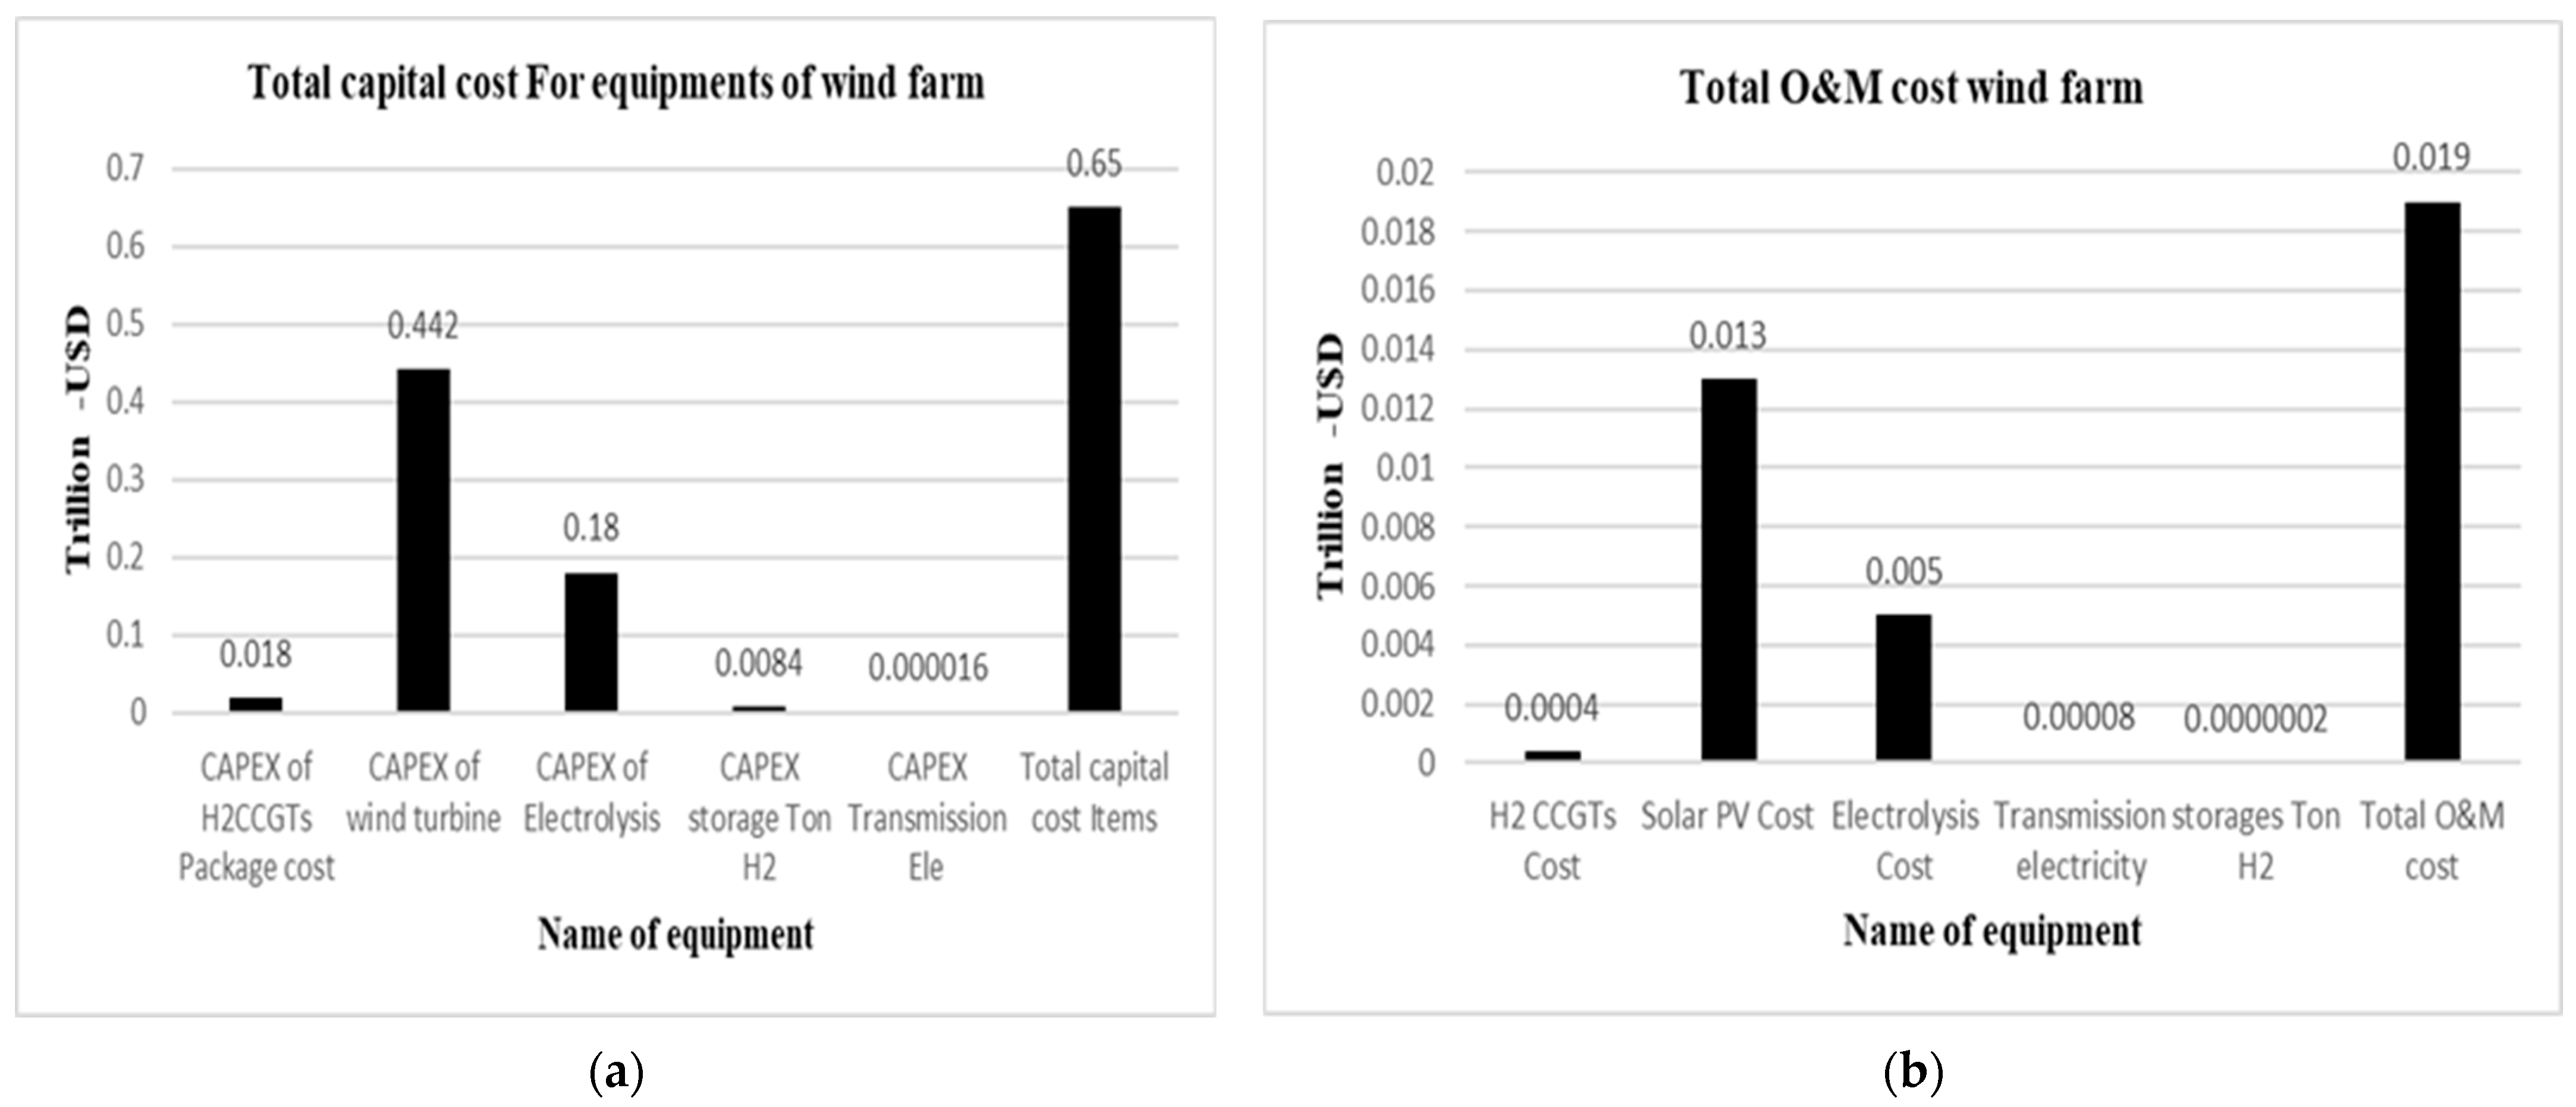
In the distribution of total capital costs for equipment (see
Table 6), key investments are dominated by USD 0.44 trillion for wind turbines, almost two-thirds of the total investment, followed by equipment for electrolysis at USD 0.18 trillion, equating to 27% of total capital costs and reflecting its pivotal role in hydrogen production and storage. These two comprise the backbone of wind power harnessing [
40]. Smaller components include USD 0.018 trillion for H
2CCGTs, 2.76% of the total investment [
8], and completion of hydrogen storage facilities, requiring USD 0.0084 trillion, 1.26% of the total investment [
38]. Despite their relatively minor cost, at USD 0.00016 trillion, transmission elements are indispensable [
34]. Overall, the capital expenditure for equipment is USD 0.65 trillion, with the majority of that going towards assuring the wind farm’s efficiency and sustainability.
In terms of O&M expenditures, appropriate allocations include USD 0.05 trillion for continuous electrolysis unit operation (0.80%), USD 0.0004 trillion for maintaining the hydrogen CCGT package (0.06%), and USD 0.013 trillion for wind turbine maintenance (0.02%). Maintenance for hydrogen storage costs USD 0.00000016 trillion (0.00002%), whereas transmission infrastructure costs USD 0.00008 trillion (0.013%). Overall, continuing O&M costs to maintaining operational efficiency are USD 0.019 trillion, accounting for 2.86% of the overall financial commitment.
5. Helium Cycle Economic Model
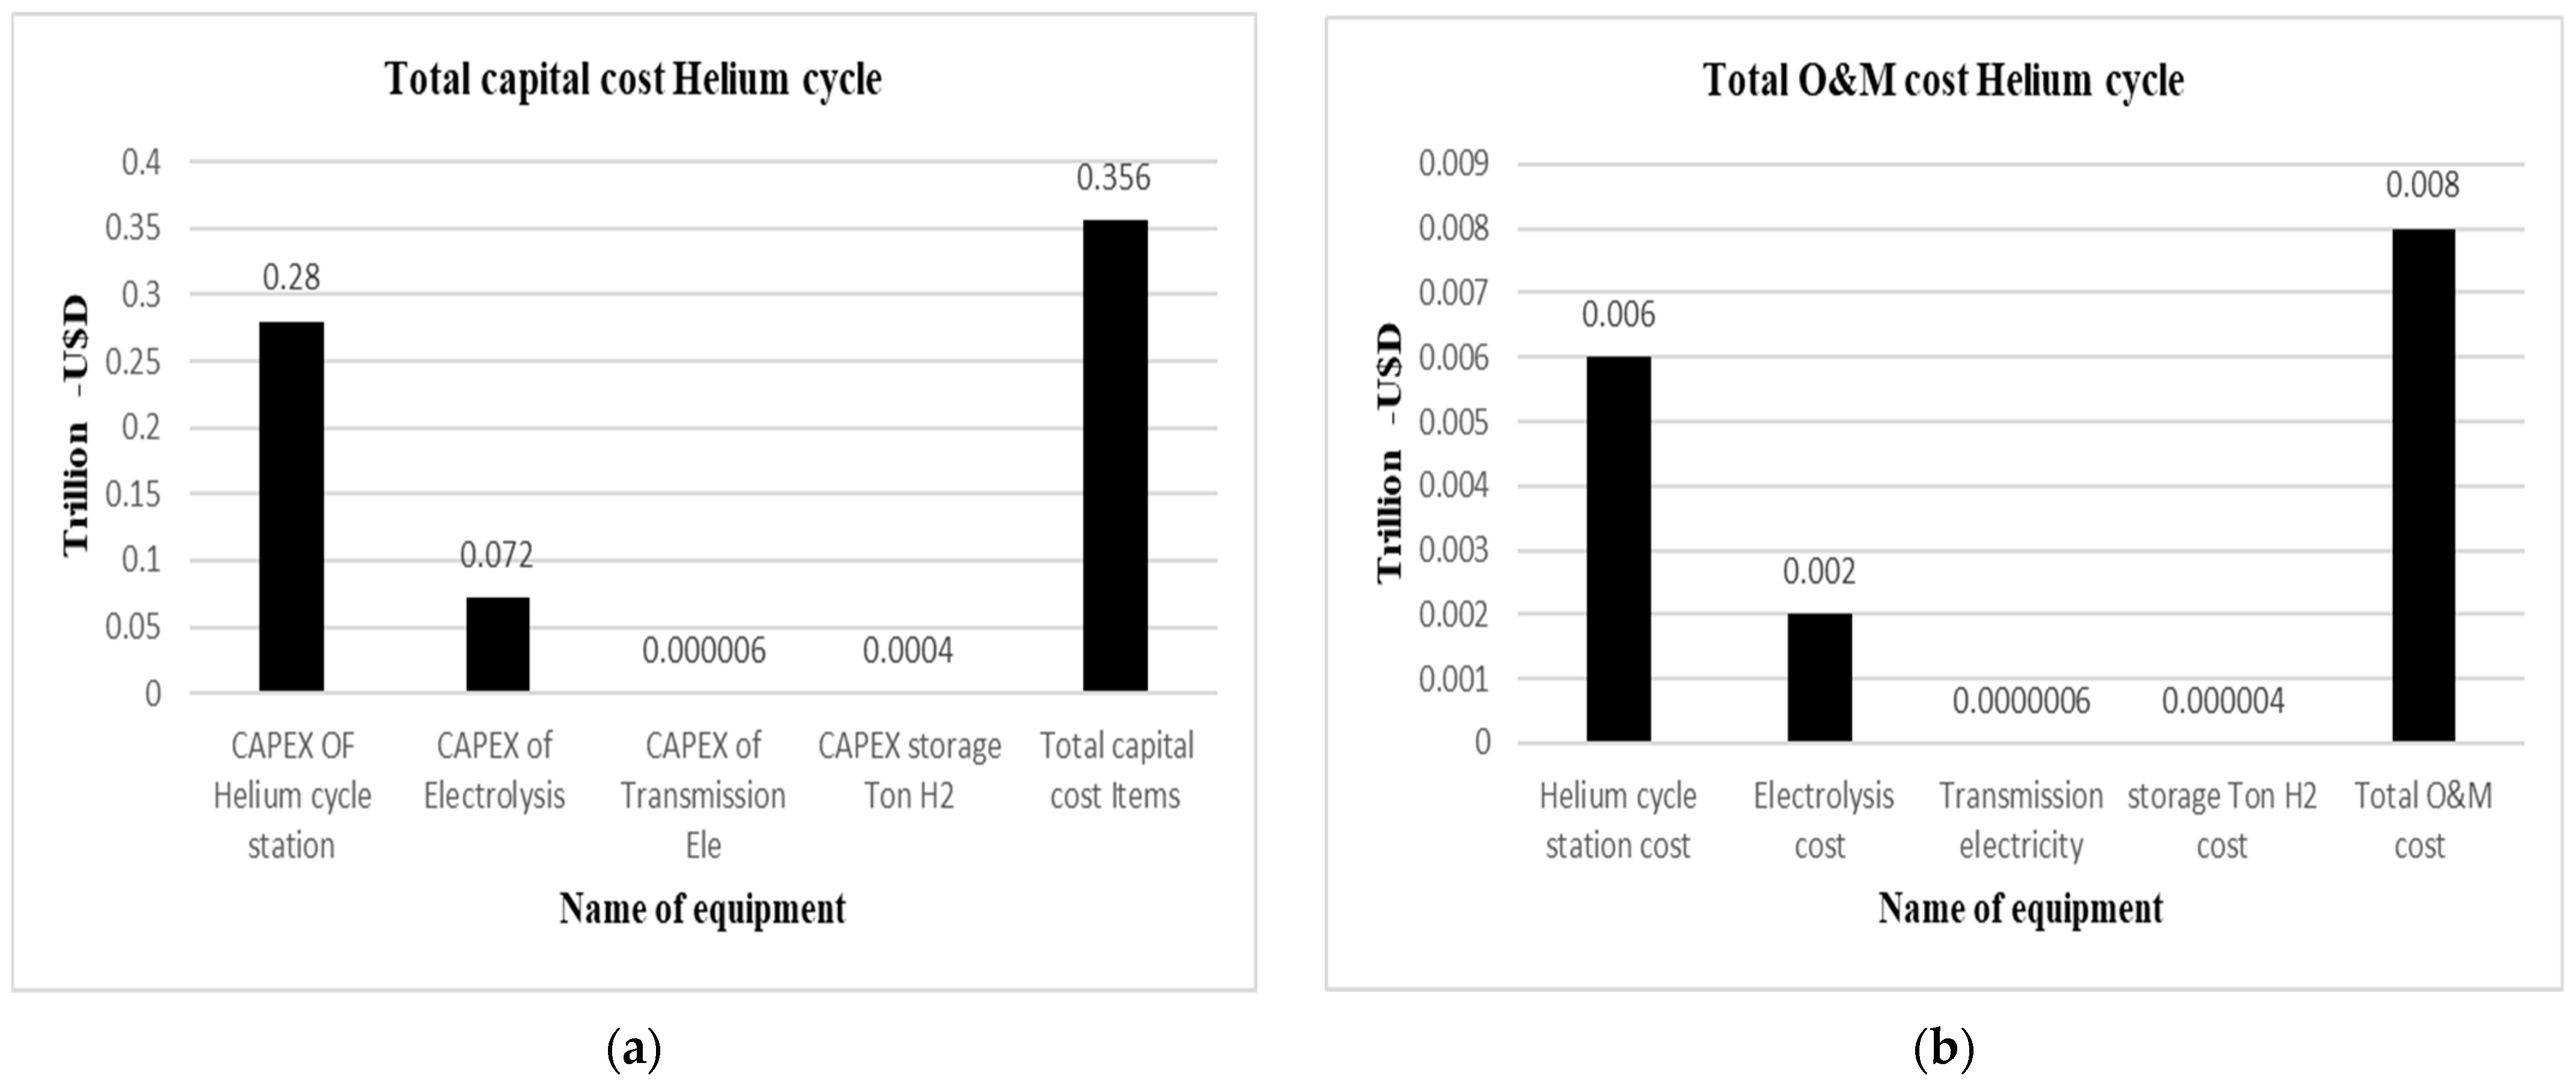
Examining the economic model for the helium cycle in terms of prospective energy exporting reveals a complex distribution of both capital expenditures and O&M costs. In terms of capital expenditures (CAPEX) for equipment, the helium cycle station receives 78% of the funds, totalling USD 0.28 trillion. This is calculated using a cost of USD 2182.25 per kilowatt (kW) and a production capacity of 130 GW from HeCCGTs [
41,
42]. Electrolysis requires 19.78% of the investment, a total of USD 0.072 trillion, computed from a capacity of 120 GW and the cost of one electrolysis unit. Transmission elements contribute a minor but crucial 0.0016%, equivalent to USD 0.000006 trillion, considering a 130 GW capacity and a cost of USD 46 per MWh [
34]. Storage of 1080 tonnes of hydrogen at USD 350 per kilogram incurs a cost of 0.011% or USD 0.0004 trillion [
38]. With an emphasis on building a robust infrastructure, the total capital cost for helium cycle equipment sums to USD 0.36 trillion.
Concerning ongoing O&M expenditures, precise allocations are made to ensure the helium cycle’s long-term efficiency. Helium cycle station maintenance costs are 1.6%, or USD 0.006 trillion, which is computed as 20% of the package cost. The upkeep of electrolysis units accounts for 0.60%, or USD 0.006 trillion, to ensure continued and effective operation. The transmission infrastructure upkeep is minor yet critical, at 0.000016% or USD 0.0000006 trillion [
34]. Storage for hydrogen maintenance makes up 0.0011%, amounting to USD 0.000004 trillion. In total, ongoing O&M costs for the helium cycle amount to USD 0.008 trillion, representing 2% of the overall financial commitment required to sustain operational efficiency.
Table 7 shows the national requirements in two scenarios: meeting demands, and using HeCCGTs to their full capacity and exporting 2100 PJ of hydrogen annually [
28].
5.1. Explanation of the Formulas and Values Used in Helium Closed-Cycle Gas Turbines
Table 8 gives an overview of the economic model for a helium cycle, with a focus on export. The capital costs include the helium cycle plant, electrolysis, gearbox infrastructure, and storage for 1080 tonnes of H
2. These charges add up to USD 0.35 trillion. On the operational side, the costs are distributed between the helium cycle station, electrolysis, transmission infrastructure, and H
2 storage, for a total O&M cost of USD 0.008 trillion. This summary allows for a rapid comparison of the main contributors, emphasising the helium cycle station’s significant impact on capital expenses and the cost of H
2 storage on operational costs.
In the economic model of the helium cycle for export, the total capital cost elements are distributed as follows: the helium cycle plant takes the lead, followed by electrolysis equipment, transportation equipment, and hydrogen cargo storage. Total capital cost components account for a major portion of the total capital cost.
The helium cycle plant has annual operation and maintenance costs, as well as charges for electrolysis equipment, transportation equipment, and hydrogen payload storage. The total cost of operation and maintenance contributes to the overall expense cycle.
Figure 4a,b present the capital expenditure (CAPEX) and O&M costs for all equipment required for the helium closed-cycle gas turbines. In general, the total capital cost of a helium cycle is high, which reflects the investment required to install and operate it. Note that in the economic model of the helium cycle, the H
2CCGTs were removed because there is no interruption in the energy supply, so no backup is required, unlike in the wind and solar farm projects.
5.2. Summary of Helium Cycle Economics
The helium cycle economic model requires significant initial investment, with a focus on constructing the helium cycle station. While ongoing O&M costs are lower, they are critical to sustaining the helium cycle infrastructure in the long term and maintaining an efficient performance. The balance between considerable initial investments and ongoing maintenance emphasises the helium cycle system’s economic viability and long-term sustainability in terms of prospective exports.
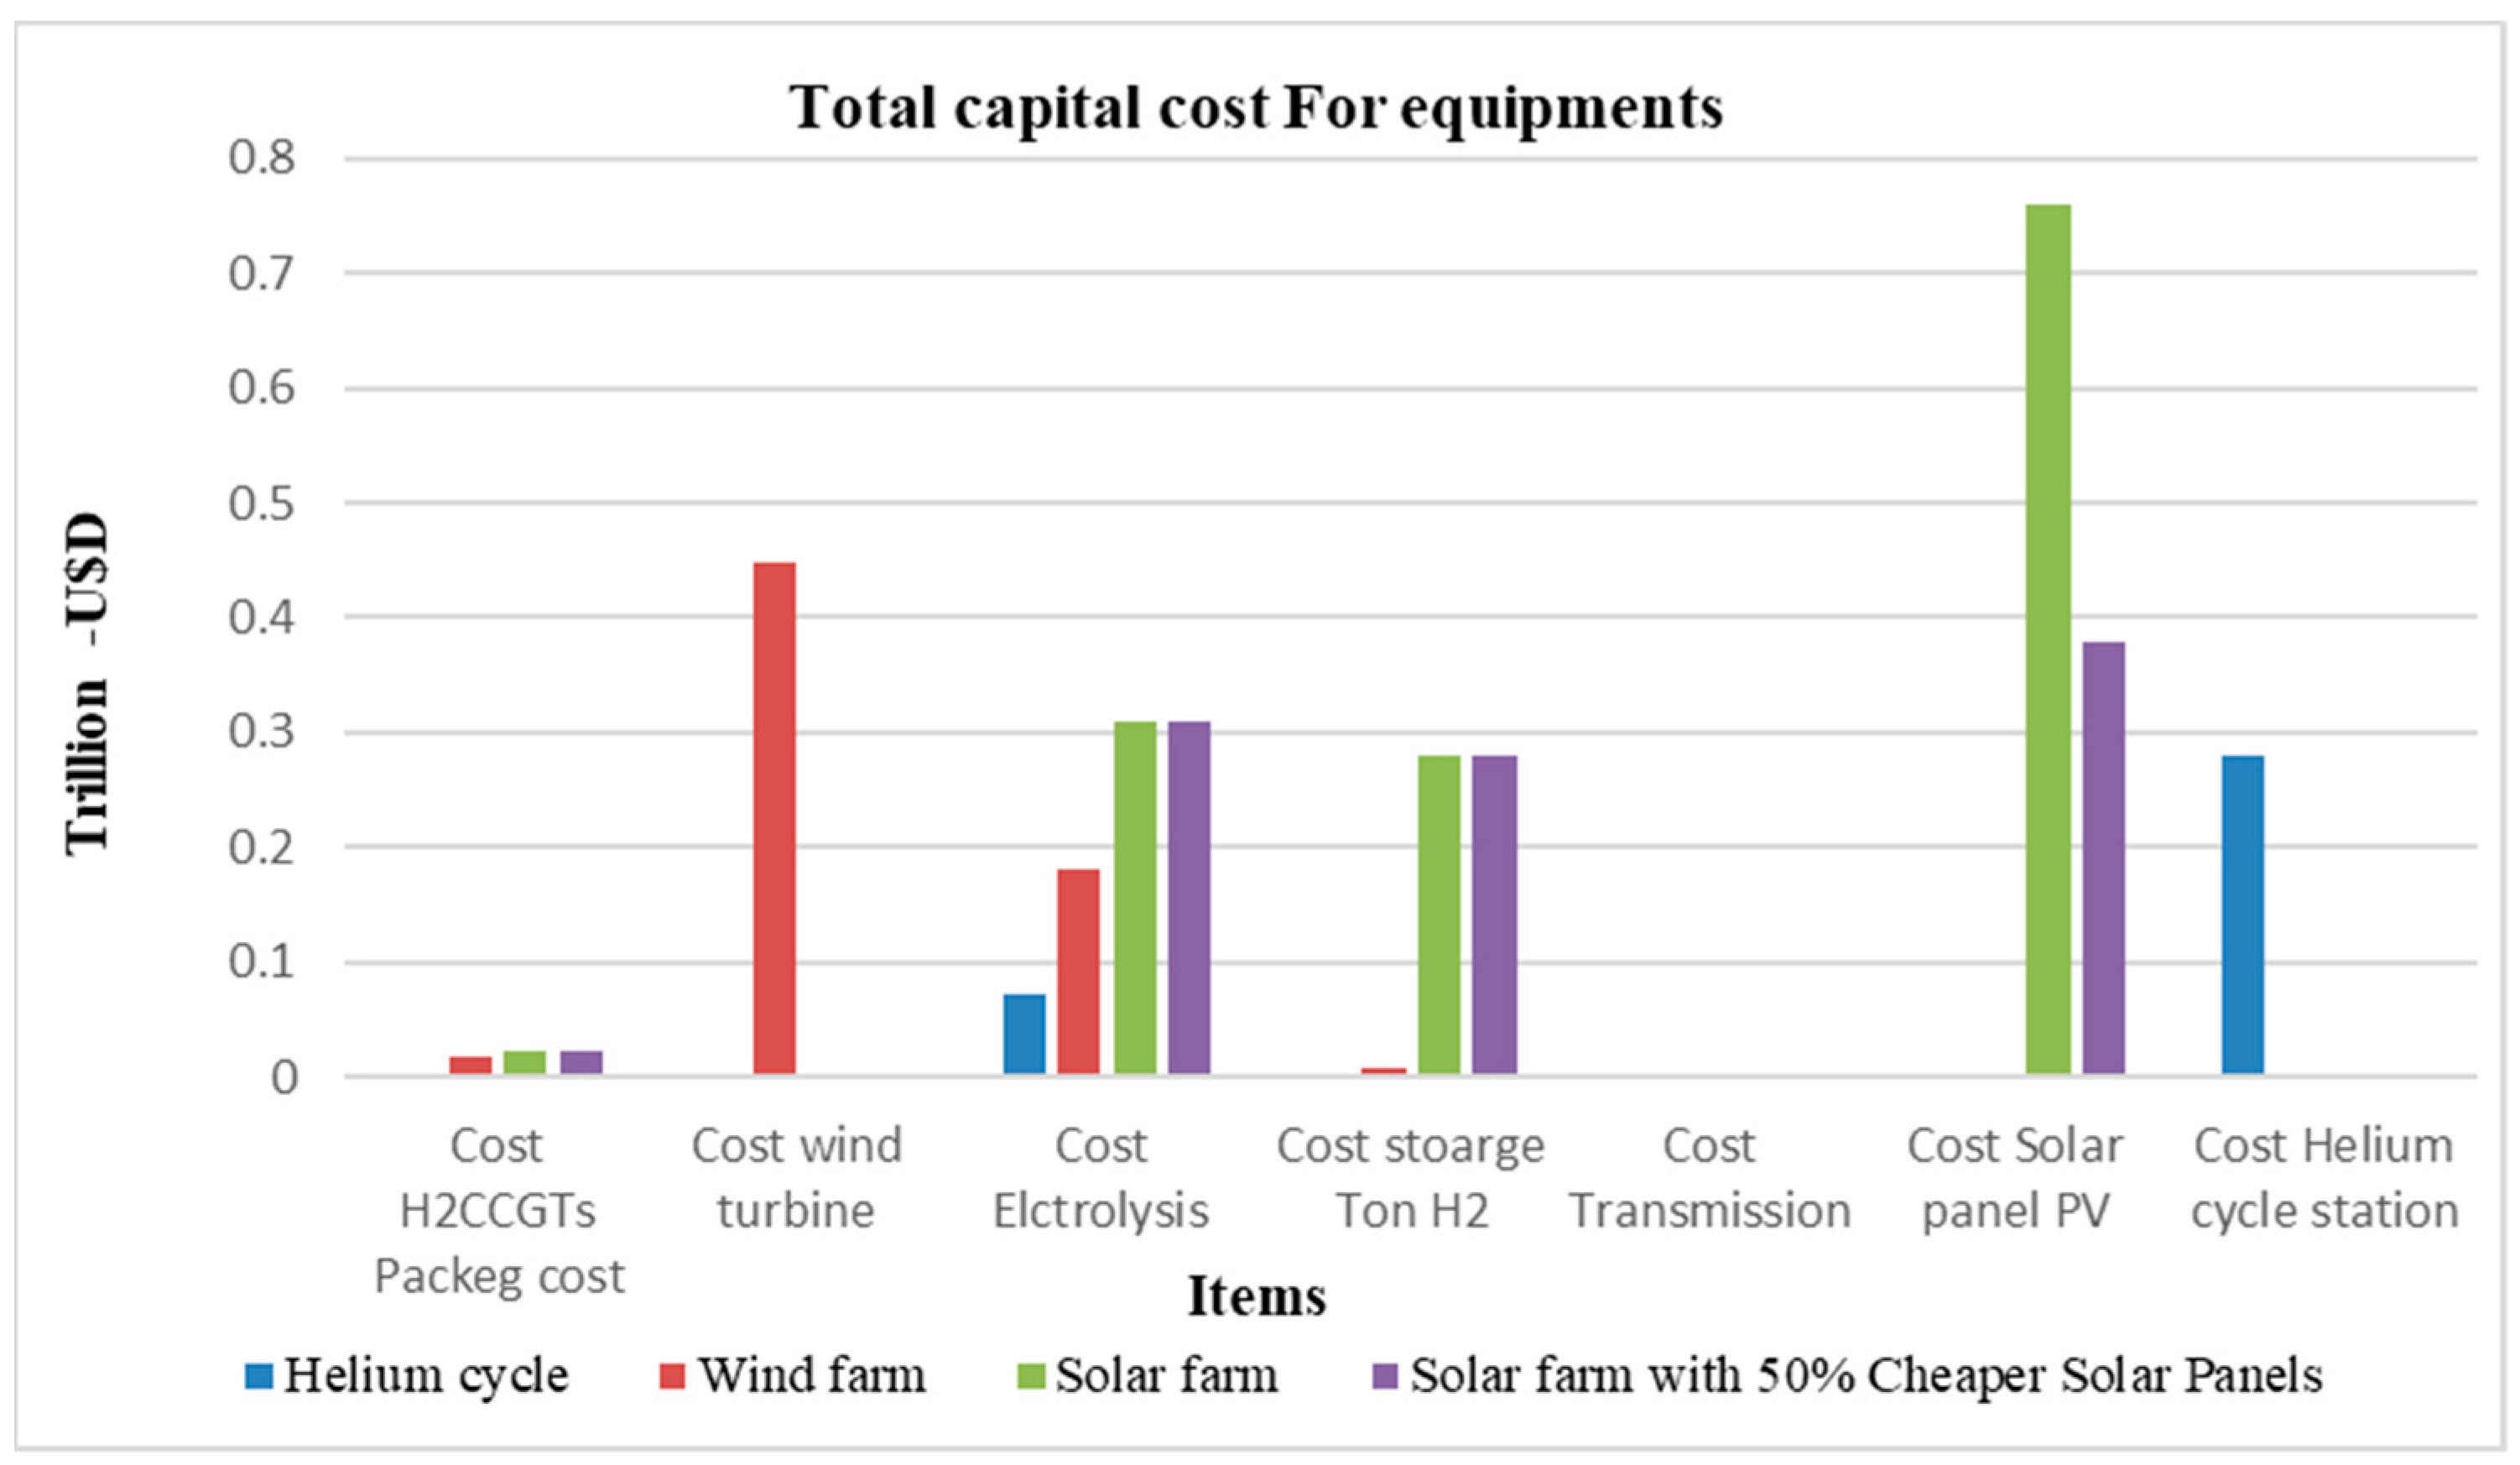
6. Comparative Analysis of Total Capital Costs for Solar, Wind, and Helium
Figure 5a–d present the fluctuations in electricity supply and demand across the four seasonal periods—winter, spring, summer, and autumn—and show the contributions from solar energy, wind energy, HeCCGTs, and H
2CCGTs.
Solar energy generation peaks around midday throughout the year, but this is especially true in the spring and summer. Nonetheless, due to the intrinsic constraint of solar energy supply to daylight hours, there are unavoidable output deficits during the night and early morning. Wind energy generation is equally influenced by both the season and time of day. During the winter, wind velocity begins the day at an elevated level and progressively decreases over the day. In contrast, the summer season is distinguished by a less dependable contribution from wind energy, particularly at midday, when solar energy output is highest. This variance means supplementary systems such as H2CCGTs and HeCCGTs are required to be consistently available to supply approximately 120 GW of power throughout the diurnal cycle, independent of seasonal variations, and are indispensable for mitigating deficiencies in solar and wind energy generation.
In the event of insufficient solar or wind power, the H2CCGTs are activated and can generate a cumulative output of 600 GW of power, with each turbine providing 500 MW. These turbines are fuelled by hydrogen produced during periods of excess renewable energy generation. This stored hydrogen is subsequently employed to produce electricity during periods of reduced renewable energy output, thus contributing to the stabilisation of the electrical grid and ensuring the continuous fulfilment of energy requirements under suboptimal natural conditions for solar or wind energy generation.
This paper now examines the balance between innovation and established technology. The solar and wind farms rely on proven technologies such as PVs and wind turbines, whereas the HeCCGT employs groundbreaking helium-based techniques. This juxtaposition demonstrates the rapid evolution of the renewable energy sector, with the HeCCGT delivering novel solutions that push the boundaries of existing technology.
Financial commitments appear as a critical factor with the solar farm, requiring the greatest expenditure due to its significant use of solar energy. The HeCCGT follows closely, indicating that a strategic investment is required in helium-based developments, whereas the wind farm has the lowest financial commitment. These differences highlight the complex decision-making processes and priorities connected with each of these renewable energy projects.
In conclusion, this analysis provides a multifaceted perspective on the financial and technological landscapes of solar, wind, and helium cycle farms, as shown in
Figure 6. It sheds light on the intricate considerations and priorities that shape the development of sustainable and efficient energy solutions, contributing valuable insights for stakeholders and decision-makers in the renewable energy sector.
7. Discussion on the Major Cost Components
Examining the key cost components of the solar and wind farms and HeCCGT provides useful information about the allocation of financial resources in each renewable energy model. The solar farm analysis presents a holistic plan for solar energy generation. It requires a major investment in PV technology with a clear diversification of the remaining investment, spread over electrolysis, the H
2CCGT package, hydrogen storage, and gearbox elements. In parallel, the wind farm model invests most capital in wind turbines, and the remaining investment is spread in a balanced manner over electrolysis, the H
2CCGT package, and hydrogen storage. The HeCCGT, which focusses solely on helium-based technologies, places the emphasis on the helium cycle station as the major cost component, with the remaining investment spread in a balanced manner over electrolysis, hydrogen storage, and gearbox elements. These observations shed light on the distinct investment goals and strategic approaches to each renewable energy type.
Figure 7 presents the overall costs of the three projects.
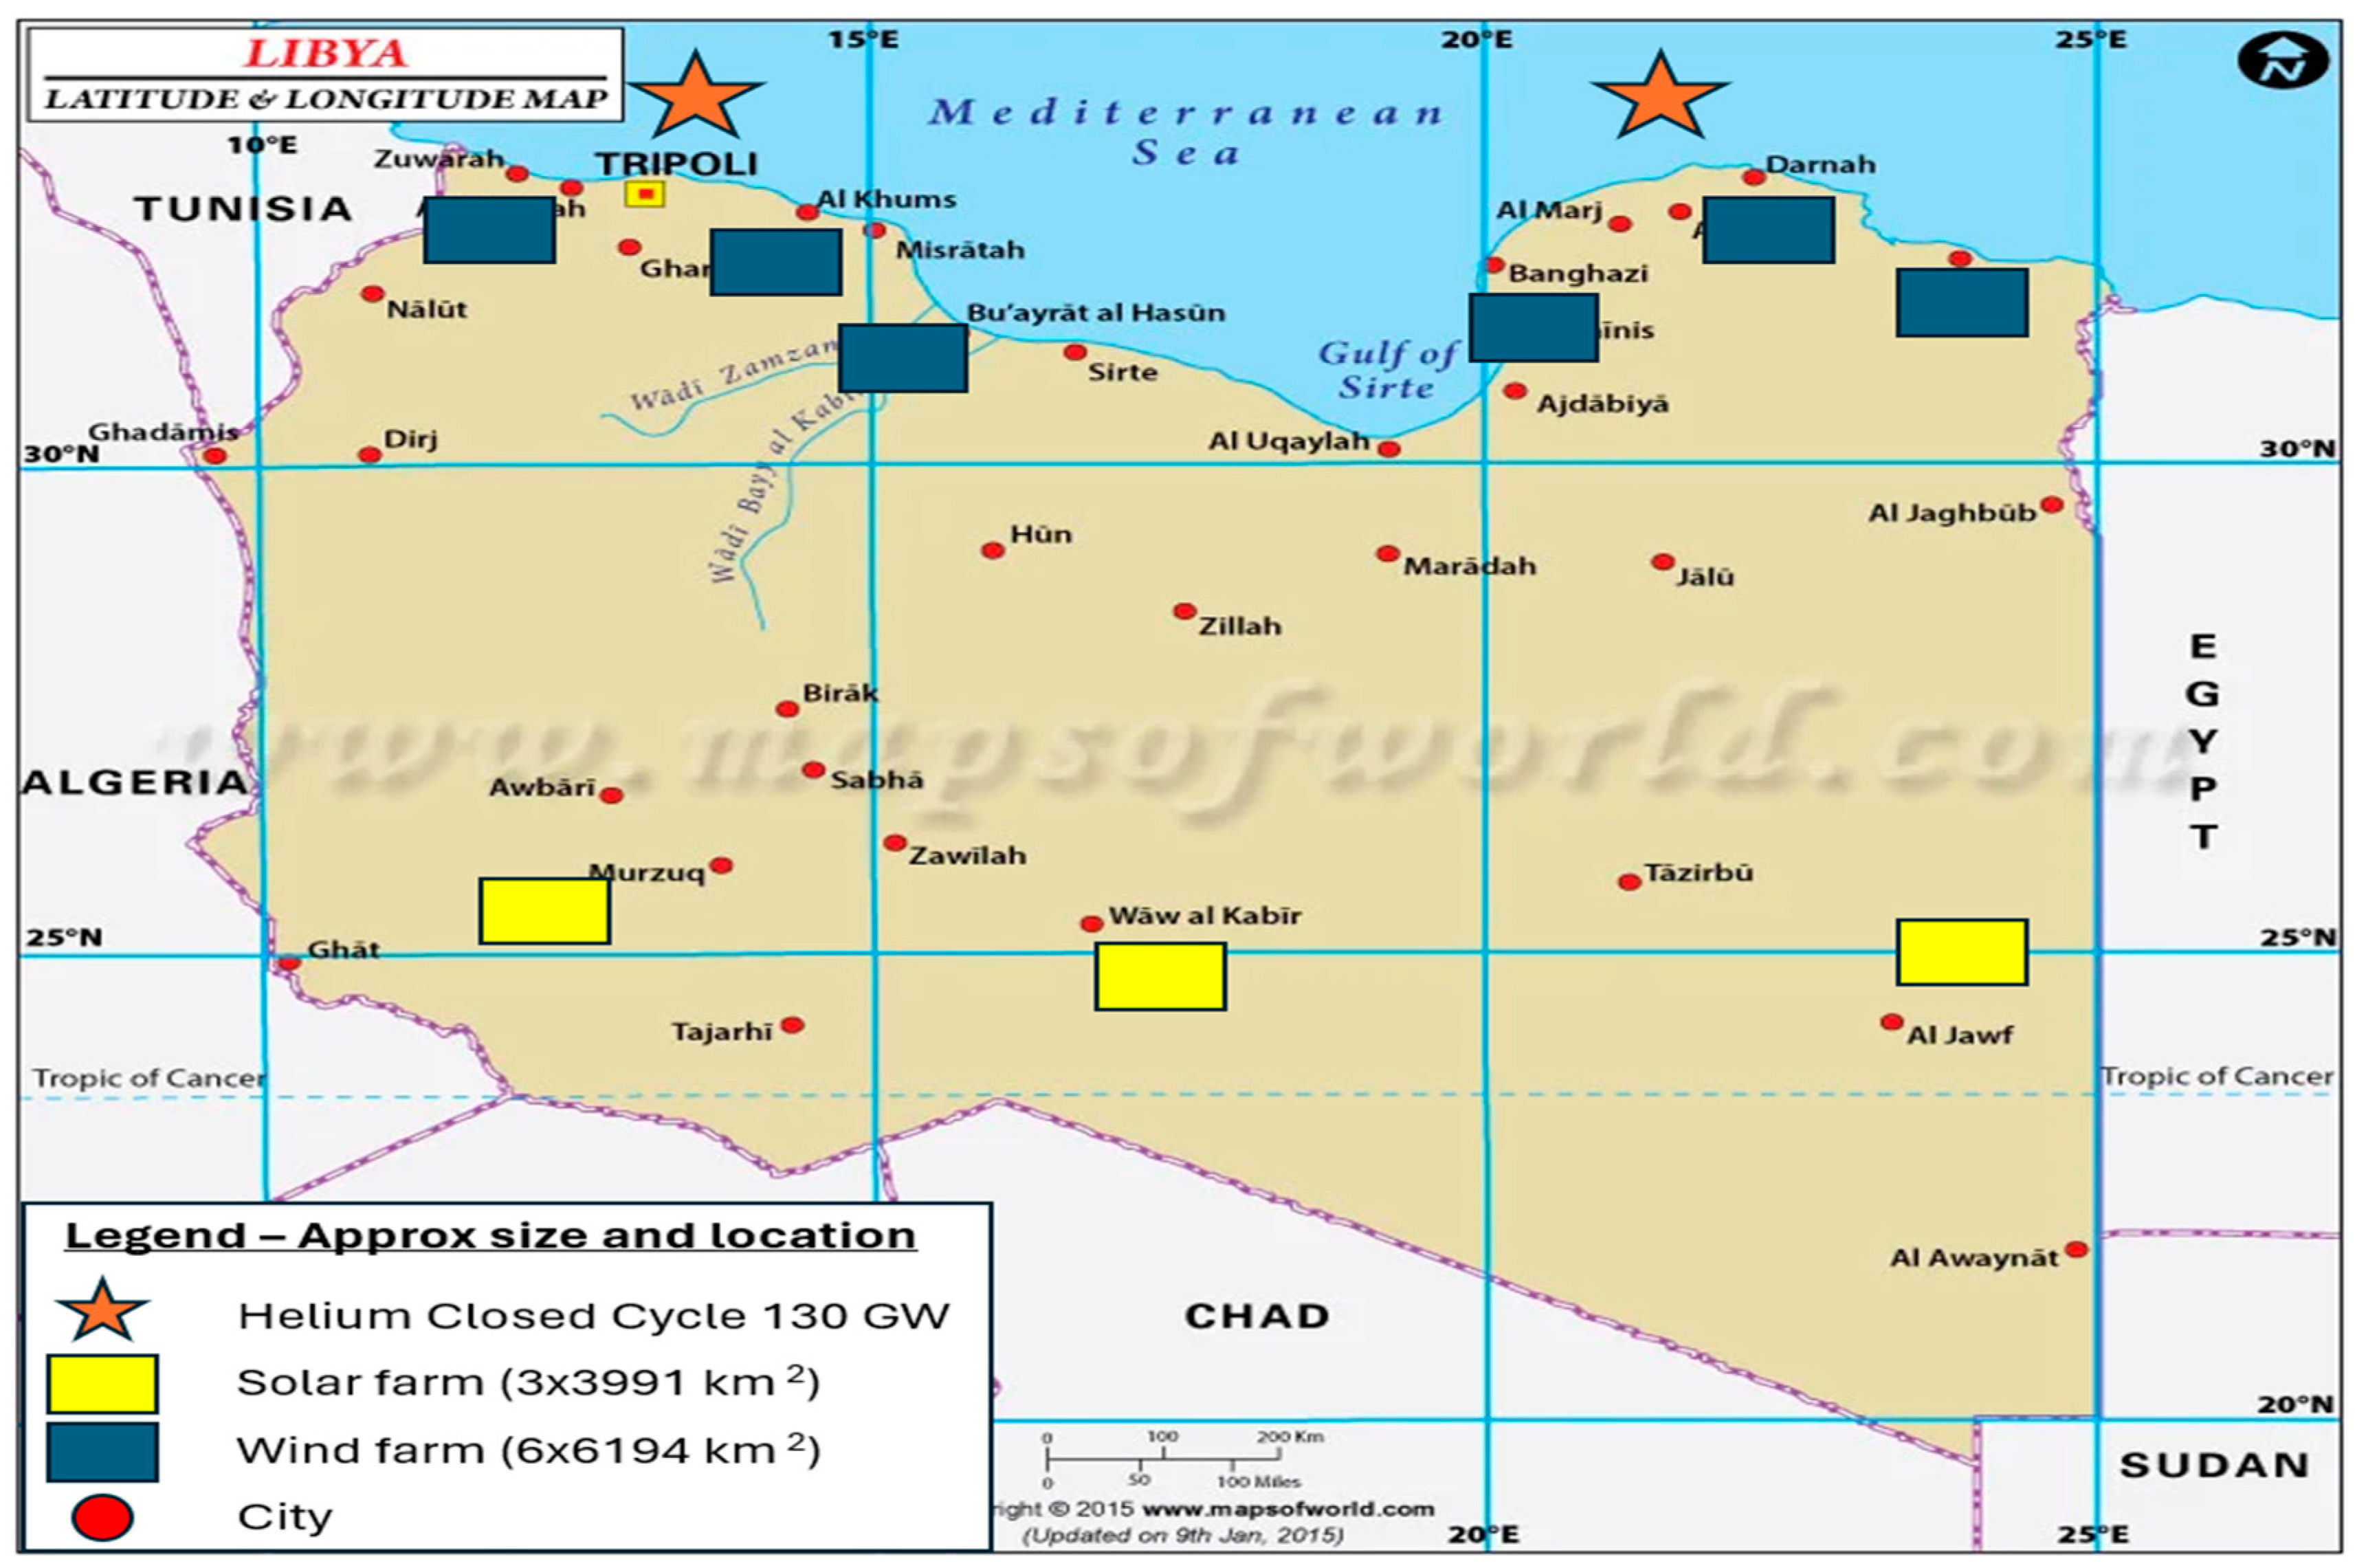
8. Site Selection
The geographical locations of solar farms are in the south of Libya, closer to the equator, allowing for greater illumination and more productive use. Meanwhile, wind farms are in the north of the country as these locations receive more wind than Libya’s southern arid regions. It will be advantageous to locate the hydrogen network near the coast, assuming that seawater will be used for electrolysis. Libya’s coastline, which stretches for 2000 kilometres, provided ideal areas for deploying underwater helium turbines within the country’s territorial seas. The sites are shown in
Figure 8.
Due to the scarcity (or poor geographical distribution) of fresh water, electrolysers, H2CCGT complexes, and storage farms should be located close to the coast, which will also reduce hydrogen transport. In this scenario, the electric grid would be disseminated throughout the country, and the hydrogen grid would be concentrated around the Mediterranean shore.
Clustering the hydrogen infrastructure in hydrogen farms along the Mediterranean coast makes sense to benefit from economies of scale and integration, while also reducing hydrogen transportation costs to Tripoli and Benghazi, where most of the demand is concentrated. These cities also host the country’s main airports, which will be the greatest single users of liquid hydrogen, with aviation accounting for 28% of hydrogen demand. These hydrogen farms will include electrolysers, if approved, a desalination plant, H2CCGTs, storage facilities, and a liquefaction plant where appropriate. This research concludes that two hydrogen farms with an area of 270 km2 each would meet domestic demand and export requirement.
In these three scenarios, the assumptions were as follows: We would utilise solar farms to their full potential [
26]. In the wind energy scenario, the expectation was that this green hydrogen electrical network would meet the country’s demand in the summer [
27]. On the other hand, the premise regarding helium turbine plants was that we would use winter as the basis because it has the highest energy demand [
28].
9. Implications for Decision-Makers
The comparative analysis of a solar farm, wind farm, and HeCCGT offers valuable insights for decision-makers in the energy sector. This information can guide the implementation of diverse solutions for energy portfolios, allowing decision-makers to balance the strengths and weaknesses of each model. Leveraging a mix of established technologies in solar and wind alongside innovative helium-based solutions provides resilience and reliability in energy generation [
43].
Understanding technological maturity and levels of innovation is crucial for decision-makers to formulate effective adoption strategies. Established technologies in solar and wind offer stable, proven solutions, while helium-based technologies introduce potential long-term advantages [
44]. This knowledge aids in risk mitigation by diversifying, which lowers the reliance on specific resources, and aligning energy strategies with sustainability goals [
45].
This report also highlights economic development opportunities, with wind farms showing the promise for considerable local economic growth and employment creation. Decision-makers can integrate the energy strategy with regional economic objectives, thereby promoting job creation and community development. Financial planning is simplified since insights into upfront capital investments and ongoing operating costs for each model enable decision-makers to deploy resources more efficiently.
For decision-makers who want to reduce greenhouse gas emissions, the findings provide insights into renewable energy sources with lower environmental impacts. Policymakers can use these data to develop informed energy policies that promote a balanced mix of renewable energy sources. Regulatory frameworks can incentivise the use of technologies consistent with the overall sustainability aims.
The versatility and scalability of each model are underlined, allowing decision-makers to respond to changing energy demands and efficiently manage energy resources based on local needs. Community participation is prioritised, and we emphasise the necessity of addressing concerns about visual and acoustic impacts to establish strong connections with local people.
In conclusion, decision-makers can make informed choices by considering the unique implications of each renewable energy model. This analysis provides a foundation for crafting comprehensive and resilient energy strategies that address environmental, economic, and technological dimensions, ensuring a sustainable and efficient energy future.
10. Conclusions
This study has provided a detailed comparative analysis of decarbonisation strategies using solar, wind, and helium closed-cycle gas turbine technologies. Each option was analysed individually to assess its economic feasibility and contribution to decarbonising an oil-exporting country. The economic models offer insights into the capital and operational costs of two renewable technologies and one novel technology, revealing that solar farms demand the largest capital investment, followed by wind and then HeCCGTs.
An important finding of this study is that while solar energy requires higher investment, it occupies a smaller surface area compared to that required for wind farms because of Libya’s abundant sunlight. Note that the analysis did not include land costs, as public land is assumed to be free for development, although this might not be the case in other countries. In contrast, wind energy requires fewer installations, has higher utilisation rates, and thus needs fewer backup systems (such as H2CCGT) with reduced hydrogen storage.
Despite the higher initial costs, solar energy has tremendous potential for cost reduction through technology breakthroughs, and we project a possible 50% reduction in solar panel costs. Wind energy has lower capital requirements but high utilisation rates. HeCCGTs, despite their lower initial investment, serve a key role in ensuring energy stability by effectively balancing supply and demand.
This research presents both short-term and long-term financial factors for decision-makers to consider, emphasising the relevance of strategic investments in lowering carbon emissions and achieving energy independence. The helium cycles’ high power density and utilisation rates make them an attractive option for future investments. This study advocates for hybrid energy portfolios that combine solar, wind, and HeCCGT technologies to optimise economic viability and sustainability, leveraging the complementary strengths of each system.
This study is unique in offering detailed economic values for the process of decarbonising an oil-exporting country such as Libya. It is one of the first to assess the prices and feasibility of solar, wind, and HeCCGTs as independent options, providing vital guidance for policymakers seeking to attain national energy independence while also meeting global carbon reduction targets.
Future studies should investigate hybrid energy systems that combine various technologies for their potential to improve economic and environmental outcomes. Incorporating real-world variables like land pricing and infrastructural requirements would also provide more realistic insights about larger applications.


