
Article

Microbiome Taxonomic and Functional Differences in C3H/HeJ Mice Fed a Long-Term High-Fat Diet with Casein Protein ± Ammonium Hydroxide Supplementation

by
Brayan Montoya-Torres
1,†,
Amandeep Kaur
2,†,
Benjamin Barr
3,
Emily Garrison
2,
Mindy M. Brashears
1,
Amanda M. V. Brown
2 and
Lauren S. Gollahon
2,4,*
1
International Center for Food Industry Excellence (ICFIE), Department of Animal and Food Sciences, Texas Tech University, 2500 Broadway, Lubbock, TX 79409, USA
2
Department of Biological Sciences, Texas Tech University, 2500 Broadway, Lubbock, TX 79409, USA
3
Department of Kinesiology and Sport Management, 2500 Broadway, Lubbock, TX 79409, USA
4
Center of Excellence in Obesity and Cardiometabolic Research (COCR), Texas Tech University, 2500 Broadway, Lubbock, TX 79409, USA
*
Author to whom correspondence should be addressed.
These authors contributed equally to this work.
Dietetics 2026, 5(1), 13; https://doi.org/10.3390/dietetics5010013
Submission received: 19 November 2025 / Revised: 26 January 2026 / Accepted: 10 February 2026 / Published: 26 February 2026

Abstract

(1) Background: Acidogenic Western-style diets disrupt gut bacteria promoting obesity-related diseases. Here, we investigated whether long-term feeding of alkalinized dietary casein as a protein source (ammonium hydroxide enhancement, AHE) modulates microbiome structure/functions under high-fat conditions, and normal diets, and whether these responses are sex-dimorphic. (2) Methods: C3H/HeJ mice (N = 256; equal sex distribution) received either control casein (CC), AHE casein (CCN), high-fat casein (HFC), or AHE high-fat casein (HFCN) diets from 6 to 18 months. Body mass and survival were tracked; fecal samples collected at 16 months were sequenced and underwent shotgun metagenomics. (3) Results: Diet and sex jointly shaped host metrics. AHE diets taxonomically showed an abundance of Verrucomicrobiota phyla predominating in most cohorts, notably Akkermansia muciniphila. Within Pseudomonadota, Christensenella was identified, along with other taxa associated with beneficial health outcomes, including Lactococcus lactis, Lactococcus cremoris, Pediococcus acidilactici, and families Lachnospiraceae/Oscillospiraceae. Additionally, sex- and diet-dependent advantageous enriched functions associated with AHE that enhanced electron transport, B-vitamin cofactor pathways, and mucosal/redox support were observed. (4) Conclusions: In the long term, pH-directed protein chemistry is a tractable lever for gut ecology during high-fat feeding, enriching and promoting the balance of beneficial taxa, providing a mechanistic bridge between dietary acid load and microbiome remodeling.

1. Introduction

The prevalence of obesity and diet-induced obesity (DIO) has risen to epidemic levels worldwide [1]. According to reports by the World Health Organization (WHO), by 2024, over one billion individuals globally are classified as obese, comprising 650 million adults, 340 million adolescents, and 39 million children. Additionally, it was estimated that by the year 2025, approximately 167 million adults and children are expected to experience deteriorated health due to being overweight or obese [2]. Obesity is defined as a multifactorial disorder and a chronic disease characterized by the abnormal or excessive accumulation of body fat [3]. Obesity is a complex condition influenced by dietary composition, total energy intake, lifestyle, and metabolic factors; however, high-fat diets (HFDs) are widely used in experimental models to induce obesity and associated metabolic dysfunction [4]. Moreover, HFDs are considered a major risk factor for a range of metabolism-related diseases, including type 2 diabetes mellitus (T2DM), chronic kidney disease (CKD), cardiovascular disease (CVD), certain types of cancers, and metabolic syndrome (MetS), conditions that are observed in both humans and mice [3]. It has also been reported that HFD-fed mouse models rapidly remodel gut microbial structure and function, perturb barrier integrity, and promote low-grade inflammation that contributes to the pathologies described above, similar to those observed in humans [4,5].
The Western diet is characterized by high intakes of saturated fats, refined grains, salt, and alcohol, with protein sources commonly derived from animal products, including both processed and unprocessed meats, and a low intake of fiber-rich fruits and vegetables [6]. This dietary pattern is closely linked to obesity and other metabolic-related diseases [7]. These adverse outcomes are associated with low-grade metabolic acidosis resulting from an increased intake of animal-derived proteins and processed foods, which elevates the potential renal acid load (PRAL), while insufficient consumption of alkalinizing fruits and vegetables occurs [8,9,10]. In fact, increasing attention has been directed towards “alkalinized” foods for their potential to mitigate the acidogenic effects of the “Western Diet” [11,12,13,14,15,16,17]. Further supporting this evidence, recent studies examined whether a “humanized” HFD consisting of beef or casein as dietary proteins, with beef tallow as the dietary fat component, would more closely reflect the chronic human conditions of diabesity [18,19], and cancer development [20,21]. Furthermore, considering the acid load in Western diets, and the effects of adjusting the pH of dietary beef and casein protein through ammoniation [12,18,21], an industrially applied process approved by the USDA, were investigated to determine if it reduced the pathological effects of the acidogenic Western diet when administered to mice on a high-fat diet [9]. Results showed that ammoniation of the dietary proteins in these “humanized” murine diets could provide significant translational insights into the effects of macronutrients on metabolism and disease outcomes under HFD conditions, and they could be beneficially modulated to reduce progression of metabolic-associated liver disease over time [22,23,24].
Prior research demonstrated that diets incorporating ammoniated casein or beef effectively mitigated key morbidities associated with HFD by delaying tumor onset, reducing the progression of liver disease, preserving lean mass during weight gain, and extending lifespan, with significant differences observed between sexes [21]. Considering these results, the outcomes raised critical questions: What is the impact of ammonium hydroxide-enhanced dietary proteins on the composition and functional potential of the mouse’s gut microbiome? Moreover, do these effects vary by sex and age in microbiome terms?
To fill these gaps and complement the systemic outcomes from the Barr et al. [21] study, a next-phase study by Garrison et al. [12] demonstrated that long-term feeding of ammonium-supplemented beef protein to high-fat diet (HFD) mice significantly altered gut microbiome composition, increasing beneficial bacterial taxa such as Romboutsia, members of the Oscillospiraceae family, Lactococcus cremoris, and the mucin-degrading bacterium Akkermansia muciniphila, which was especially predominant in females [12]. Concurrently, a reduction was observed in potentially less favorable phyla, including Actinomycetota (Actinobacteria) and Bacteroidota (Bacteroidetes). Garrison et al. [12] also described sex as a confounding factor affecting microbiome responses. Functional analyses demonstrated significant improvements in microbial metabolic pathways, such as glycine betaine transport, xenobiotic detoxification, and defense-related functions [12]. These findings suggest that a simple modification of protein pH with ammonium hydroxide in an HFD can promote beneficial shifts in the mouse gut microbiome, revealing significant differences in advantageous bacterial species and exhibiting a sexually dimorphic response to the microbiome under acidogenic Western diet conditions.
Importantly, sex is a critical biological confounding variable in these diet-microbe-host interactions. Multiple studies have demonstrated sex-dependent responses to HFD at the levels of microbial composition, intestinal barrier function, adipose tissue inflammation, and metabolic outcomes [25,26,27,28]. Notably, some studies even report that sex differences persist following broad microbiome depletion, underscoring the need to evaluate dietary interventions within a sex-specific framework in long-term studies. Another unanswered question is whether there is a benefit to an alkalized diet (by ammonium hydroxide enhancement or AHE) under normal fat content conditions or if this effect is only significant under HFD conditions.
In view of this evidence and our previous findings with ammoniated proteins in a high-fat diet, we hypothesized that AHE of dietary casein protein will promote beneficial alterations in gut microbiota composition and functions primarily in high-fat diets, as the elevated potential renal acid load (PRAL) associated with these diets creates conditions where protein alkalinization provides a measurable advantage. In contrast, under normal-fat diet conditions, where PRAL remains low, no significant benefits to the microbiome are expected. To test this hypothesis, diets were formulated as follows: a control casein diet (CC), an ammoniated casein diet (CCN), a high-fat casein diet (HFC), and an ammoniated high-fat casein diet (HFCN). Furthermore, we predicted that responses would be sexually dimorphic, with females demonstrating a greater benefit to dietary protein ammoniation. To our knowledge, this is the first study to investigate this research question within a microbiome framework, thereby filling a critical gap in the current literature, making our study unique for the following features: (i) A humanized diet design to better reflect human macronutrient sources and simulate their metabolic process responses, (ii) A long-term protocol with a snapshot at a 16-month sampling point to capture the combined effects of aging, sex, and ammoniated protein on gut microbiota via shotgun metagenomics approaches, and, (iii) comparison of normal diet vs. high-fat diet and the benefits of protein modification by ammonium hydroxide. Following this design, sequencing output, assembly characteristics, and gene annotations were used to confirm data quality for downstream investigations. Subsequently, taxonomic profiles were then generated at the bacterial phylum level and refined to lower classifications within the assembled bins. To further assess the dietary effects, statistical analysis was conducted to compare the abundance of bacterial taxa among aged mice fed control fat and high-fat diets containing casein protein with or without ammonium supplementation. Notably, mice fed ammonium-supplemented diets exhibited significant taxonomic and functional alterations in their gut microbiota compared to those on unsupplemented controls. This framework links diet chemistry, specifically protein ammoniation, to microbiome taxonomic and functional adaptations, allowing us to evaluate whether such microbial shifts correspond with the systemic health benefits previously associated with HFD intervention settings.

2. Materials and Methods

2.1. Mouse Study Design

The mice used in the present study were part of a broader study conducted under Texas Tech University’s IACUC protocol 19021-02 (approval date, 12 February 2019). For the study, C3H/HeJ mice (Mus musculus) developed by Jackson Laboratories (JAX stock #000659, Bar Harbor, ME, USA) were used. At all times, mouse care and handling were followed as per the protocol. The C3H/HeJ strain was selected as a robust, generic strain, without modification for disease susceptibility or resistance, and is commonly used in studies of cancer, inflammation, immunology, and cardiovascular disease. This study included 256 C3H/HeJ mice (128 females and 128 males) housed in cages containing four mice per cage, per diet type, and per sex. Mice arrived at 4 weeks old, were acclimated for 2 weeks, and at 6 weeks, their respective diets were started with equal numbers of male and female mice randomly assigned to an AHE casein diet (CCN), an unsupplemented casein diet (CC) (served as control), an AHE high-fat casein diet (HFCN), or an unsupplemented, high-fat casein diet (HFC). Mice were maintained on this diet for the duration of the study, and fecal material was collected at 16 months for microbiome analysis. Sixteen months was selected as the time point for fecal sampling and microbiome analysis to maintain n = 8 mice per diet per sex, as individual viability decreased significantly approaching the 18-month mark, and it was unknown whether the sample size would become too low. Dietary macromolecular distribution as kcal% was 18% protein, 46% fat, and 36% carbohydrates, with total dietary components and formulations listed in Table 1. Mice were housed in a ventilated cage with a 12 h light/dark cycle at 22–23 °C and 70% humidity with ad b access to water and their respective diets. Their weight and food intake were measured on a weekly basis. At the end of the dietary intervention period (18 months for that study), mice were fasted for 1 h prior to euthanasia. This was a next-phase study, building on previous research [12,21,29,30] conducted by Dr. Gollahon’s lab in the Department of Biological Sciences at Texas Tech University.

2.2. Diet Preparation and Composition

Diets were prepared by Research Diets, Inc. (New Brunswick, NJ, USA) using casein supplied by Empirical Foods, Inc. (North Sioux, SD, USA). Ammonium hydroxide was added to a casein protein powder product for the supplemented diet to achieve a pH of ~9.5. The mixture was then freeze-dried and sent to Research Diets Inc. for final preparation as mouse chow. For the unsupplemented diet, casein protein was prepared and freeze-dried in the same manner, without the addition of ammonium hydroxide. At this point, the remaining dietary components were added, resulting in a total casein content of ~17% by weight for the control fat diets and 20% for the high-fat diets. The overall protein, carbohydrate, and fat compositions were equal between diets. Micronutrients and nutritional analysis were conducted by Eurofins Scientific Inc. (Des Moines, IA, USA). All diets were provided in a dry, compressed, pelleted form, with a firm and uniform texture typical of purified rodent chows, and no visible differences in hardness or integrity between diet groups. The AHE casein reference diet is hereafter denoted CCN; the casein reference diet without supplementation is denoted CC. The AHE high-fat casein diet is hereafter denoted HFCN, and the control high-fat casein diet (no supplementation) is denoted as HFC. The final pH of each diet was determined by homogenizing food pellets in Milli-Q® water, followed by pH measurement in triplicate using a benchtop pH meter. Diets differed in their final pH levels, with the CCN at approximately pH 8.17, the CC at approximately pH 7.29, the HFCN at approximately pH 8.02, and the HFC at approximately pH 7.09. In all other aspects, the diets were compositionally similar [21,29]. Following preparation, diets were sealed by the manufacturer and stored at −20 °C until use. Using standard metabolizable energy factors (protein = 4 kcal/g, carbohydrate = 4 kcal/g, fat = 9 kcal/g) and the kcal% shown, the estimated energy density is approximately 4.26 kcal/g for the CC/CCN diets (containing 18% protein, 71% carbohydrate, and 11% fat) and about 5.37 kcal/g for the HFC/HFCN diets (composed of 18% protein, 36% carbohydrate, and 46% fat). Ingredients and components used in formulating these diets are detailed in Table 1. These same conditions were applied by Garrison et al. [12] with beef as DPS and in studies by Barr and Gollahon, [21,29].

2.3. Mouse Metrics

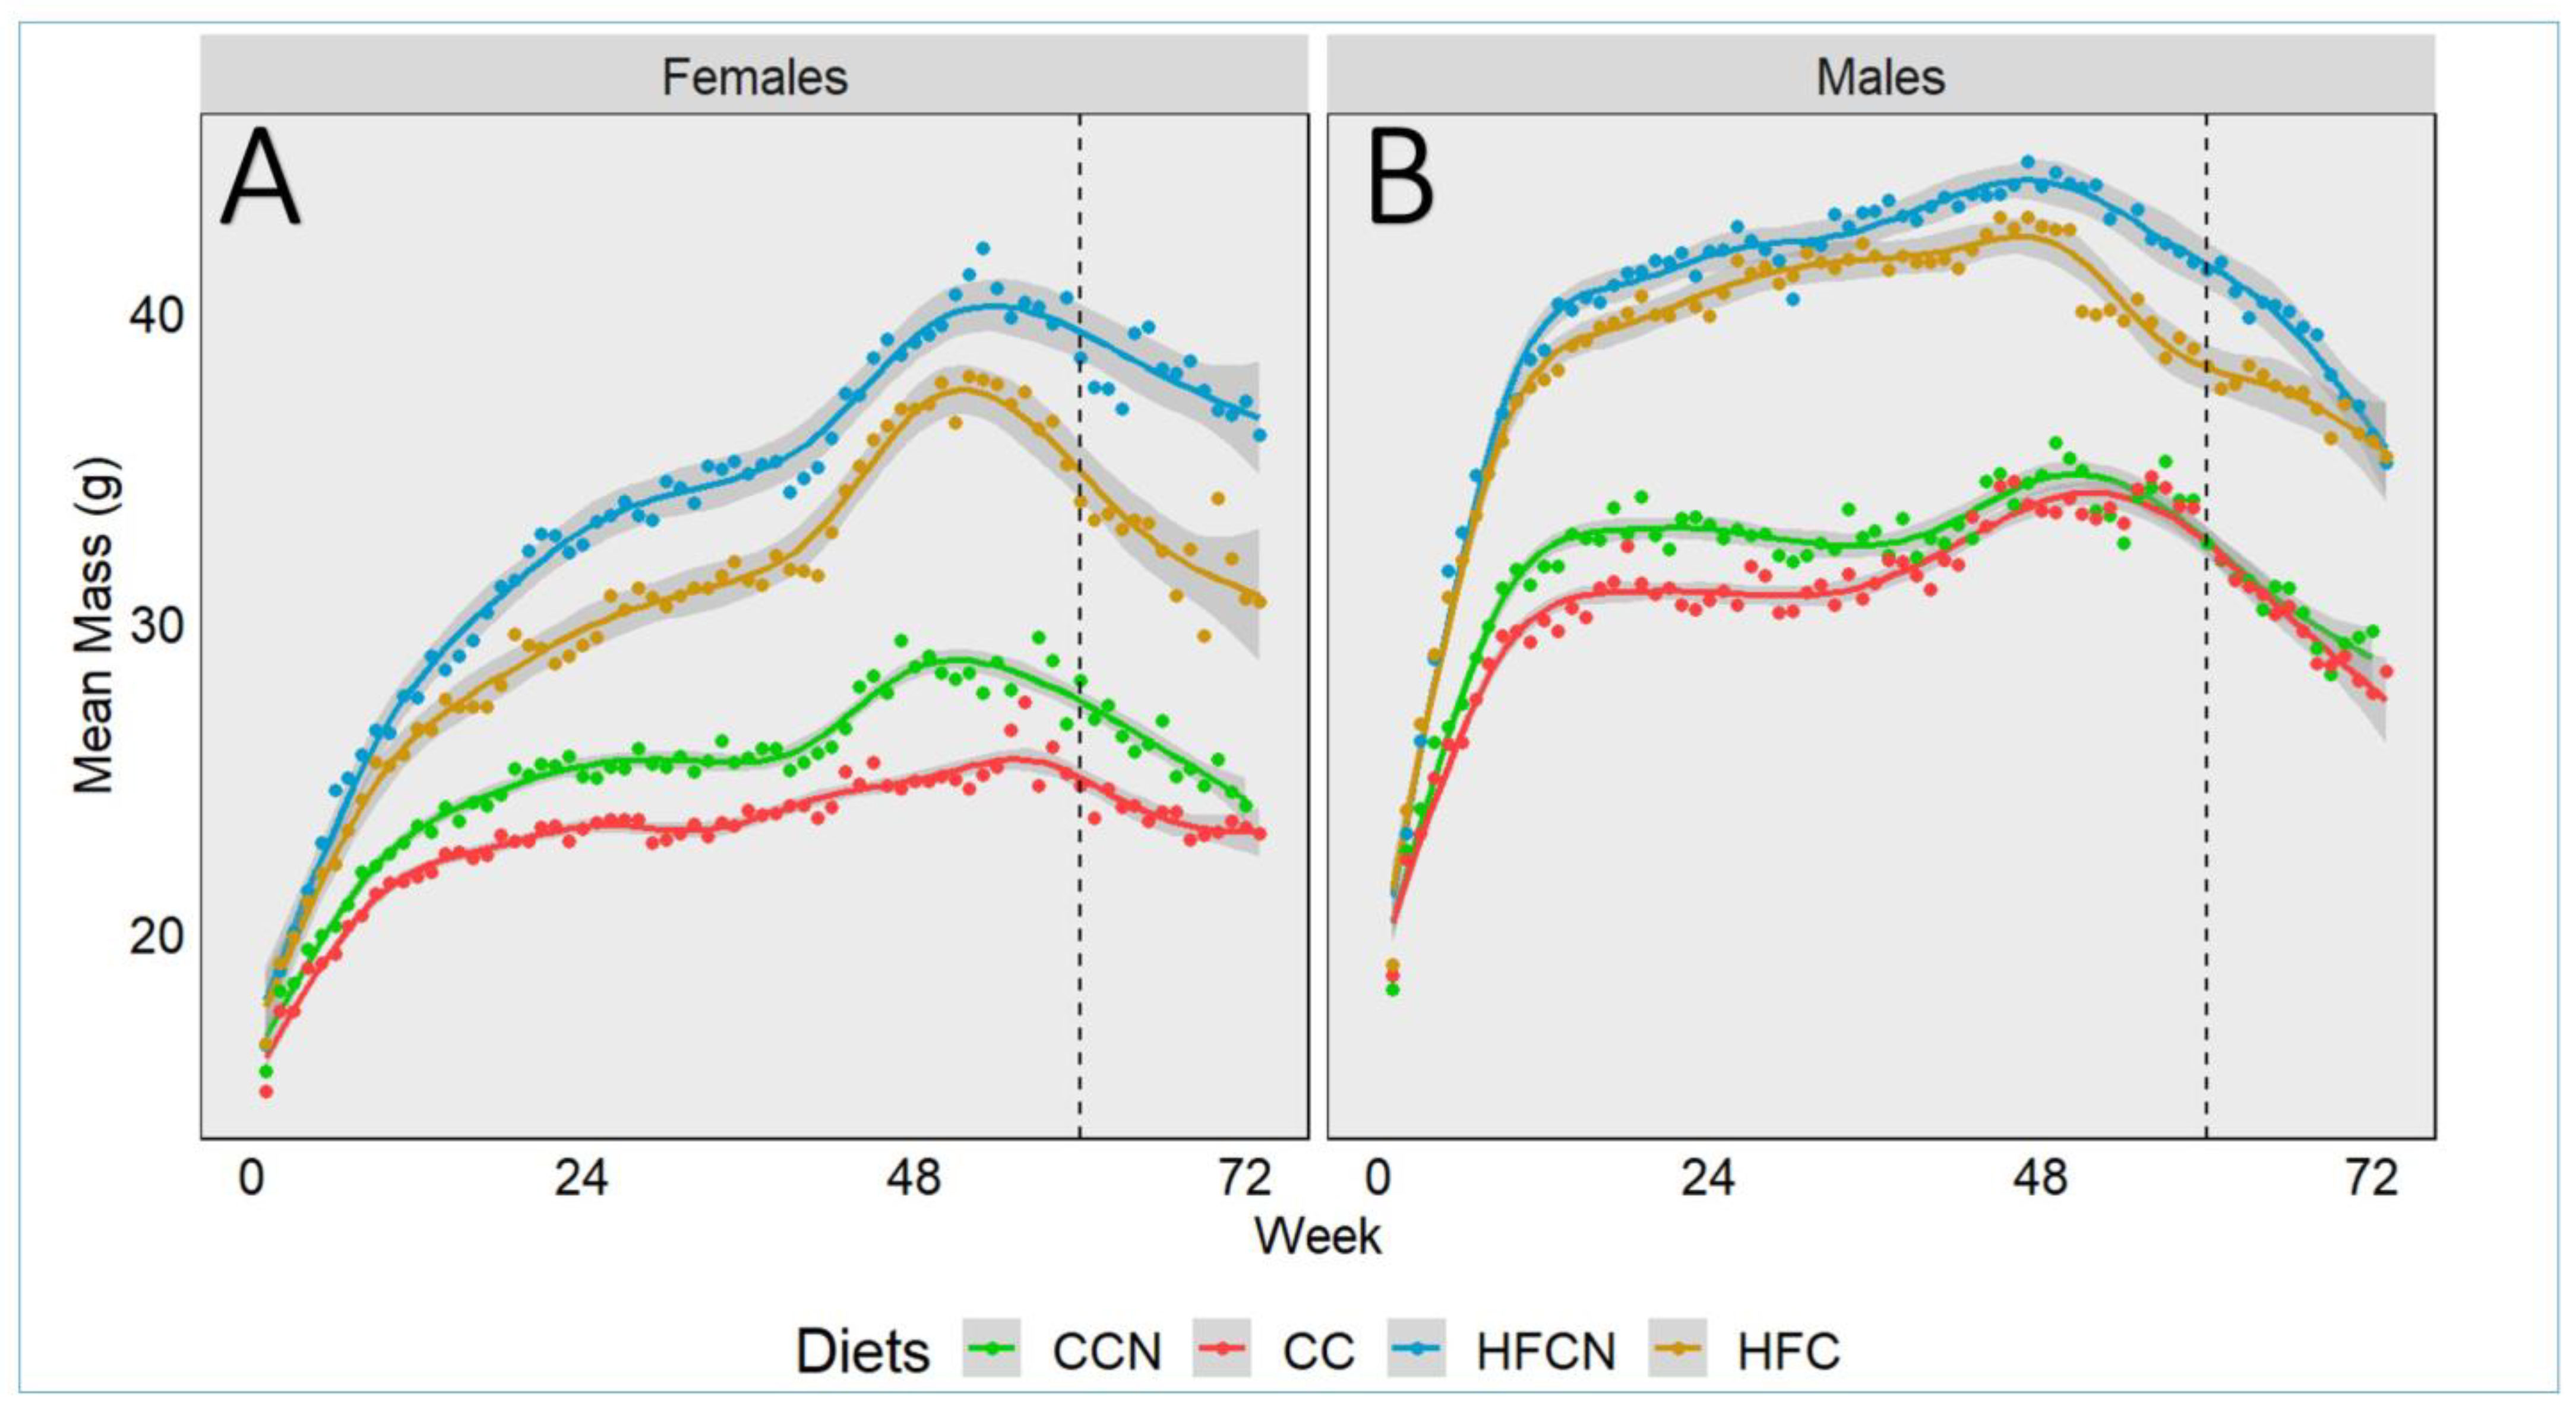
Mice were weighed weekly and monitored for any physical abnormalities for the duration of the study. Body mass data were used to generate trends for total mass change over time and taken into consideration when assessing the overall health of each group. Locally Estimated Scatterplot Smoothing (LOESS) was used to generate trendlines depicting changes in total mass as a function of age. Food pellets (40 g/mouse) were replaced weekly, and food consumption was recorded. In addition to weekly measurements, survival was monitored and assessed using Kaplan–Meier analysis to evaluate adverse events. This analysis was conducted in R (v4.3.1), using the survival package (v1.1.0) available on-line at https://CRAN.R-project.org/package=survival (accessed on 8 August 2024), and statistical significance was determined using the log-rank test (Mantel-Haenszel). The raw data and R code can be found at https://github.com/BenjaminBarr/Microbiome---HFC-and-HFCN/releases/tag/v1 (released on 17 November 2025).
At the time of microbiome collection, mouse weights were recorded for females of each treatment (CCN, CC, HFCN, HFC; females) and males of each treatment (CCN, CC, HFCN, HFC; males) [30].

2.4. Fecal Collection and Processing

At 16 months of age, mice were removed from their home cages and placed into an empty, sterile cage for ~45 min, during which stool samples were collected as produced. Mice were then returned to their home cages and back to their housing area. Stools from cages belonging to each cohort (i.e., HFC-F, both cages) were pooled into a single sample (i.e., HFC-F) to obtain the community averages, following previously described methodology [1,31,32,33]. Fecal samples were collected in sterile 2 mL tubes, kept on ice, and stored at −80 °C before being sent to Azenta (South Plainfield, NJ, USA) for DNA extraction and whole-genome shotgun metagenomic sequencing using Illumina with 150 bp PE sequencing.

2.5. Metagenomic Assembly and Contig Binning

Raw reads were pre-processed using PEAR v0.9.11 [34], which merges paired-end reads, and trimmomatic v0.38 [35], which quality filters and trims reads. Reads were then assembled using metaSPAdes [36]. MetaWRAP [37] was used to taxonomically bin assembled contigs using CONCOCT, MaxBin2, and metaBAT2 [38,39,40] in the metaWRAP-binning module. To extract quality bins, the Bin_refinement module was used with filtering thresholds of at most 10% contamination and at least 90% completion to attain high-quality metagenome-assembled genomes. The quality of refined bins was improved through the metaWRAP-Bin_reassembly module, which uses SPAdes to reassemble bins by mapping reads to individual bins, followed by assessing the final results using checkM [41]. Quantification of the bins was performed using the Quant_bins module with SALMON [42]. The metaWRAP-Classify_bin module was then used to investigate the taxonomic composition of clean and quality bins. The bacterial taxonomic identity and abundance of reads mapped to the polished bins from the previous step were identified with Centrifuge [43], which uses the Burrows–Wheeler transform (BWT) and the Ferragina-Manzini (FM) index indexing scheme.
The Blobology [44] module was used to visualize reassembled bins as abundance-GC plots, with contig taxonomy analyzed using BLAST+ [45].
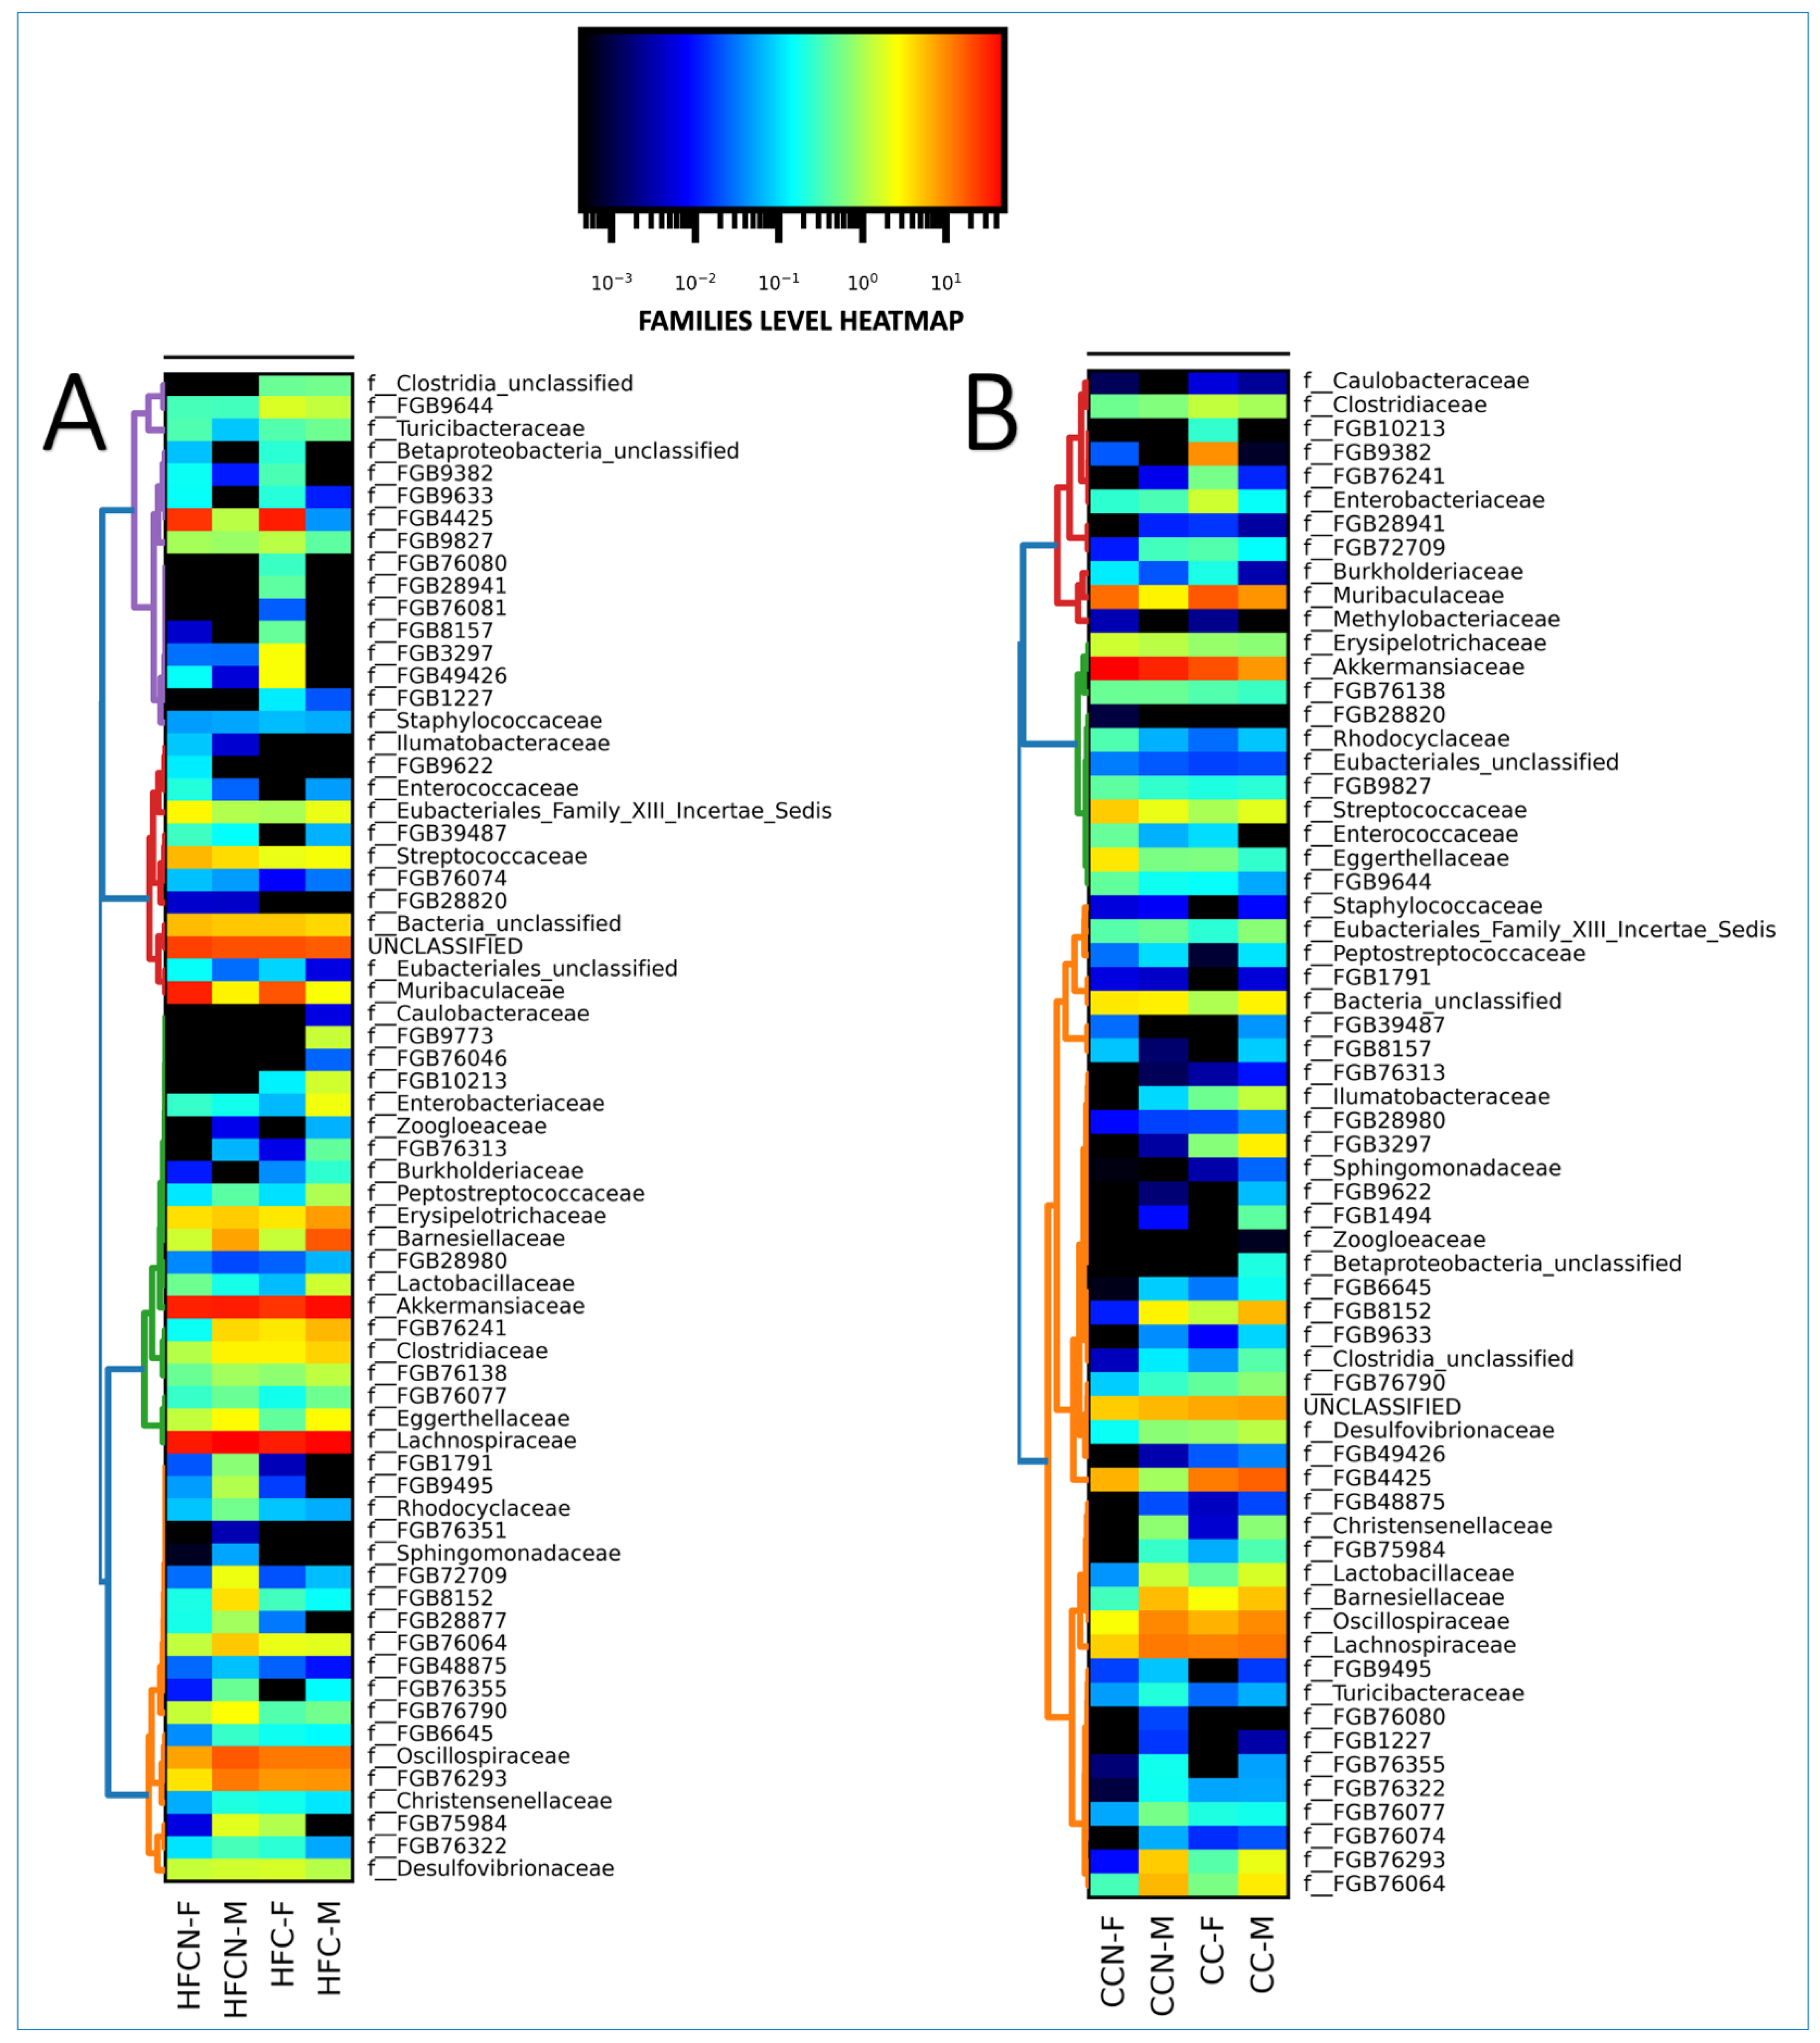
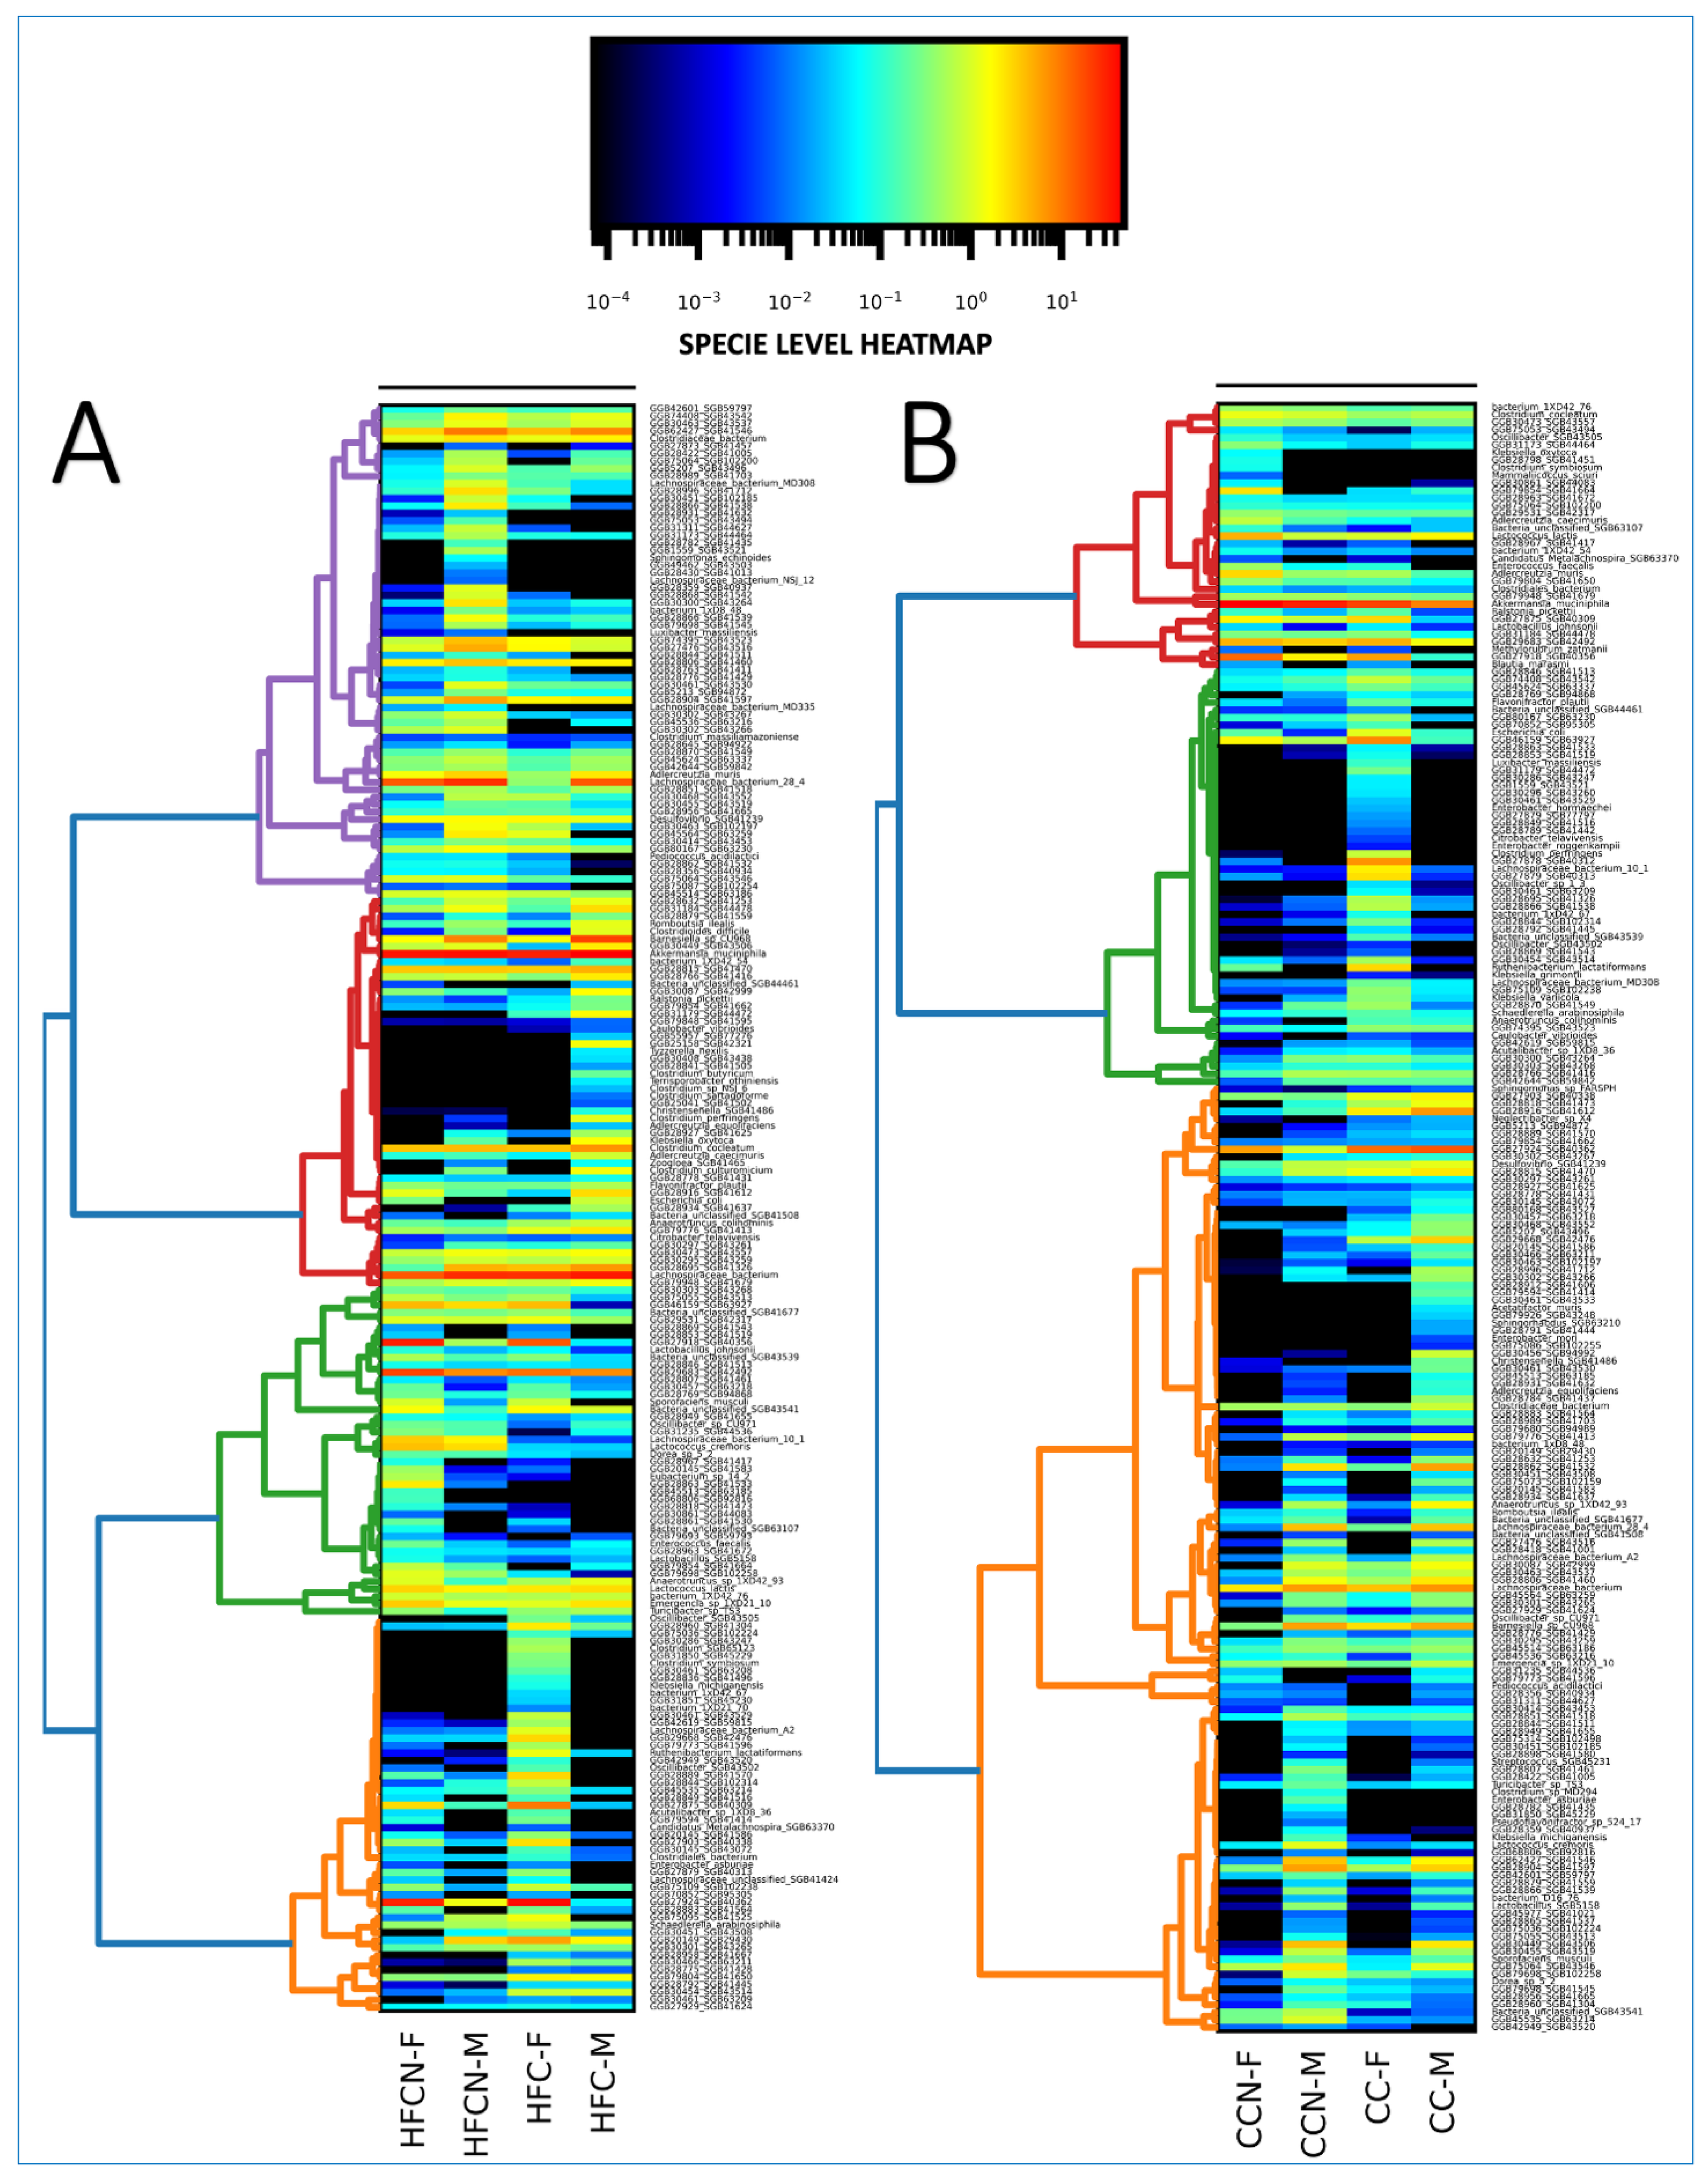
For taxonomic profiling and abundance estimation, we performed an additional analysis using MetaPhlAn4 [46] using the full set of trimmed reads mapped via Bowtie2 to a database (mpa_vOct2022 of CHCOPhlanSGB_202212) containing unique clade-specific nucleotide markers. This analysis allowed estimation of microbial species and their relative abundances with enhanced sensitivity to accurately identify and quantify unknown or poorly characterized taxa. To enhance taxonomic classification and increase refinement, the --stat_q parameter in metaPhlAn4 was adjusted to 0.1 (lower than the default value of 0.2), taking markers falling between the 10th and 90th percentile into consideration for relative abundance calculation. The outputs were combined into a single heatmap generated with hclust2.py from the MetaPhlAn suite, and the calculate.diversity.R.script was used to calculate Bray–Curtis dissimilarity.
Taxonomic abundance tables generated by MetaPhlan were transformed into phyloseq-class objects to assess the beta diversity and determine statistical differences in taxonomic abundance between the groups using the R packages phyloseq [47] and ggplot2 [48]. Permutational multivariate analysis of variance (PERMANOVA) was performed using the vegan::adonis2 R package [49]. Differential abundance analysis of the taxa for each group was conducted using Analysis of Compositions of Microbiomes with Bias Correction 2 (ANCOM-BC2) [50,51]. This software (Version 3.0) conducts a sensitivity analysis, then assesses and adds a series of pseudo-counts to the zero counts for each taxon. Linear regression models are then applied to the bias-corrected log abundance table using the different pseudo-counts. We applied multiple testing corrections (p-values converted to q-values) using the parameters ‘p_adj_method’ and ‘fdr’. To evaluate the fixed effects of each metadata type on the q-values, we used two different models: one with ‘fix_formula = “Sex + Group”’ to assess interactions among the factors, and another with ‘fix_formula = “Group”’ to specifically test the impact of group alone.

2.6. Gene Annotation and Gene Ontology (GO) Enrichment Analysis

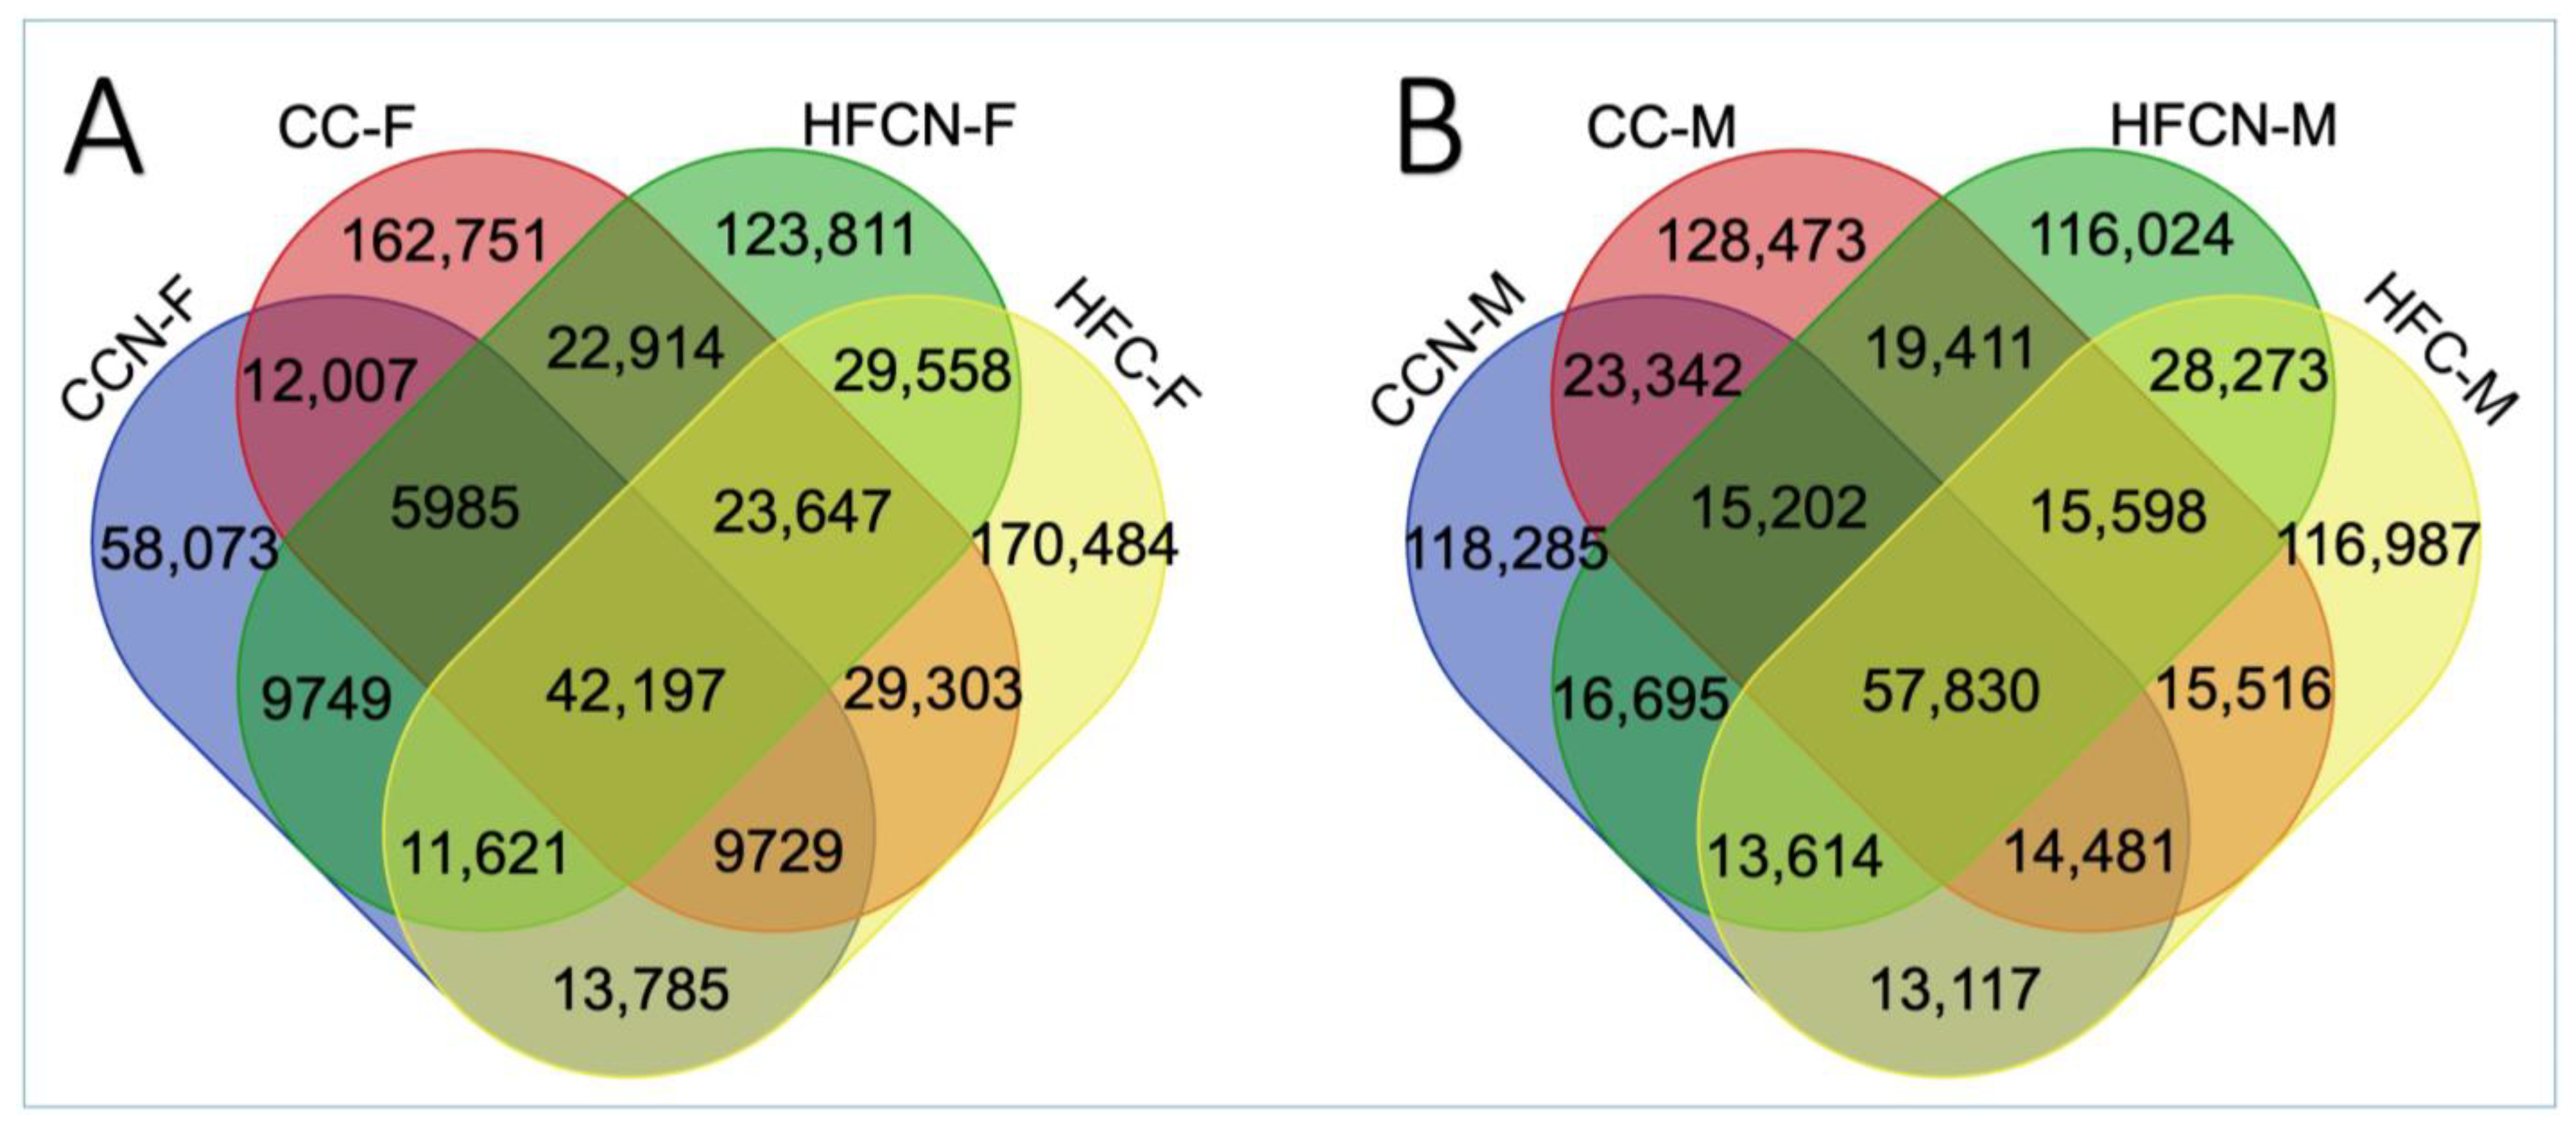
Prokka [52] was used to annotate genes for the initial assemblies (prior to binning), with the e-value set to 0.001. Prokka uses Prodigal for ab initio gene prediction, HMMER3 for protein family profiles, BLAST+ for comparative annotation, Barrnap for rRNAs, and Aragorn for tRNAs. Pangenome analysis was performed using Roary [53] to detect orthologs, and results were visualized by creating Venn diagrams using an online drawing tool available at https://bioinformatics.psb.ugent.be/webtools/Venn/ (accessed on 5 October 2025). Differences in microbiome functional profiles among samples were tested using topGO [54] with the ‘weight01.fisher’ statistic. GO annotations for abundant taxa in the microbiome metapangenomes were downloaded from the UniProtKB database, and MetaCyc/KEGG was used to resolve missing genes and synonyms. TopGO [54] analysis was performed in R using the script aip_usage.consider_universe.R3 for multiple gene subsets represented in Venn diagrams.

3. Results

3.1. Mouse Trends in Total Mass

3.1.1. Diet-Dependent Increases in Mouse Body Mass with More Pronounced Effects in Females

Average total mass results are summarized in Table 2 for both sexes and all diets. Both male and female mice exhibited diet-dependent alterations in body mass, with a clear sex-specific effect. In females, the administration of AHE-supplemented diets (CCN and HFCN) resulted in significantly greater mean body mass across all experimental time points compared with casein-based diet controls (CC and HFC) (Table 2, Figure 1). Males also demonstrated increases in body mass under AHE diets; however, the magnitude of this response was less pronounced than in females. At the time of fecal sampling, the mean body mass values indicated that females receiving AHE diets were, on average, 10.0–14.0 g heavier than their control counterparts. In contrast, males exhibited smaller yet consistent differences between dietary treatments. Additionally, in females, AHE-supplemented and unsupplemented high-fat diets (HFCN and HFC) promoted the greatest increases in body mass, with peak values observed around week 64, followed by a gradual decline to week 72 (Figure 1). A similar dietary effect was observed in males, although the magnitude of weight gain was less pronounced than in females, when comparing the two periods. Conversely, AHE-supplemented lower-fat treated and control diets (CCN and CC) consistently maintained a lower body mass index trend throughout the study duration.

3.1.2. Diet-Dependent Effects on Survivability of C3H/HeJ Mice over 18 Months

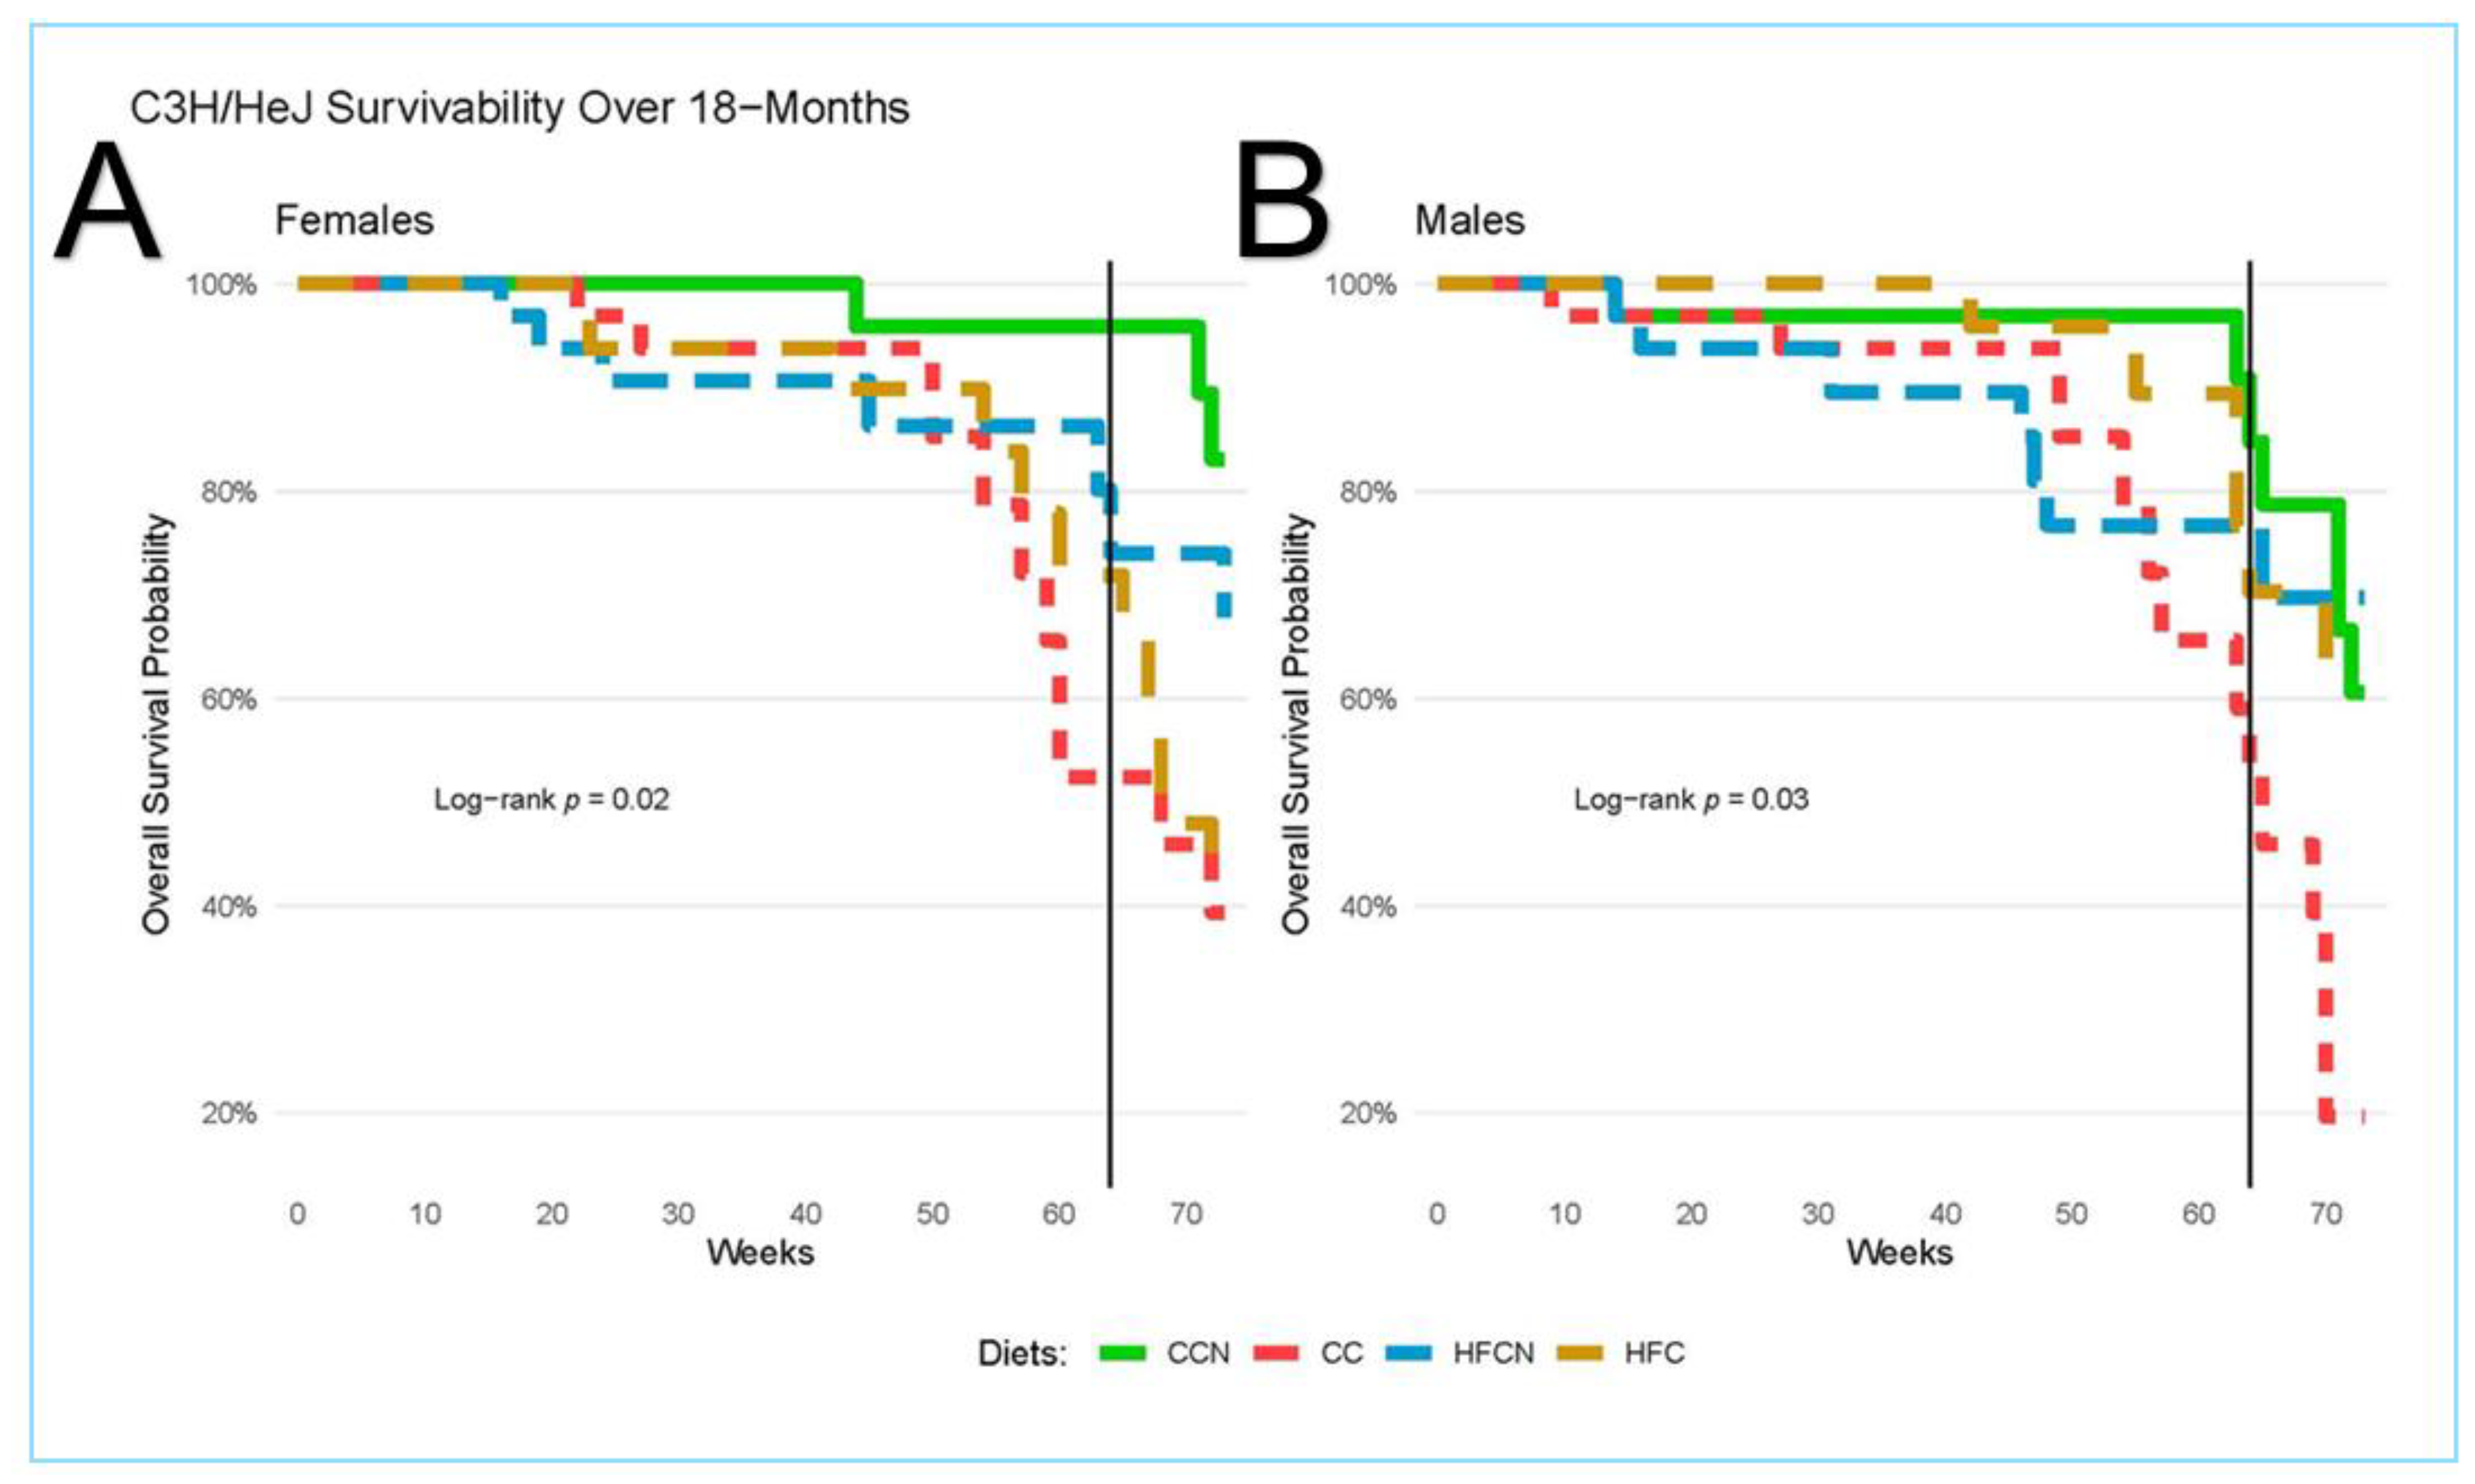
Kaplan–Meier analysis was used to assess differences in survivability among dietary groups within the same sex over the course of this study (Figure 2). In females, survival remained similar across groups until approximately week 64, after which HFC-fed mice exhibited a marked decline, with survivability falling below that of the lower-fat diet groups (CCN, CC) (Figure 2A). By study termination, CCN-fed females demonstrated the highest survival probability, whereas HFC- and HFCN-fed females had substantially reduced survival.
In males, survivability also varied by diet, with significant differences detected between groups (log-rank p = 0.03). HFC-fed males exhibited the most pronounced decline in survival commencing approximately at week 64, followed by CC-fed males (Figure 2B). Conversely, CCN-fed males sustained the highest survival probability throughout the study duration, with HFCN-fed males demonstrating intermediate survivability. Furthermore, statistical analysis confirmed that diet significantly influenced survivability across both sexes (log-rank test: females p = 0.02; males p = 0.03).
The analysis was conducted with a sample size of N = 32 per diet per sex group, totaling N = 256, at an α level of 0.05, and with 3 degrees of freedom. The chi-square statistics were 10.1 for females and 8.9 for males. The notable decline in survivability observed up to 16 months (64 weeks) prompted the initiation of microbiome assessment at that juncture rather than at 18 months, owing to the potential for markedly reduced sample sizes.

3.2. Shotgun Sequencing, Assembly Statistics, and Annotations Variability Across Diet Treatments

Shotgun metagenomic sequencing generated between 32.2 and 35.0 million raw reads per sample, with assemblies producing 113,578 to 422,369 contigs (Table 3). Maximum lengths ranged from 439,148 bp (CC-M) to 916,537 bp (HFC-F), while total assembled sequence lengths spanned 152.65 Mbp (CCN-F) to 323.52 Mbp (HFC-F). Assembly N50 values ranged from 2071 bp in CCN-M to 5742 bp in HFC-M, which suggests that most contigs are sufficiently long to support accurate gene predictions. Regarding gene annotation, the assemblies yielded between 165,463 and 334,689 predicted genes, with the highest number observed in HFC-F and the lowest in CCN-F.

3.3. Bacterial Taxonomical Composition

3.3.1. Taxonomic Composition at the Phylum Level Across Samples Indicates That Verrucomicrobiota Is the Dominant Phylum Within the Mouse Fecal Microbiome

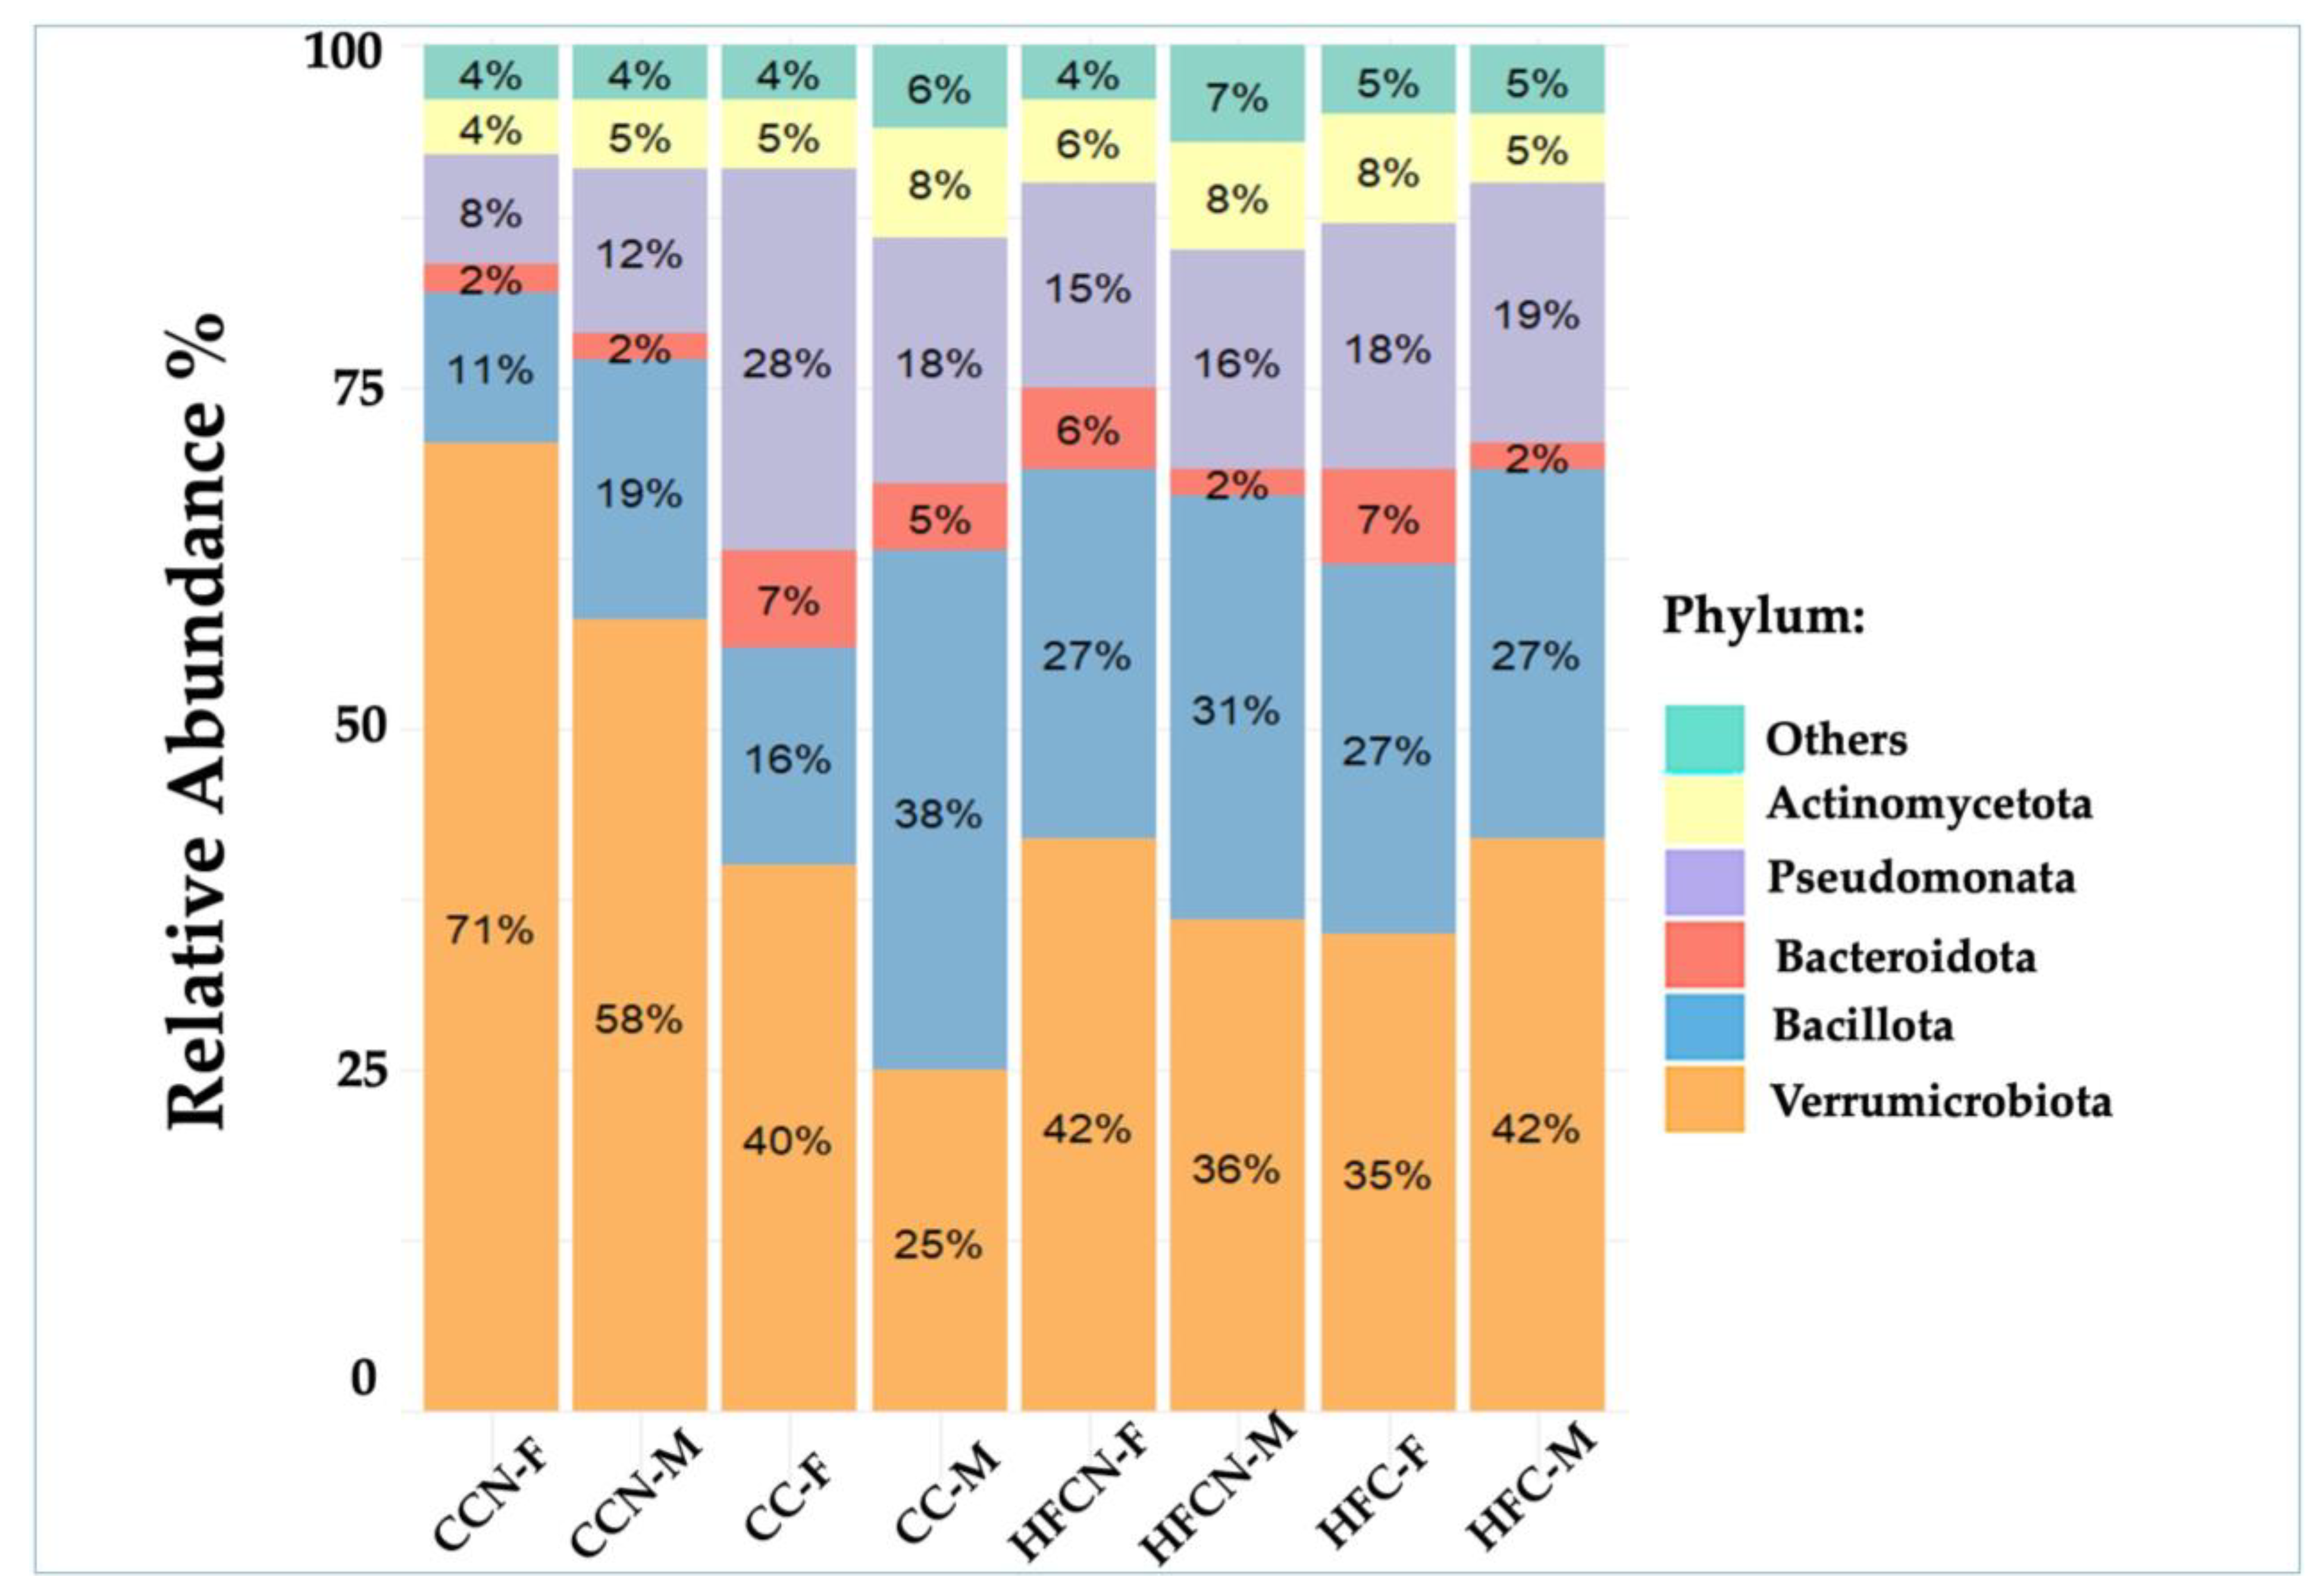
Centrifuge software analyses revealed that Verrucomicrobiota was the most abundant phylum in all samples, except for CC-M, where Bacillota was predominant (Figure 3). Among females, CCN-F had the highest abundance of Verrucomicrobiota at 71%, followed by HFCN-F at 42%, CC-F at 40%, and HFC-F at 35%. Among males, CCN-M showed a high abundance of Verrucomicrobiota at 58%, with HFC-M at 42% and HFCN-M at 36%. In contrast, in CC-M, Bacillota was the most abundant at 38%, followed by Verrucomicrobiota at 25%. In other samples, Bacillota ranked second in abundance, with males generally showing higher relative abundances than females, except in HCN, where both sexes exhibited similar levels. Pseudomonata was the next most common phylum, followed by Bacteroidota. For Bacteroidota, females had higher relative abundances than males, except in CC, where both sexes had similar levels.

3.3.2. Upper-Level Taxonomic Composition, Highlighting the Akkermansiaceae Family as the Most Predominant Across All Groups

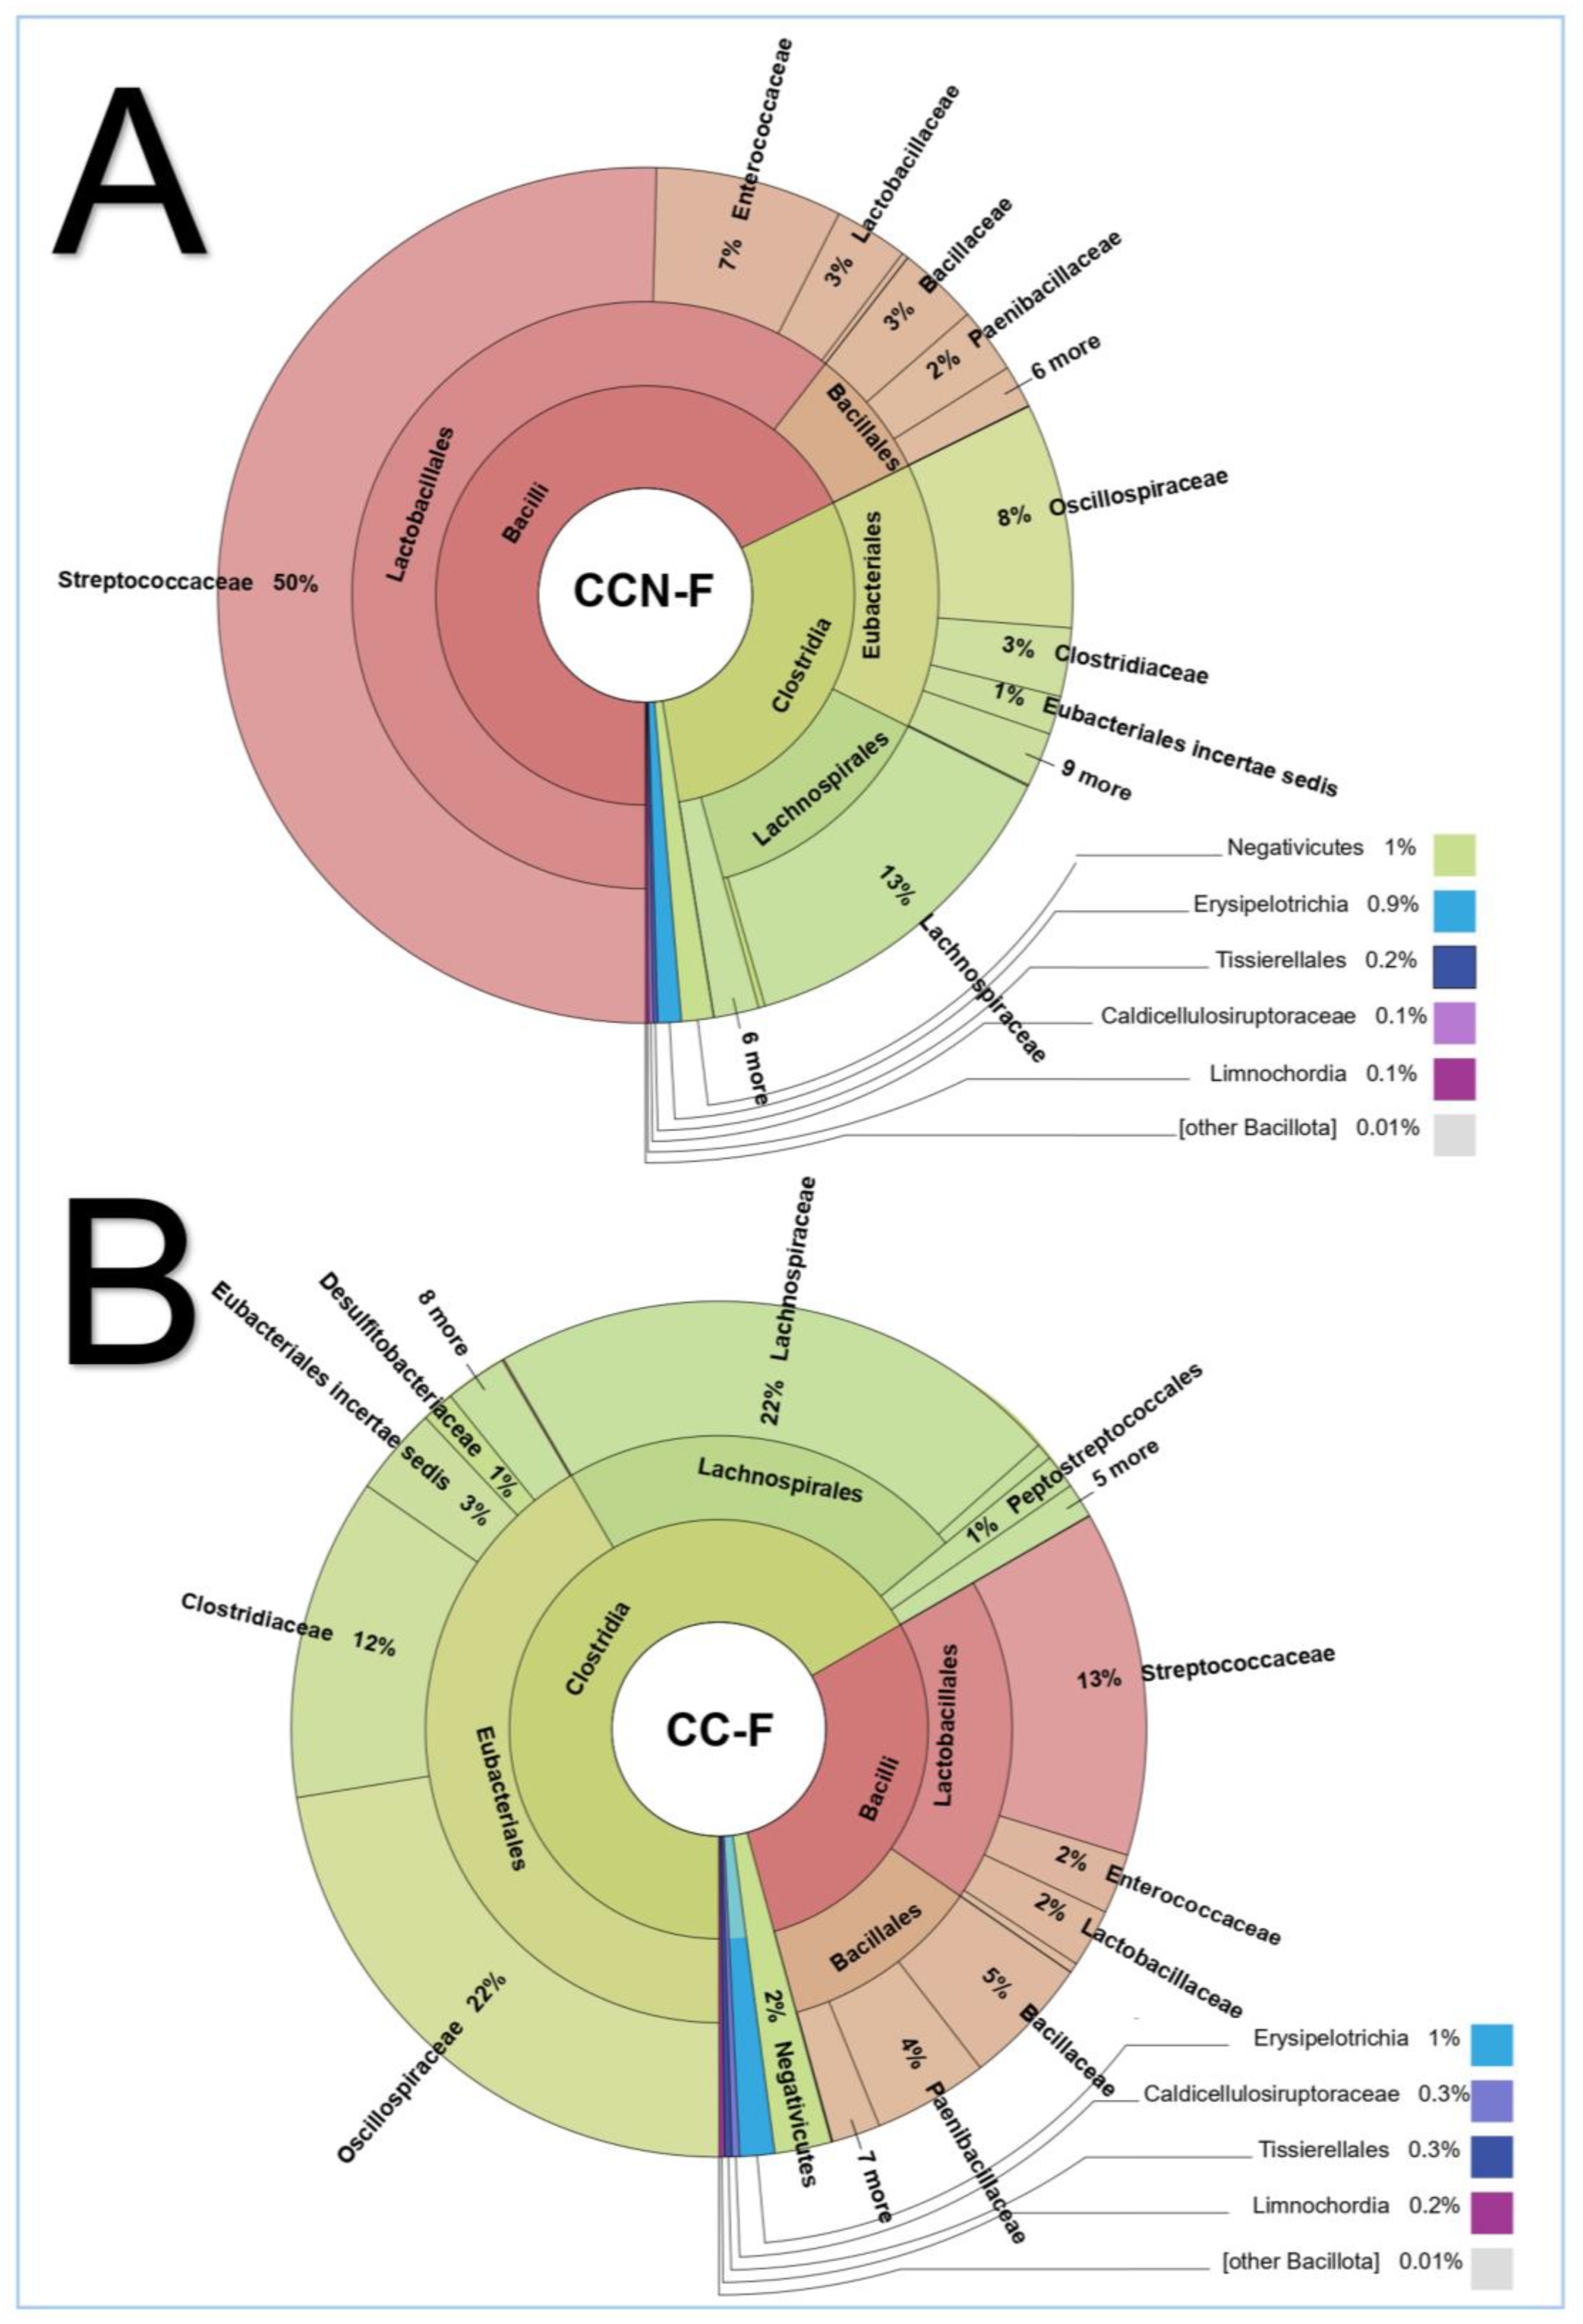
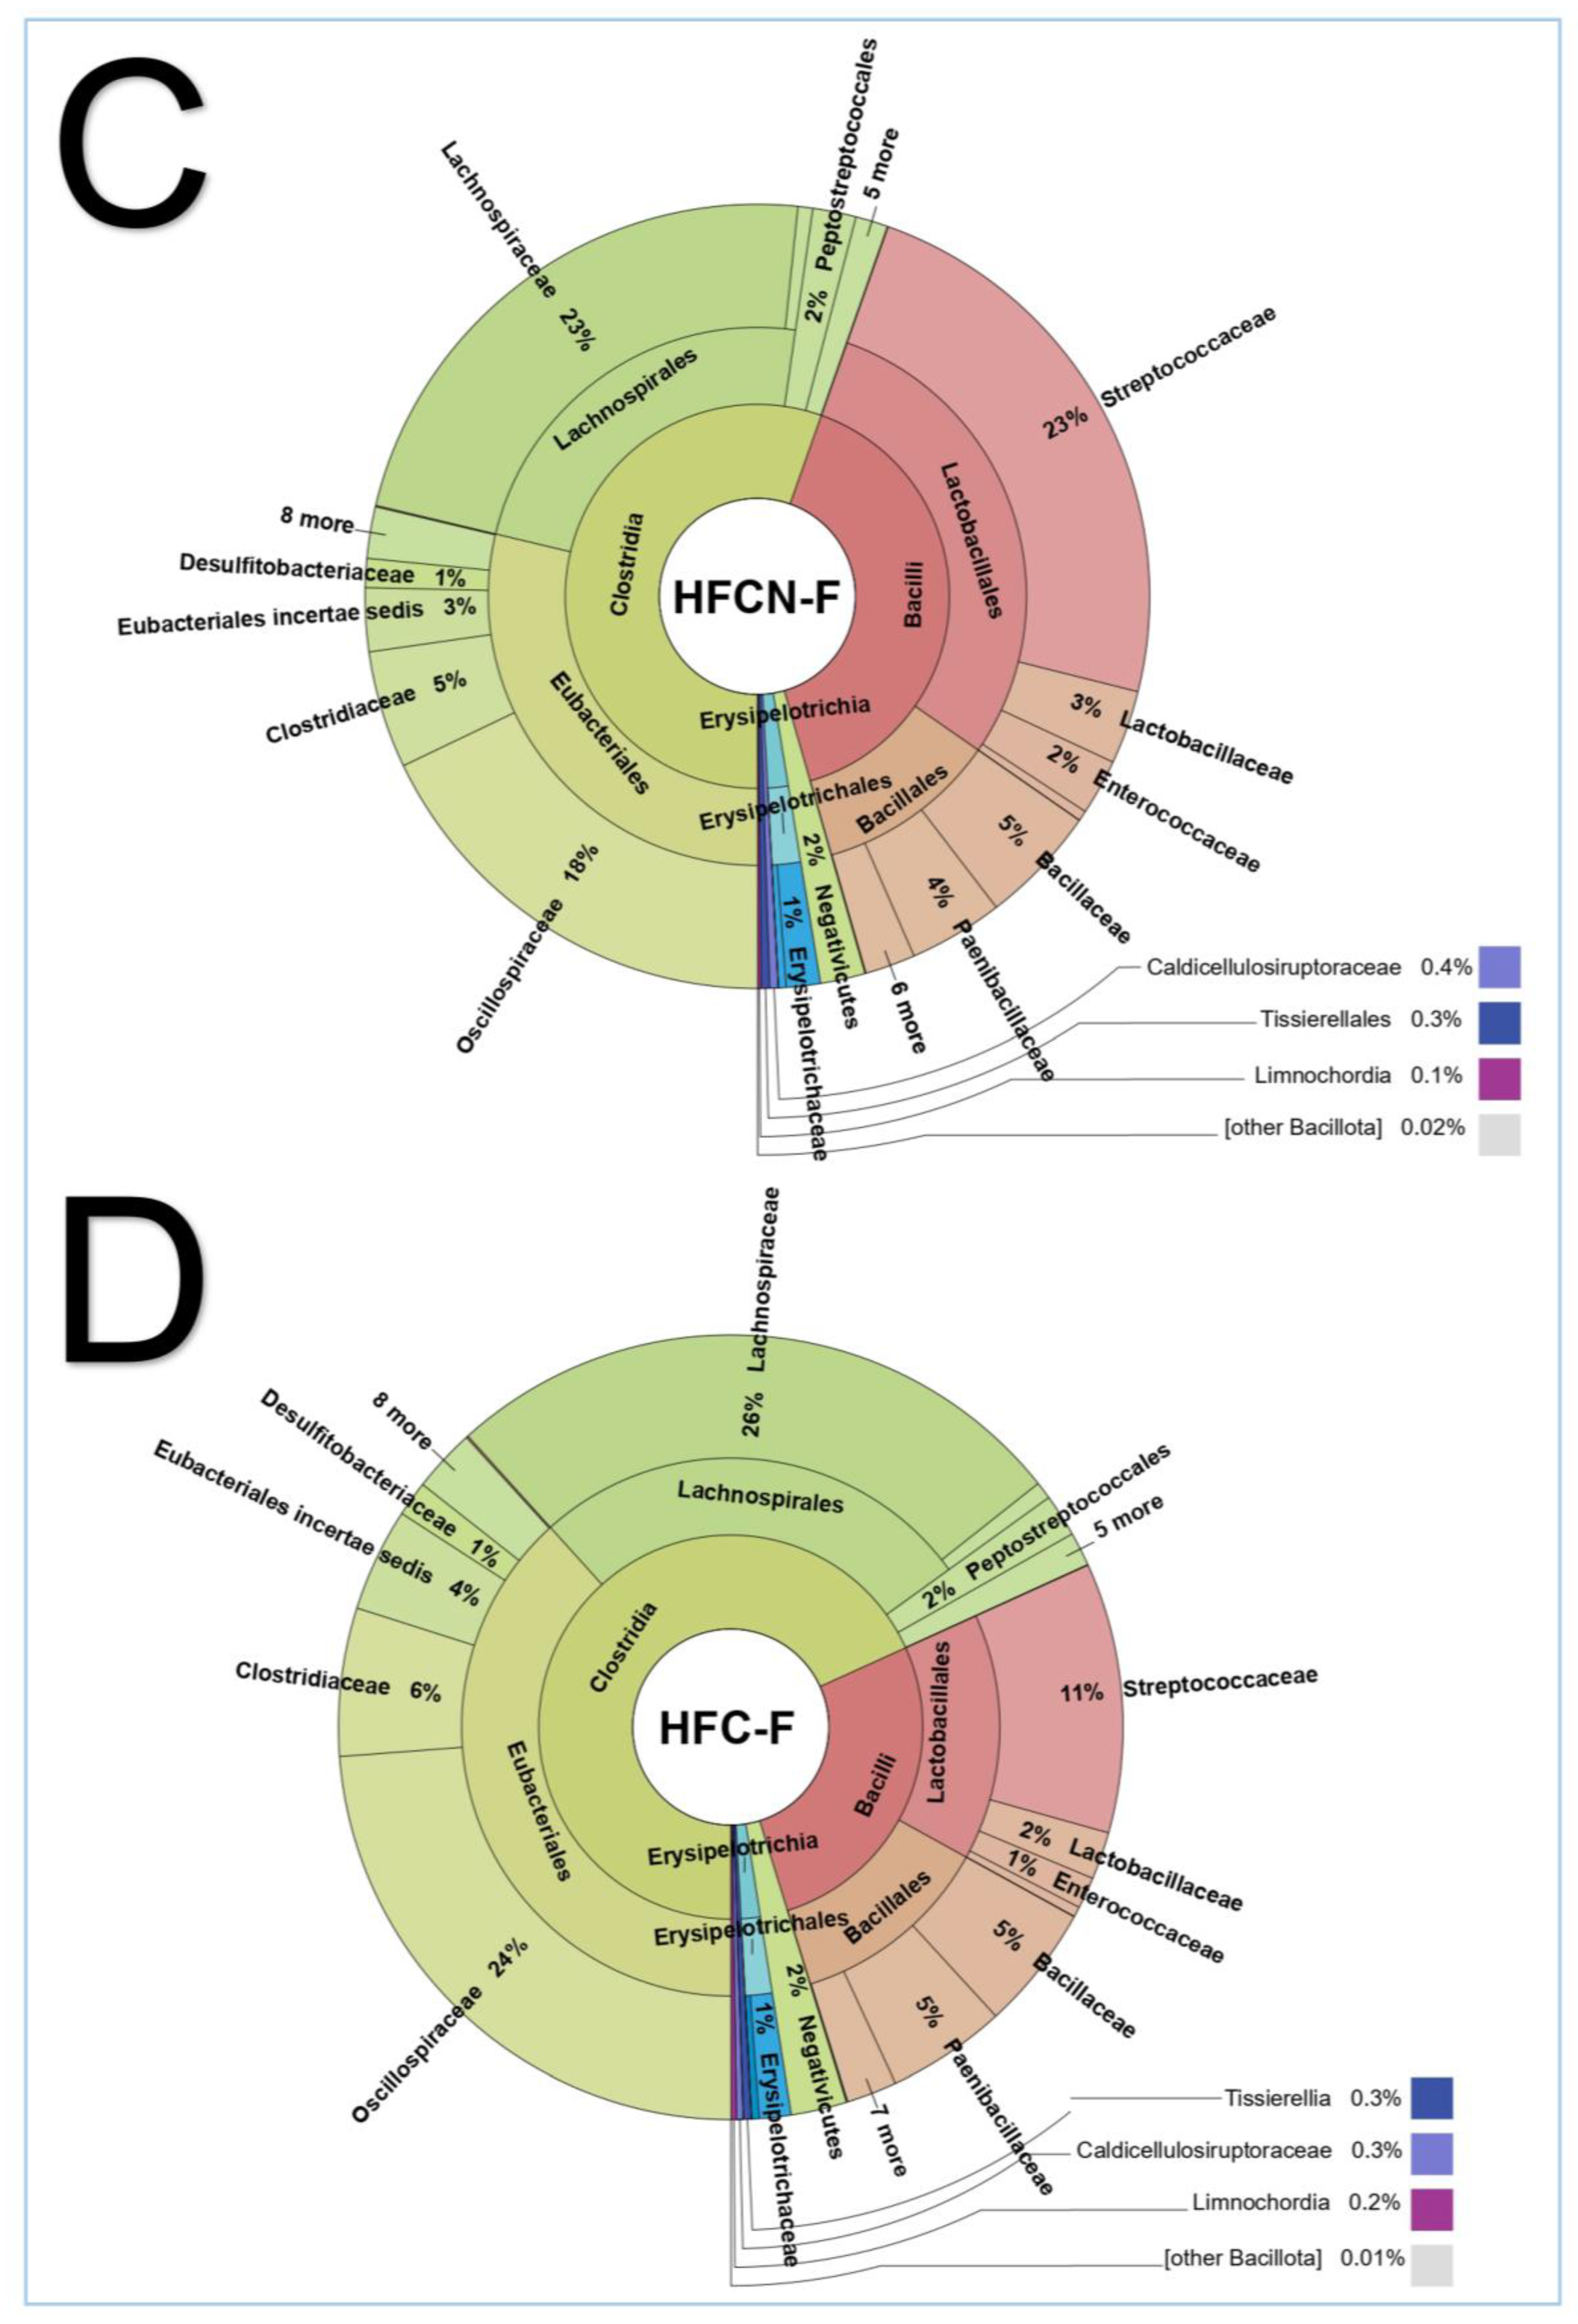
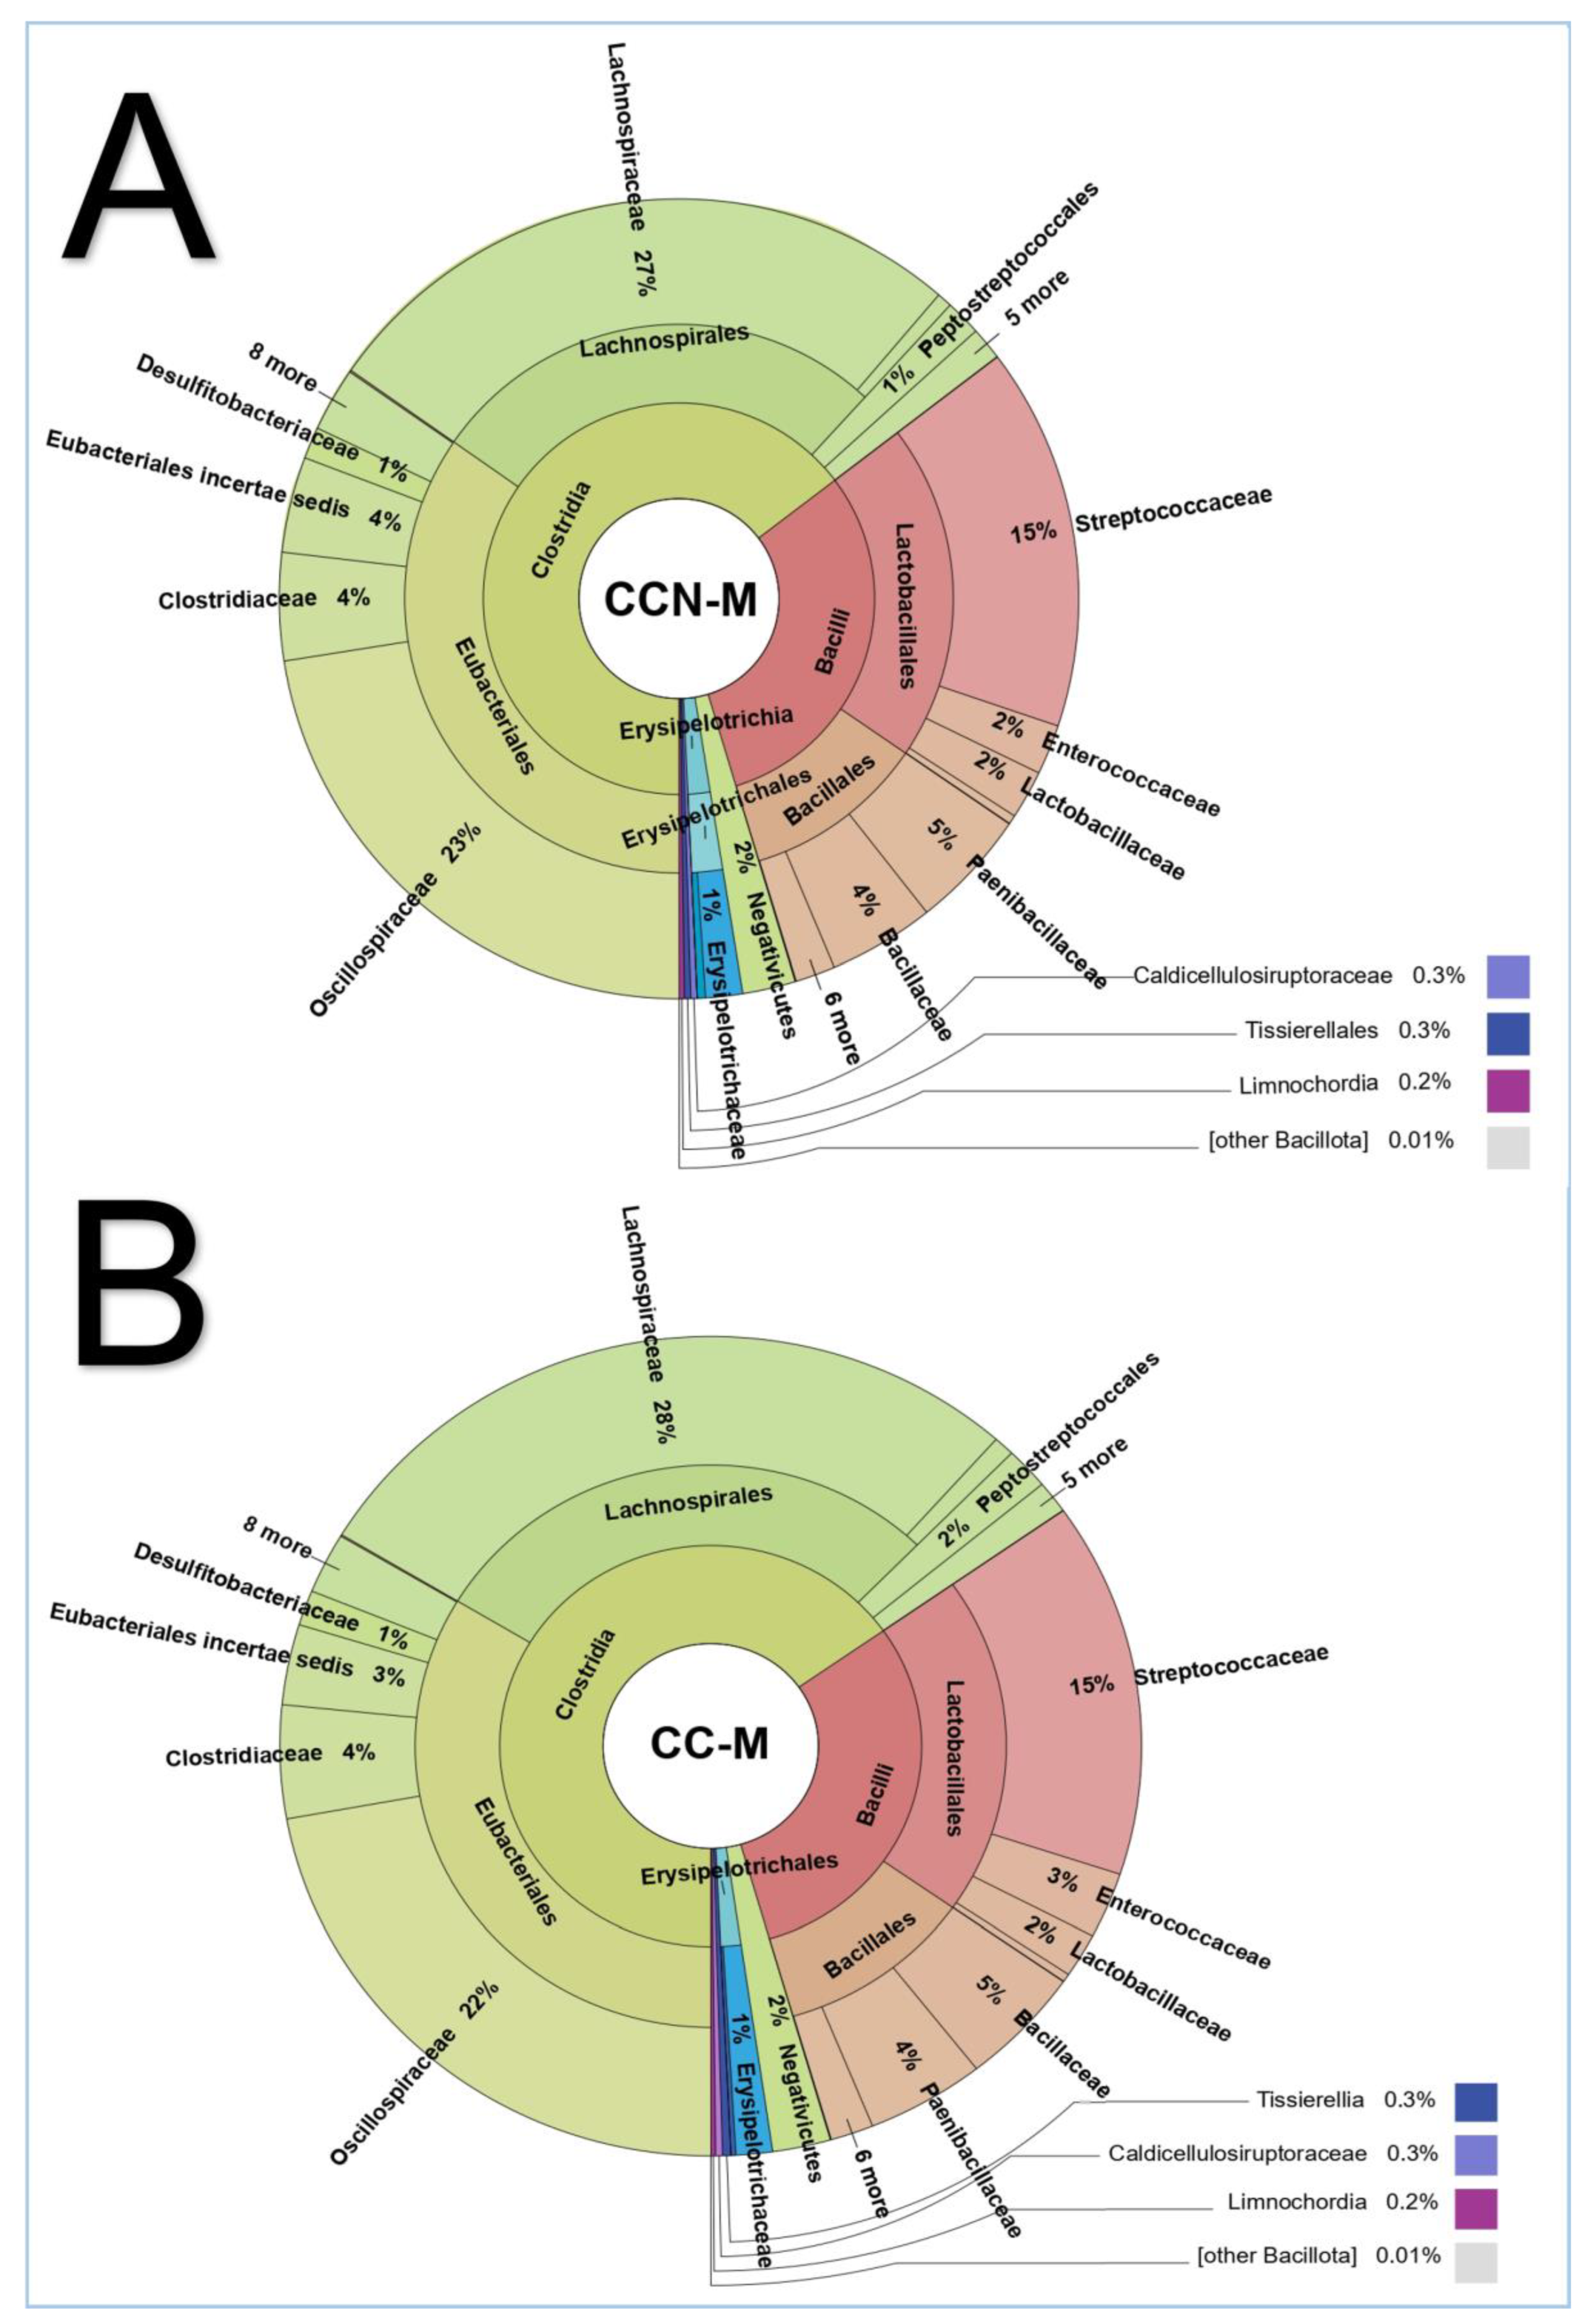
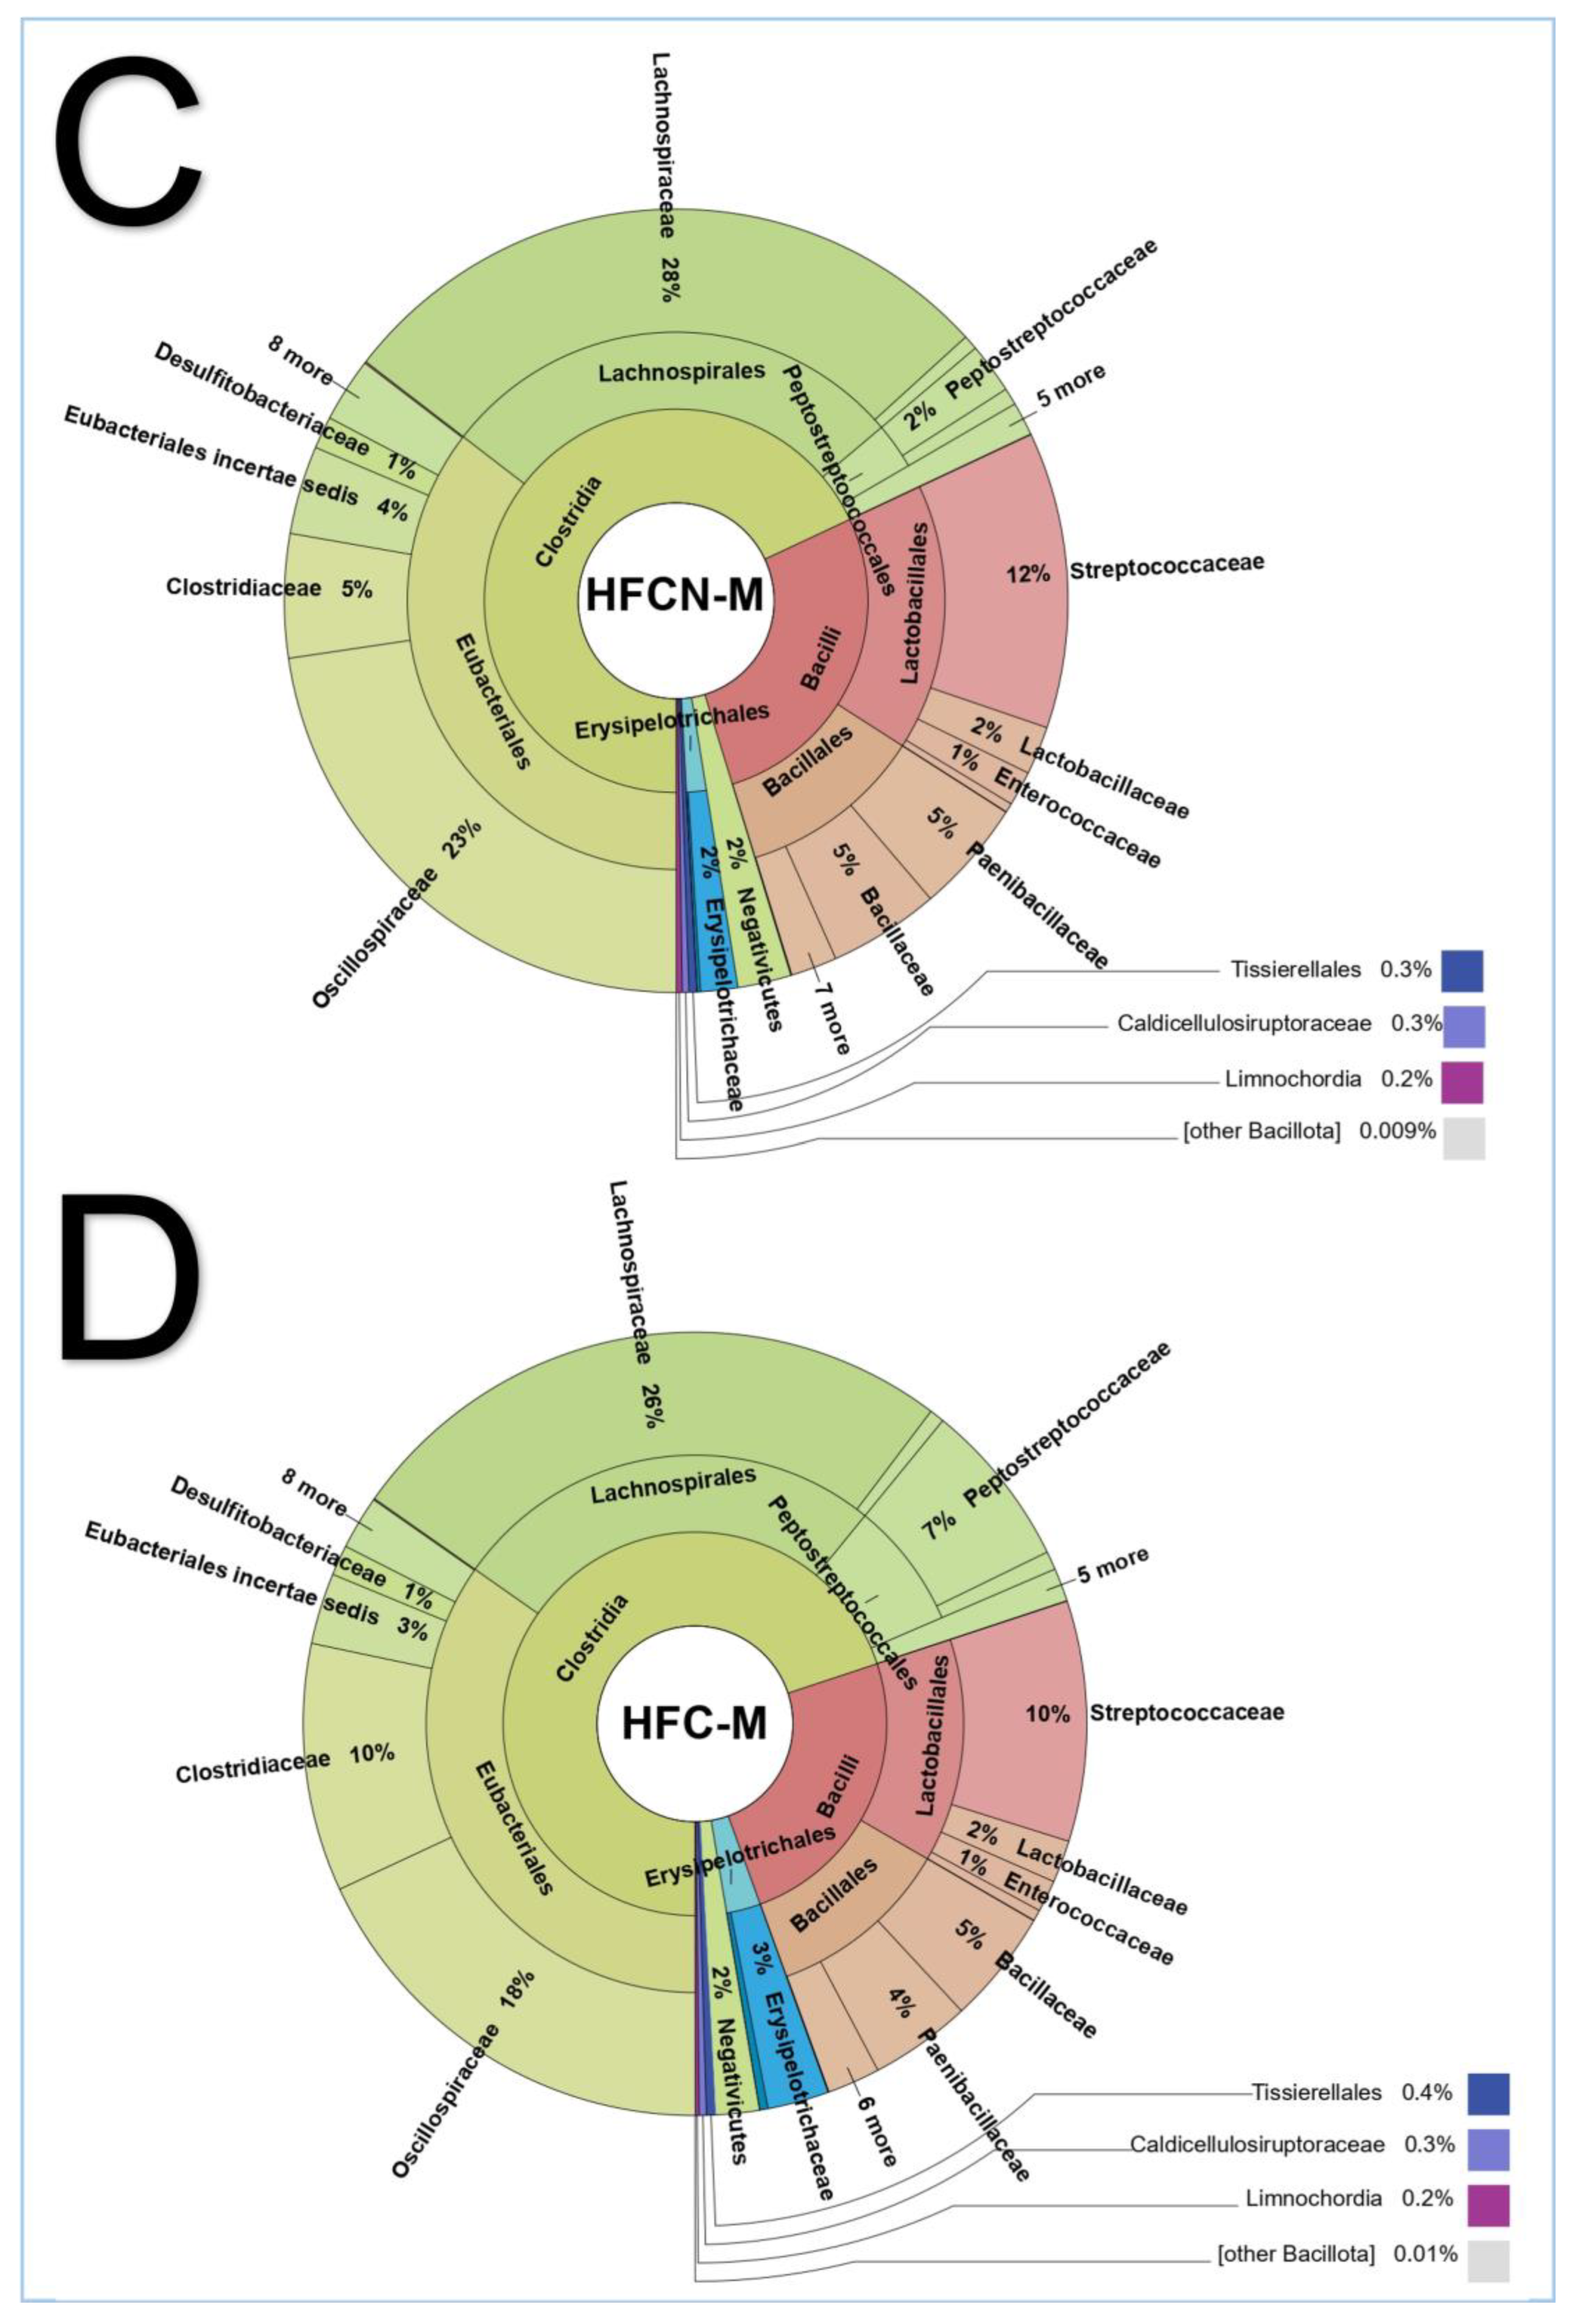
At the bacterial family level (Akkermansiaceae), a single species, Akkermansia muciniphila (Supplementary Figures S1–S3), within the phylum Verrucomicrobiota, was the most predominant species across all samples, constituting 100% of the composition, except in the HFC-F group, where it accounted for 99%, with the remaining 1% consisting of other Akkermansia species (Supplementary Figure S4). Among females (Figure 4), the class Clostridia was more prevalent than the Bacilli within the phylum Bacillota, except for the CCN-F group (Figure 4A), which exhibited a higher relative abundance of Bacilli. Conversely, in all male samples, Clostridia were relatively more abundant than Bacilli (Figure 5). Within Clostridia, the order Eubacteriales was the predominant, followed by Lachnospirales across all the female groups, with Lachnospiraceae and Oscillospiraceae representing the most abundant families (Figure 4 and Figure 5).

3.3.3. Diet–Sex Microbiome Signatures: Gammaproteobacteria/Enterobacterales Predominance and Female-Biased Coriobacteriia

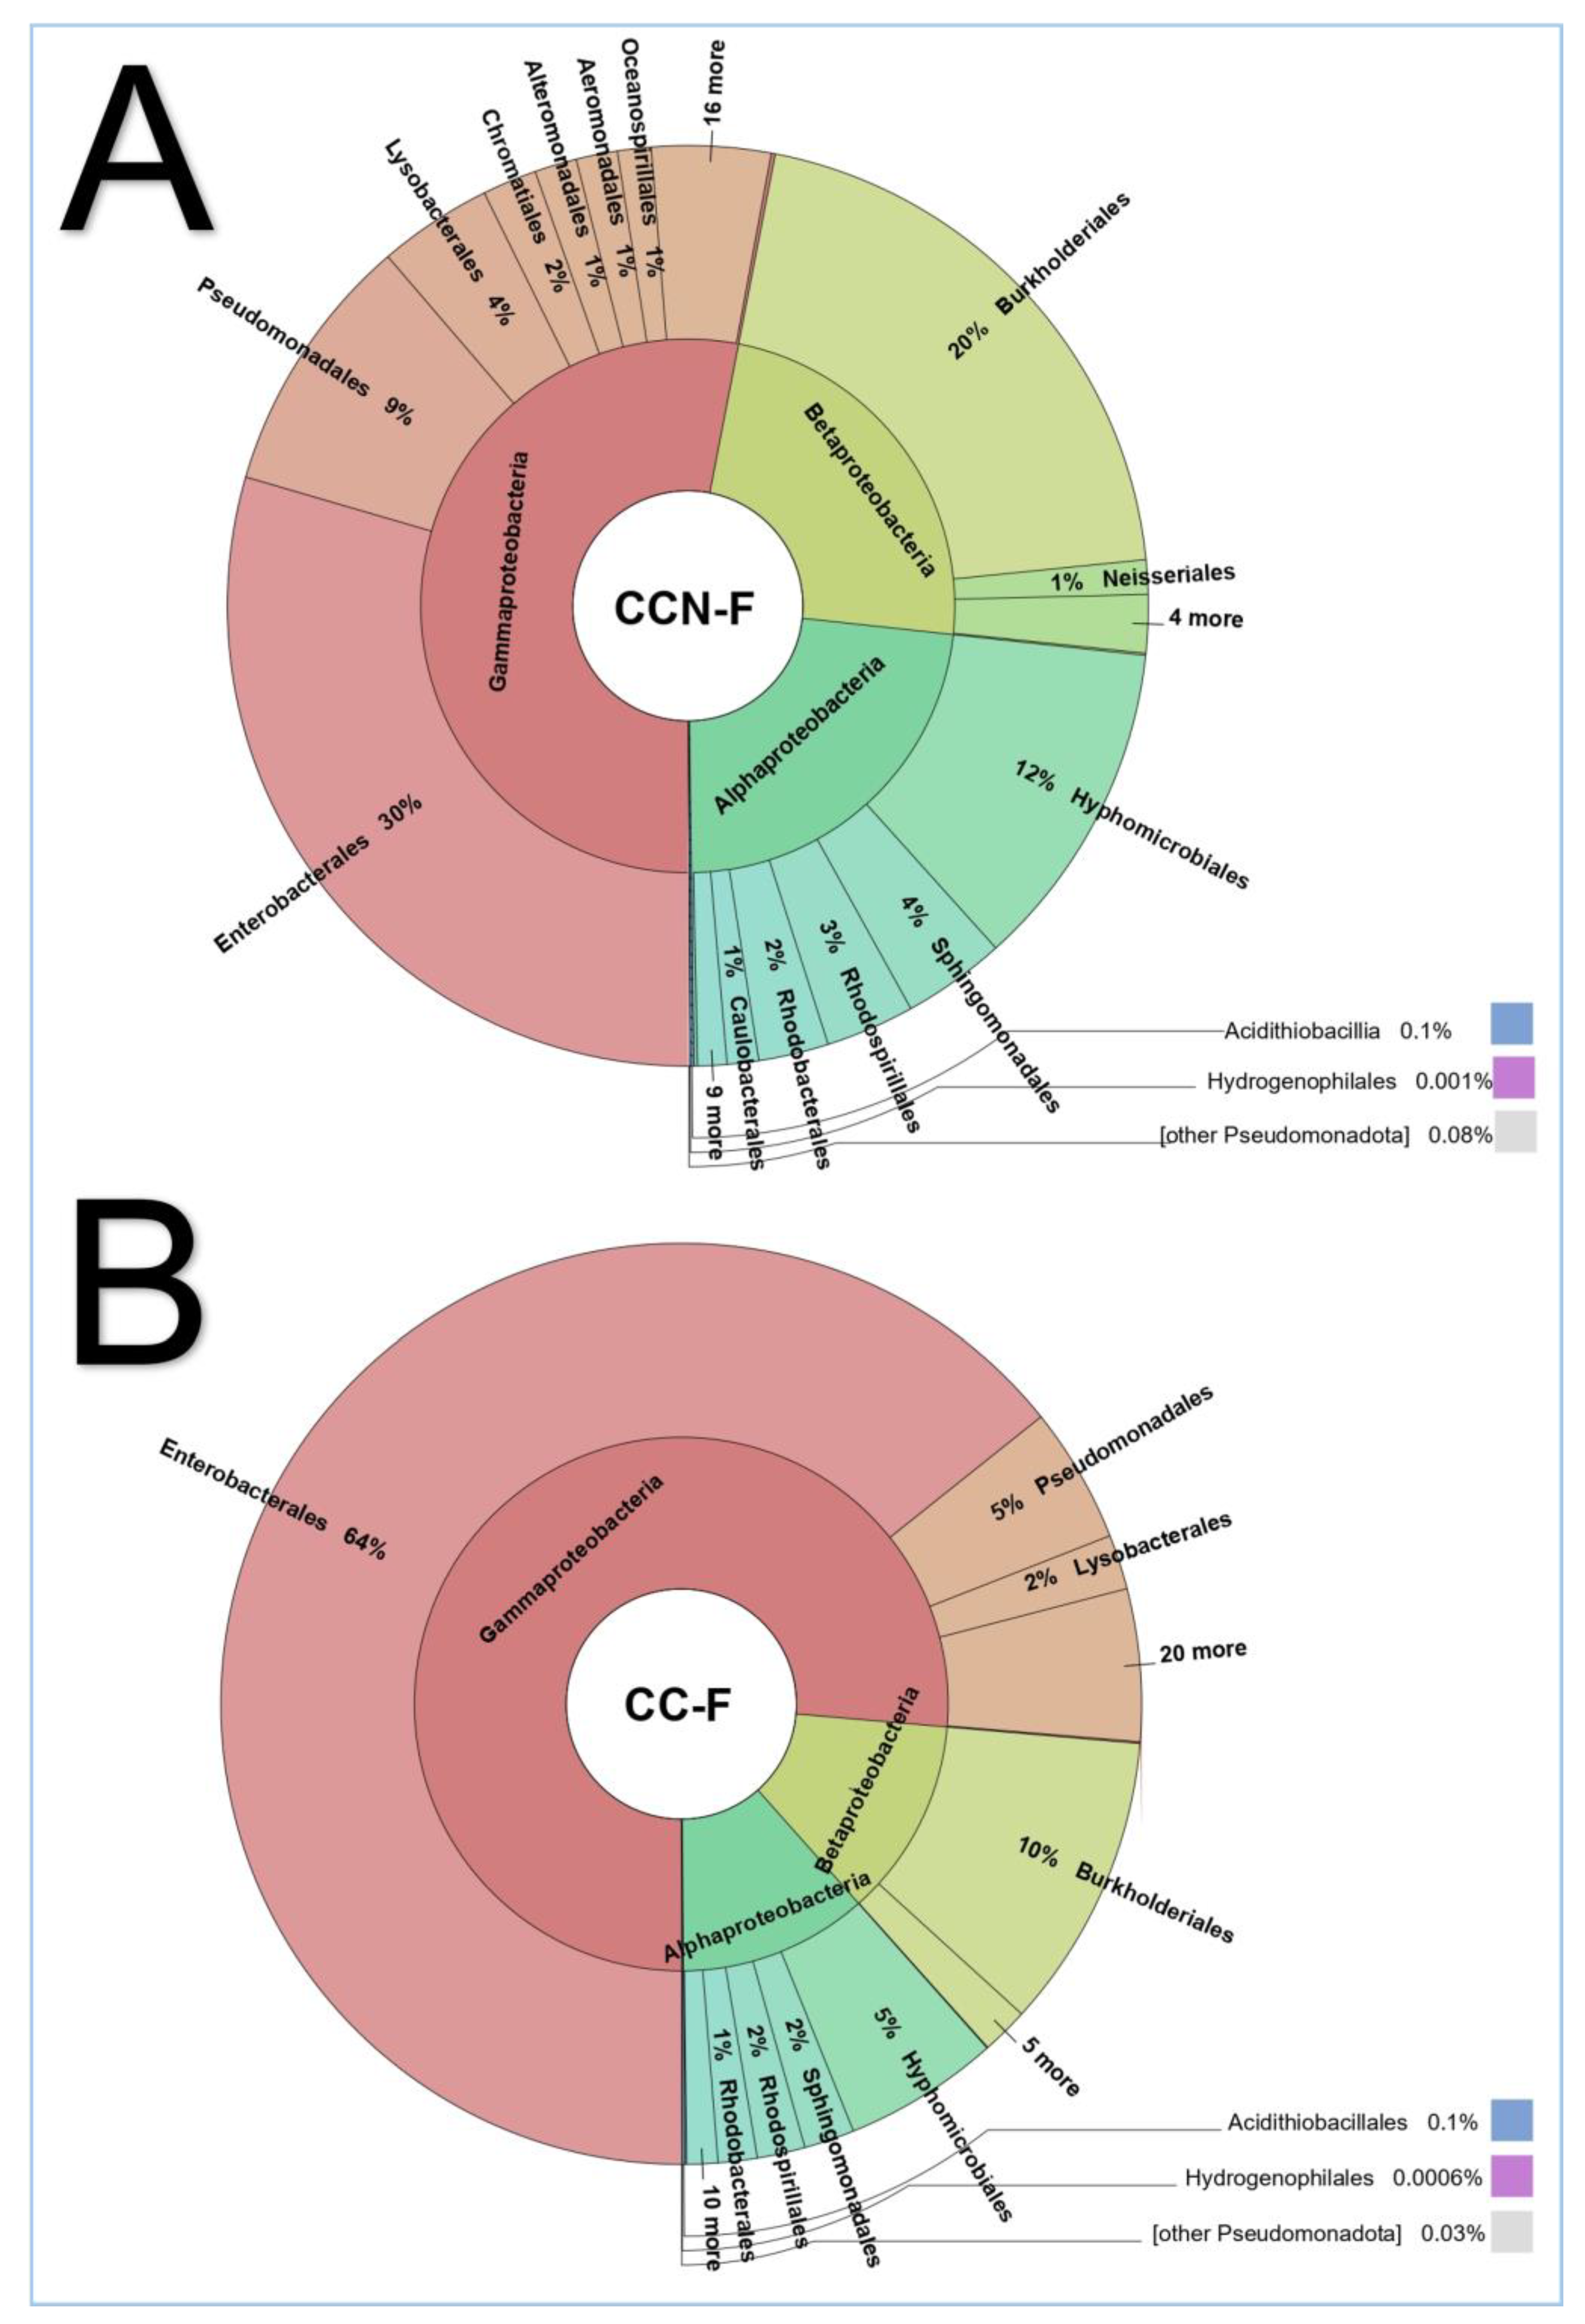
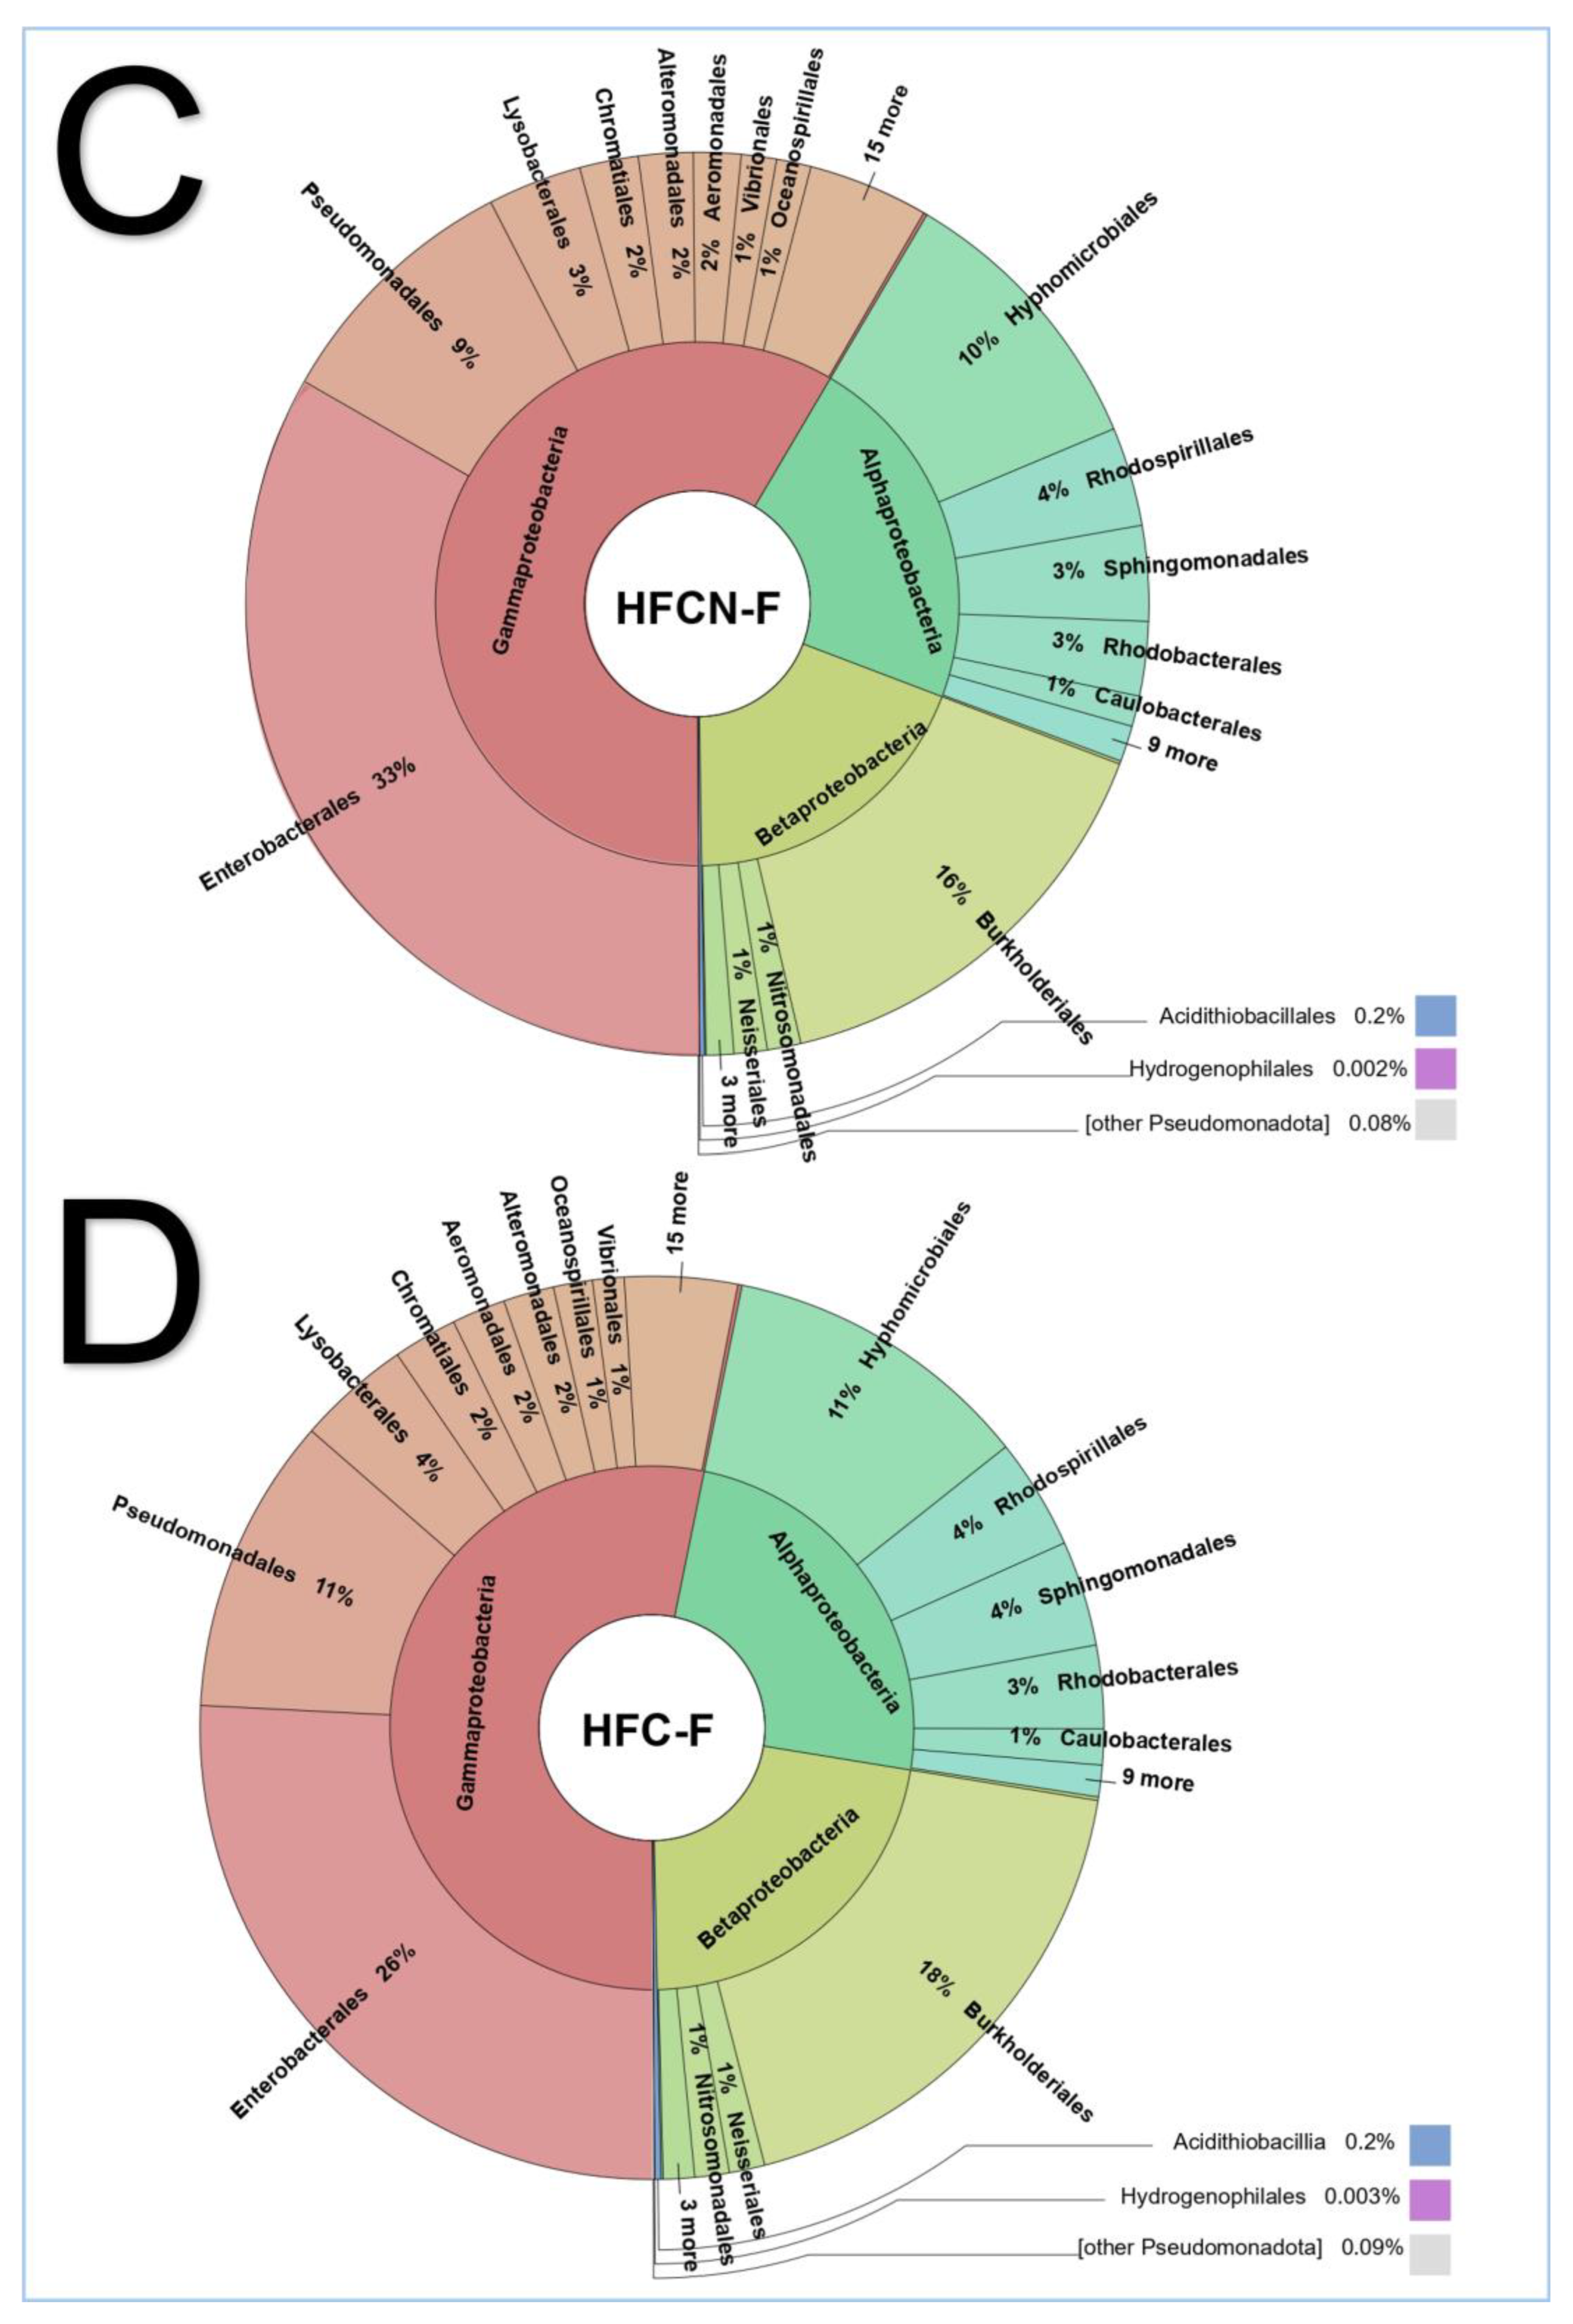
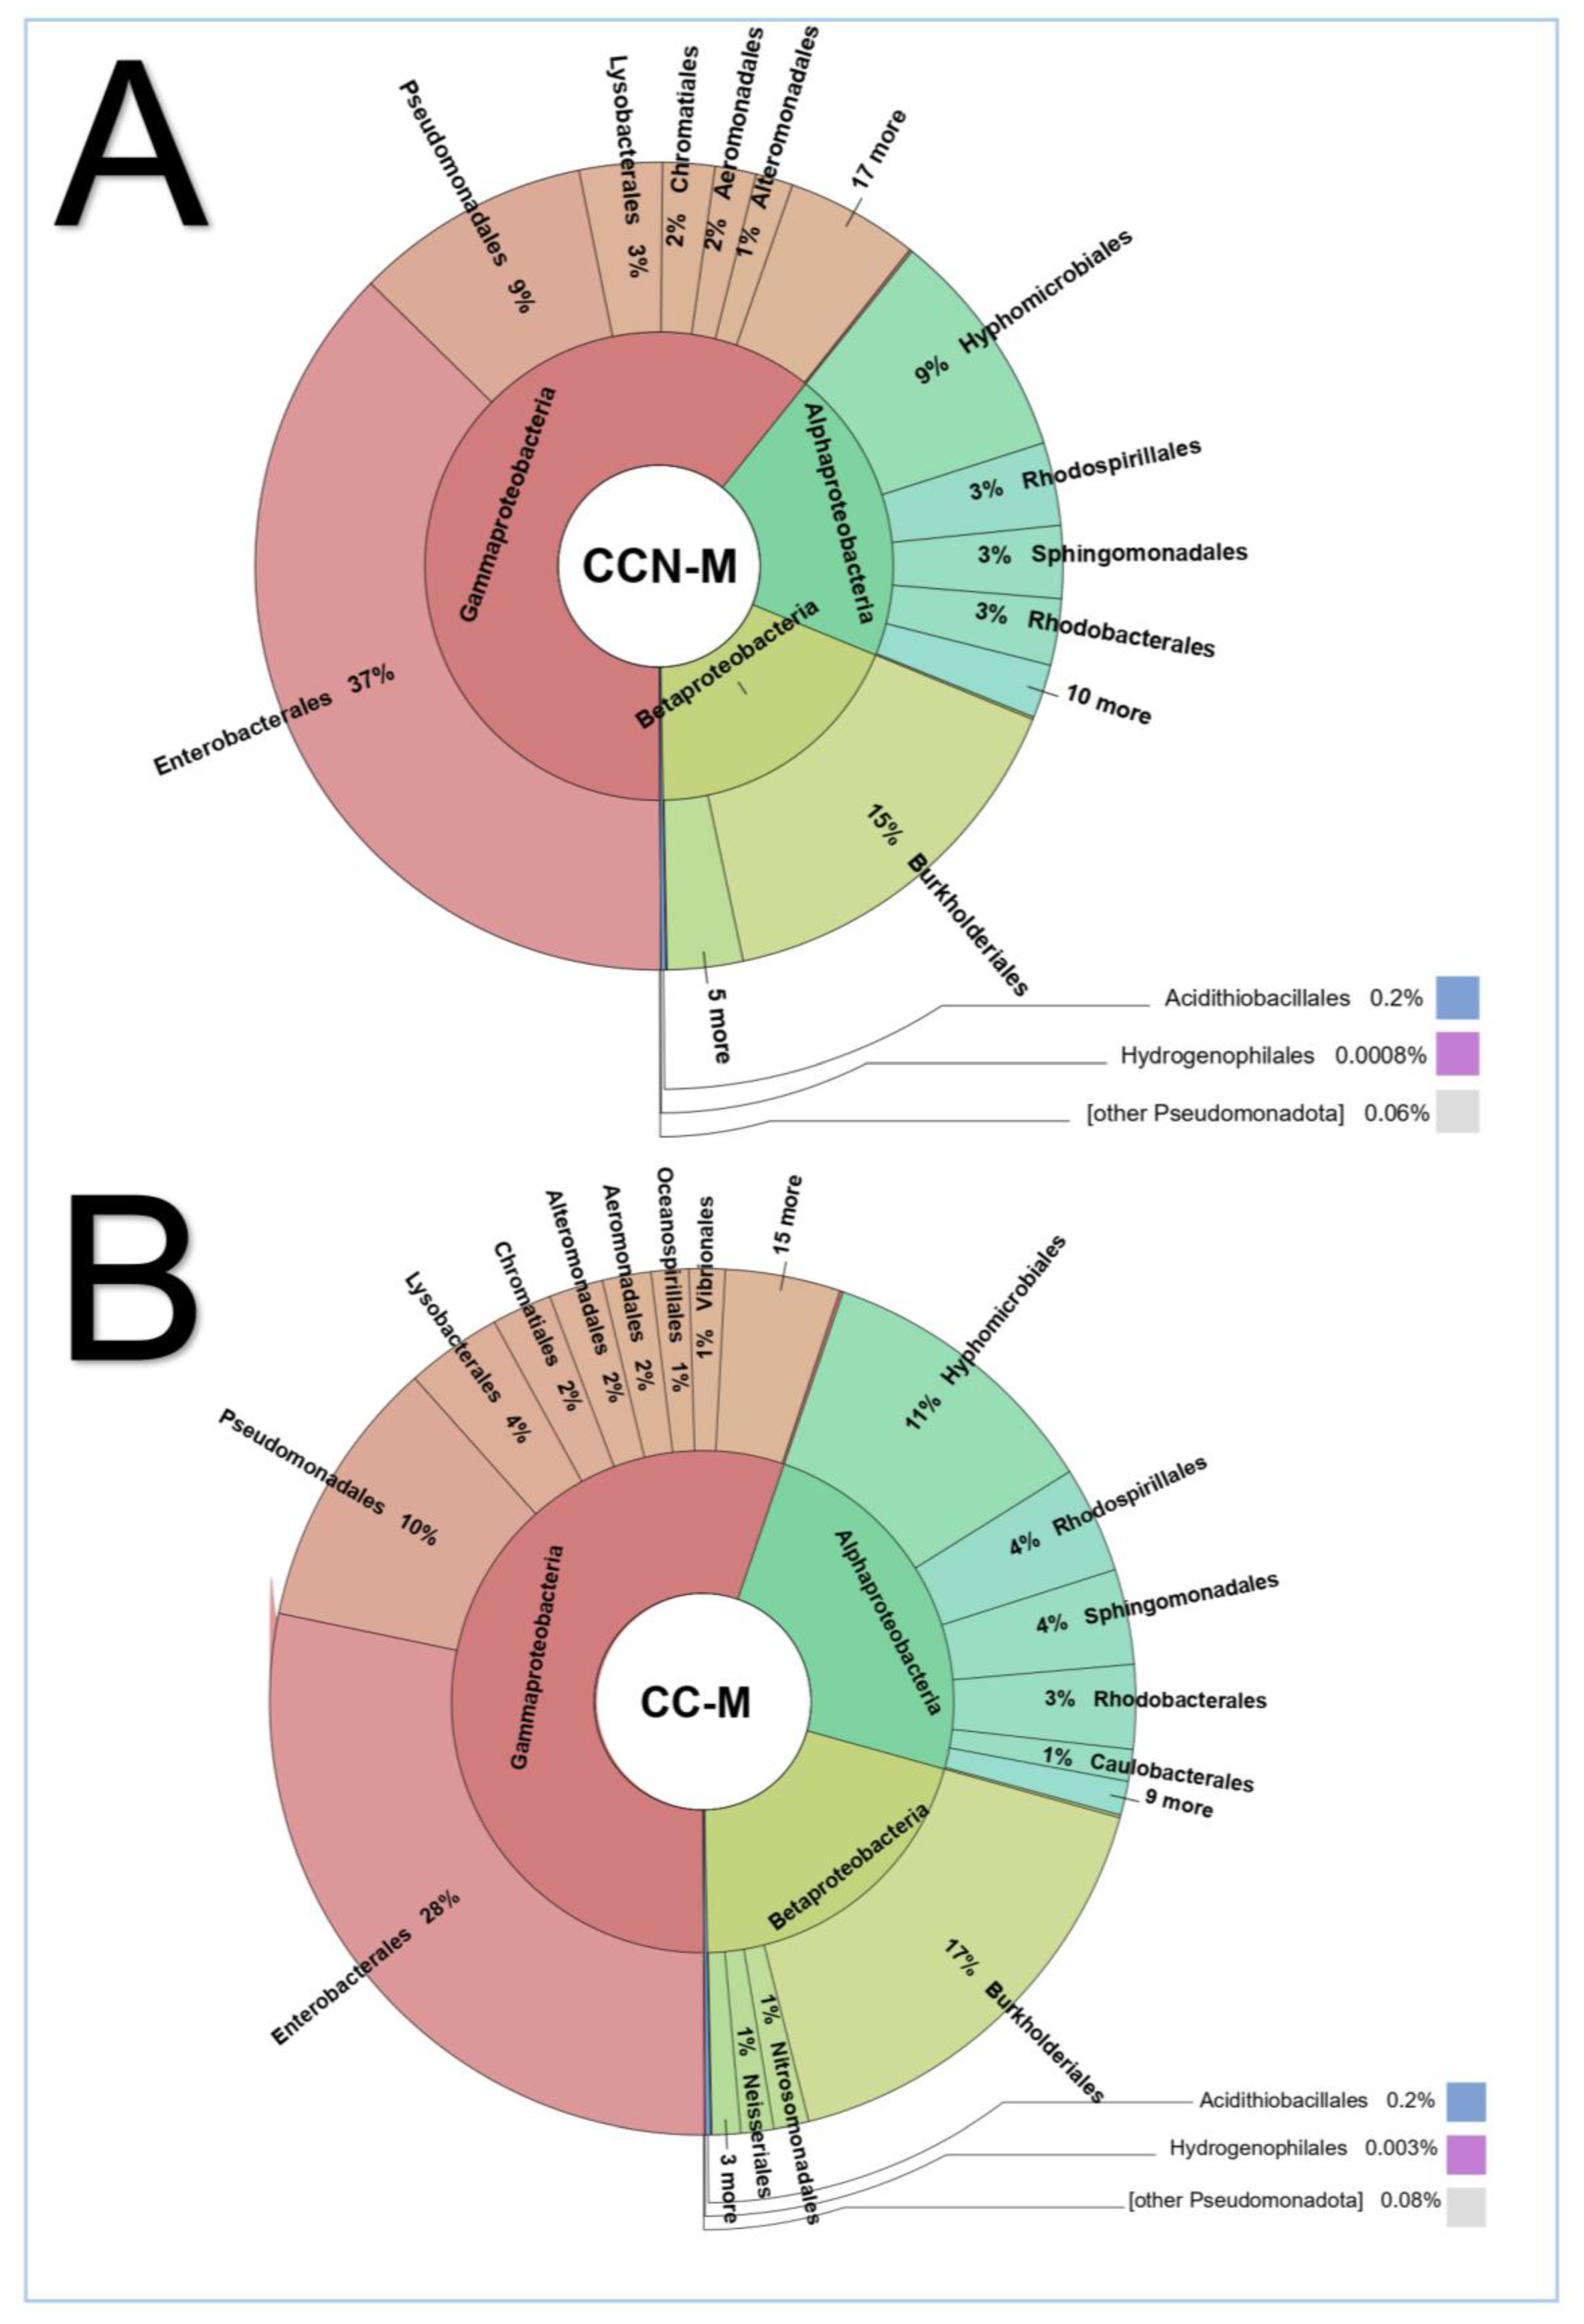
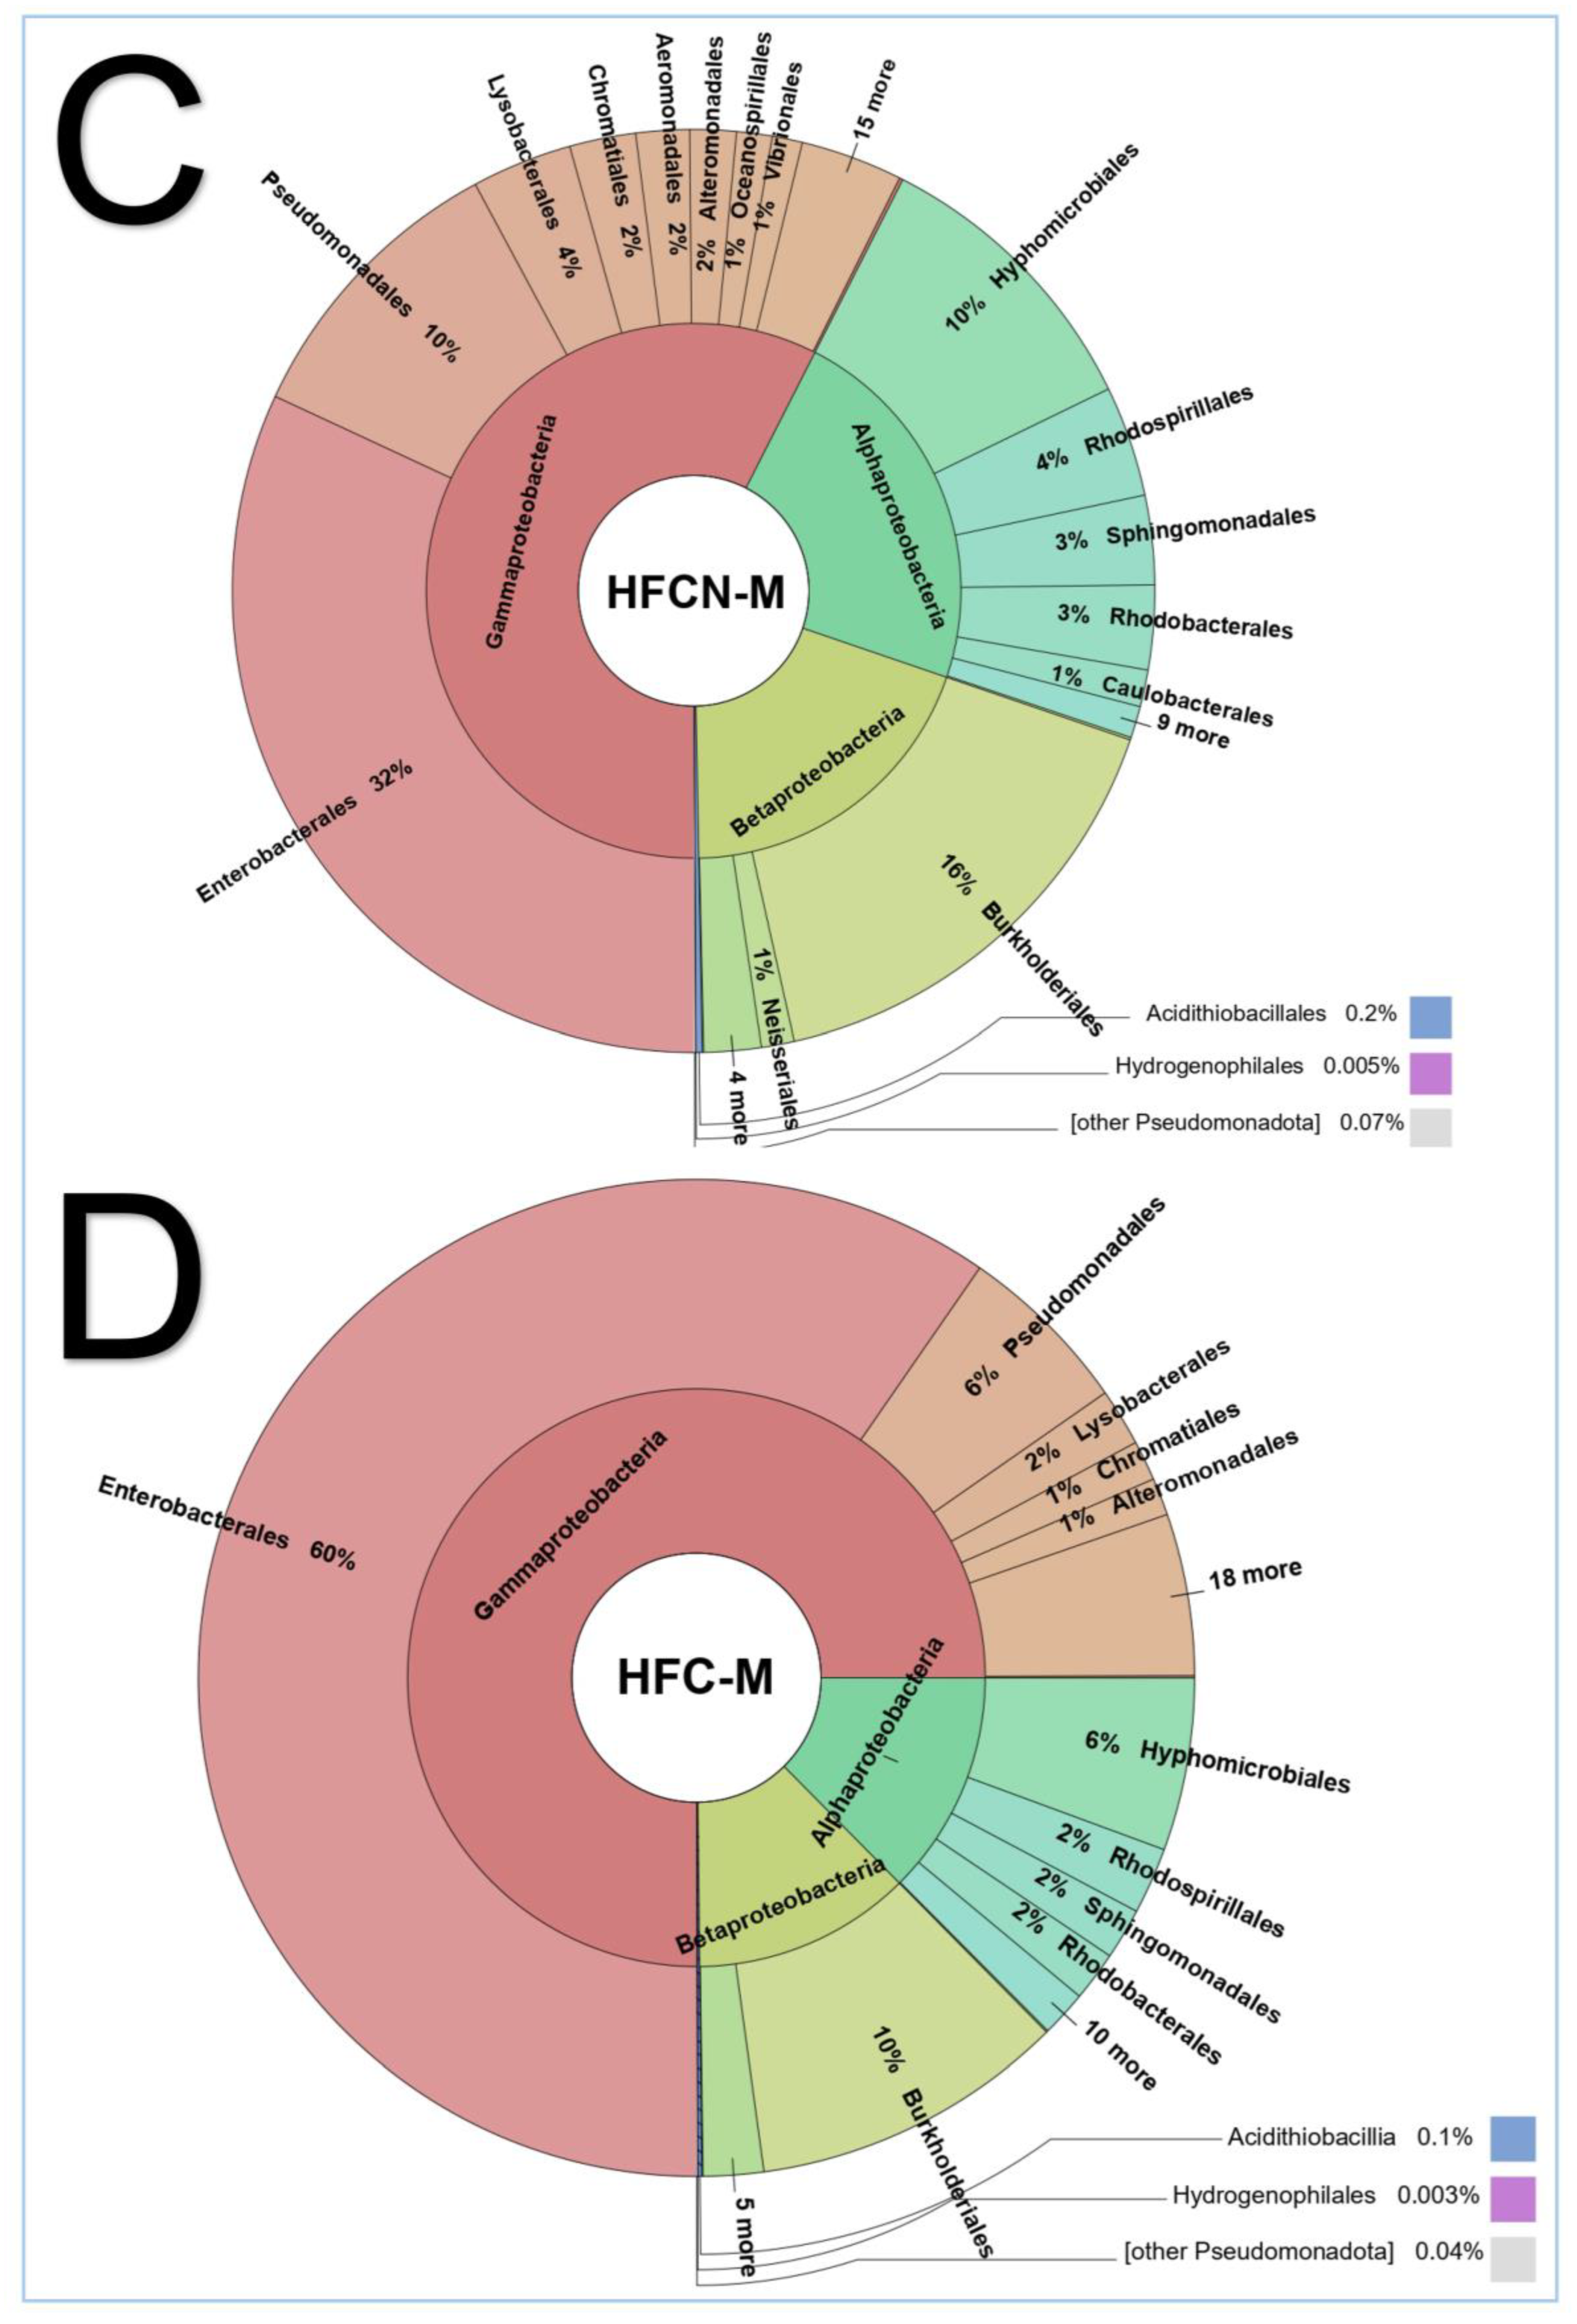
Among Pseudomonata, Gammaproteobacteria were more prevalent than Alphaproteobacteria and Betaproteobacteria across all samples (Figure 6 and Figure 7), exhibiting a notably higher abundance in CC-F (78% of Pseudomonata) (Figure 6B) and HFC-M (77% of Pseudomonata) (Figure 7D). The order Enterobacterales was the most dominant in all groups, with a substantial relative proportion in both CC-F (Figure 6B) and HFC-M (Figure 7D), followed subsequently by Burkholderiales.

3.3.4. Sex-Dependent Variation in Coriobacteriia Within Actinomycetota Across Treatment Groups

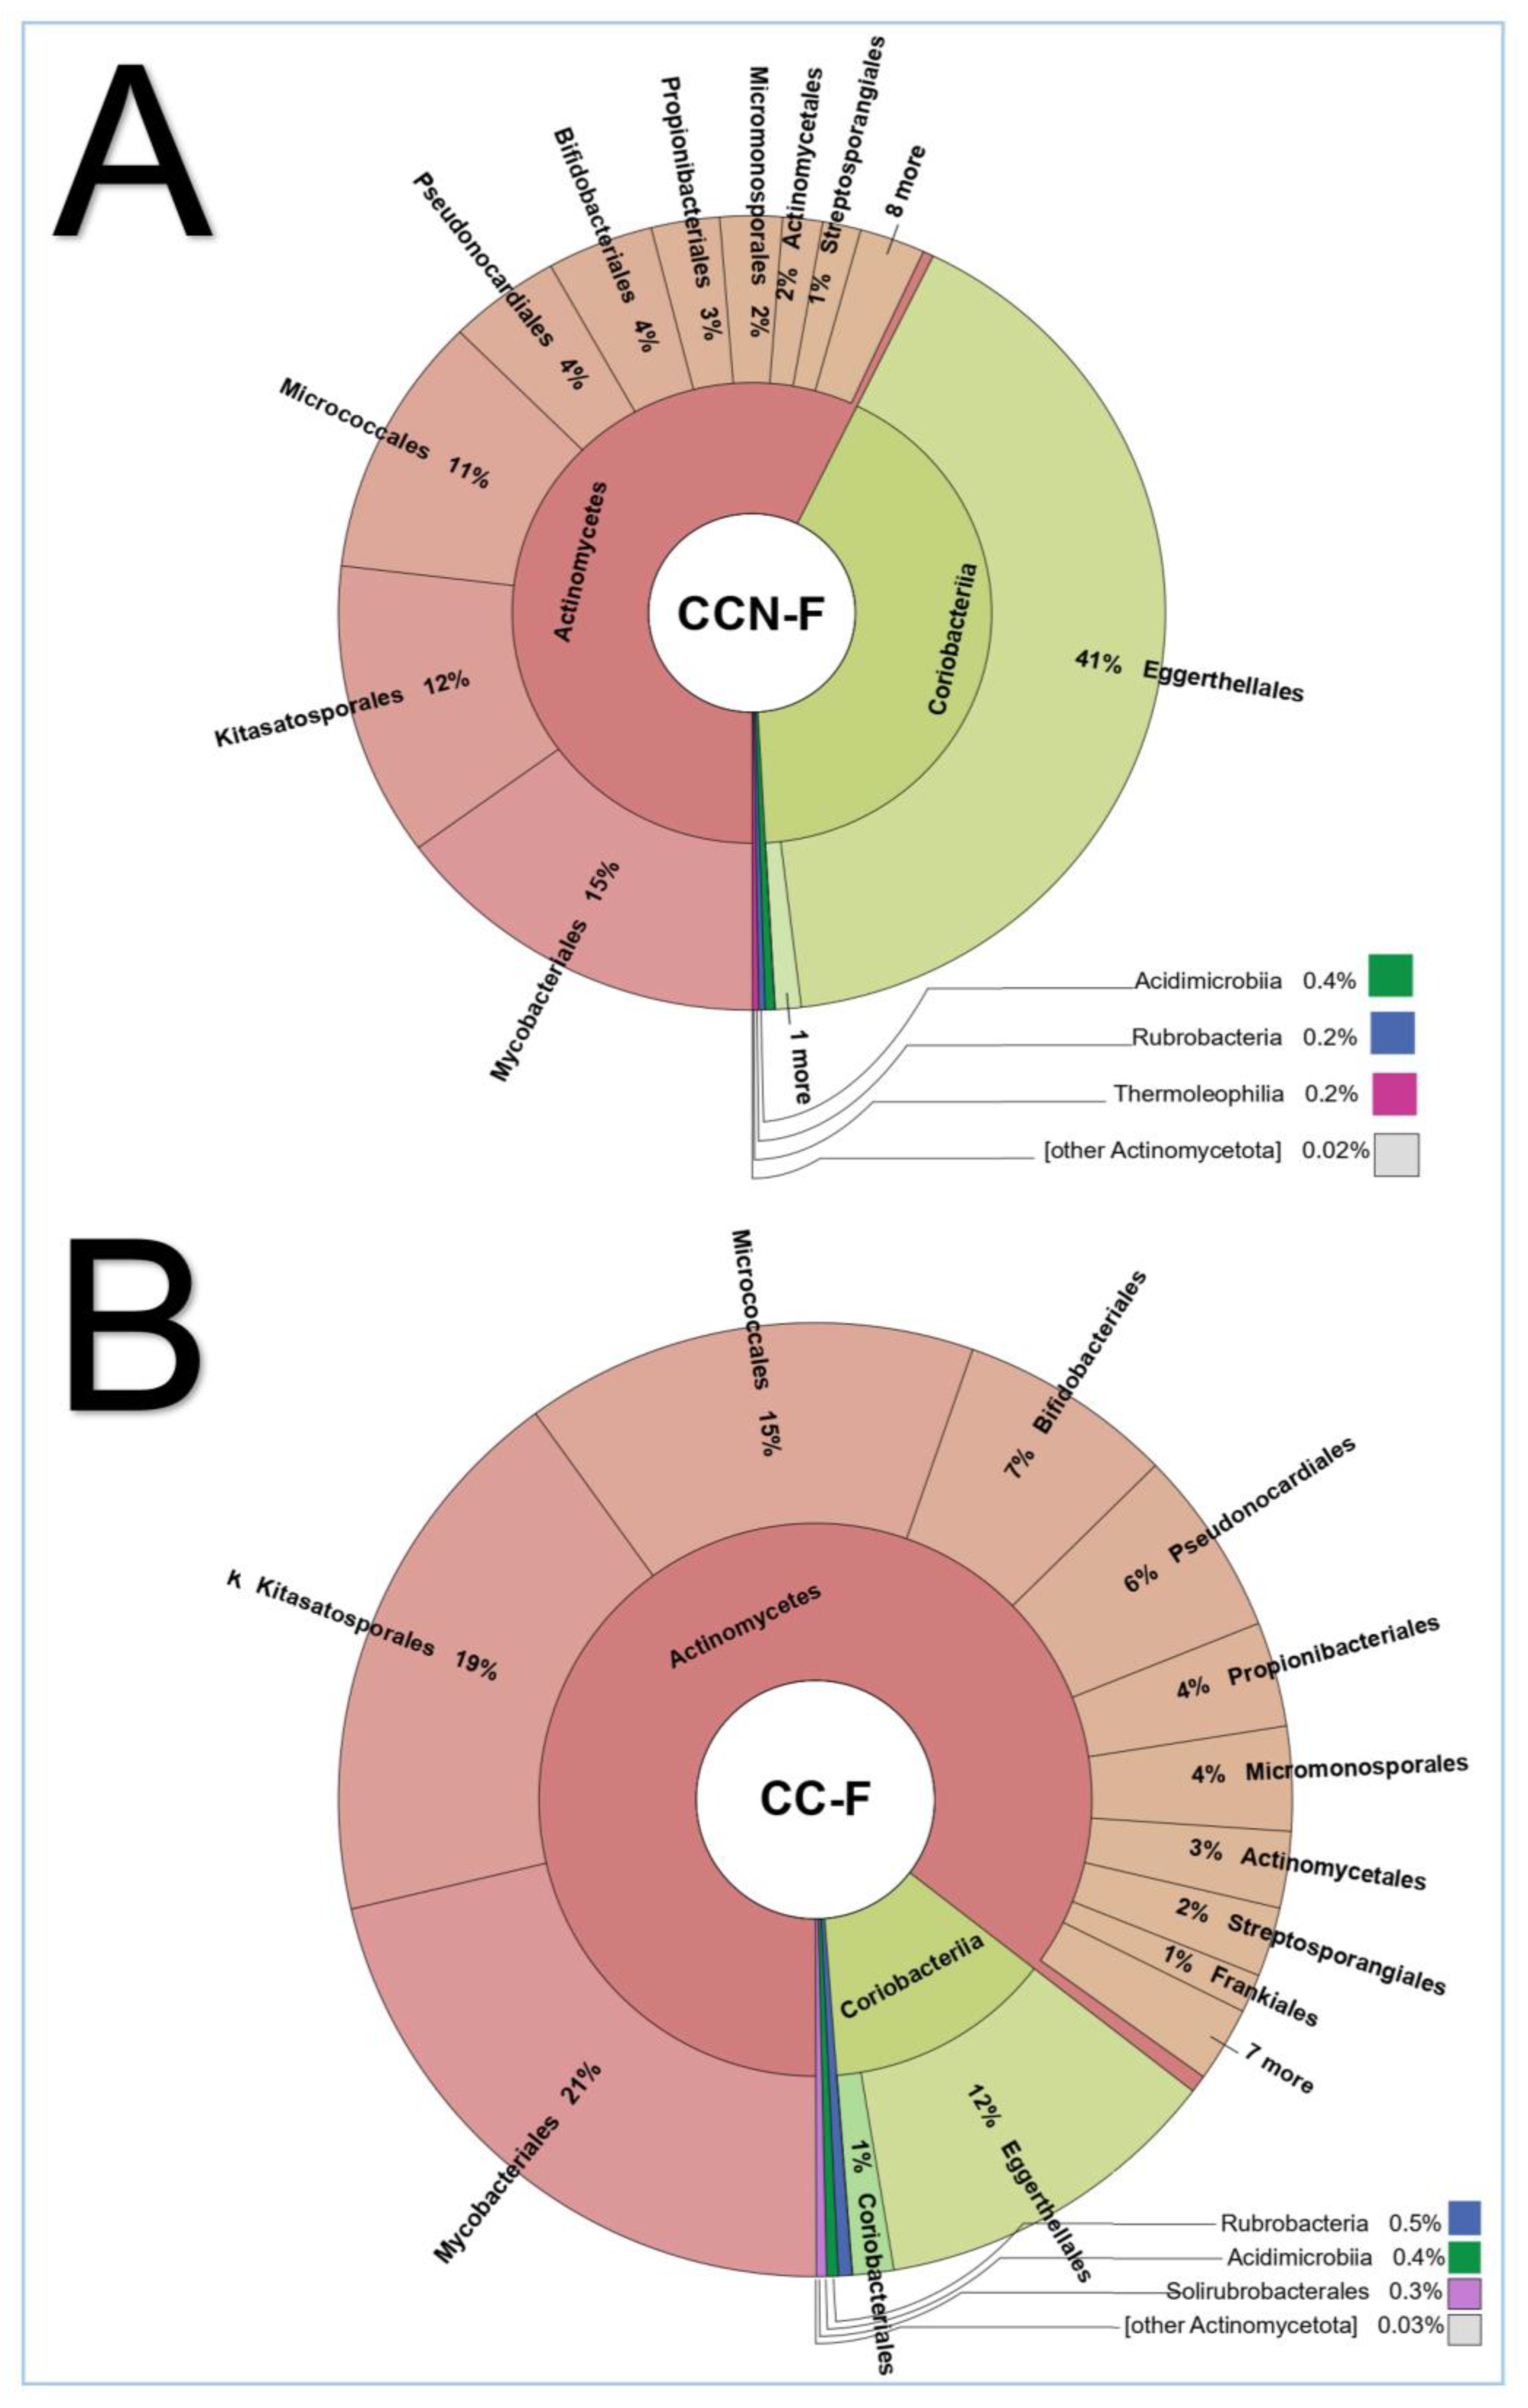
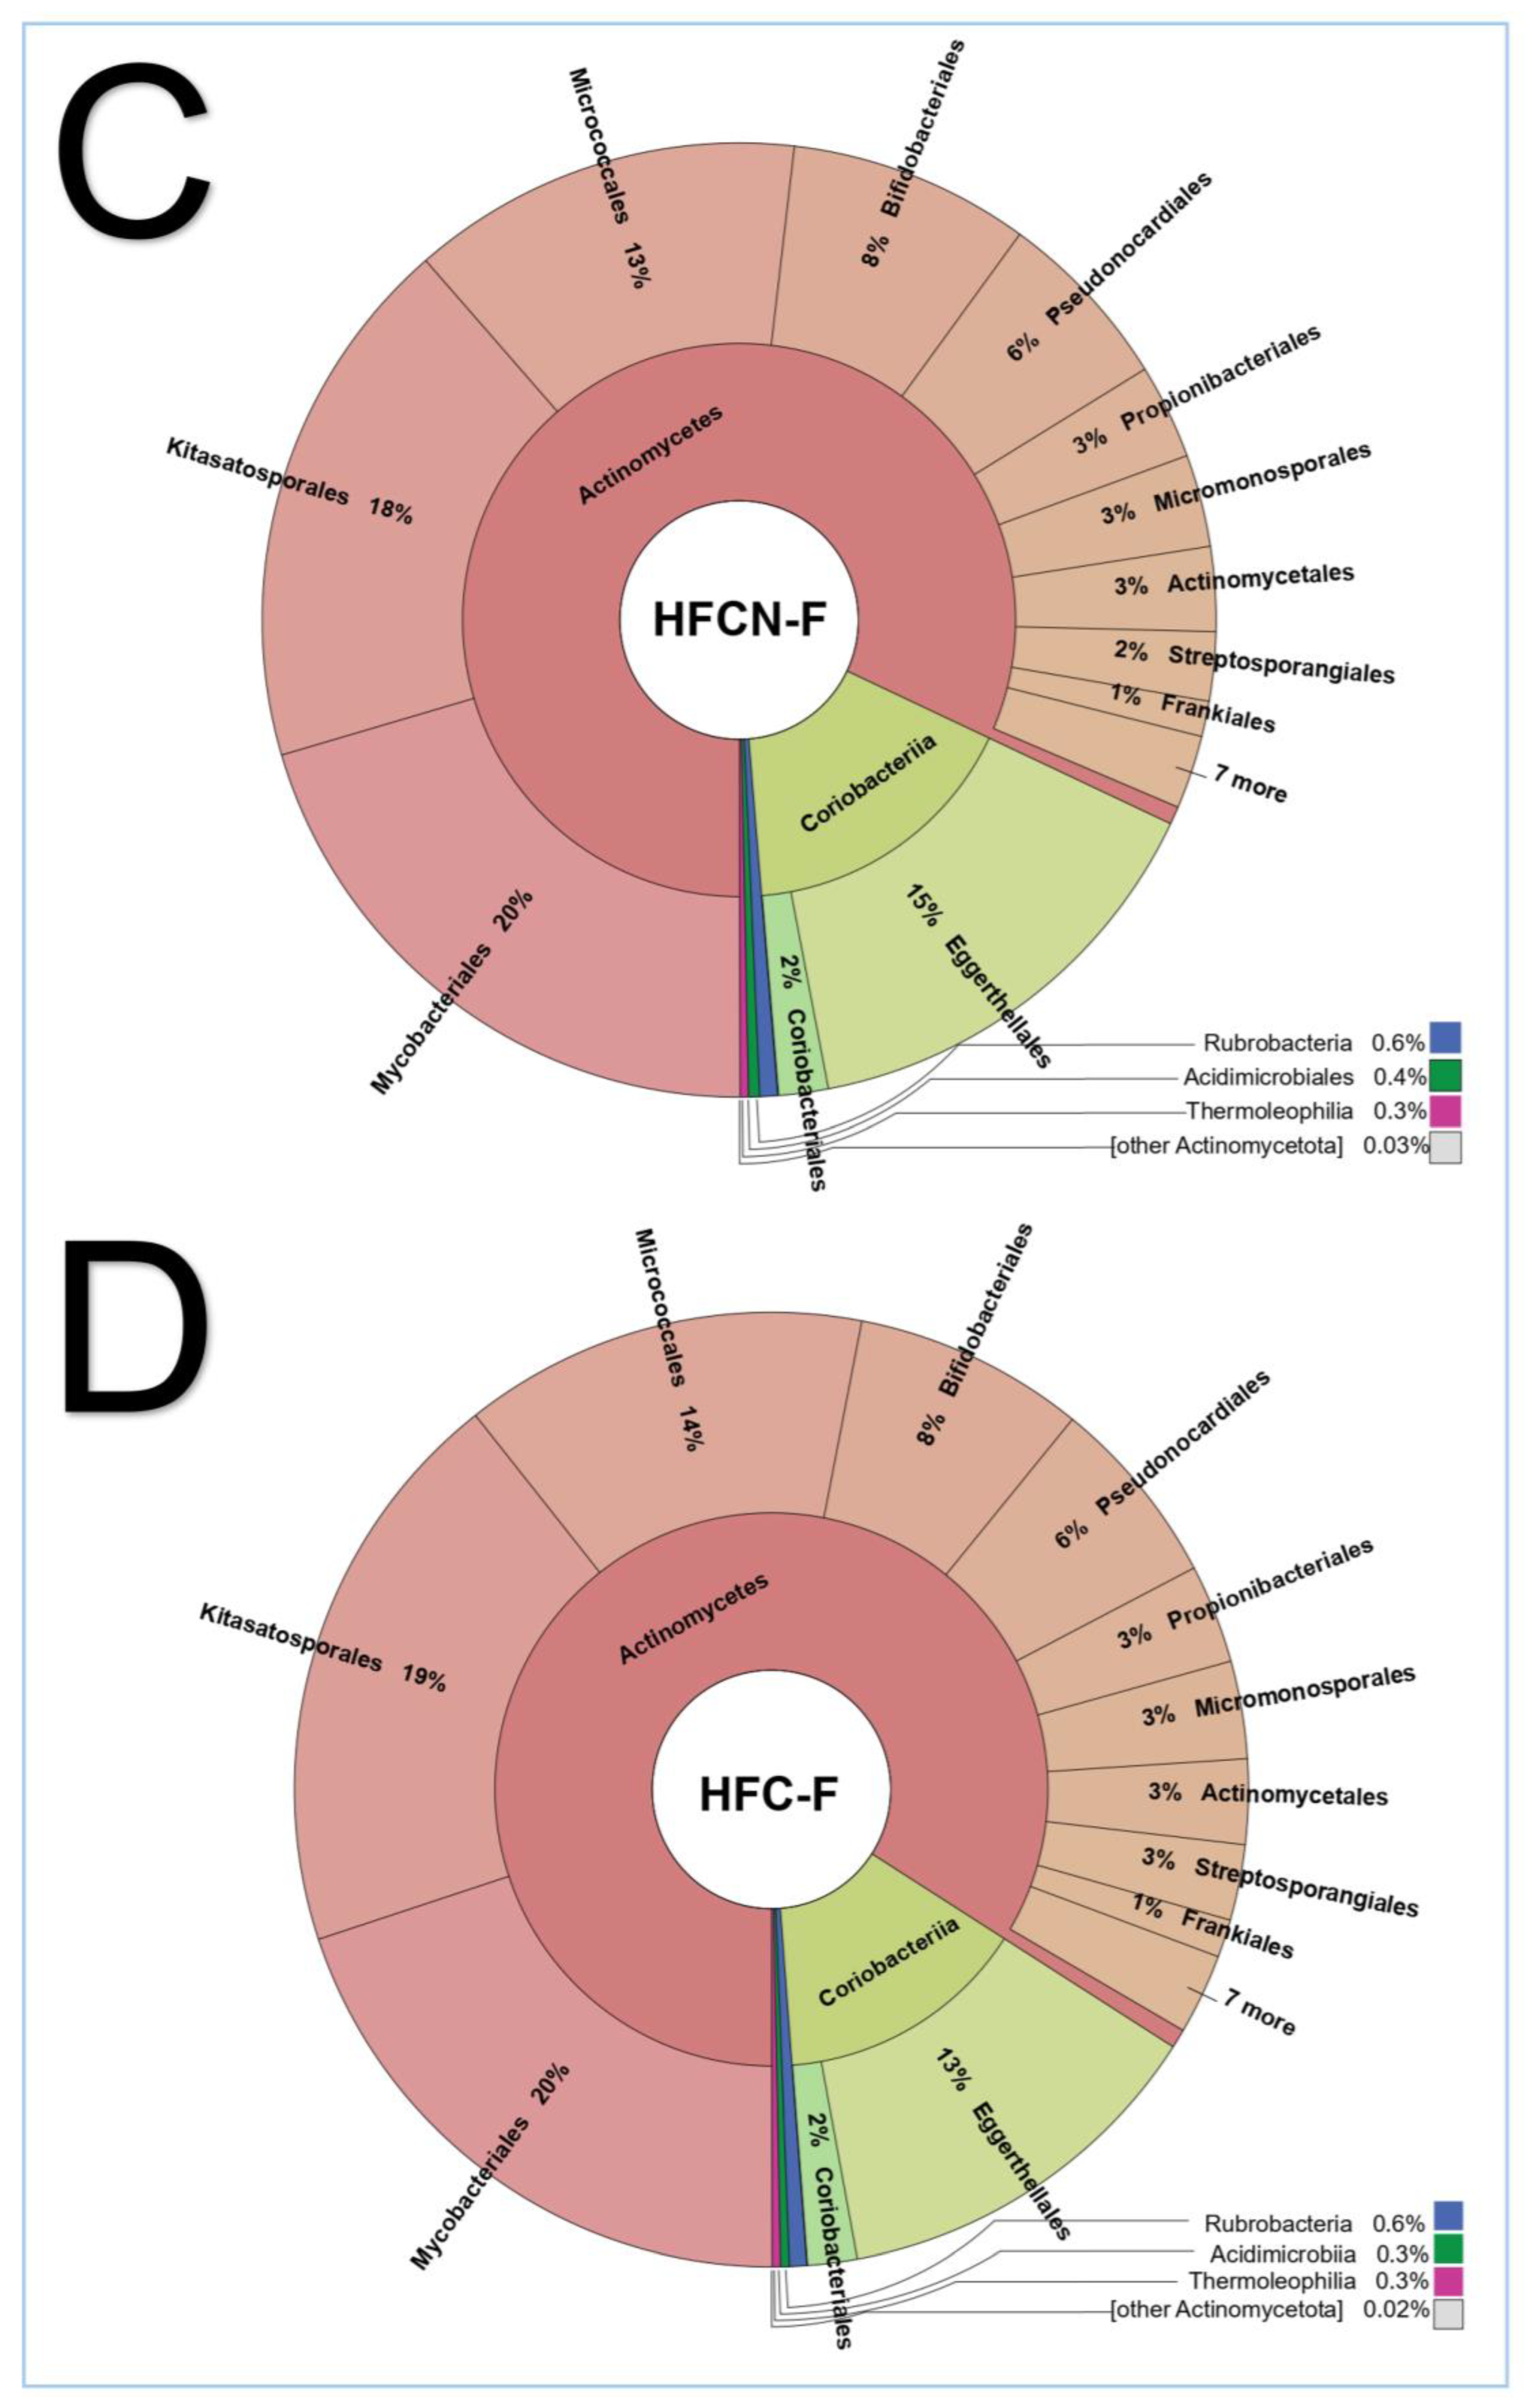
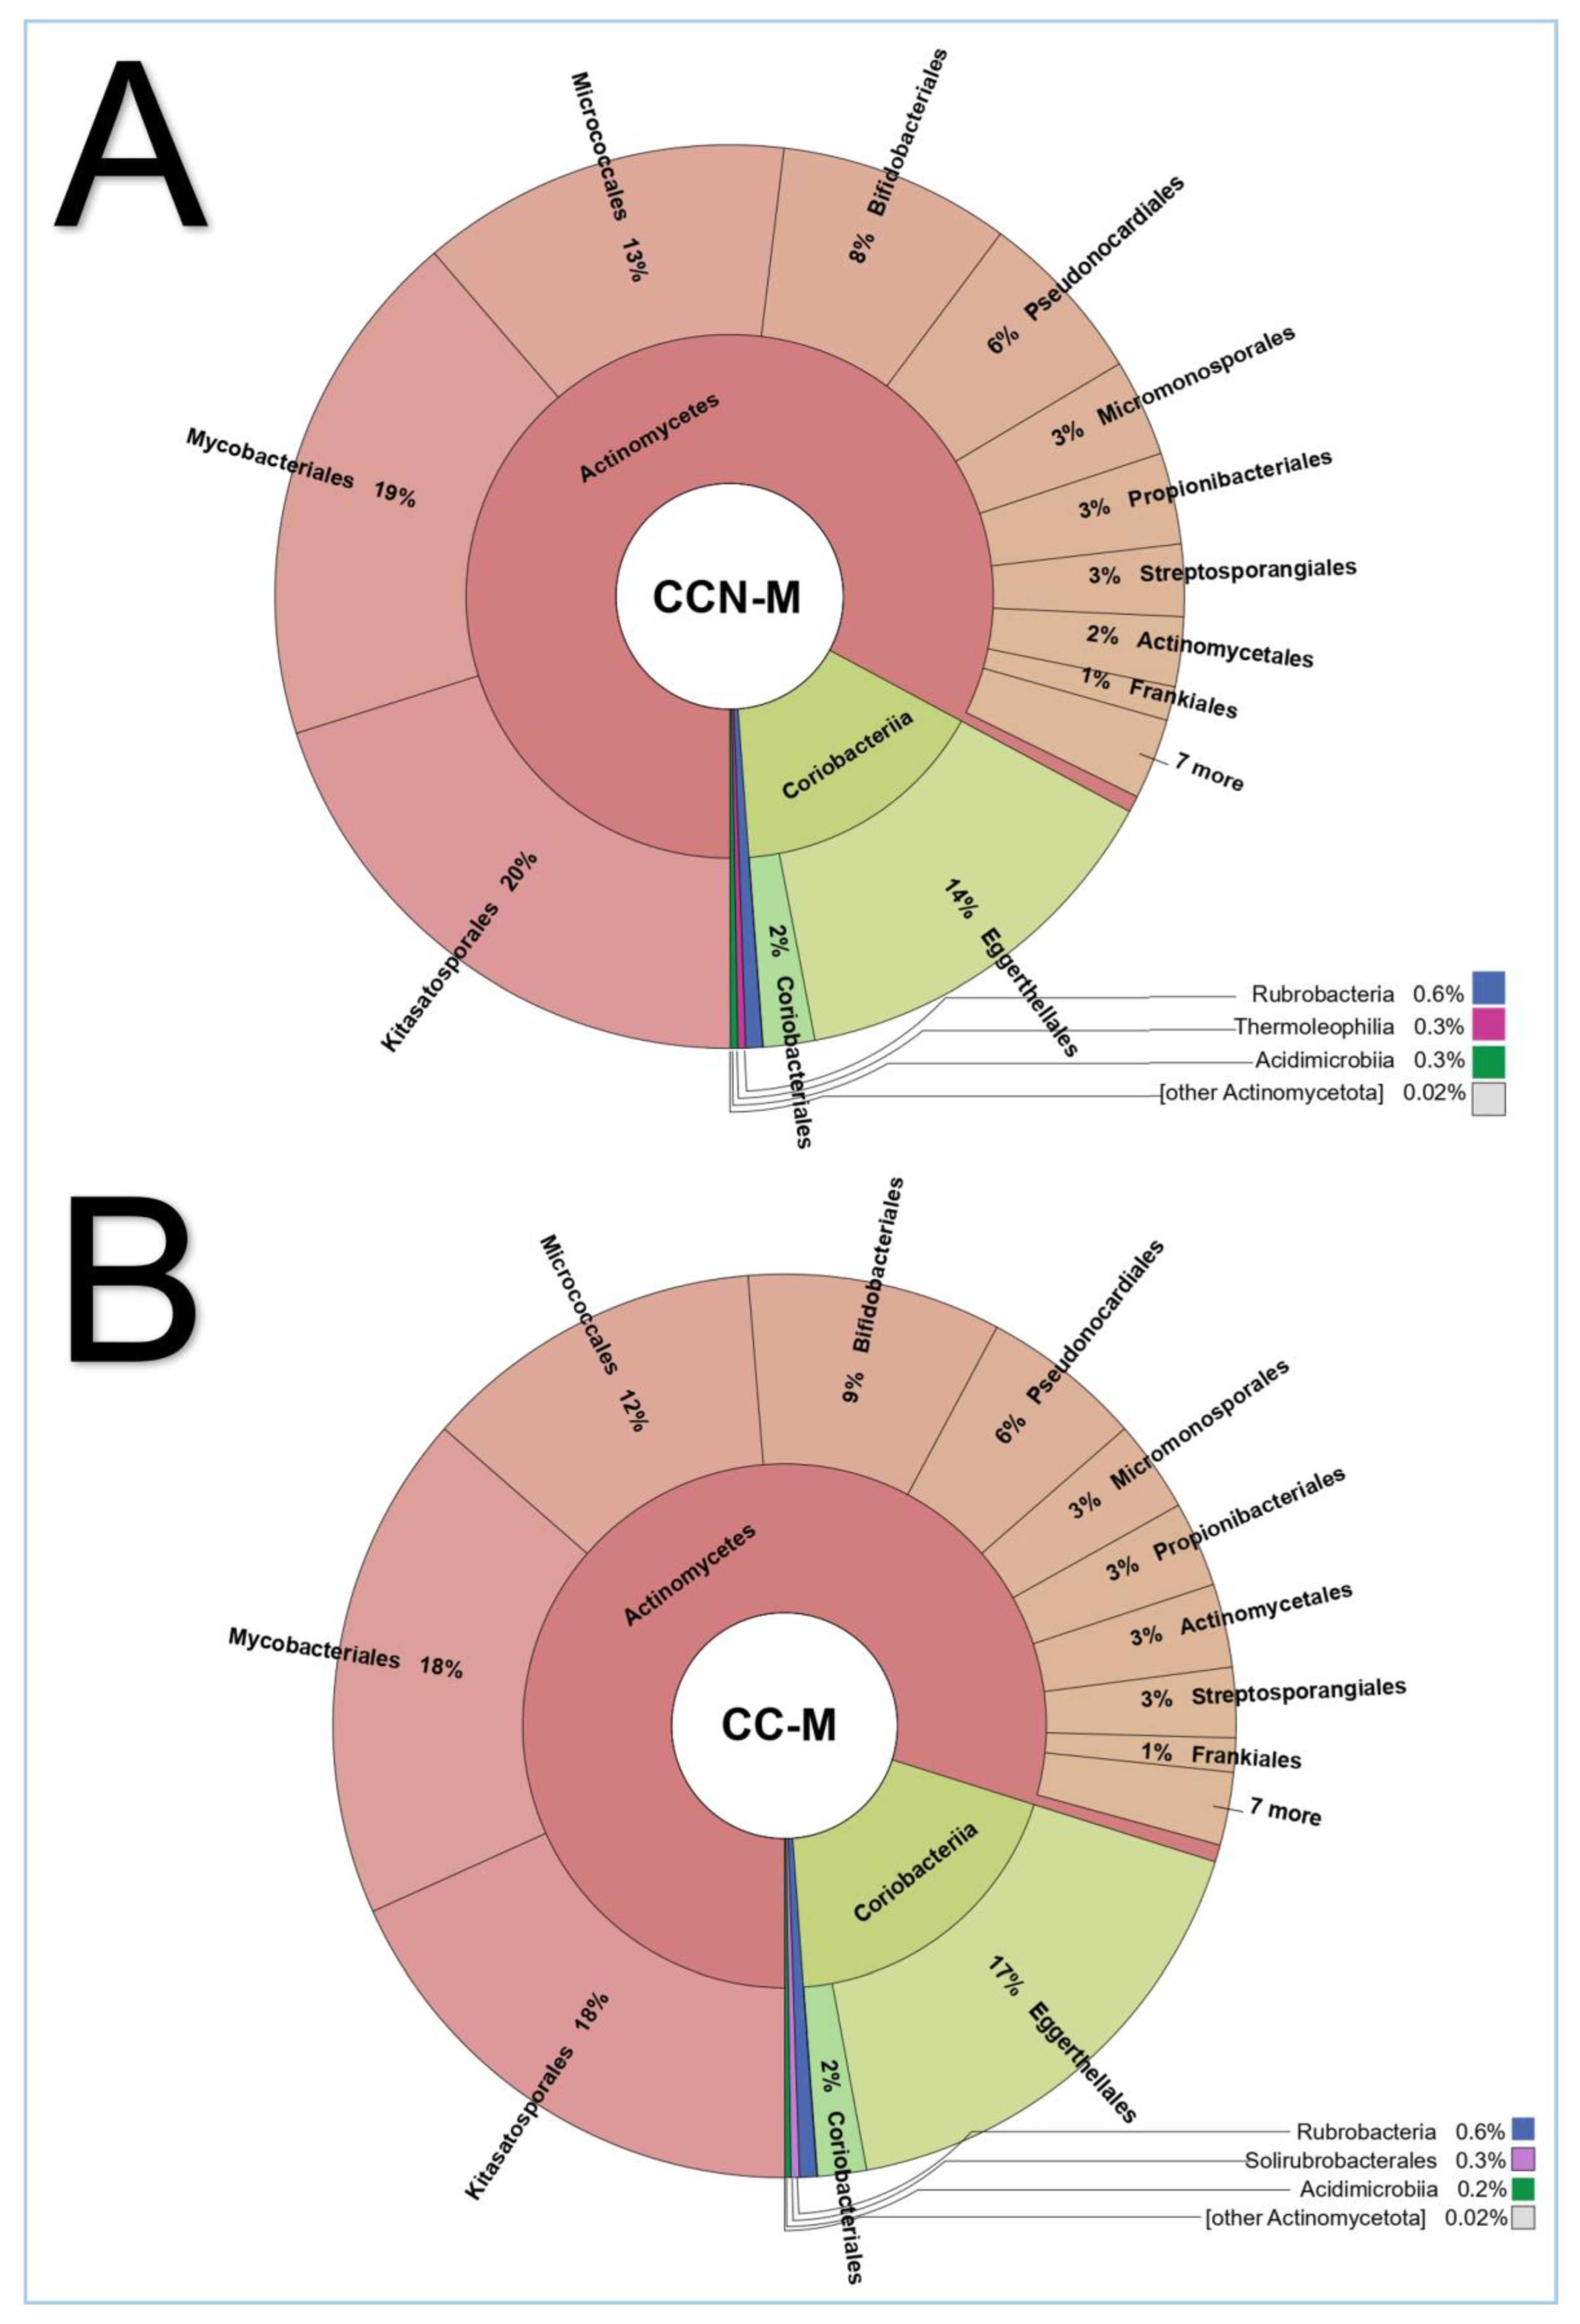
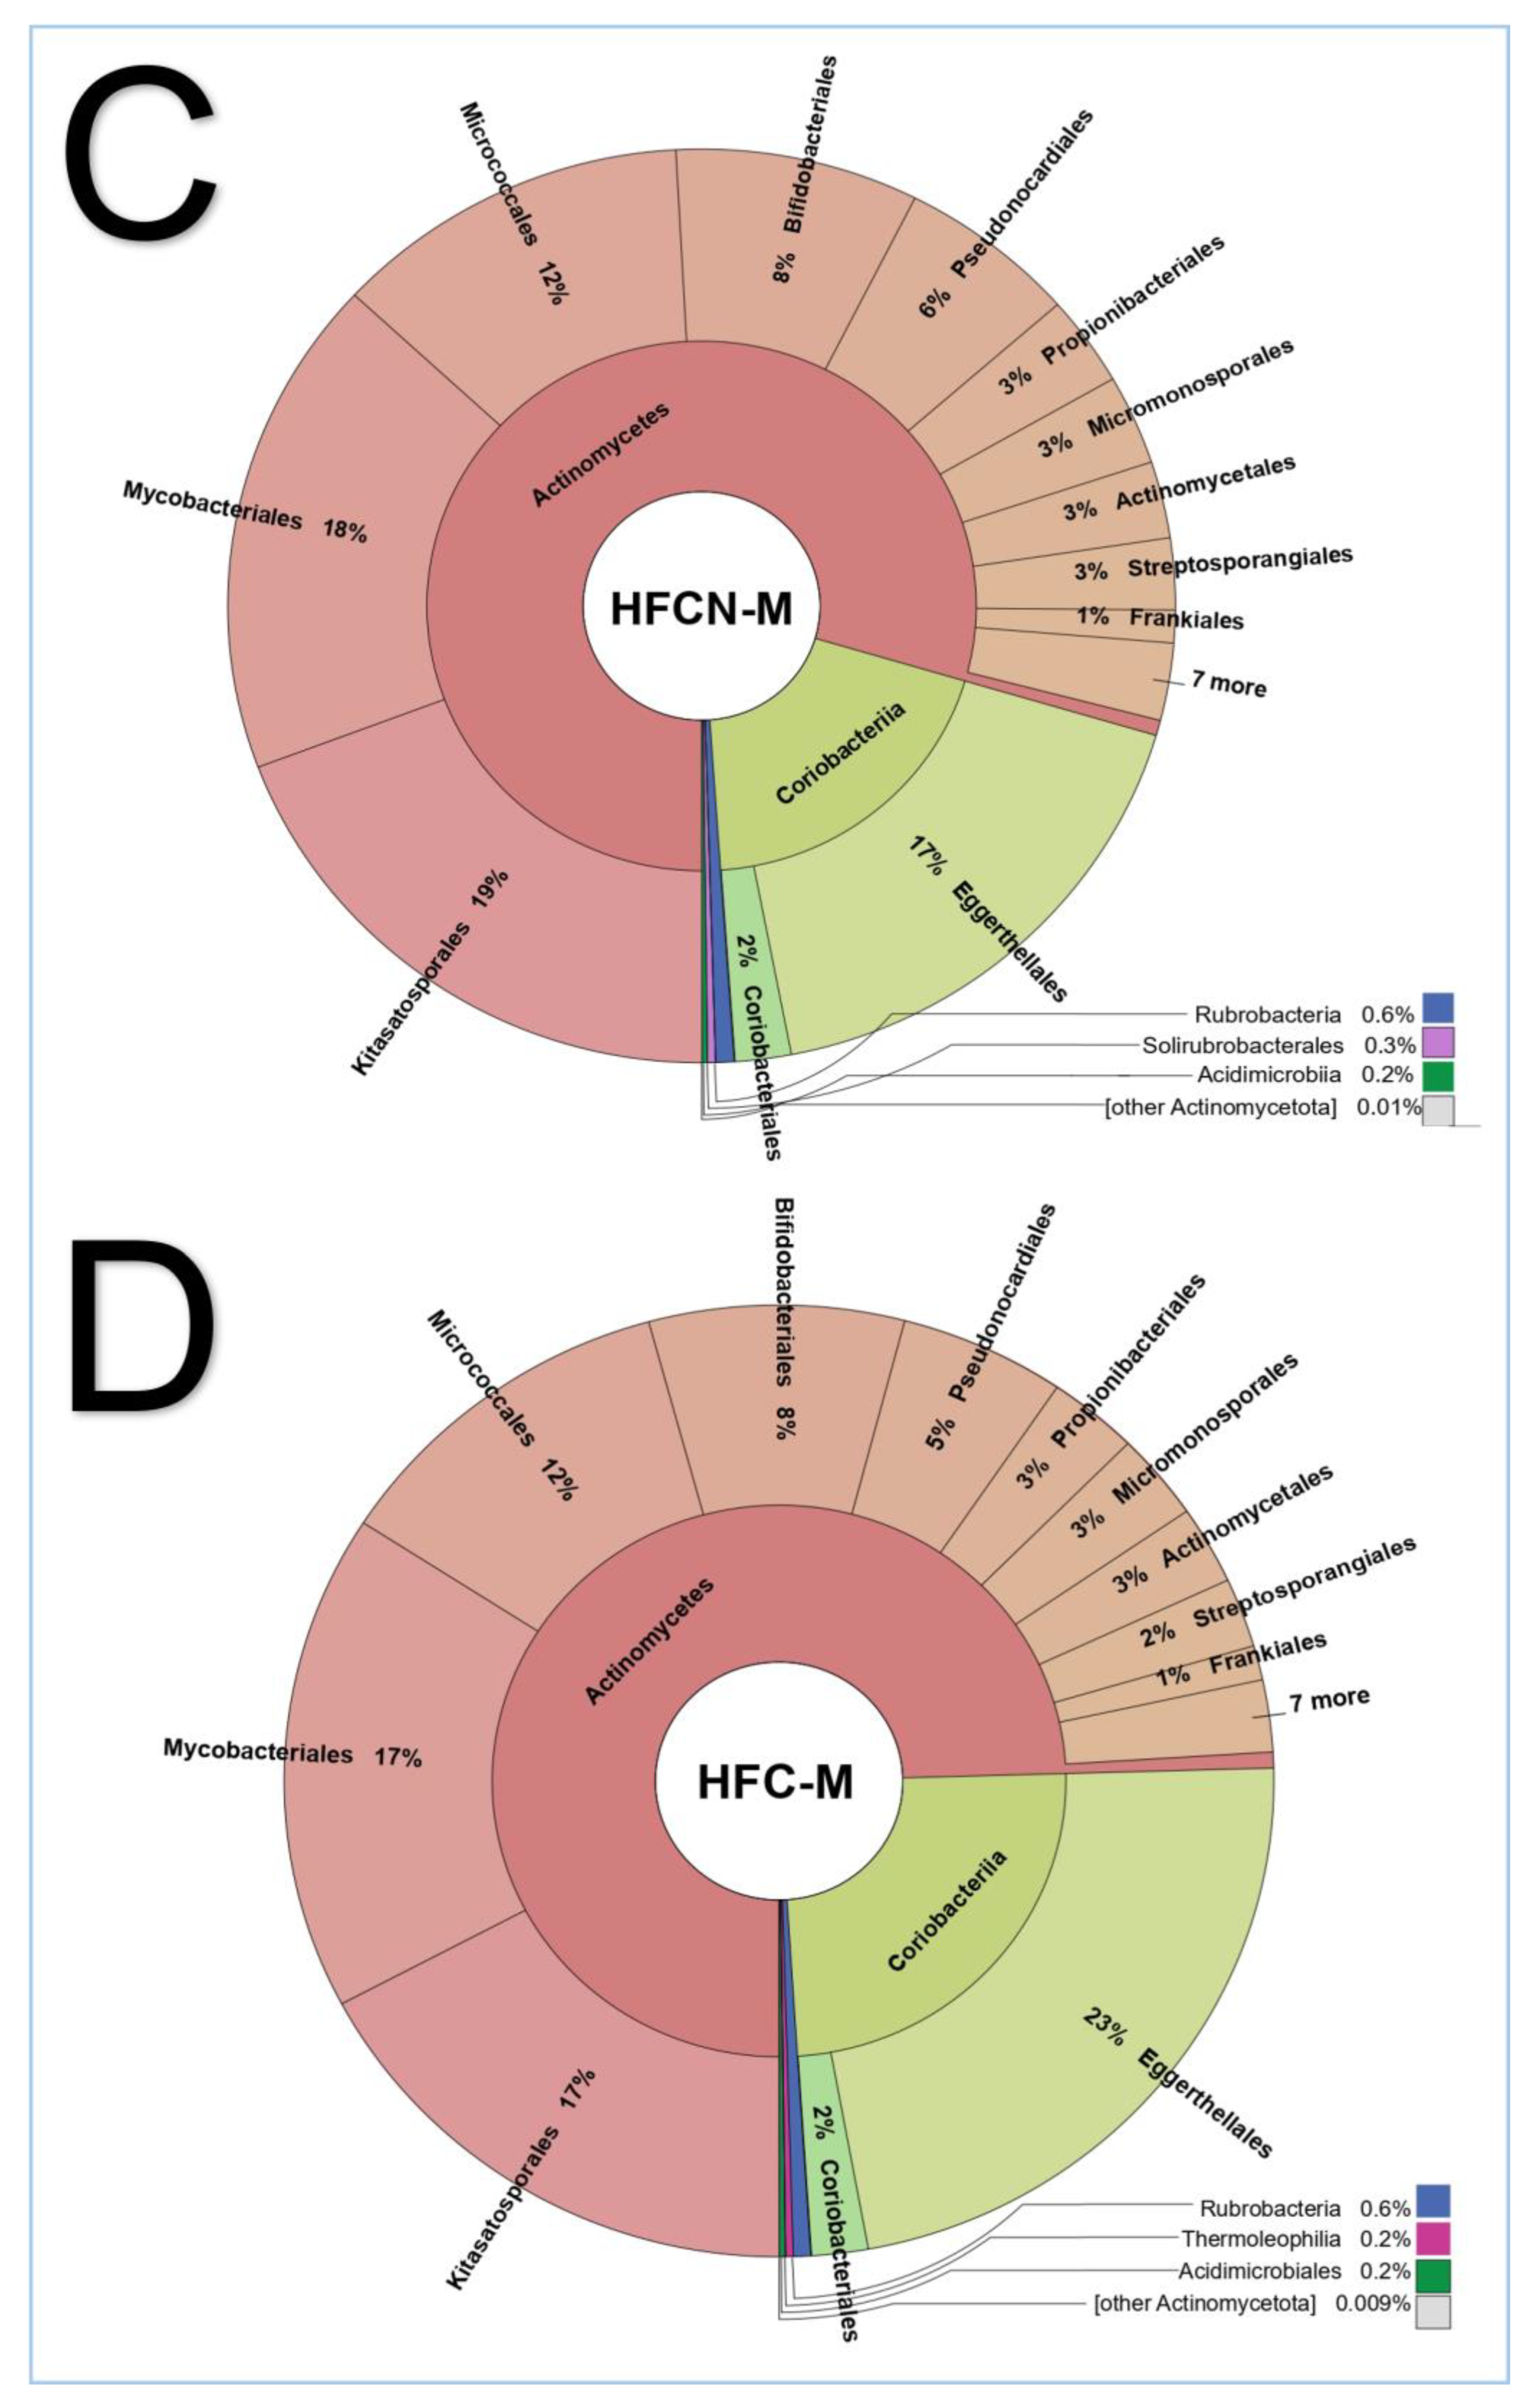
While Actinomycetota were primarily composed of Actinomycetes and Coriobacteriia (Figure 8 and Figure 9), the CCN-F group exhibited a higher proportion of Coriobacteriia compared to other groups (Figure 8A). Among females, Eggerthellales were the predominant order across all the samples (Figure 8A–D). Similarly, males exhibited the same bacterial abundance as females (Figure 9), except for the group CCN, where females had a higher proportion of Coriobacteriia (Figure 8A).

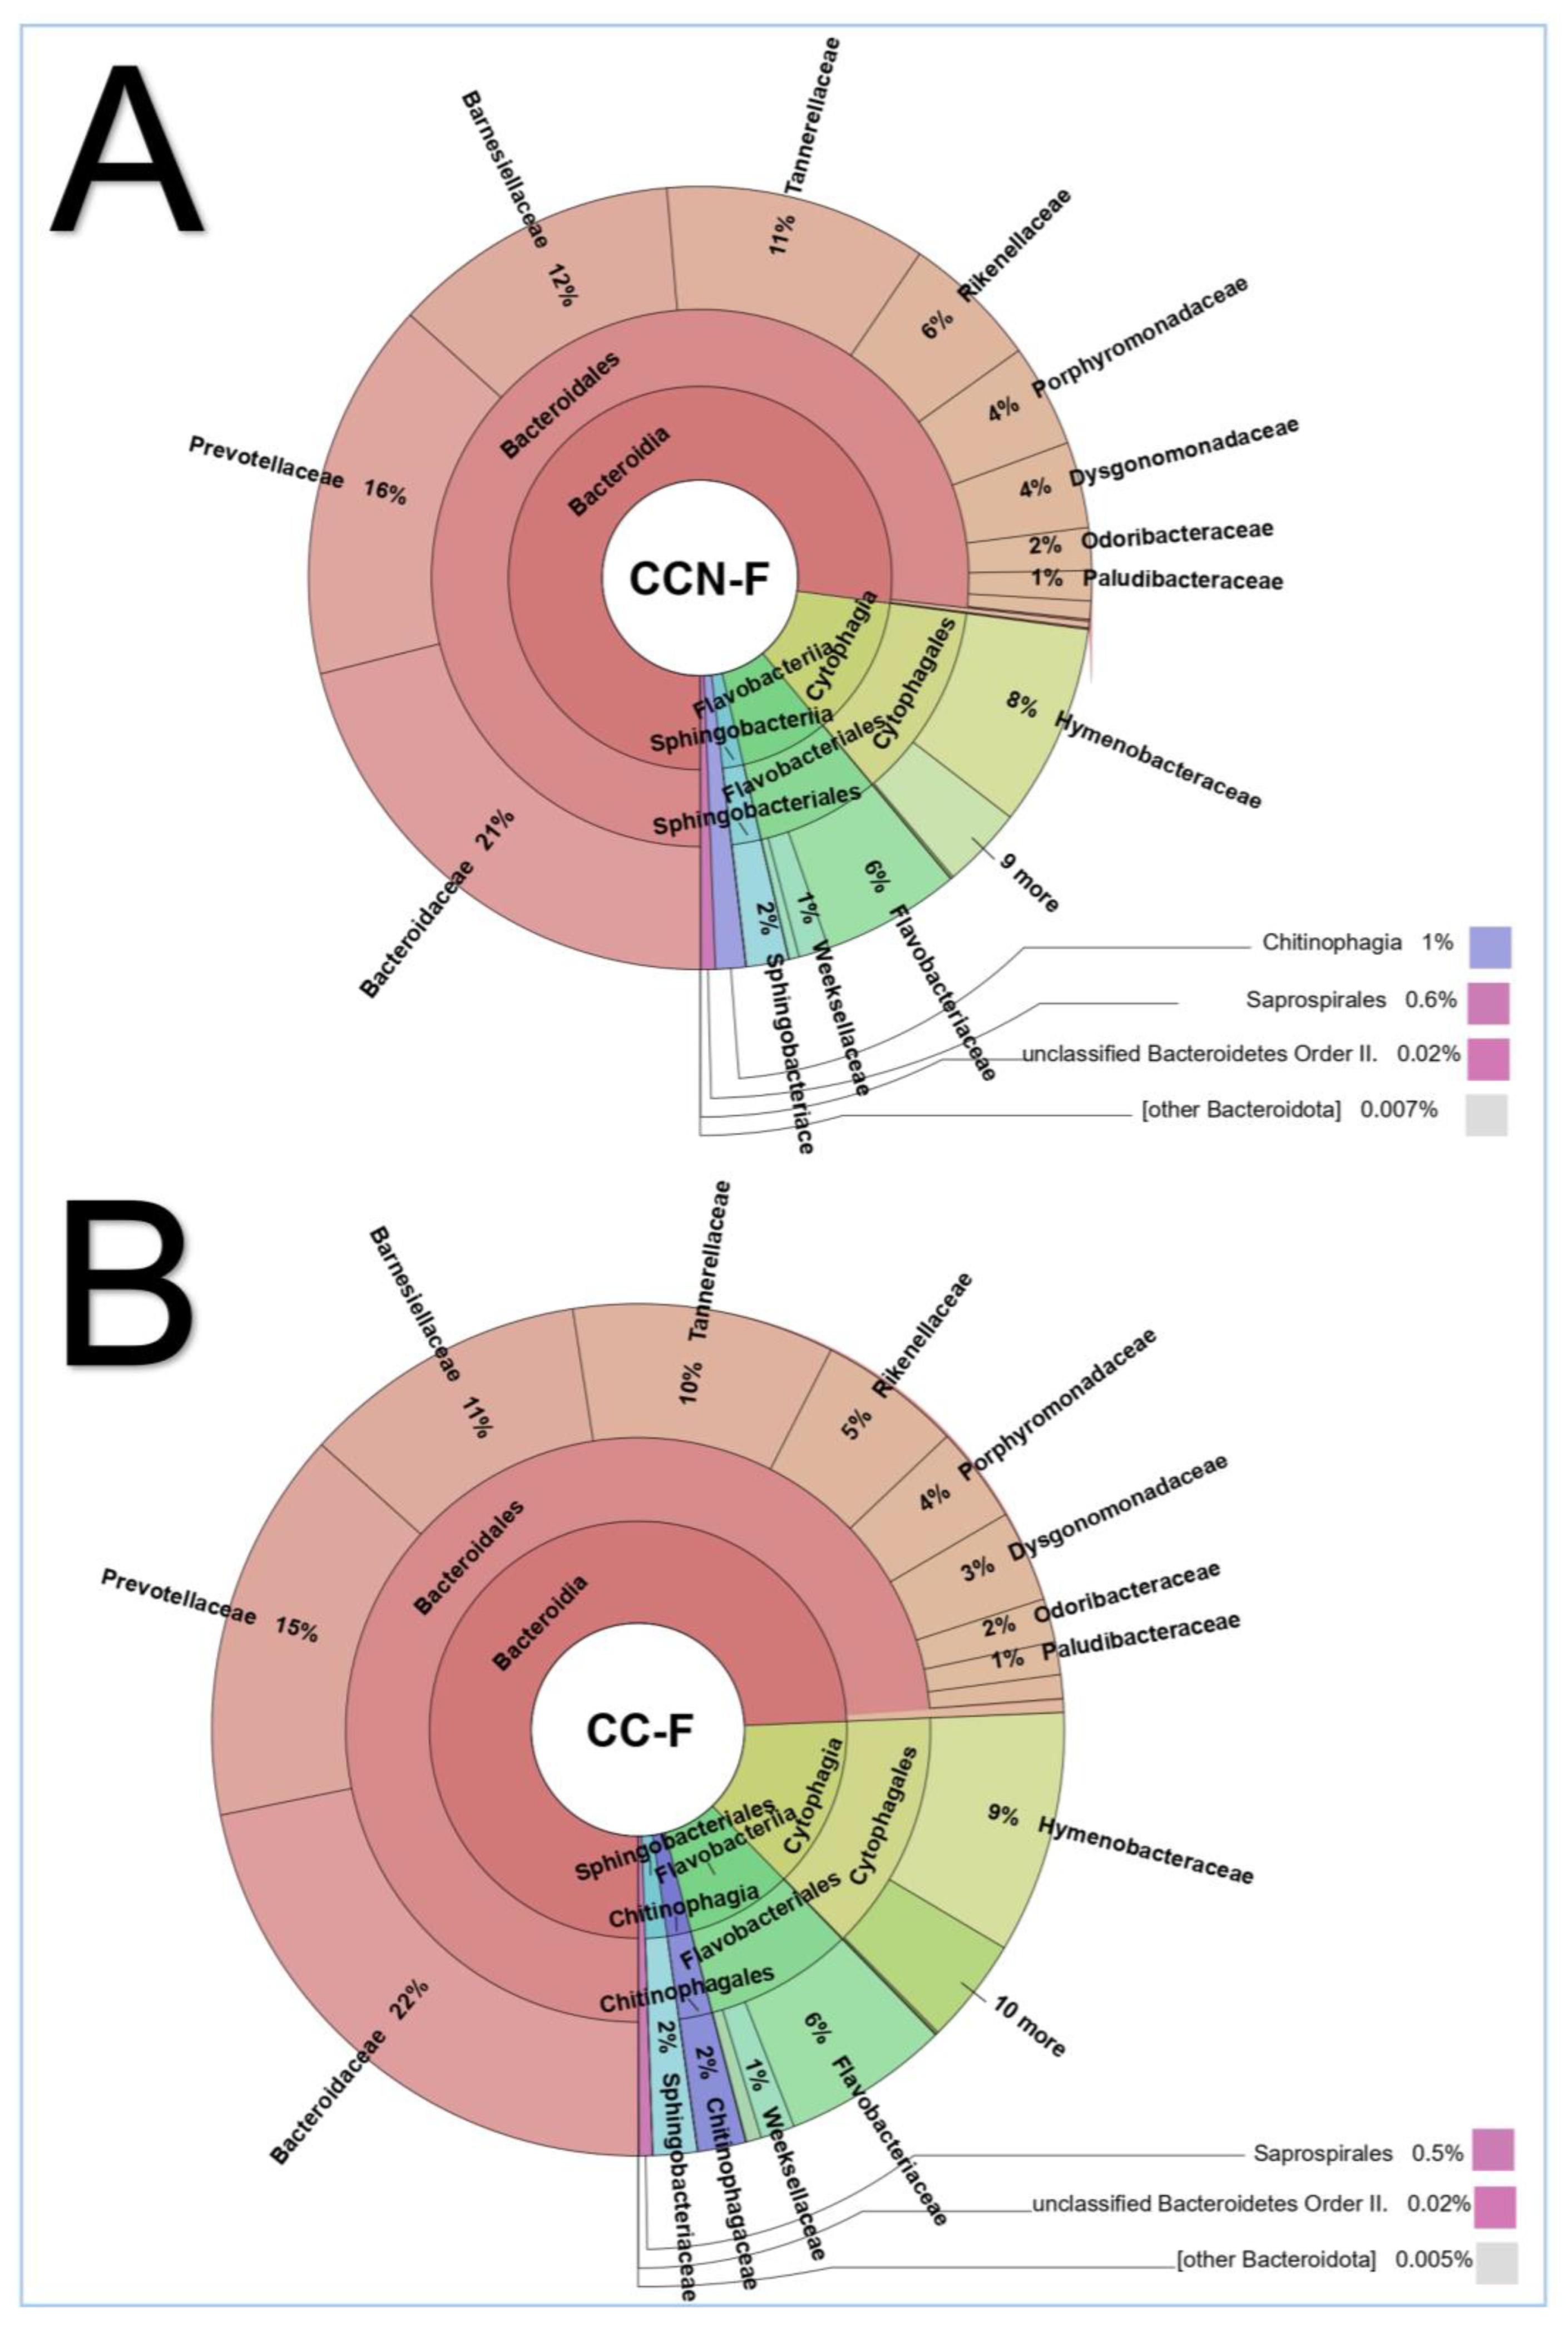
3.3.5. The Bacteroidaceae Family, as Most Abundant in the Bacteroidota Phylum

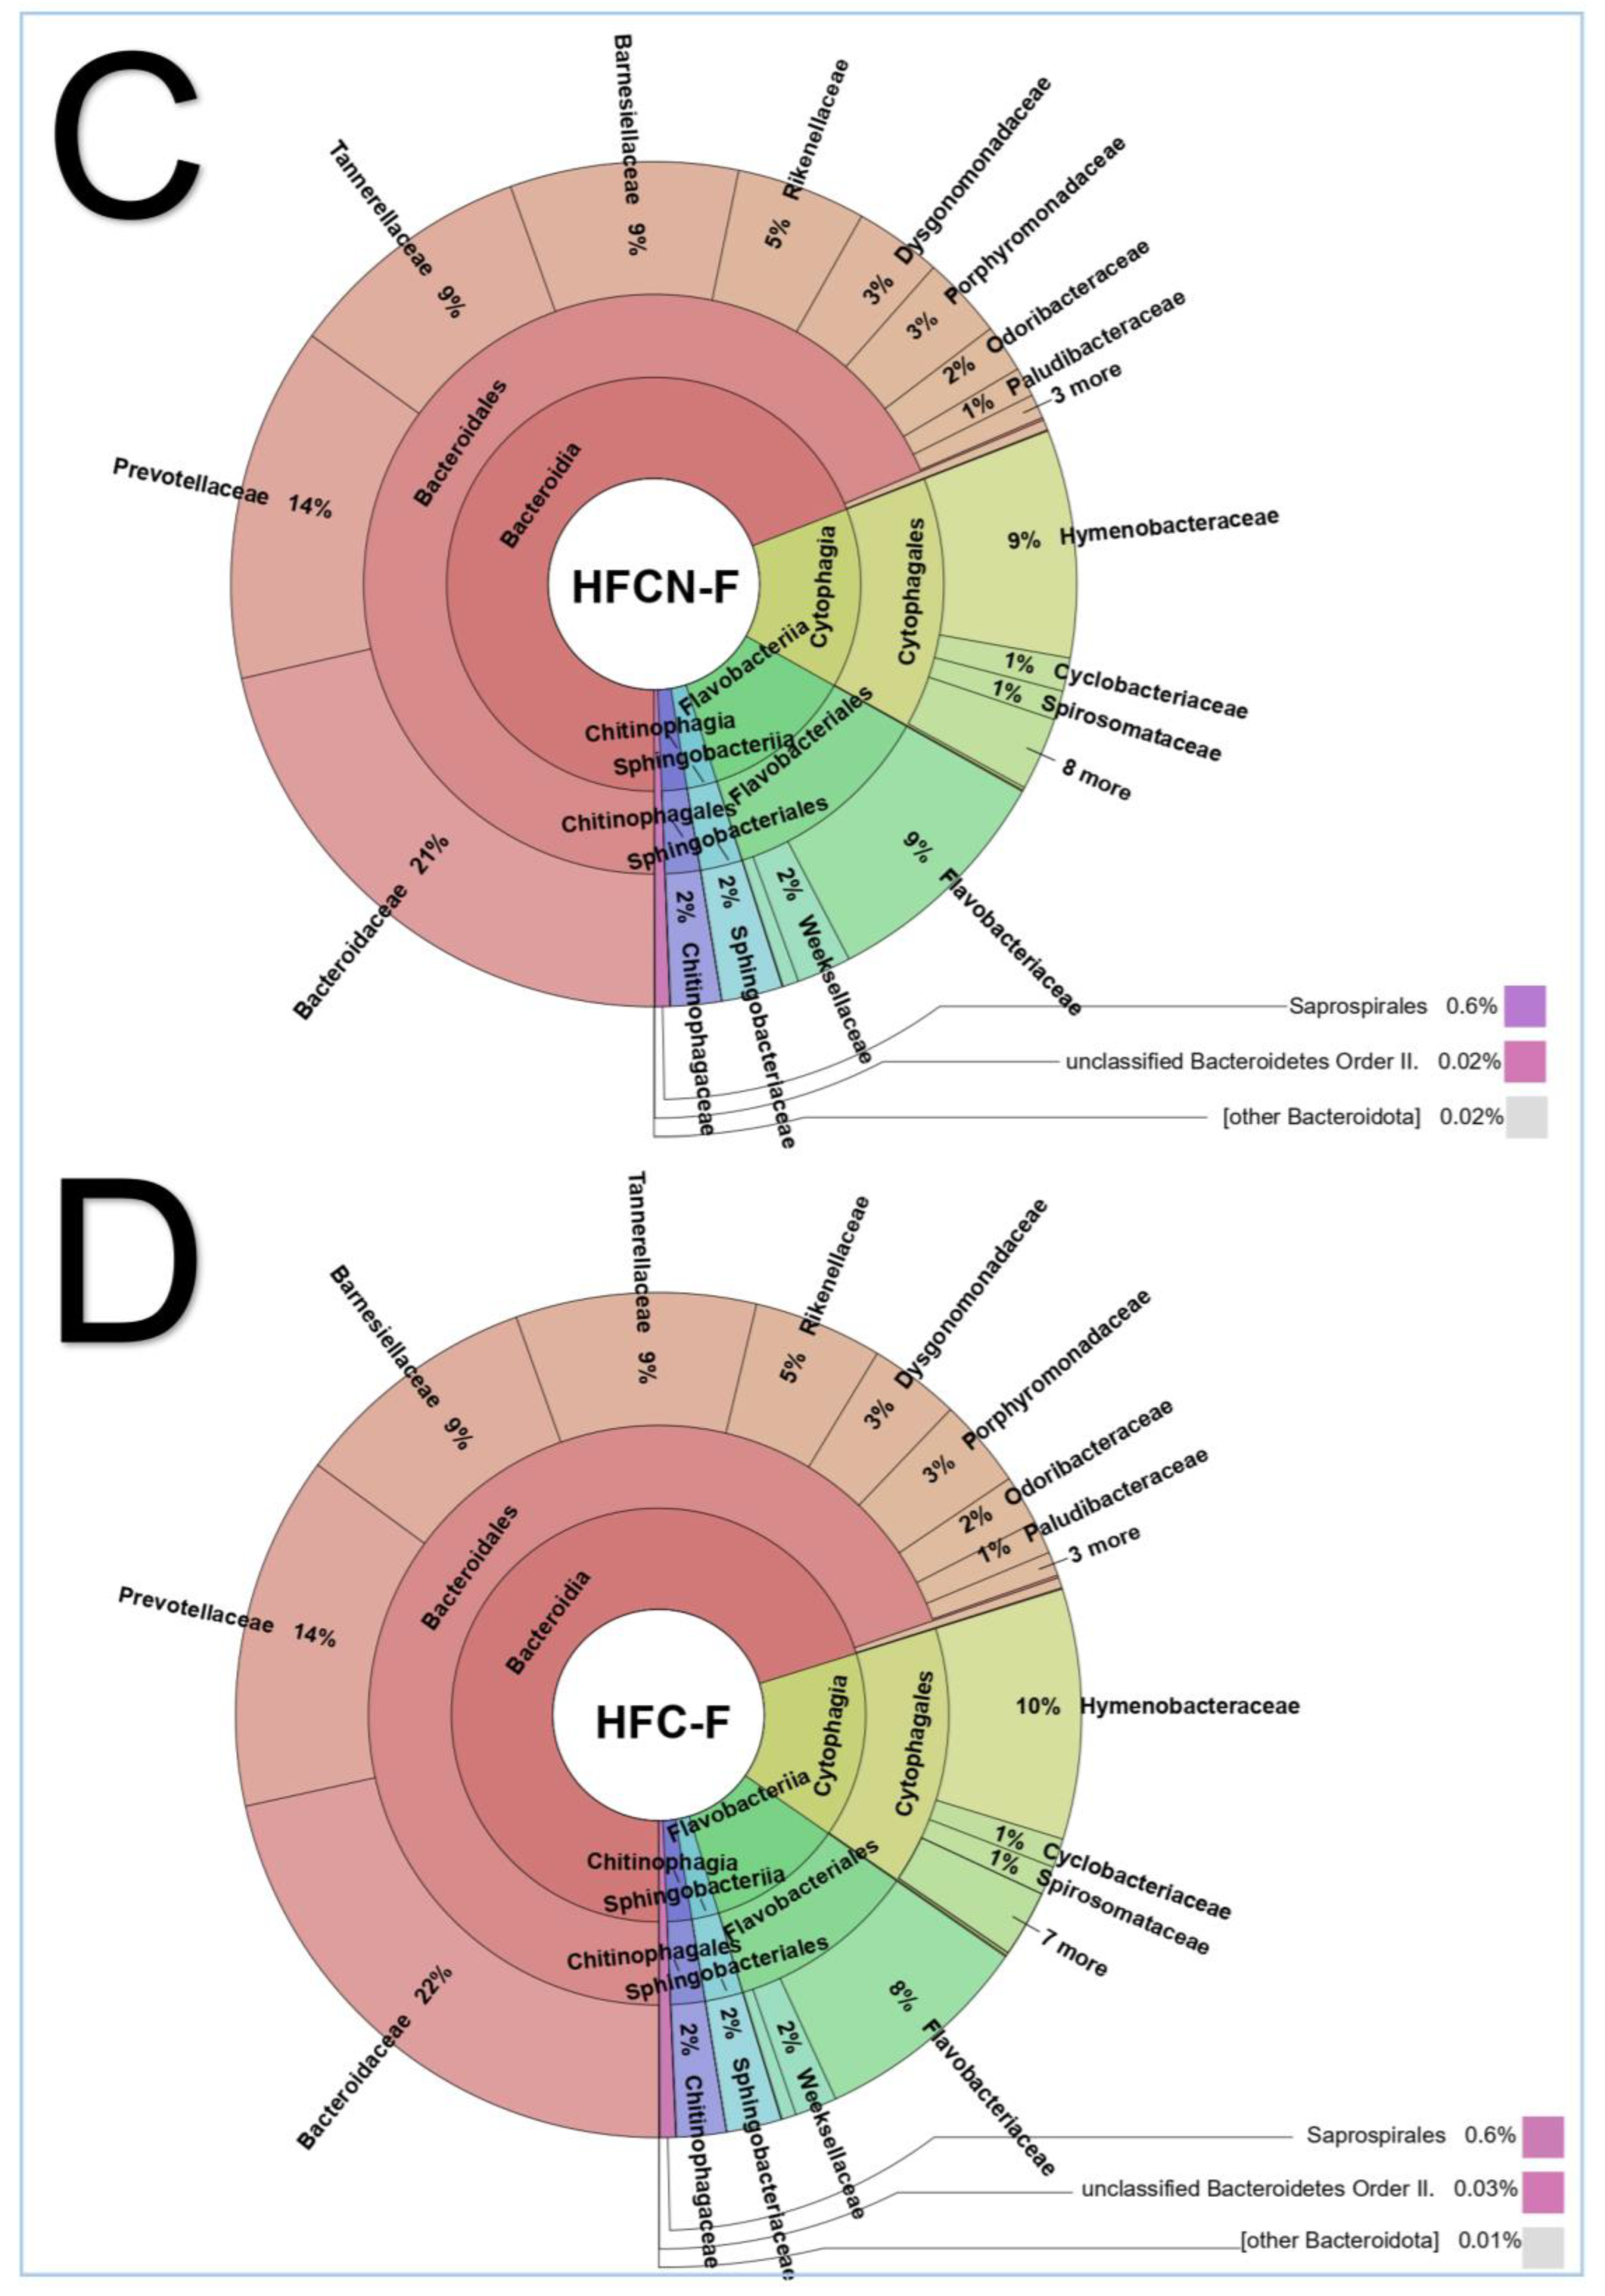
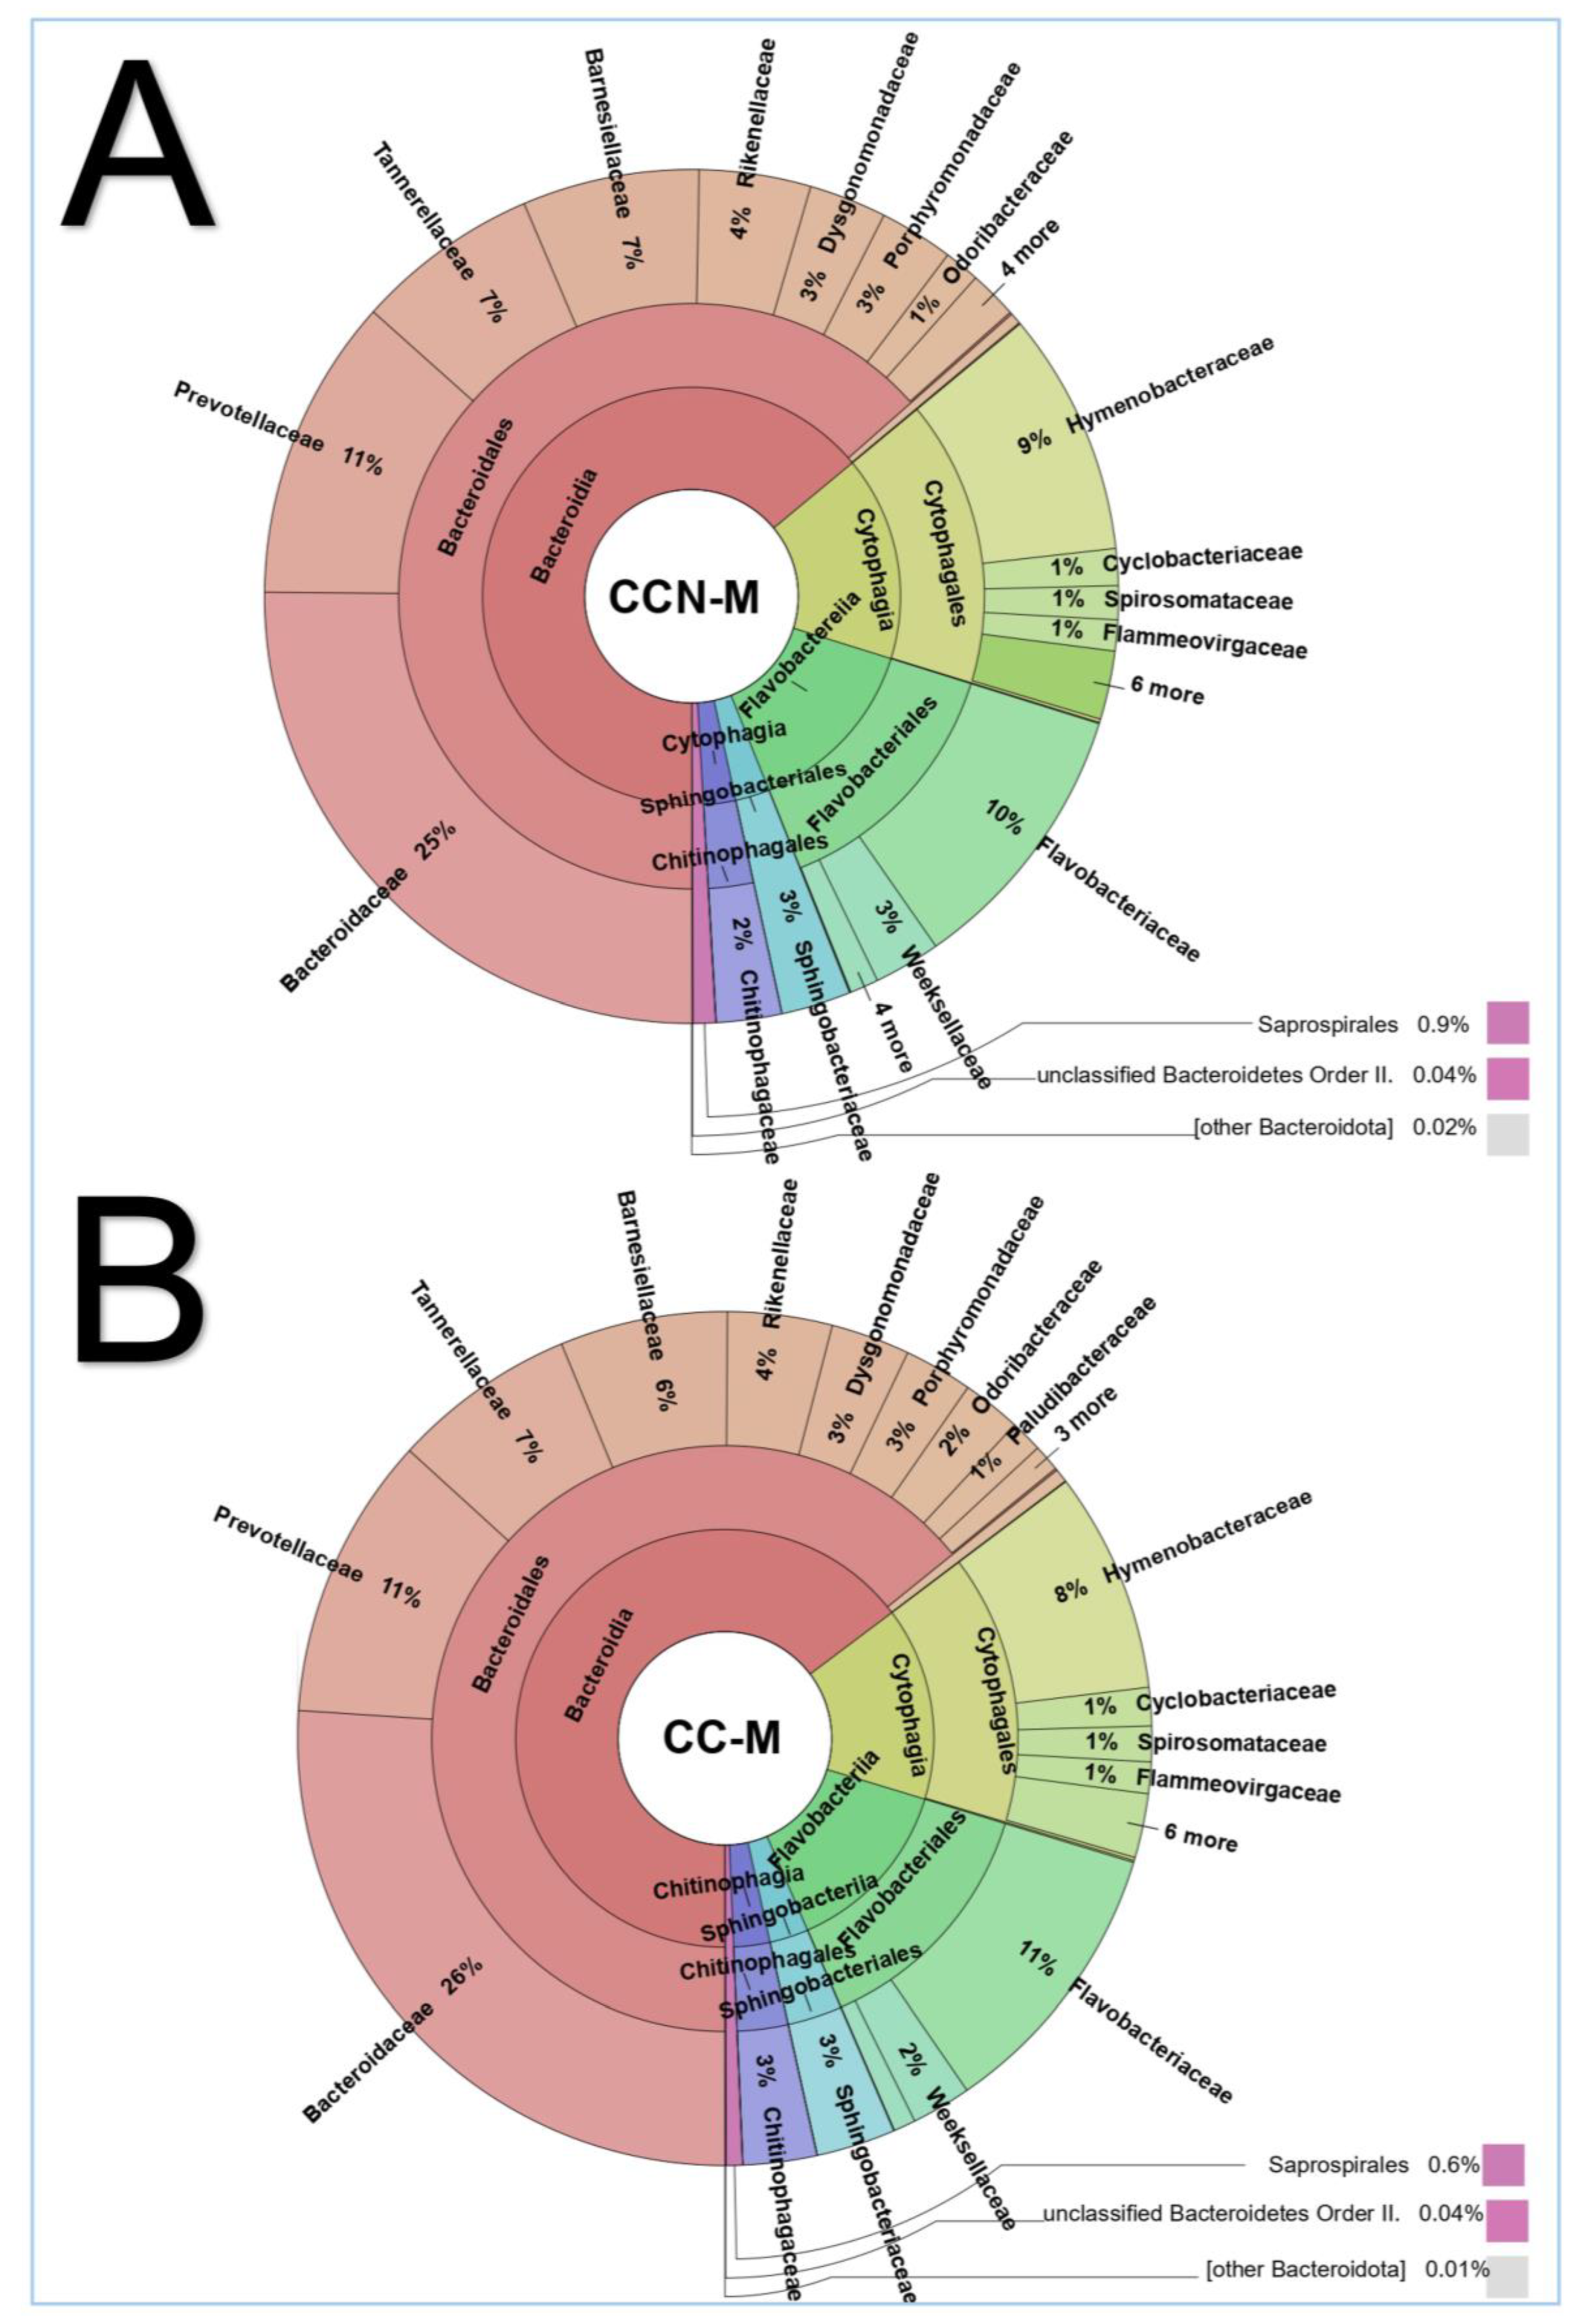
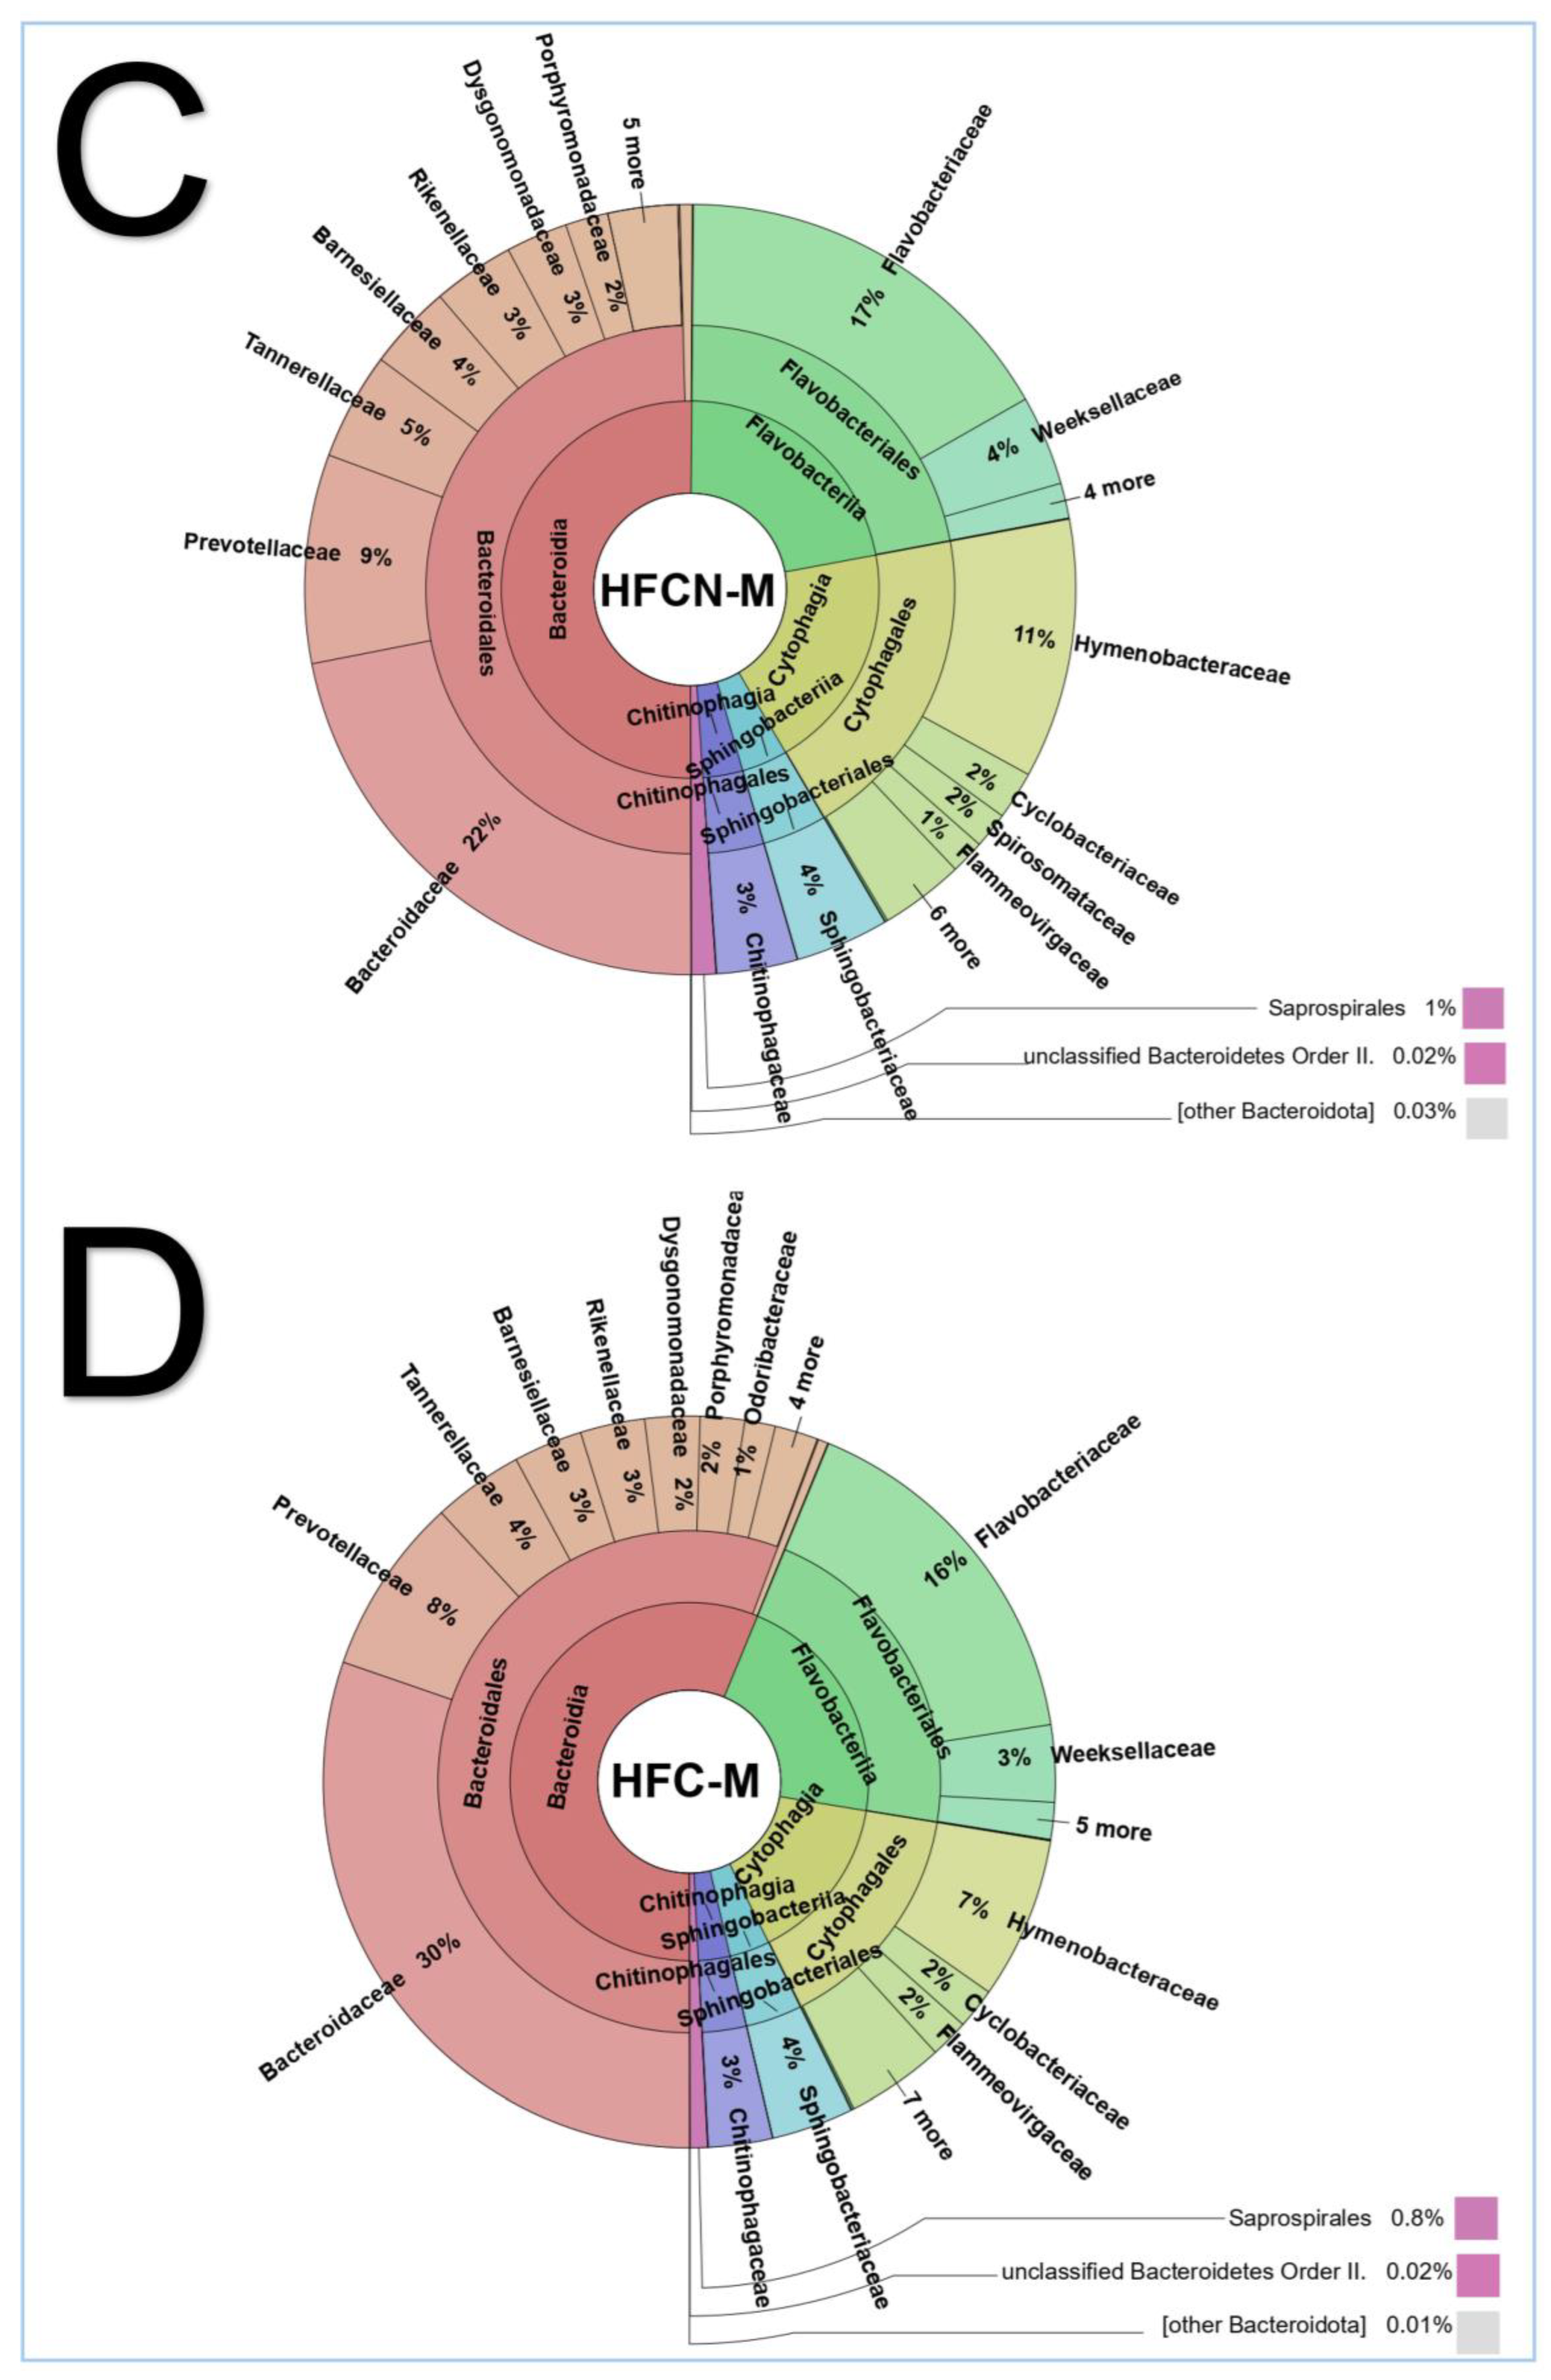
Among the five most abundant phyla across all samples, Bacteroidota were identified as the least abundant. The family Bacteroidaceae was the most relatively abundant, followed by Prevotellaceae (Figure 10 and Figure 11). Furthermore, Flavobacteriaceae was observed to be relatively more abundant in males (Figure 11) compared to females (Figure 10), with the highest proportions recorded in high-fat diets, specifically in males with HFCN and HFC, accounting for 16% and 17%, respectively (Figure 11C,D).

3.4. Metapangenome Analysis and Gene Ontology Enrichment Reveal Diet- and Sex-Specific Microbial Adaptations

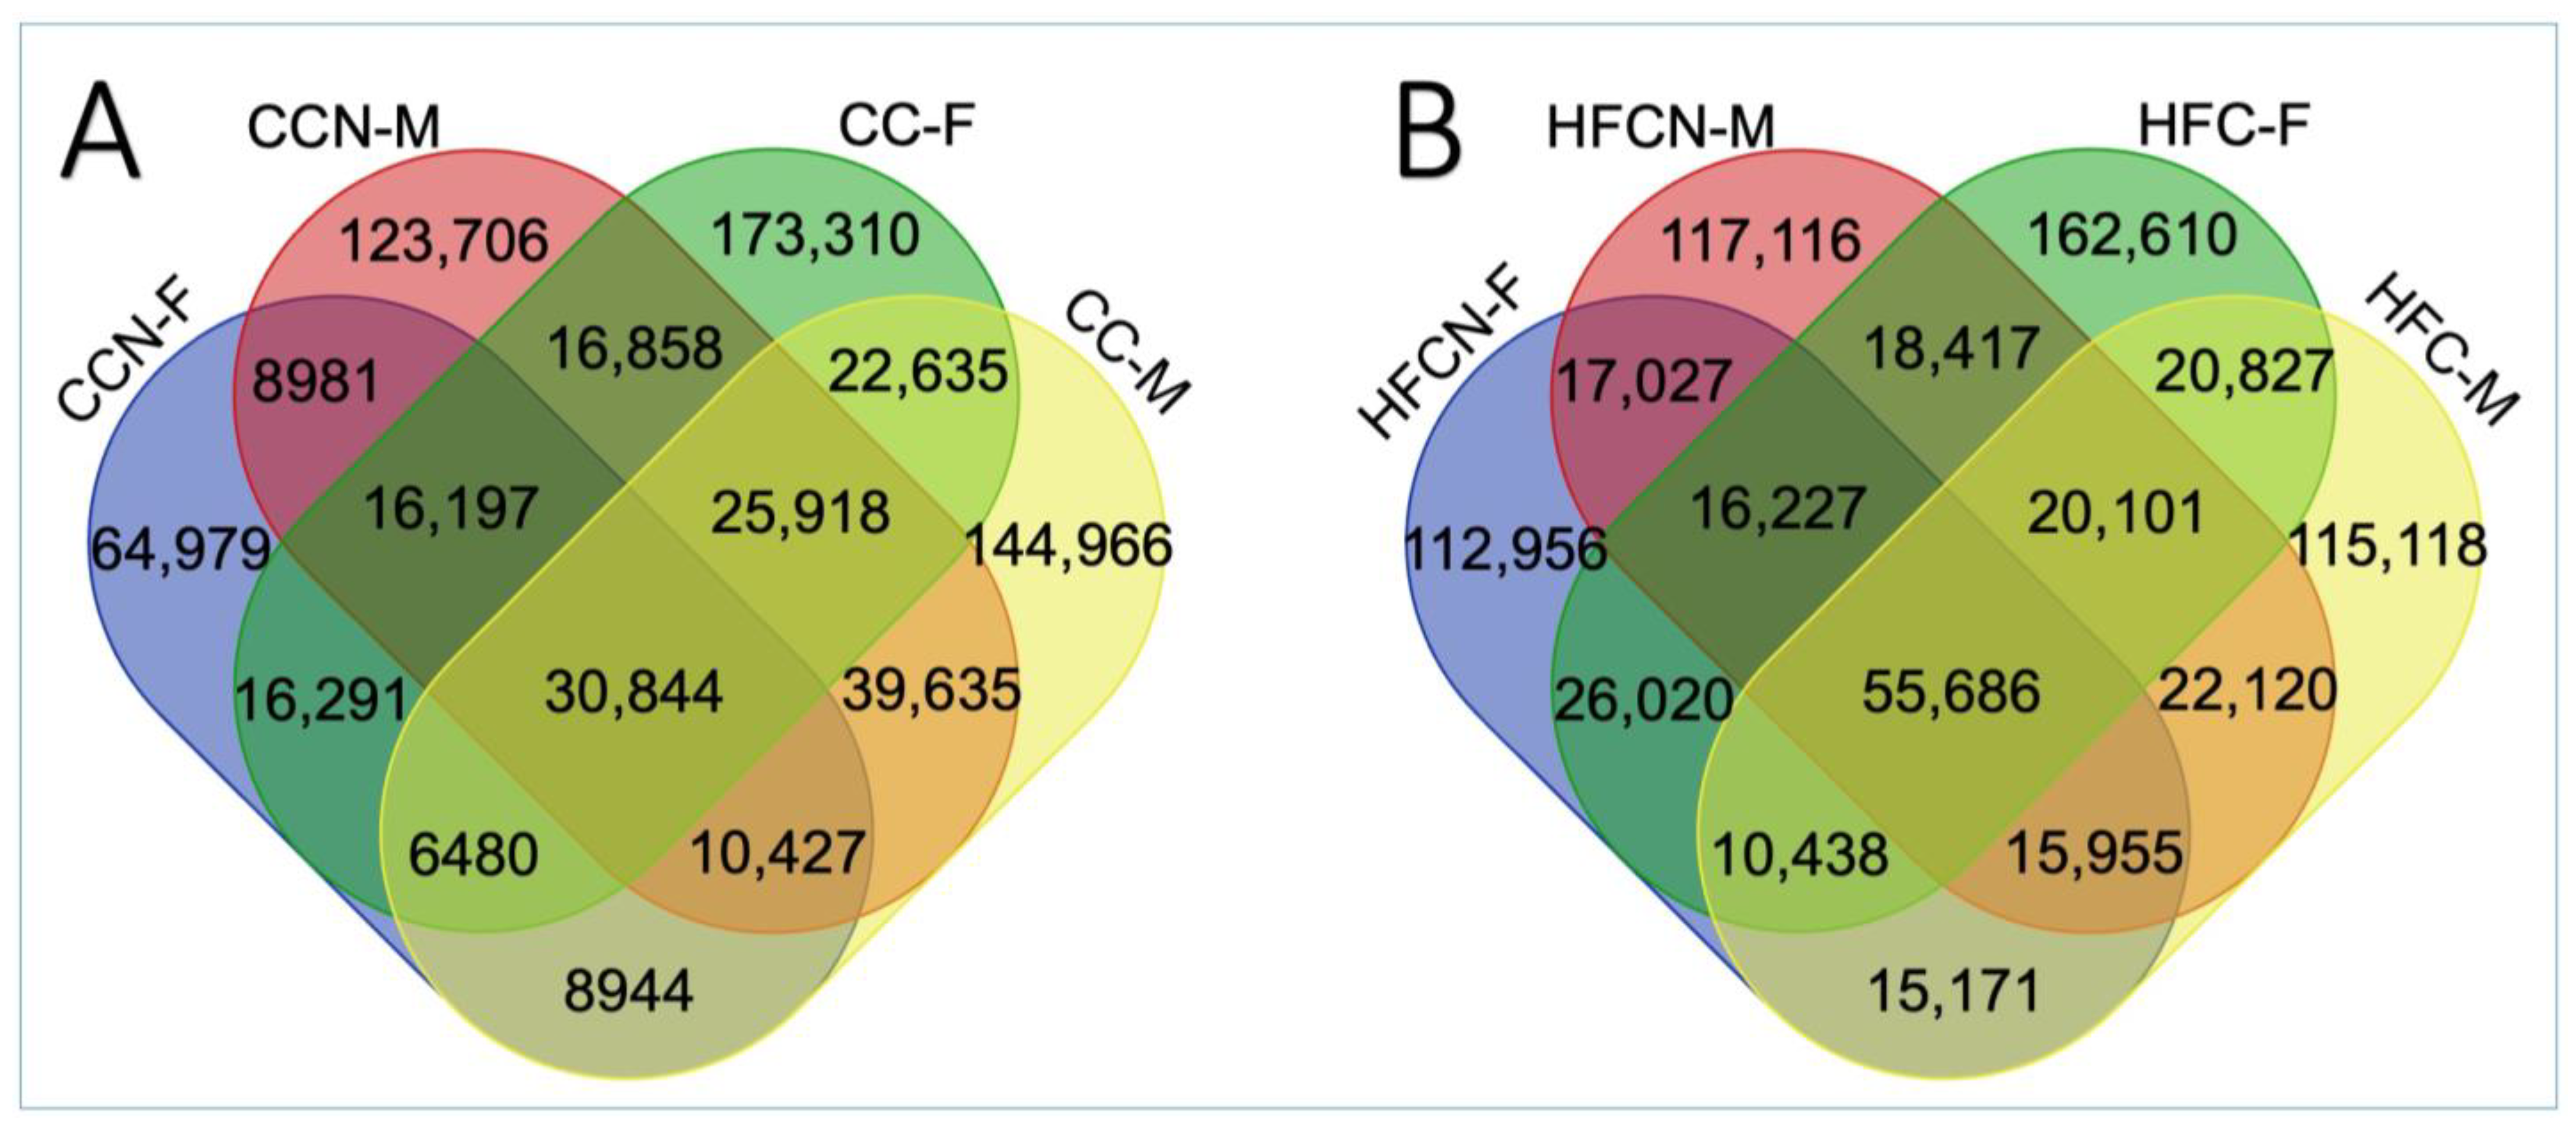
Ortholog analysis for all annotated genes between the control and ammoniated control groups and between HF vs. HFA groups revealed 710,170 and 745,788 gene clusters, respectively (Figure 12). These clusters included genes with unknown functions, among which 446,292 (62.8%) and 445,399 (59.7%) genes were annotated as hypothetical proteins. Pangenome overlap for the total ortholog clusters revealed 30,844 (4.34%) and 55,686 (7.47%) gene clusters as ‘core genes’ in the control and HF groups, respectively. Furthermore, a large number of unshared ‘cloud’ genes unique to each individual sample were observed. For instance, 123,706 genes were found to be unique to CCN-M within the complete set of orthologs.
The pangenome analysis of the female groups identified 725,613 gene clusters, with 37% of the genes exhibiting known functions. Similarly, the male groups revealed 712,847 gene clusters, with 40.8% of the genes with known functions (Figure 13). Overall, grouping by sex revealed a lower number of shared genes among females (5.81%) compared to males (8.11%).

3.5. Gene Ontology and Microbial Enrichment Analysis

3.5.1. The Ammoniated Protein Diet Groups Exhibited Significant Enrichment for Biological Processes Related to Protein Secretion and Molecular Functions

Gene ontology (GO) enrichment analyses among the control groups with and without ammonium supplementation revealed distinct differences in GO enrichment (Table 4). The control group supplemented with ammonium exhibited microbiomes that were significantly enriched in biological processes, cellular components, and molecular functions, with all groups exhibiting highly significant differences. These differences included the tricarboxylic acid cycle, defense response to bacteria, outer membrane-bounded periplasmic space, and iron ion binding. The unsupplemented control exhibited a glutathione metabolic process, a respiratory electron transport chain, regulation of cell shape, and DNA replication. Also, the ammoniated control group (CCN) demonstrated enrichment for iron ion binding in GO molecular functions. Furthermore, mice fed a high-fat diet with ammonium supplementation (HFCN) displayed microbiomes enriched in molecular functions, including glycosyltransferase and nucleotidyltransferase activity, as well as the biological function of protein transport. Conversely, the microbiome of high-fat, non-ammoniated-fed mice was enriched in heme-binding. Ammoniated protein diet groups (CCN and HFCN) had significantly different microbiomes.

3.5.2. The Diet Groups Exhibited Significant Sex-Dependent Enrichment for GO Functions Related to Both Fat Content and Ammoniation

Gene ontology (GO) enrichment analyses based on sex, between control groups with and without ammonium supplementation, and high-fat diet (HFCN and HFC) with and without ammonium supplementation, revealed distinct differences in GO enrichment (Table 5). In females consuming a high-fat diet (HFCN and HFC), the microbiomes were markedly enriched for molecular functions such as iron binding, sulfur cluster binding, and identical protein binding, when compared to those on a control diet (CCN and CC). Conversely, the control females (CCN and CC) showed flavin adenine dinucleotide binding and the GO biological process of DNA replication. Males demonstrated distinctly different GO functions from females and between control and HFD. The only enrichment observed for control males (CCN and CC) was GO molecular function for NADH dehydrogenase (ubiquinone) activity. In contrast, the high-fat diet-fed males (HFCN and HFC) exhibited enrichment for pyridoxal phosphate binding and lyase activity. Furthermore, HFCN- and HFC-fed males demonstrated enrichment for the GO biological process of respiratory electron transport chain and the plasma membrane for the GO cellular component.

3.6. Metagenomic Taxonomic Profiling Using MetaPhlan4, Highlighting Akkermansia Muciniphila as the Most Predominant Bacterial Species

Utilizing the MetaPhlAn4 pipeline for refined taxonomic profiling, a total of 893 taxonomic groups were identified across the samples, including 775 taxa at the family level and 276 taxa at the species level (Figure 14 and Figure 15). Taxonomic comparisons of families and species, conducted using the Bray–Curtis dissimilarity index, exhibited diverse patterns. Numerous taxa demonstrated variations in abundance when analyzed according to their diet and sex at both family (Figure 14 and Supplementary Figure S3) and species levels (Figure 15 and Supplementary Figure S4). Conversely, some taxa showed no significant differences in abundance based on sex or diet at either the family or species level.
Although PERMANOVA tests did not reveal significant differences in microbiota between diets or sexes across all groups, ANCOM-BC2 analyses showed significant differences in certain individual taxa at the phylum, genus, and species levels among the groups.
At the phylum level, Bacillota (q = 0.015890665) and Pseudomonata (q = 0.015890665) were less abundant in the control (CC) group, regardless of sex. Statistically significant sex effects were observed, with males having significantly lower levels of Bacillota (q = 0.25919446) in all diet groups. At the genus level, 8 out of 87 taxa were significantly abundant based on ANCOM-BC2 analyses. One undetermined genus of Pseudomonata (GGB31173) and four other Pseudomonata genera were more abundant in ammonium-supplemented and/or high-fat diet groups (CCN, HFCN, and HFC). One undetermined genus from Bacillota (GGB30455), and two other Bacillota, including Christensenella (q = 0.005756469) and Clostridiaceae_unclassified (0.005756469), were less abundant in the non-ammoniated control (CC) group. The three significantly abundant genera in the females included Christensenella, Clostridiaceae unclassified, and an undetermined Bacillota GGB30455 (q = 0.015674113).
Three species were significantly more abundant in control mice regardless of sex. The Christensenella_SGB41486 species, belonging to the family Christensenellaceae, was more abundant in the non-ammoniated control (CC) group. Similarly, there were more of an unidentified species in the Christensenellaceae family, and a Clostridiaceae_bacterium in the Clostridiaceae family in the non-ammoniated control (CC) group.

4. Discussion

Our study aimed to demonstrate that, by alkalinizing the protein source using AHE in C3H/HeJ mice over a long-term period, the adverse effects of HFDs could be mitigated, thereby enhancing protein digestibility and increasing buffering capacity. Consequently, these changes were expected to improve gut microbiome composition by focusing on bacterial quality rather than mere abundance, while also assessing metabolic functions under AHE + HFD conditions compared to casein-based control (CC) conditions. We hypothesized that the effects would be most pronounced in HFD-fed mice, where PRAL is elevated, while minimal changes would occur under normal-fat diets. Moreover, based on prior studies [12,21], we predicted that the responses would be sexually dimorphic, with females showing greater benefits. This investigation is particularly novel because it combines descriptions with shotgun metagenomics to explore the interactive effects of aging, sex, and protein modification on gut microbiome shifts in four different diet regimens. By carefully tracking feeding behavior over time, we were able to precisely measure food intake, ensuring that any observed changes could be attributed to dietary quality, quantity, sex, age, or microbiome-mediated metabolic responses.
As expected, pronounced sexual dimorphism was observed, with males consistently gaining more weight than females across all diets. However, females exhibited a greater relative increase in body weight under HFD conditions, consistent with previous reports. In contrast, mice in the CC and CCN groups consistently maintained a lower body mass. LOESS trendline analysis of body weight trajectories revealed that weight increased steadily during early life in males and mid-life in females, reaching a peak around week 64, followed by a gradual decline by week 72, most notably in HFCN males.
To further evaluate the impact of diet and sex on survival outcomes, Kaplan–Meier curves were used for analysis. These analyses revealed that CCN-fed females had the highest survivorship, whereas females fed HFC and HFCN experienced markedly reduced survival. In males, significant differences were observed across most groups, except for the HFC-fed group, which exhibited a dramatic decline in survival. These observations align closely with previous findings from our research group [21,29,30], which reported similar patterns in weight and survival over 72 weeks for casein based HFDs.
Microbiome sampling was performed at 16 months, corresponding to early old age in C3H/HeJ mice, to capture age-related microbiome changes while avoiding issues with small fecal sample sizes. Similarly, our findings align with those of Barr et al., who conducted an 18-month study on 3H/HeJ mice to examine the effects of aging and chronic HFD exposure, demonstrating how diet, using beef and casein as protein sources, as well as age, interact to drive obesity, metabolic decline, and disease. Their long-term model captured natural weight changes and revealed increased cancer incidence, particularly liver tumors, under HFD conditions. This may be related to casein diets raising plasma levels of essential amino acids, such as methionine, valine, and lysine, shortly after ingestion, consistent with studies on casein hydrolysis in animals [55]. Furthermore, sex hormones emerged as a critical factor influencing weight dynamics in longitudinal studies [19,21,30,56]. Conversely, Boren et al. found that HFDs increased adiponectin, leptin, and MCP-1, and high-fat beef diets further amplified pro-inflammatory markers in a sex-dependent manner. Furthermore, adding AHE to the HFD (HFD + AHE) attenuated disease onset, mitigated lean muscle loss, and improved survivorship relative to AHE-free controls. Moreover, Garrison et al. [12] additionally reported distinct microbiome shifts under beef-AHE diets, thereby linking this intervention to compositional changes in gut communities. Taken together, these findings underscore the long-term effects of diet, aging, and sex hormones on the progression of obesity, metabolic health, and survival outcomes with respect to non-ammoniated HFD.
Our data at the phylum level revealed that Verrucomicrobia exhibited the highest relative abundance (99%), primarily represented by a single species, Akkermansia muciniphila (A. muciniphila). Interestingly, this species predominated across all experimental groups, except for CC-M, where Bacillota emerged as the dominant phylum. This observation is noteworthy because it not only aligns with our previous findings [12], but also corroborates evidence from other studies [12,57,58,59,60], thereby strengthening the reliability of these results. Importantly, A. muciniphila is widely recognized as an exclusive probiotic [61], a biomarker of gut health, and a specialist in mucin degradation [62]. In our results, Verrumicrobiota may respond dynamically to dietary factors and shifts in the gut environment, and its abundance can change rapidly in response to dietary interventions [63]. These diet-linked fluctuations in A. muciniphila populations support the interpretation that an unusual increase in Verrucomicrobiota reflects treatment-induced ecological restructuring of the microbiota rather than an atypical baseline predominance. [64]. In murine models, Verrucomicrobiota is mainly composed of Akkermansia muciniphila, which responds significantly to changes in diet, increased use of host substrates, shifts in intestinal pH, and high-fat diets [12,65,66]. Experimental studies have shown that HFD, protein-modified diets, and interventions that reduce competition from carbohydrate-fermenting taxa promote A. muciniphila expansion, in some cases leading to dominance over both Bacteroidota and Bacillota combined [66,67,68,69].
In this context, dietary composition strongly shapes gut microbial ecology, and A. muciniphila expansion is often associated with specific nutritional patterns that influence mucus turnover, substrate availability, and host–microbe interactions [70]. For example, nutritional interventions, including HFD and bioactive food components, have been shown to modulate the abundance of A. muciniphila, whereas supplements such as polyphenols and inulin can further enhance its growth by altering mucin dynamics or signaling pathways [71]. However, while diet is a dominant factor, host genetics (mouse strain), age at diet initiation, and duration of HFD feeding also influence metabolic phenotypes and microbial composition [72]. Inter-strain variation affects baseline microbiota and host metabolic responses to diets, and aging has been associated with shifts in A. muciniphila and gut ecosystem dynamics in some models [73]. Likewise, the metabolic effects of prolonged high-fat feeding can alter host physiology and niche conditions, thereby indirectly modulating the abundance of mucin-degrading bacteria [73]. Furthermore, the predominance of diet in shaping A. muciniphila is supported by multiple studies showing that the same dietary intervention produces consistent directional changes in its abundance across experimental contexts [65,67,71,74], but the magnitude and net effects vary with host genetics, age, and exposure length [75]. Factorial experimental designs controlling for strain and age, and longitudinal measurements during diet transitions, would further clarify these contributions.
Under conditions of supplemented high-fat diets (HFDs), its protective mechanisms operate through multiple, interconnected pathways [76]. A. muciniphila is well known for SCFA production (e.g., acetate, propionate), which strengthens the intestinal barrier, reduces LPS translocation [77], especially from the Enterobacteriaceae family, and modulates immune responses by increasing anti-inflammatory cytokines such as IL-10 and decreasing pro-inflammatory cytokines [78]. These effects also enhance GLP-1/GLP-2 signaling, improve insulin sensitivity, stimulate PPARα activation, and support microbial balance, collectively protecting against obesity [79]. Additionally, A. muciniphila has been linked to cobalamin synthesis [78]. For example, a study using obese mice shows reduced enzyme activity in B12 biosynthesis, indicating that gut dysbiosis may impair B12 availability [78]. Similarly, in obese adolescents, B12 concentrations were found to be 1.6 times lower than in lean counterparts, with deficiencies strongly associated with insulin resistance and systemic inflammation [28]. However, the literature remains inconclusive, as other studies have reported inconsistent findings [80,81]. Supporting this perspective, in animal models, HFD consistently reduces A. muciniphila, which is strongly associated with increased adiposity and glucose dysregulation [82]. Nevertheless, a novel finding by Garrison et al. revealed that in aging mice fed a beef-based HFD, A. muciniphila remained dominant, particularly among females receiving ammonium-supplemented diets. Taken together, our results may suggest that maintaining a high abundance of A. muciniphila could potentially counteract the deleterious microbiome shifts associated with protein type source, age, HFD, and obesity, positioning this species as both a biomarker and a promising therapeutic target for metabolic diseases. Considering the widespread use of GLP-1–based drugs, our key takeaway is that endogenous incretin signaling can also be enhanced through diet, a natural, clean-label approach that may help mitigate gut-function disruptions and other adverse effects (e.g., nausea, constipation, diarrhea) often reported with agonist pharmacotherapy.
Importantly, the observed sex-specific metagenomic variability is unlikely to be attributable solely to cage-level sample pooling, as the magnitude and direction of these differences exceed what would be expected from pooling alone [83]. Indeed, pronounced sex-dependent divergence in host transcriptomic and metabolic profiles has been demonstrated in independent studies using individual-level analyses, including RNA sequencing and metabolomics, indicating intrinsic biological differences between sexes rather than methodological artifacts [84]. For example, Barr et al. reported robust sex-specific signatures in both gene expression and metabolite profiles that persisted across dietary contexts, supporting the interpretation that sex-driven host–microbiome interactions represent a biologically meaningful source of variability [85]. Collectively, these observations underscore the importance of incorporating sex as a biological variable in future microbiome and functional metagenomic studies.
We also examined the broader taxonomic composition of the gut microbiota to gain a deeper understanding of how these protective effects might interact with other harmful microbial groups. In this context, we found that the class Clostridia (phylum Bacillota) was more abundant than Bacilli across both females and males, except for the CCN-F group. Within Clostridia, families such as Lachnospiraceae and Oscillospiraceae were predominant. Notably, our previous research using ammoniated beef high-fat diets (HFDs) also reported a significant abundance of these families [12]. Regarding Lachnospiraceae, these taxa are well recognized as key anaerobic fermenters [86], metabolizing substrates to produce beneficial short-chain fatty acids (SCFAs), such as butyrate and indole-propionic acid, which in turn exert anti-inflammatory and antioxidant effects [16,87]. Similarly, Oscillospiraceae share these metabolic features and have been characterized as potential next-generation probiotic candidates, being strongly associated with leanness and overall metabolic health [88].
As anticipated, the species-level analysis of the mouse microbiome revealed that both ammoniated (AHE) and non-ammoniated HFDs induced gut microbiota imbalances. For instance, Clostridioides difficile (C. difficile) was detected at moderate levels in most groups; however, its abundance was markedly higher in the HFC-M group. In contrast, Clostridium perfringens was found at moderate to high levels only in females fed normal diets. Collectively, these results align with previous evidence showing that Clostridium spp. is strongly associated with HFD-induced gut dysbiosis and an increased risk of infection [89]. Therefore, it is unsurprising to observe these pathogens exerting colonization resistance against beneficial taxa. Supporting this, using a murine HFD model, Mefferd et al. demonstrated that high-fat regimens reduce beneficial bacteria such as Lachnospiraceae and Ruminococcaceae, which normally compete with C. difficile, and other probionts [90], thereby allowing it to proliferate. Furthermore, Li et al. highlighted a dual role of butyrate production by Lachnospiraceae: while moderate levels support a balanced microbiome, excessive concentrations, particularly in individuals experiencing dysbiosis, may be detrimental [19]. This suggests that non-ammoniated HFDs are linked to dysbiosis, as well as pathogen expansion, which reflects weakened colonization resistance by beneficial taxa. Moreover, even health-associated metabolites, such as butyrate, can become context-dependent, being supportive at moderate levels but potentially harmful when dysbiosis skews production.
In addition to these dominant families [16,87], other abundant groups identified included the bile-metabolizing bacteria Barnesiellaceae and Muribaculaceae (formerly known as S24-7). Interestingly, previous studies in HFD-fed mice, including those with AHE supplementation, reported a consistent co-occurrence of these families, thereby emphasizing their functional importance in HFD dietary contexts [12,19,91,92]. Mechanistically, a healthy gut microbiota helps maintain colonization resistance partly by converting primary bile acids synthesized in the liver into secondary bile acids [93]. These secondary bile acids, in turn, prevent spore germination of C. difficile spores and vegetative cells [94]. However, during dysbiosis, bile-metabolizing bacteria such as Lachnospiraceae, Oscillospiraceae, and Ruminococcaceae are depleted [95]. As a result, there is an accumulation of primary bile acids, such as taurocholate, accompanied by a deficiency of protective secondary bile acids [96]. Consequently, primary bile acids trigger the development of C. difficile spores into vegetative cells [97]. In turn, this cascade of events exemplifies the colonization resistance mechanism that was reflected in our findings. Moreover, this phenomenon is further supported by findings in the CCN-F group, in which the Streptococcaceae family accounted for approximately 50% of the abundance, potentially indicating a bacterial response to HFD-induced obesity [98,99]. Specifically, within Lactococcus lactis, Lactococcus cremoris, and Pediococcus acidilactici emerged as the most prevalent species. Their strong association with ammoniated HFDs likely stems from their robust proteolytic systems [100] and probiotic properties as bacteriocin producers [101]. Notably, P. acidilactici produces pediocin PA-1, a bacteriocin highly effective against Listeria monocytogenes, Shiga toxin-producing Escherichia coli (STECs), and Salmonella spp. [102]. In contrast, the Christensenella SGB41486 identified in the non-ammoniated control (CC) group has been repeatedly found to be inversely correlated with BMI in humans [103]. Additionally, other commensal gut species were found in high abundance, particularly in AHE diets such as Adlercreutzia spp., and Romboutsia ilealis. Regarding Adlercreutzia spp., which is associated with bile-acid transformation and polyphenol/steroid metabolism, often linked to mucosal protection and anti-inflammatory signaling [104], while Romboutsia ilealis suggests efficient peptide/amino-acid fermentation and carbohydrate co-utilization under a buffered (lower PRAL) gut environment [105], aligning our results with those of other authors [12,106,107,108]. In summary, the presence of these microorganisms indicates a typical state of eubiosis, wherein pathogenic populations are regulated through the balanced interplay between Bacteroidetes (Bacteroidota) and Firmicutes (Bacillota) [109].
The novelty of our findings lies in the emergence of Zoogloeaceae and two unidentified families (F_FGB28820, F_GB7608) exclusively in HFD-fed mice, along with the consistent abundance of Emergencia spp., which emphasizes the strong selective pressure of high-fat diets on gut microbiota. These taxa were absent in normal diets, suggesting they thrive in HFD-altered conditions, such as increased bile acids, lower pH, and reduced competition from beneficial microbes, including Lachnospiraceae [110]. Zoogloeaceae was more abundant in males, indicating possible sex-specific effects linked to hormonal or immune differences [111]. Their roles remain unclear but may involve specialized metabolism or pathobiont activity, reflecting HFD-induced dysbiosis [112,113,114].
Enterobacterales were the predominant class across all samples, which may be due to casein increasing intestinal nitrogen, which provides a substrate for Enterobacterales, as suggested by Wang et al. [86]. Also, previous reports show HFDs with casein promoted metabolic dysfunction-associated steatotic liver disease (MASLD) even under normal caloric intake [22,96]. Gram-negative bacteria produce LPS, which normally triggers the hepatic lipopolysaccharide-binding protein (LBP) and the production of pro-inflammatory cytokines [42,43]. However, we used the C3H/HeJ mouse strain, which has a spontaneous mutation in the TLR4 gene, rendering it unresponsive to LPS. This may have allowed Enterobacterales to expand unchecked [115,116]. More study on the TLR4 status in these mice is needed. If the TLR4 mutation is identified, this suggests that casein-derived nitrogen, HFD-induced barrier dysfunction, and LPS insensitivity drive the predominance of Gammaproteobacteria.
Within Actinomycetota, Actinomycetes and Coriobacteriia were predominant across groups. CCN, especially females, showed higher Coriobacteriia > Eggerthellales. Eggertellaceae was more abundant in the normal diets, while Adlercreutzia equolifaciens dominated AHE HFDs. In line with this, A. equolifaciens modifies bile acids, reduces bile stress, and lowers IL-6 expression in MASLD murine models [117]. Taken together, these shifts suggest Eggerthellales play beneficial roles in terms of sexual dysmorphism in CCN and AHE HFDs. By contrast, Bacteroidota were the least abundant, mainly Bacteroidaceae and Prevotellaceae, with Flavobacteriaceae. Functionally, Bacteroidaceae produce SCFAs and support metabolic balance [118], whereas Prevotellaceae aid glucose regulation and immunity [119]. Nonetheless, findings on Prevotellaceae highlight the critical importance of understanding strain-level differences [119]. Under HFDs, Bacteroidaceae decline but may increase with AHE interventions [12,19,120]. Additionally, the Flavobacteriaceae exhibited a sex-dependent pattern, particularly in males, with a peak in both the HFCN and HFC dietary groups. Members of this family, while occasionally opportunistic or pathogenic, are proficient at degrading complex polysaccharides, lipids, and glycoproteins [22]. Their growth may be supported in high-ammonia environments, where nitrogen availability favors nitrogen-scavenging taxa [56]. Moreover, their presence has been linked to lipid and bile salt metabolism under HFD conditions [58], indicating a potential role in fat absorption and metabolic adaptation, as well as an observed sexual dimorphism that could reflect differences in lean muscle mass, typically higher in males [12,21,30], which would produce greater ammonia-related byproducts of muscle metabolism and thus further select for these taxa.
Gene annotation identified 165,463 to 334,689 predicted genes across samples and diets, enabling comprehensive community assembly and functional analysis, consistent with standards for mouse gut metagenomics [121]. Assemblies varied across treatments, with 113,578 to 422,369 contigs, and total sequence lengths spanning 152.65 Mbp (CCN-F) to 323.52 Mbp (HFC-F). Notably, N50 values ranged from 2071 bp (CCN-M) to 5742 bp (HFC-M), reflecting differences linked to the typical sexual dysmorphism previously reported [12]. Higher N50 and larger total assemblies were observed in HFD groups, particularly in females, suggesting a less diverse but functionally expanded microbiome, mostly dominated by a subset of highly abundant species, such as Akkermansia muciniphila, which are known to bloom under obesogenic dietary conditions [122,123]. In contrast, ammoniated control groups displayed smaller, more fragmented assemblies, consistent with a more balanced and diverse community. These trends are supported by prior studies, which demonstrate that dietary fat composition can alter microbial ecosystems, resulting in metabolic dysbiosis and reduced evenness in microbial populations [124]. Despite low diversity, the functional capacity among persisting taxa is high; yet the loss of redundancy means the system is less resilient, so low diversity remains undesirable.
The relatively small core genome (30,844 clusters) within NDs highlights substantial variability between individuals. Furthermore, the expanded genome in HFD groups (55,686 clusters) is consistent with the Anna Karenina principle, which states that stressed or dysbiotic microbiomes diverge idiosyncratically compared to stable, healthy communities [125]; paralleling Leo Tolstoy’s dictum that “all happy families look alike; each unhappy family is unhappy in its own way” [125]. In contrast, the so-called “cloud” genes, such as the 123,706 genes unique to CCN-M, represent significant genes uniquely present within this group. This phenomenon may be attributed to inter-individual variability among the samples in this specific cohort, a characteristic typical of open pangenomes that continually acquire an extensive number of novel genes [126]. Furthermore, the sex-dependent aspect has been reassessed, aligning with findings from other studies [12,126,127,128]. Stratification by sex revealed a lower proportion of shared genes among females (5.81%) compared to males (8.11%), suggesting higher inter-individual variability and greater diet responsiveness in females. This pattern is plausibly influenced by sex–hormone–mediated differences in immunity and bile-acid metabolism, rather than skeletal–muscle–derived ammonia alone [123]. Consequently, this implies that hormonal regulation is the more probable primary driver, with factors related to metabolism serving as potential contributors. Furthermore, our high proportion of genes with unknown functions is consistent with previous microbiome studies, which have shown that up to 60% of predicted genes lack annotation [129]. Taken together, these findings indicate the pressure that HFD exerts by (i) narrowing down the gut microbiota (ND), (ii) causing surviving microbes to become highly specialized, (iii) thereby decreasing overall diversity, (iv) causing the functions required to process fat to become over-represented and consistent across individuals. Additionally, our results show that male mice fed ammoniated diets caused extensive changes in metagenomic gene content, which is expected for an open pangenome, as each new sample introduces numerous rare or uniquely observed genes [126], a phenomenon regarded as typical within these types of studies and potentially advantageous to their functional capacities.
When analyzing the significant functional pathways enriched gene ontology (GO) in the microbiomes of mice on an HFCN diet, results suggest adaptive microbial responses to intestinal preservation. The biological process of protein transport reflects the movement of proteins within or between cells through specialized transporters or pores, supporting microbial survival by facilitating nutrient exchange and intercellular signaling [122]. Enrichment of glycosyltransferase activity, a key enzymatic function [130], indicates enhanced mucin glycosylation in the gut, which strengthens the mucus barrier and promotes the production of short-chain fatty acids (SCFAs), such as butyrate [131]. These SCFAs play critical roles in maintaining gut barrier integrity, modulating immune responses, and providing energy to colonocytes [132]. Additionally, increased nucleotidyltransferase activity suggests a microbial strategy to stabilize DNA and RNA. Thus, promoting genetic stability and signaling during metabolic and inflammatory stress [133]. Furthermore, the periplasmic space enclosed by the outer membrane is regarded as a highly metabolically active compartment, containing numerous essential respiratory electron-transfer proteins [134]. This contributes to considerable respiratory diversity, as these proteins facilitate electron transfer between various electron donors—such as formate, hydrogen, reduced nitrogen species, and reduced sulfur species—and electron acceptors—including nitrogen and sulfur oxyanions, dimethylsulfoxide, and trimethylamine N-oxide [135]. Taken together, the functional profile under HFCN indicates an adaptive microbiome that maintains epithelial integrity and metabolic equilibrium through improved protein trafficking, reinforced mucin glycosylation supported by SCFA, and nucleotidyltransferase-associated genome stability mechanisms that collectively alleviate stress caused by high-fat intake.
Our data presents a multifaceted perspective on using AHE as a supplement that positively impacts specific GO biological processes and cellular components, contributing to microbiome function and microbial colonization dynamics. Other significant functional pathways identified through GO included the citric acid cycle (TCA cycle), defense response to bacteria, outer membrane-bounded periplasmic space, and iron ion binding within the supplemented casein normal diet group. Based on their function in microbiome balance, the TCA cycle includes metabolites such as propionate, which are not only components of cellular metabolism but also serve as intermediates in bacterial fermentation mediated by Prevotella (Bacteroidota) [136]. Intestinal TCA intermediates might be potential markers for early diagnosis of intestinal disease [137], suggesting that microbes could play a critical role in early diagnosis.
While the biological processes in defense response to bacteria are reactions triggered by the presence of a bacterium, they act to protect the cell or organism [138]. Furthermore, the periplasmic space enclosed by the outer membrane is regarded as a highly metabolically active compartment, containing numerous essential respiratory electron-transfer proteins [134]. This contributes to considerable respiratory diversity, as these proteins facilitate electron transfer between various electron donors, such as formate, hydrogen, reduced nitrogen species, and reduced sulfur species, and electron acceptors, including nitrogen and sulfur oxyanions, dimethylsulfoxide, and trimethylamine N-oxide [135]. This suggests that its primary biological role is crucial in determining the microbe’s success or failure to establish bacterial colonization of a specific taxon. Following up, iron ion binding, as an essential element, is also extensively required across the bacterial domain, functioning as a cofactor in iron-containing proteins for redox reactions, metabolic pathways, and the electron transport chain process [139]. Also, iron is critical for the replication and survival of almost all bacteria [139]. In both CC and HFD contexts, AHE supplementation seems to strengthen microbiome resilience through the augmentation of core metabolic functions such as the TCA cycle and propionate production, the reinforcement of antibacterial defenses, the expansion of periplasmic respiratory flexibility, and the optimization of iron-utilization pathways. Collectively, these effects contribute to the stability of the gut barrier and competitive colonization.
For the unsupplemented high-fat casein (HFC) group, heme binding was the only pathway that showed significant enrichment. Heme availability in the gut can serve as a strong selective pressure in favoring bacteria with systems to acquire and detoxify heme. Too much dietary heme has been tied to gut dysbiosis, oxidative stress, and damage to the epithelial lining, which may increase inflammation and contribute to colon disease [140,141]. In contrast, the unsupplemented normal-fat casein (CC) group showed enrichment of broader metabolic and structural functions, including the respiratory electron transport chain, glutathione metabolism, regulation of cell shape, and DNA replication. The enrichment of respiratory pathways suggests a metabolically active and diverse microbiome capable of utilizing various electron acceptors, supporting efficient energy production under balanced gut conditions [142]. Glutathione metabolism reflects microbial and host mechanisms to maintain redox balance and protect against oxidative stress [143]. The regulation of cell shape indicates peptidoglycan remodeling to adapt to environmental pressures, while DNA replication enrichment suggests active microbial proliferation, highlighting a stable and dynamic microbiome in CC [137,144]. These findings suggest that a high-fat casein diet drives a specialized response focused on heme utilization, whereas a normal-fat casein diet supports a more diverse and functionally balanced microbial community.
Having established diet-specific functional shifts, we now examine sexually dimorphic responses to understand how sex influences these patterns of the microbiome. Control low-fat diet females (CCN-F and CC-F) exhibit a microbiome characterized by active growth and vigorous metabolic activity, as evidenced by the enrichment of DNA replication and flavin adenine dinucleotide (FAD) binding pathways. FAD is a vital redox cofactor involved in numerous enzymatic processes, including energy metabolism and the response to oxidative stress, thereby implying that these microbial communities are metabolically diverse and stable [143]. The detection of DNA replication genes indicates a high rate of bacterial turnover, a feature commonly associated with healthy and balanced microbiota within a stable dietary context [144]. Conversely, high-fat females (HFCN-F and HFC-F) demonstrate an enrichment of pathways related to iron-sulfur (Fe-S) cluster binding and identical protein binding, suggesting an adaptive response to oxidative and metabolic stressors. Fe-S clusters are fundamental for redox reactions and electron transport. However, under high-fat dietary conditions, their dysregulation may exacerbate oxidative stress and contribute to gut dysbiosis [145]. These findings suggest that HFD may alter the microbiome towards functions associated with a stress response and altered energy metabolism, aligning with reports that dietary fat intake promotes pro-oxidative environments and disrupts gut homeostasis [146], suggesting that relative to non-AHE groups, AHE modestly amplified stress-associated functions in females on HFD, particularly iron–sulfur cluster and identical-protein binding, while leaving the core CC female profile (DNA replication and FAD-binding enrichment) largely intact. In contrast to the females, among control males, enrichment of NADH dehydrogenase (ubiquinone) activity suggests efficient electron transport and energy conservation, which are hallmarks of stable microbial communities [142]. Conversely, HFD males exhibited enrichment in respiratory electron transport chain, plasma membrane components, and pyridoxal phosphate (vitamin B6) binding, as well as lyase activity, indicating metabolic remodeling to cope with the increased fat load. Vitamin B6-dependent enzymes play critical roles in amino acid metabolism and the control of inflammation, which may reflect a compensatory mechanism in response to high-fat diet-induced gut inflammation [147]. These GO results suggest that HFD guides the microbiome towards stress mitigation and modified energy metabolism; females exhibit a redox-stress shift (amplified by AHE in certain contexts). However, when AHE is combined with HFD, a modest rebalancing is observed, with reduced redox-stress signatures in females and enhanced electron-transport and B-vitamin–linked functions in males, aligning with partial functional buffering of HFD effects.
This study highlights distinct microbiome shifts that are dependent on diet and sex in the context of HFD and Western-style diets. It demonstrates that AHE can modulate these responses by amplifying redox-stress signatures in certain female HFD contexts, while also modestly rebalancing redox states and augmenting electron-transport and B-vitamin–related functions, particularly in males. From a taxonomic perspective, Akkermansia muciniphila remains a predominant genus, alongside short-chain fatty acid (SCFA) and incretin signaling-associated families, such as Lachnospiraceae and Oscillospiraceae. Conversely, the HFD favored opportunistic/commensal taxa, including C. difficile, and bile–acid–responsive taxa, indicative of weakened colonization resistance, a phenomenon considered typical in HFD-induced obesity studies [12,148,149]. Furthermore, the pangenomic analyses indicate patterns of an expanded core genome and “cloud” genes in microbial communities subjected to an HFD despite being under stress. As with numerous metagenomic microbiome studies [46,150], a significant proportion of predicted genes remained unannotated, thereby limiting the depth of functional interpretation. However, in this study, shotgun sequencing provided enhanced sensitivity and functional resolution compared to amplicons [151].

Limitations

It should be noted that the per-sample cost limited the sample size and statistical power, so the results should be regarded as a preliminary microbiome baseline and a hypothesis-generating tool. Future research should be sufficiently powered to enable age-stratified analyses, validate activity through metatranscriptomics and metabolomics, and incorporate bile-acid profiling alongside host metrics. Furthermore, fecal pH was not measured, which could demonstrate pH changes in the colon as well. Until this metric is measured, we cannot state definitively that the pH of the colon was changed by ammoniation, and this event was the impetus for the differences in microbiota abundance. Given the potential presence of a spontaneous mutation in TLR4 in the C3H/HeJ background, extrapolation to TLR4-competent hosts warrants confirmation. To validate this, sequencing of samples is needed [152]. Based on sequencing results, further study into AHE of DPS may be warranted. Lastly, translation to human subjects should consider protein source, heme load, and processing, as well as age and sex stratification, to contextualize AHE’s potential as a clean-label, pH-modulating adjunct in mitigating HFD-associated dysbiosis.

5. Conclusions

Overall, our results are considered novel, as they are the first to examine AHE in conjunction with a Western-style diet using casein as a protein source across high-fat and normal-fat diet regimens. This study employs long-term, sex-stratified shotgun metagenomics that correlates with body weight and survivorship. Under HFD conditions, microbiomes shifted from growth/versatility to stress mitigation and altered energy metabolism. AHE groups, particularly females, most effectively rebalanced this state by maintaining the predominance of health-linked taxa, such as emerging actionable biomarkers/targets and the mucin degrader Akkermansia muciniphila. Other beneficial taxa were also found, including Lactococcus lactis, Lactococcus cremoris, Pediococcus acidilactici, and the families Lachnospiraceae/Oscillospiraceae, which are all associated with beneficial health outcomes. Notably, the dominance of Verrucomicrobiota observed in this model is more frequently reported in gut communities than in most murine models, which are typically dominated by Bacteroidota and Bacillota. Therefore, the functional patterns linked to AHE in this research should be viewed in the context of this particular microbial composition. Although AHE correlated with changes in pathways related to electron transport, B-vitamin cofactors, and mucosal/redox activities, these results may not necessarily indicate a universal or causative increase in microbiome resilience. Instead, they suggest that proteins altered by AHE can influence microbial community structure and function under specific dietary and ecological conditions. Collectively, these results support AHE-modified casein as a modulator of gut microbiome composition and metabolic potential in a high-fat diet context, but further validation in systems exhibiting conventional Bacteroidota and Bacillota-dominated microbiomes is required. Such studies will be essential to determine the generalizability, mechanistic basis, and translational relevance of AHE-based dietary strategies, particularly for potential application in human populations.

Supplementary Materials

The following supporting information can be downloaded at: https://www.mdpi.com/article/10.3390/dietetics5010013/s1; File S1: Computer R codes used in this study; Figure S1: Krona pie charts displaying the taxonomic profile of females for Verrumicrobiota based on binned quality metagenomes, expressed in relative abundance (%) as different groups were presented as follows: (A) CCN-F, (B) CC-F, (C) HFCN-F, and (D) HFC-F; Figure S2: Krona pie charts displaying the taxonomic profile of males for Verrumicrobiota based on binned quality metagenomes, expressed in relative abundance (%), as different groups presented as follows: (A) CCN-M, (B) CC-M, (C) HFCN-M, and (D) HFC-M; Figure S3: Bray–Curtis dendrogram heatmaps depicting relative abundance of mice microbiome taxonomic bins at the family level- 70 most abundant families in control (CCN; CC) and high-fat diet (HFCN; HFC) groups; Figure S4: Bray–Curtis dendrogram heatmaps depicting relative abundance of mice microbiome taxonomic bins at the species level for the 276 most abundant species. In control (CCN; CC) and high-fat diet (HFCN; HFC) groups.

Author Contributions

Conceptualization, B.M.-T., E.G., A.K., and L.S.G.; methodology, A.K., B.M.-T., E.G., B.B., A.M.V.B., and L.S.G.; validation, A.K., B.M.-T., B.B., A.M.V.B., and L.S.G.; formal analysis, A.K., B.M.-T., B.B., and A.M.V.B.; investigation, E.G., B.M.-T., A.K., B.B., and A.M.V.B.; resources, M.M.B. and L.S.G.; data curation, A.M.V.B. and L.S.G.; writing—original draft preparation, B.M.-T. and A.K.; writing—review and editing, B.M.-T., A.K., A.M.V.B., M.M.B., and L.S.G.; supervision, A.M.V.B., M.M.B., and L.S.G.; project administration, L.S.G.; funding acquisition, M.M.B. and L.S.G. All authors have read and agreed to the published version of the manuscript.

Funding

This project was funded by Empirical Foods Inc. (Grant # A18-0187) (L.S.G. and M.M.B.). Facilities were provided by Texas Tech University.

Institutional Review Board Statement

The animal study protocol was approved by the Institutional Animal Care and Safety Committee (IACUC) of Texas Tech University (protocol 19021-02, (approval date, 12 February 2019)) for performance in mice.

Data Availability Statement

All sequence data from fecal samples have been deposited in the Sequence Read Archive (SRA) under BioProject number PRJNA1085270. All scripts used for data analysis are available in Supplementary File S1. Raw data and R code for the Loess and Kaplan–Meier curve are available at: https://github.com/BenjaminBarr/Microbiome---HFC-and-HFCN/releases/tag/v1, https://github.com/BenjaminBarr/Microbiome---HFC-and-HFCN/releases/tag/v1 (accessed on 16 November 2025).

Acknowledgments

We thank Nicholas Wolpert for help with graph creation in R.

Conflicts of Interest

The authors declare that this study received funding from Empirical Foods Inc. The funder was not involved in the study design, collection, analysis, interpretation of data, the writing of this article, or the decision to submit it for publication. The authors declare that the research was conducted in the absence of any commercial or financial relationships that could be construed as a potential conflict of interest.

References

  1. Liu, Y.; Gu, Y.; Mu, J.; Duan, Z.; Wang, X.; Ren, X.; Liu, L.; Xu, J.; Zhang, C.; Zhou, S.; et al. Relationship between Breastfeeding Duration, Lifestyle and Obesity in Children Aged 3–16 Years: A Cross-Sectional Study. Front. Nutr. 2025, 12, 1598141. [Google Scholar] [CrossRef] [Scilit]
  2. World Obesity Day 2022—Accelerating Action to Stop Obesity. Available online: https://www.who.int/news/item/04-03-2022-world-obesity-day-2022-accelerating-action-to-stop-obesity (accessed on 1 September 2025).
  3. Yang, M.; Liu, S.; Zhang, C. The Related Metabolic Diseases and Treatments of Obesity. Healthcare 2022, 10, 1616. [Google Scholar] [CrossRef] [Scilit] [PubMed]
  4. Fan, S.; Chen, S.; Lin, L. Research Progress of Gut Microbiota and Obesity Caused by High-Fat Diet. Front. Cell. Infect. Microbiol. 2023, 13, 1139800. [Google Scholar] [CrossRef] [Scilit]
  5. Wang, X.; Yang, Q.; Shi, C.; Wang, Y.; Guo, D.; Wan, X.; Dong, P.; Zhang, Q.; Hu, Y.; Zhang, R.; et al. Carbon Dioxide Enhances Akkermansia muciniphila Fitness and Anti-Obesity Efficacy in High-Fat Diet Mice. ISME J. 2025, 19, wraf034. [Google Scholar] [CrossRef] [Scilit]
  6. Chiron, F.; Thomas, C.; Bardin, J.; Mullie, F.; Bennett, S.; Chéradame, J.; Caliz, L.; Hanon, C.; Tiollier, E. Influence of Ingestion of Bicarbonate-Rich Water Combined with an Alkalizing or Acidizing Diet on Acid-Base Balance and Anaerobic Performance. J. Hum. Kinet. 2024, 93, 105–117. [Google Scholar] [CrossRef] [Scilit] [PubMed]
  7. Mokhtari, E.; Mirzaei, S.; Asadi, A.; Akhlaghi, M.; Saneei, P. Association between Plant-Based Diets and Metabolic Health Status in Adolescents with Overweight and Obesity. Sci. Rep. 2022, 12, 13772. [Google Scholar] [CrossRef] [Scilit]
  8. Ronda-Pérez, E.; Campos-Mora, J.; De Juan, A.; Gea, T.; Reid, A.; Caballero, P. Differences in the Prevalence of Fruit and Vegetable Consumption in Spanish Workers. Nutrients 2020, 12, 3848. [Google Scholar] [CrossRef] [Scilit]
  9. Williamson, M.; Moustaid-Moussa, N.; Gollahon, L. The Molecular Effects of Dietary Acid Load on Metabolic Disease (The Cellular PasaDoble: The Fast-Paced Dance of pH Regulation). Front. Mol. Med. 2021, 1, 777088. [Google Scholar] [CrossRef] [Scilit]
  10. Huang, R.; Sun, W. Reversible Acute Blindness in Suspected Metformin-Associated Lactic Acidosis. Preprint 2023. [Google Scholar] [CrossRef] [Scilit]
  11. Kopp, W. How Western Diet and Lifestyle Drive The Pandemic of Obesity and Civilization Diseases. DMSO 2019, 12, 2221–2236. [Google Scholar] [CrossRef] [Scilit] [PubMed]
  12. Garrison, E.C.; Brown, A.M.V.; Salazar, M.M.; Barr, B.; Moustaïd-Moussa, N.; Gollahon, L. Microbiome Taxonomic and Functional Differences in C3h/HeJ Mice Fed a Long-Term High-Fat Diet With Beef Protein ± Ammonium Hydroxide Supplementation. Nutrients 2024, 16, 1613. [Google Scholar] [CrossRef] [Scilit] [PubMed]
  13. Portela, N.D.; Galván, C.; Sanmarco, L.M.; Bergero, G.; Aoki, M.P.; Cano, R.C.; Pesoa, S.A. Omega-3-Supplemented Fat Diet Drives Immune Metabolic Response in Visceral Adipose Tissue by Modulating Gut Microbiota in a Mouse Model of Obesity. Nutrients 2023, 15, 1404. [Google Scholar] [CrossRef] [Scilit] [PubMed]
  14. Paone, P.; Suriano, F.; Jian, C.; Korpela, K.; Delzenne, N.M.; Van Hul, M.; Salonen, A.; Cani, P.D. Prebiotic Oligofructose Protects against High-Fat Diet-Induced Obesity by Changing the Gut Microbiota, Intestinal Mucus Production, Glycosylation and Secretion. Gut Microbes 2022, 14, 2152307. [Google Scholar] [CrossRef] [Scilit] [PubMed]
  15. Paone, P.; Latousakis, D.; Terrasi, R.; Vertommen, D.; Jian, C.; Borlandelli, V.; Suriano, F.; Johansson, M.E.V.; Puel, A.; Bouzin, C.; et al. Human Milk Oligosaccharide 2′-Fucosyllactose Protects against High-Fat Diet-Induced Obesity by Changing Intestinal Mucus Production, Composition and Degradation Linked to Changes in Gut Microbiota and Faecal Proteome Profiles in Mice. Gut 2024, 73, 1632–1649. [Google Scholar] [CrossRef] [Scilit]
  16. Li, Z.; Zhou, E.; Liu, C.; Wicks, H.; Yildiz, S.; Razack, F.; Ying, Z.; Kooijman, S.; Koonen, D.P.Y.; Heijink, M.; et al. Dietary Butyrate Ameliorates Metabolic Health Associated with Selective Proliferation of Gut Lachnospiraceae Bacterium 28-4. JCI Insight 2023, 8, e166655. [Google Scholar] [CrossRef] [Scilit]
  17. Abbasi, E.; Khodadadi, I. High-Fat Diet May Increase the Risk of Insulin Resistance by Inducing Dysbiosis. Metabol. Open 2025, 27, 100381. [Google Scholar] [CrossRef] [Scilit]
  18. Menikdiwela, K.R.; Guimarães, J.P.T.; Scoggin, S.; Gollahon, L.S.; Moustaid-Moussa, N. Dietary pH En-hancement Improves Metabolic Outcomes in Diet-Induced Obese Male and Female Mice: Effects of Beef vs. Casein Proteins. Nutrients 2022, 14, 2583. [Google Scholar] [CrossRef] [Scilit]
  19. Ijaz, M.U.; Ahmed, M.I.; Zou, X.; Hussain, M.; Zhang, M.; Zhao, F.; Xu, X.; Zhou, G.; Li, C. Beef, Casein, and Soy Proteins Differentially Affect Lipid Metabolism, Triglycerides Accumulation and Gut Microbiota of High-Fat Diet-Fed C57BL/6J Mice. Front. Microbiol. 2018, 9, 2200. [Google Scholar] [CrossRef] [Scilit]
  20. Xing, W.; Yu, J.; Cui, S.; Liu, L.; Zhi, Y.; Zhang, T.; Zhou, J. Analysis of the Correlation between Gut Microbiome Imbalance and the Development of Endometrial Cancer Based on Metagenomics. Medicine 2024, 103, e39596. [Google Scholar] [CrossRef] [Scilit]
  21. Barr, B.; Gollahon, L. The Modification of Dietary Protein with Ammonium Hydroxide Enhancement Improves Longevity and Metabolic Outcomes in a Sex-Dependent Manner. Nutrients 2024, 16, 2787. [Google Scholar] [CrossRef] [Scilit] [PubMed]
  22. Hwalla, N.; Jaafar, Z.; Sawaya, S. Dietary Management of Type 2 Diabetes in the MENA Region: A Review of the Evidence. Nutrients 2021, 13, 1060. [Google Scholar] [CrossRef] [Scilit] [PubMed]
  23. Wang, Y.; Wang, K.; Xiang, X.; Zhang, S.; Huang, J.; Tang, C.; Wang, Q. A Novel Complex of Pectin-crosslinked Β-cyclodextrin: Effectively Reducing Cholesterol Content in Hotpot Beef Tallow. J. Food Sci. 2025, 90, e70056. [Google Scholar] [CrossRef] [Scilit] [PubMed]
  24. Braden-Kuhle, P.N.; Lacy, V.A.; Brice, K.N.; Bertrand, M.E.; Uras, H.B.; Shoffner, C.; Fischer, B.E.; Rana, A.; Willis, J.L.; Boehm, G.W.; et al. A Mediterranean-Style Diet Protects against Cognitive and Behavioral Deficits, Adiposity, and Alzheimer’s Disease-Related Markers, Compared to a Macronutrient-Matched Typical American Diet in C57BL/6J Mice. J. Alzheimer’s Dis. 2025, 104, 678–697. [Google Scholar] [CrossRef] [Scilit]
  25. Zhu, Q.; Qi, N.; Shen, L.; Lo, C.C.; Xu, M.; Duan, Q.; Ollberding, N.J.; Wu, Z.; Hui, D.Y.; Tso, P.; et al. Sexual Dimorphism in Lipid Metabolism and Gut Microbiota in Mice Fed a High-Fat Diet. Nutrients 2023, 15, 2175. [Google Scholar] [CrossRef] [Scilit]
  26. Lefebvre, C.; Tiffay, A.; Breemeersch, C.-E.; Dreux, V.; Bôle-Feysot, C.; Guérin, C.; Breton, J.; Maximin, E.; Monnoye, M.; Déchelotte, P.; et al. Sex-Dependent Effects of a High Fat Diet on Metabolic Disorders, Intestinal Barrier Function and Gut Microbiota in Mouse. Sci. Rep. 2024, 14, 19835. [Google Scholar] [CrossRef] [Scilit]
  27. Glenny, E.M.; Liu, J.; Skinner, H.G.; McFarlane, T.L.; Reed, K.K.; Weninger, A.; Djukic, Z.; Pellizzon, M.A.; Carroll, I.M. Purified Diets Containing High Levels of Soluble Fiber and Grain-Based Diets Promote Similar Gastrointestinal Morphometry yet Distinct Microbial Communities. Appl. Environ. Microbiol. 2024, 90, e01552-24. [Google Scholar] [CrossRef] [Scilit]
  28. Yi, L.; Li, Z.; Xu, H.; Shi, D.; Huang, Y.; Pan, H.; Zhao, Y.; Zhao, H.; Yang, M.; Wei, H.; et al. Microbiota-Based Intervention Alleviates High-Fat Diet Consequences Through Host-Microbe Environment Remodeling. Nutrients 2025, 17, 1402. [Google Scholar] [CrossRef] [Scilit]
  29. Barr, B.; Gollahon, L. The Effects of Obesity on Sex, Aging, and Cancer Development in a Longitudinal Study of High-Fat-Diet-Fed C3H/HeJ Mice. Obesities 2024, 4, 314–328. [Google Scholar] [CrossRef] [Scilit]
  30. Boren, C.; Barr, B.; Mubtasim, N.; Gollahon, L. Adipocytokine Protein Expression from Visceral Fat Differs Significantly Based on Diet, Sex, and Age in C3H/HeJ Mice Fed Long-Term, High-Fat Diets, ±Ammonium-Hydroxide-Supplemented Dietary Protein. CIMB 2025, 47, 218. [Google Scholar] [CrossRef] [Scilit]
  31. Planer, J.D.; Peng, Y.; Kau, A.L.; Blanton, L.V.; Ndao, I.M.; Tarr, P.I.; Warner, B.B.; Gordon, J.I. Development of the Gut Microbiota and Mucosal IgA Responses in Twins and Gnotobiotic Mice. Nature 2016, 534, 263–266. [Google Scholar] [CrossRef] [Scilit]
  32. Liu, R.; Kang, J.D.; Sartor, R.B.; Sikaroodi, M.; Fagan, A.; Gavis, E.A.; Zhou, H.; Hylemon, P.B.; Herzog, J.W.; Li, X.; et al. Neuroinflammation in Murine Cirrhosis Is Dependent on the Gut Microbiome and Is Attenuated by Fecal Transplant. Hepatology 2020, 71, 611–626. [Google Scholar] [CrossRef] [Scilit]
  33. Koren, O.; Goodrich, J.K.; Cullender, T.C.; Spor, A.; Laitinen, K.; Kling Bäckhed, H.; Gonzalez, A.; Werner, J.J.; Angenent, L.T.; Knight, R.; et al. Host Remodeling of the Gut Microbiome and Metabolic Changes during Pregnancy. Cell 2012, 150, 470–480. [Google Scholar] [CrossRef] [Scilit]
  34. Zhang, J.; Kobert, K.; Flouri, T.; Stamatakis, A. PEAR: A Fast and Accurate Illumina Paired-End reAd mergeR. Bioinformatics 2014, 30, 614–620. [Google Scholar] [CrossRef] [Scilit]
  35. Bolger, A.M.; Lohse, M.; Usadel, B. Trimmomatic: A Flexible Trimmer for Illumina Sequence Data. Bioinformatics 2014, 30, 2114–2120. [Google Scholar] [CrossRef] [Scilit]
  36. Nurk, S.; Meleshko, D.; Korobeynikov, A.; Pevzner, P.A. metaSPAdes: A New Versatile Metagenomic Assembler. Genome Res. 2017, 27, 824–834. [Google Scholar] [CrossRef] [Scilit]
  37. Uritskiy, G.V.; DiRuggiero, J.; Taylor, J. MetaWRAP—A Flexible Pipeline for Genome-Resolved Metagenomic Data Analysis. Microbiome 2018, 6, 158. [Google Scholar] [CrossRef] [Scilit] [PubMed]
  38. Alneberg, J.; Bjarnason, B.S.; de Bruijn, I.; Schirmer, M.; Quick, J.; Ijaz, U.Z.; Loman, N.J.; Andersson, A.F.; Quince, C. CONCOCT: Clustering cONtigs on COverage and ComposiTion. arXiv 2013, arXiv:1312.4038. [Google Scholar] [CrossRef] [Scilit]
  39. Wu, Y.-W.; Simmons, B.A.; Singer, S.W. MaxBin 2.0: An Automated Binning Algorithm to Recover Genomes from Multiple Metagenomic Datasets. Bioinformatics 2016, 32, 605–607. [Google Scholar] [CrossRef] [Scilit]
  40. Kang, D.D.; Li, F.; Kirton, E.; Thomas, A.; Egan, R.; An, H.; Wang, Z. MetaBAT 2: An Adaptive Binning Algorithm for Robust and Efficient Genome Reconstruction from Metagenome Assemblies. PeerJ 2019, 7, e7359. [Google Scholar] [CrossRef] [Scilit] [PubMed]
  41. Parks, D.H.; Imelfort, M.; Skennerton, C.T.; Hugenholtz, P.; Tyson, G.W. CheckM: Assessing the Quality of Microbial Genomes Recovered from Isolates, Single Cells, and Metagenomes. Genome Res. 2015, 25, 1043–1055. [Google Scholar] [CrossRef] [Scilit]
  42. Patro, R.; Duggal, G.; Love, M.I.; Irizarry, R.A.; Kingsford, C. Salmon Provides Fast and Bias-Aware Quantification of Transcript Expression. Nat. Methods 2017, 14, 417–419. [Google Scholar] [CrossRef] [Scilit] [PubMed]
  43. Kim, D.; Song, L.; Breitwieser, F.P.; Salzberg, S.L. Centrifuge: Rapid and Sensitive Classification of Metagenomic Sequences. Genome Res. 2016, 26, 1721–1729. [Google Scholar] [CrossRef] [Scilit]
  44. Kumar, S.; Jones, M.; Koutsovoulos, G.; Clarke, M.; Blaxter, M. Blobology: Exploring Raw Genome Data for Contaminants, Symbionts and Parasites Using Taxon-Annotated GC-Coverage Plots. Front. Genet. 2013, 4, 237. [Google Scholar] [CrossRef] [Scilit]
  45. Camacho, C.; Coulouris, G.; Avagyan, V.; Ma, N.; Papadopoulos, J.; Bealer, K.; Madden, T.L. BLAST+: Architecture and Applications. BMC Bioinform. 2009, 10, 421. [Google Scholar] [CrossRef] [Scilit]
  46. Blanco-Míguez, A.; Beghini, F.; Cumbo, F.; McIver, L.J.; Thompson, K.N.; Zolfo, M.; Manghi, P.; Dubois, L.; Huang, K.D.; Thomas, A.M.; et al. Extending and Improving Metagenomic Taxonomic Profiling with Uncharacterized Species Using MetaPhlAn 4. Nat. Biotechnol. 2023, 41, 1633–1644. [Google Scholar] [CrossRef] [Scilit]
  47. McMurdie, P.J.; Holmes, S. Phyloseq: An R Package for Reproducible Interactive Analysis and Graphics of Microbiome Census Data. PLoS ONE 2013, 8, e61217. [Google Scholar] [CrossRef] [Scilit]
  48. Wickham, H. Ggplot2. WIREs Comput. Stats. 2011, 3, 180–185. [Google Scholar] [CrossRef] [Scilit]
  49. Li, S.; Vogtmann, E.; Graubard, B.I.; Gail, M.H.; Abnet, C.C.; Shi, J. fast.adonis: A Computationally Efficient Non-Parametric Multivariate Analysis of Microbiome Data for Large-Scale Studies. Bioinform. Adv. 2022, 2, vbac044. [Google Scholar] [CrossRef] [Scilit]
  50. Mandal, S.; Van Treuren, W.; White, R.A.; Eggesbø, M.; Knight, R.; Peddada, S.D. Analysis of Composition of Microbiomes: A Novel Method for Studying Microbial Composition. Microb. Ecol. Health Dis. 2015, 26, 27663. [Google Scholar] [CrossRef] [Scilit] [PubMed]
  51. Lin, H.; Peddada, S.D. Multigroup Analysis of Compositions of Microbiomes with Covariate Adjustments and Repeated Measures. Nat. Methods 2024, 21, 83–91. [Google Scholar] [CrossRef] [Scilit] [PubMed]
  52. Seemann, T. Prokka: Rapid Prokaryotic Genome Annotation. Bioinformatics 2014, 30, 2068–2069. [Google Scholar] [CrossRef] [Scilit]
  53. Page, A.J.; Cummins, C.A.; Hunt, M.; Wong, V.K.; Reuter, S.; Holden, M.T.G.; Fookes, M.; Falush, D.; Keane, J.A.; Parkhill, J. Roary: Rapid Large-Scale Prokaryote Pan Genome Analysis. Bioinformatics 2015, 31, 3691–3693. [Google Scholar] [CrossRef] [Scilit] [PubMed]
  54. Alexa, A.; Rahnenfuhrer, J. R Package, Version 2.40.0; topGO: Enrichment Analysis for Gene Ontology. 2020. Available online: https://bioconductor.org/packages/release/bioc/html/topGO.html (accessed on 29 June 2025).
  55. Martineau, R.; Ouellet, D.R.; Patton, R.A.; White, R.R.; Lapierre, H. Plasma Essential Amino Acid Concentrations in Response to Casein Infusion or Ration Change in Dairy Cows: A Multilevel, Mixed-Effects Meta-Analysis. J. Dairy Sci. 2019, 102, 1312–1329. [Google Scholar] [CrossRef] [Scilit]
  56. Hases, L.; Stepanauskaite, L.; Birgersson, M.; Brusselaers, N.; Schuppe-Koistinen, I.; Archer, A.; Engstrand, L.; Williams, C. High-Fat Diet and Estrogen Modulate the Gut Microbiota in a Sex-Dependent Manner in Mice. Commun. Biol. 2023, 6, 20. [Google Scholar] [CrossRef] [Scilit]
  57. Liu, H.; Huang, R.; Shen, B.; Huang, C.; Zhou, Q.; Xu, J.; Chen, S.; Lin, X.; Wang, J.; Zhao, X.; et al. Live Akkermansia muciniphila Boosts Dendritic Cell Retinoic Acid Synthesis to Modulate IL-22 Activity and Mitigate Colitis in Mice. Microbiome 2024, 12, 275. [Google Scholar] [CrossRef] [Scilit]
  58. Zheng, R.; Xiang, X.; Shi, Y.; Xie, J.; Xing, L.; Zhang, T.; Zhou, Z.; Zhang, D. Gut Microbiota and Mycobiota Change with Feeding Duration in Mice on a High-Fat and High-Fructose Diet. BMC Microbiol. 2024, 24, 504. [Google Scholar] [CrossRef] [Scilit]
  59. Han, H.; Xiong, H.; Liu, Z.; Liu, X.; Wang, H.; Kou, J.; Yi, D.; Shi, Y.; Wu, H.; Qiao, J. Pasteurized Akkermansia muciniphila Timepie001 Ameliorates DSS-Induced Ulcerative Colitis in Mice by Alleviating Intestinal Injury and Modulating Gut Microbiota. Front. Microbiol. 2025, 16, 1542522. [Google Scholar] [CrossRef] [Scilit]
  60. Hwang, H.-G.; Park, J.-W.; Lee, H.-J.; Ko, M.Y.; Ka, M.; Lee, Y.K.; Choi, J.; In, S.-A.; Lee, Y.-E.; Lee, S.; et al. Akkermansia muciniphila Reverses Neuronal Atrophy in Negr1 Knockout Mice with Depression-like Phenotypes. Gut Microbes 2025, 17, 2508424. [Google Scholar] [CrossRef] [Scilit] [PubMed]
  61. He, K.-Y.; Lei, X.-Y.; Wu, D.-H.; Zhang, L.; Li, J.-Q.; Li, Q.-T.; Yin, W.-T.; Zhao, Z.-L.; Liu, H.; Xiang, X.-Y.; et al. Akkermansia muciniphila Protects the Intestine from Irradiation-Induced Injury by Secretion of Propionic Acid. Gut Microbes 2023, 15, 2293312. [Google Scholar] [CrossRef] [Scilit] [PubMed]
  62. Fujio-Vejar, S.; Vasquez, Y.; Morales, P.; Magne, F.; Vera-Wolf, P.; Ugalde, J.A.; Navarrete, P.; Gotteland, M. The Gut Microbiota of Healthy Chilean Subjects Reveals a High Abundance of the Phylum Verrucomicrobia. Front. Microbiol. 2017, 8, 1221. [Google Scholar] [CrossRef] [Scilit]
  63. Panzetta, M.E.; Valdivia, R.H. Akkermansia in the Gastrointestinal Tract as a Modifier of Human Health. Gut Microbes 2024, 16, 2406379. [Google Scholar] [CrossRef] [Scilit]
  64. Parrish, A.; Boudaud, M.; Grant, E.T.; Willieme, S.; Neumann, M.; Wolter, M.; Craig, S.Z.; De Sciscio, A.; Cosma, A.; Hunewald, O.; et al. Akkermansia muciniphila Exacerbates Food Allergy in Fibre-Deprived Mice. Nat. Microbiol. 2023, 8, 1863–1879. [Google Scholar] [CrossRef] [Scilit]
  65. Yue, C.; Chu, C.; Zhao, J.; Zhang, H.; Chen, W.; Zhai, Q. Dietary Strategies to Promote the Abundance of Intestinal Akkermansia muciniphila, a Focus on the Effect of Plant Extracts. J. Funct. Foods 2022, 93, 105093. [Google Scholar] [CrossRef] [Scilit]
  66. Niu, H.; Zhou, M.; Zogona, D.; Xing, Z.; Wu, T.; Chen, R.; Cui, D.; Liang, F.; Xu, X. Akkermansia muciniphila: A Potential Candidate for Ameliorating Metabolic Diseases. Front. Immunol. 2024, 15, 1370658. [Google Scholar] [CrossRef] [Scilit]
  67. Roopchand, D.E.; Carmody, R.N.; Kuhn, P.; Moskal, K.; Rojas-Silva, P.; Turnbaugh, P.J.; Raskin, I. Dietary Polyphenols Promote Growth of the Gut Bacterium Akkermansia muciniphila and Attenuate High-Fat Diet–Induced Metabolic Syndrome. Diabetes 2015, 64, 2847–2858. [Google Scholar] [CrossRef] [Scilit] [PubMed]
  68. Zhao, F.; Zhou, G.; Liu, X.; Song, S.; Xu, X.; Hooiveld, G.; Müller, M.; Liu, L.; Kristiansen, K.; Li, C. Dietary Protein Sources Differentially Affect the Growth of Akkermansia muciniphila and Maintenance of the Gut Mucus Barrier in Mice. Mol. Nutr. Food Res. 2019, 63, 1900589. [Google Scholar] [CrossRef] [Scilit] [PubMed]
  69. Steimle, A.; Neumann, M.; Grant, E.T.; Turner, J.D.; Desai, M.S. Concentrated Raw Fibers Enhance the Fiber-Degrading Capacity of a Synthetic Human Gut Microbiome. Int. J. Mol. Sci. 2021, 22, 6855. [Google Scholar] [CrossRef] [Scilit] [PubMed]
  70. Iwaza, R.; Wasfy, R.M.; Dubourg, G.; Raoult, D.; Lagier, J.-C. Akkermansia muciniphila: The State of the Art, 18 Years after Its First Discovery. Front. Gastroenterol. 2022, 1, 1024393. [Google Scholar] [CrossRef] [Scilit]
  71. Tian, R.; Yu, L.; Tian, F.; Zhao, J.; Chen, W.; Zhai, Q. Effect of Inulin, Galacto-Oligosaccharides, and Polyphenols on the Gut Microbiota, with a Focus on Akkermansia muciniphila. Food Funct. 2024, 15, 4763–4772. [Google Scholar] [CrossRef] [Scilit]
  72. Huda, M.N.; Salvador, A.C.; Barrington, W.T.; Gacasan, C.A.; D’Souza, E.M.; Deus Ramirez, L.; Threadgill, D.W.; Bennett, B.J. Gut Microbiota and Host Genetics Modulate the Effect of Diverse Diet Patterns on Metabolic Health. Front. Nutr. 2022, 9, 896348. [Google Scholar] [CrossRef] [Scilit]
  73. Mierlan, O.L.; Busila, C.; Amaritei, O.; Elena, D.; Raileanu, C.R.; Maftei, N.-M.; Matei, M.N.; Gurau, G. Akkermansia muciniphila in Metabolic Disease: Far from Perfect. Int. J. Mol. Sci. 2025, 26, 11602. [Google Scholar] [CrossRef] [Scilit]
  74. Rodríguez-Daza, M.C.; De Vos, W.M. Polyphenols as Drivers of a Homeostatic Gut Microecology and Immuno-Metabolic Traits of Akkermansia muciniphila: From Mouse to Man. Int. J. Mol. Sci. 2022, 24, 45. [Google Scholar] [CrossRef] [Scilit]
  75. Geng, J.; Ni, Q.; Sun, W.; Li, L.; Feng, X. The Links between Gut Microbiota and Obesity and Obesity Related Diseases. Biomed. Pharmacother. 2022, 147, 112678. [Google Scholar] [CrossRef] [Scilit] [PubMed]
  76. Elzinga, J.; Narimatsu, Y.; De Haan, N.; Clausen, H.; De Vos, W.M.; Tytgat, H.L.P. Binding of Akkermansia muciniphila to Mucin Is O-Glycan Specific. Nat. Commun. 2024, 15, 4582. [Google Scholar] [CrossRef] [Scilit]
  77. Schwabkey, Z.; Wiesnoski, D.H.; Chang, C.-C.; Tsai, W.-B.; Pham, D.; Ahmed, S.S.; Hayase, T.; Ortega Turrubiates, M.R.; El-Himri, R.K.; Sanchez, C.A.; et al. Diet-Derived Metabolites and Mucus Link the Gut Microbiome to Fever after Cytotoxic Cancer Treatment. bioRxiv 2021. [Google Scholar] [CrossRef] [Scilit]
  78. Zabolotneva, A.A.; Kolesnikova, I.M.; Vasiliev, I.Y.; Grigoryeva, T.V.; Roumiantsev, S.A.; Shestopalov, A.V. The Obesogenic Gut Microbiota as a Crucial Factor Defining the Depletion of Predicted Enzyme Abundance for Vitamin B12 Synthesis in the Mouse Intestine. Biomedicines 2024, 12, 1280. [Google Scholar] [CrossRef] [Scilit]
  79. Raftar, S.K.A.; Ashrafian, F.; Abdollahiyan, S.; Yadegar, A.; Moradi, H.R.; Masoumi, M.; Vaziri, F.; Moshiri, A.; Siadat, S.D.; Zali, M.R. The Anti-Inflammatory Effects of Akkermansia muciniphila and Its Derivates in HFD/CCL4-Induced Murine Model of Liver Injury. Sci. Rep. 2022, 12, 2453. [Google Scholar] [CrossRef] [Scilit]
  80. Forgie, A.J.; Pepin, D.M.; Ju, T.; Tollenaar, S.; Sergi, C.M.; Gruenheid, S.; Willing, B.P. Over Supplementation with Vitamin B12 Alters Microbe-Host Interactions in the Gut Leading to Accelerated Citrobacter Rodentium Colonization and Pathogenesis in Mice. Microbiome 2023, 11, 21. [Google Scholar] [CrossRef] [Scilit] [PubMed]
  81. Choi, B.S.-Y.; Yang-Jensen, S.K. Obesity Is Transferable through the Gut Microbiota. Nat. Rev. Endocrinol. 2023, 19, 687. [Google Scholar] [CrossRef] [Scilit]
  82. Yan, J.; Sheng, L.; Li, H. Akkermansia muciniphila: Is It the Holy Grail for Ameliorating Metabolic Diseases? Gut Microbes 2021, 13, 1984104. [Google Scholar] [CrossRef] [Scilit] [PubMed]
  83. Russell, A.; Copio, J.N.; Shi, Y.; Kang, S.; Franklin, C.L.; Ericsson, A.C. Reduced Housing Density Improves Statistical Power of Murine Gut Microbiota Studies. Cell Rep. 2022, 39, 110783. [Google Scholar] [CrossRef] [Scilit]
  84. Park, H.A.; Sung, J.; Chang, Y.; Ryu, S.; Yoon, K.J.; Kim, H.; Kim, H. Metagenomic Analysis Identifies Sex-Related Gut Microbial Functions and Bacterial Taxa Associated with Skeletal Muscle Mass. J. Cachexia Sarcopenia Muscle 2025, 16, e13636. [Google Scholar] [CrossRef] [Scilit]
  85. Barr, B.R.; Subramaniyan, I.; Li, L.; Levitt, D.E.; Gollahon, L.S. Ammonium Hydroxide Enhancement of Dietary Protein in High-Fat Diets Modulates Liver Metabolism Signaling in a Sex- and Age-Dependent Manner in C3H/HeJ Mice. Int. J. Mol. Sci. 2025, 27, 403. [Google Scholar] [CrossRef] [Scilit]
  86. Zhang, C.; Hou, T.; Wang, J.; Yu, Q.; Zhang, Y.; Sun, Y. Clostridium Butyricum Alleviates LPS-Induced Acute Immune Stress in Goats by Regulating Bacterial Communities and Blood Metabolites. Front. Immunol. 2023, 14, 1099186. [Google Scholar] [CrossRef] [Scilit]
  87. Vacca, M.; Celano, G.; Calabrese, F.M.; Portincasa, P.; Gobbetti, M.; De Angelis, M. The Controversial Role of Human Gut Lachnospiraceae. Microorganisms 2020, 8, 573. [Google Scholar] [CrossRef] [Scilit]
  88. Yang, J.; Li, Y.; Wen, Z.; Liu, W.; Meng, L.; Huang, H. Oscillospira-a Candidate for the next-Generation Probiotics. Gut Microbes 2021, 13, 1987783. [Google Scholar] [CrossRef] [Scilit]
  89. Choi, S.I.; Kim, N.; Choi, Y.; Nam, R.H.; Jang, J.Y.; Cho, S.-Y. The Effect of Clostridium butyricum on Gut Microbial Changes and Functional Profiles of Metabolism in High-Fat Diet–Fed Rats Depending on Age and Sex. J. Neurogastroenterol. Motil. 2024, 30, 236–250. [Google Scholar] [CrossRef] [Scilit] [PubMed]
  90. Mefferd, C.C.; Bhute, S.S.; Phan, J.R.; Villarama, J.V.; Do, D.M.; Alarcia, S.; Abel-Santos, E.; Hedlund, B.P. A High-Fat/High-Protein, Atkins-Type Diet Exacerbates Clostridioides (Clostridium) difficile Infection in Mice, Whereas a High-Carbohydrate Diet Protects. bioRxiv 2019. [Google Scholar] [CrossRef] [Scilit] [PubMed]
  91. Lagkouvardos, I.; Lesker, T.R.; Hitch, T.C.A.; Gálvez, E.J.C.; Smit, N.; Neuhaus, K.; Wang, J.; Baines, J.F.; Abt, B.; Stecher, B.; et al. Sequence and Cultivation Study of Muribaculaceae Reveals Novel Species, Host Preference, and Functional Potential of this yet Undescribed Family. Microbiome 2019, 7, 28. [Google Scholar] [CrossRef] [Scilit]
  92. Zhu, Y.; Chen, B.; Zhang, X.; Akbar, M.T.; Wu, T.; Zhang, Y.; Zhi, L.; Shen, Q. Exploration of the Muribaculaceae Family in the Gut Microbiota: Diversity, Metabolism, and Function. Nutrients 2024, 16, 2660. [Google Scholar] [CrossRef] [Scilit] [PubMed]
  93. McMillan, A.S.; Theriot, C.M. Bile Acids Impact the Microbiota, Host, and C. difficile Dynamics Providing Insight into Mechanisms of Efficacy of FMTs and Microbiota-Focused Therapeutics. Gut Microbes 2024, 16, 2393766. [Google Scholar] [CrossRef] [Scilit]
  94. Alam, M.Z.; Madan, R. Clostridioides Difficile Toxins: Host Cell Interactions and Their Role in Disease Pathogenesis. Toxins 2024, 16, 241. [Google Scholar] [CrossRef] [Scilit]
  95. Pike, C.M.; Theriot, C.M. Mechanisms of Colonization Resistance Against Clostridioides difficile. J. Infect. Dis. 2021, 223, S194–S200. [Google Scholar] [CrossRef] [Scilit] [PubMed]
  96. Sun, X.; Savidge, T.; Feng, H. The Enterotoxicity of Clostridium Difficile Toxins. Toxins 2010, 2, 1848–1880. [Google Scholar] [CrossRef] [Scilit]
  97. Abad, C.L.R.; Safdar, N. A Review of Clostridioides Difficile Infection and Antibiotic-Associated Diarrhea. Gastroenterol. Clin. N. Am. 2021, 50, 323–340. [Google Scholar] [CrossRef] [Scilit]
  98. Clarke, S.F.; Murphy, E.F.; O’Sullivan, O.; Ross, R.P.; O’Toole, P.W.; Shanahan, F.; Cotter, P.D. Targeting the Microbiota to Address Diet-Induced Obesity: A Time Dependent Challenge. PLoS ONE 2013, 8, e65790. [Google Scholar] [CrossRef] [Scilit] [PubMed]
  99. Luo, Y.; Cheng, R.; Liang, H.; Miao, Z.; Wang, J.; Zhou, Q.; Chen, J.; He, F.; Shen, X. Influence of High-Fat Diet on Host Animal Health via Bile Acid Metabolism and Benefits of Oral-Fed Streptococcus thermophilus MN-ZLW-002. Exp. Anim. 2022, 71, 468–480. [Google Scholar] [CrossRef] [Scilit] [PubMed]
  100. Tang, T.; Leisner, J.J. Bacteriocin Antagonistic Potentials of Lactococcus Cremoris and Lactococcus Lactis Isolates from Different Habitats. Probiotics Antimicro. Prot. 2024, 17, 4203–4214. [Google Scholar] [CrossRef] [Scilit]
  101. Gao, P.; Nie, Y.; Zhao, L.; Zhang, J.; Ge, W. Lactococcus Lactis Subsp. Lactis LL-1 and Lacticaseibacillus Paracasei LP-16 Influence the Gut Microbiota and Metabolites for Anti-Obesity and Hypolipidemic Effects in Mice. Antioxidants 2025, 14, 547. [Google Scholar] [CrossRef] [Scilit]
  102. Müntjes, K.; Philipp, M.; Hüsemann, L.; Heucken, N.; Weidtkamp-Peters, S.; Schipper, K.; Zurbriggen, M.D.; Feldbrügge, M. Establishing Polycistronic Expression in the Model Microorganism Ustilago Maydis. Front. Microbiol. 2020, 11, 1384. [Google Scholar] [CrossRef] [Scilit]
  103. Mazier, W.; Le Corf, K.; Martinez, C.; Tudela, H.; Kissi, D.; Kropp, C.; Coubard, C.; Soto, M.; Elustondo, F.; Rawadi, G.; et al. A New Strain of Christensenella Minuta as a Potential Biotherapy for Obesity and Associated Metabolic Diseases. Cells 2021, 10, 823. [Google Scholar] [CrossRef] [Scilit]
  104. Wang, J.; Ren, W.; Liu, S.; Li, Z.; Zeng, Y.; Meng, J.; Yao, X. Changes in Antioxidant Capacity and Gut Microbiota in Mice after Intake of Camel Milk. Front. Cell. Infect. Microbiol. 2025, 15, 1621031. [Google Scholar] [CrossRef] [Scilit]
  105. Gerritsen, J.; Hornung, B.; Renckens, B.; Van Hijum, S.A.F.T.; Martins Dos Santos, V.A.P.; Rijkers, G.T.; Schaap, P.J.; De Vos, W.M.; Smidt, H. Genomic and Functional Analysis of Romboutsia ilealis CRIBT Reveals Adaptation to the Small Intestine. PeerJ 2017, 5, e3698. [Google Scholar] [CrossRef] [Scilit] [PubMed]
  106. Zheng, Z.; Lyu, W.; Ren, Y.; Li, X.; Zhao, S.; Yang, H.; Xiao, Y. Allobaculum Involves in the Modulation of Intestinal ANGPTLT4 Expression in Mice Treated by High-Fat Diet. Front. Nutr. 2021, 8, 690138. [Google Scholar] [CrossRef] [Scilit]
  107. Volmer, J.G.; Soo, R.M.; Evans, P.N.; Hoedt, E.C.; Astorga Alsina, A.L.; Woodcroft, B.J.; Tyson, G.W.; Hugenholtz, P.; Morrison, M. Isolation and Characterisation of Novel Methanocorpusculum Species Indicates the Genus Is Ancestrally Host-Associated. BMC Biol. 2023, 21, 59. [Google Scholar] [CrossRef] [Scilit]
  108. Oñate, F.P.; Chamignon, C.; Burz, S.D.; Lapaque, N.; Monnoye, M.; Philippe, C.; Bredel, M.; Chêne, L.; Farin, W.; Paillarse, J.-M.; et al. Adlercreutzia Equolifaciens Is an Anti-Inflammatory Commensal Bacterium with Decreased Abundance in Gut Microbiota of Patients with Metabolic Liver Disease. Int. J. Mol. Sci. 2023, 24, 12232. [Google Scholar] [CrossRef] [Scilit]
  109. Hou, K.; Wu, Z.-X.; Chen, X.-Y.; Wang, J.-Q.; Zhang, D.; Xiao, C.; Zhu, D.; Koya, J.B.; Wei, L.; Li, J.; et al. Microbiota in Health and Diseases. Sig. Transduct. Target. Ther. 2022, 7, 135. [Google Scholar] [CrossRef] [Scilit]
  110. Zheng, X.; Huang, F.; Zhao, A.; Lei, S.; Zhang, Y.; Xie, G.; Chen, T.; Qu, C.; Rajani, C.; Dong, B.; et al. Bile Acid Is a Significant Host Factor Shaping the Gut Microbiome of Diet-Induced Obese Mice. BMC Biol. 2017, 15, 120. [Google Scholar] [CrossRef] [Scilit]
  111. Kim, Y.S.; Unno, T.; Kim, B.-Y.; Park, M.-S. Sex Differences in Gut Microbiota. World J. Mens. Health 2020, 38, 48. [Google Scholar] [CrossRef] [Scilit] [PubMed]
  112. Jia, X.; Chen, Q.; Wu, H.; Liu, H.; Jing, C.; Gong, A.; Zhang, Y. Exploring a Novel Therapeutic Strategy: The Interplay between Gut Microbiota and High-Fat Diet in the Pathogenesis of Metabolic Disorders. Front. Nutr. 2023, 10, 1291853. [Google Scholar] [CrossRef] [Scilit] [PubMed]
  113. Rytter, H.; Sturgeon, H.; Chassaing, B. Diet–Pathobiont Interplay in Health and Inflammatory Bowel Disease. Trends Microbiol. 2025, 33, 948–960. [Google Scholar] [CrossRef] [Scilit]
  114. Fei, N.; Zhao, L. An Opportunistic Pathogen Isolated from the Gut of an Obese Human Causes Obesity in Germfree Mice. ISME J. 2013, 7, 880–884. [Google Scholar] [CrossRef] [Scilit] [PubMed]
  115. Tsukamoto, H.; Takeuchi, S.; Kubota, K.; Kobayashi, Y.; Kozakai, S.; Ukai, I.; Shichiku, A.; Okubo, M.; Numasaki, M.; Kanemitsu, Y.; et al. Lipopolysaccharide (LPS)-Binding Protein Stimulates CD14-Dependent Toll-like Receptor 4 Internalization and LPS-Induced TBK1–IKKϵ–IRF3 Axis Activation. J. Biol. Chem. 2018, 293, 10186–10201. [Google Scholar] [CrossRef] [Scilit] [PubMed]
  116. Shi, Y.-J.; Huang, C.; Gong, P.-Q.; Liu, C.; Hu, Z.-Q.; Wang, H. The Protective Role of TLR4 in Intestinal Epithelial Cells through the Regulation of the Gut Microbiota in DSS-Induced Colitis in Mice. Front. Biosci. 2023, 28, 175. [Google Scholar] [CrossRef] [Scilit] [PubMed]
  117. Tang, S.; Zhong, R.; Yin, C.; Su, D.; Xie, J.; Chen, L.; Liu, L.; Zhang, H. Exposure to High Aerial Ammonia Causes Hindgut Dysbiotic Microbiota and Alterations of Microbiota-Derived Metabolites in Growing Pigs. Front. Nutr. 2021, 8, 689818. [Google Scholar] [CrossRef] [Scilit]
  118. Den Besten, G.; Van Eunen, K.; Groen, A.K.; Venema, K.; Reijngoud, D.-J.; Bakker, B.M. The Role of Short-Chain Fatty Acids in the Interplay between Diet, Gut Microbiota, and Host Energy Metabolism. J. Lipid Res. 2013, 54, 2325–2340. [Google Scholar] [CrossRef] [Scilit]
  119. Larsen, J.M. The Immune Response to Prevotella Bacteria in Chronic Inflammatory Disease. Immunology 2017, 151, 363–374. [Google Scholar] [CrossRef] [Scilit]
  120. Szudzik, M.; Hutsch, T.; Chabowski, D.; Zajdel, M.; Ufnal, M. Normal Caloric Intake with High-Fat Diet Induces Metabolic Dysfunction-Associated Steatotic Liver Disease and Dyslipidemia without Obesity in Rats. Sci. Rep. 2024, 14, 22796. [Google Scholar] [CrossRef] [Scilit]
  121. Almeida, A.; Mitchell, A.L.; Boland, M.; Forster, S.C.; Gloor, G.B.; Tarkowska, A.; Lawley, T.D.; Finn, R.D. A New Genomic Blueprint of the Human Gut Microbiota. Nature 2019, 568, 499–504. [Google Scholar] [CrossRef] [Scilit]
  122. Turnbaugh, P.J.; Hamady, M.; Yatsunenko, T.; Cantarel, B.L.; Duncan, A.; Ley, R.E.; Sogin, M.L.; Jones, W.J.; Roe, B.A.; Affourtit, J.P.; et al. A Core Gut Microbiome in Obese and Lean Twins. Nature 2009, 457, 480–484. [Google Scholar] [CrossRef] [Scilit]
  123. Org, E.; Mehrabian, M.; Parks, B.W.; Shipkova, P.; Liu, X.; Drake, T.A.; Lusis, A.J. Sex Differences and Hormonal Effects on Gut Microbiota Composition in Mice. Gut Microbes 2016, 7, 313–322. [Google Scholar] [CrossRef] [Scilit] [PubMed]
  124. Zhao, S.; Lieberman, T.D.; Poyet, M.; Kauffman, K.M.; Gibbons, S.M.; Groussin, M.; Xavier, R.J.; Alm, E.J. Adaptive Evolution within Gut Microbiomes of Healthy People. Cell Host Microbe 2019, 25, 656–667.e8. [Google Scholar] [CrossRef] [Scilit]
  125. Zaneveld, J.R.; McMinds, R.; Vega Thurber, R. Stress and Stability: Applying the Anna Karenina Principle to Animal Microbiomes. Nat. Microbiol. 2017, 2, 17121. [Google Scholar] [CrossRef] [Scilit] [PubMed]
  126. Martinez-Lomeli, J.; Deol, P.; Deans, J.R.; Jiang, T.; Ruegger, P.; Borneman, J.; Sladek, F.M. Impact of Various High Fat Diets on Gene Expression and the Microbiome Across the Mouse Intestines. Preprint 2023. [Google Scholar] [CrossRef] [Scilit]
  127. Tettelin, H.; Masignani, V.; Cieslewicz, M.J.; Donati, C.; Medini, D.; Ward, N.L.; Angiuoli, S.V.; Crabtree, J.; Jones, A.L.; Durkin, A.S.; et al. Genome Analysis of Multiple Pathogenic Isolates of Streptococcus agalactiae: Implications for the Microbial “Pan-Genome”. Proc. Natl. Acad. Sci. USA 2005, 102, 13950–13955. [Google Scholar] [CrossRef] [Scilit]
  128. Carlos Guimaraes, L.; Benevides De Jesus, L.; Vinicius Canario Viana, M.; Silva, A.; Thiago Juca Ramos, R.; De Castro Soares, S.; Azevedo, V. Inside the Pan-Genome-Methods and Software Overview. Curr. Genom. 2015, 16, 245–252. [Google Scholar] [CrossRef] [Scilit]
  129. Vanni, C.; Schechter, M.S.; Acinas, S.G.; Barberán, A.; Buttigieg, P.L.; Casamayor, E.O.; Delmont, T.O.; Duarte, C.M.; Eren, A.M.; Finn, R.D.; et al. Unifying the Known and Unknown Microbial Coding Sequence Space. eLife 2022, 11, e67667. [Google Scholar] [CrossRef] [Scilit]
  130. Paone, P.; Cani, P.D. Mucus Barrier, Mucins and Gut Microbiota: The Expected Slimy Partners? Gut 2020, 69, 2232. [Google Scholar] [CrossRef] [Scilit]
  131. Yamaguchi, M.; Yamamoto, K. Mucin Glycans and Their Degradation by Gut Microbiota. Glycoconj. J. 2023, 40, 493–512. [Google Scholar] [CrossRef] [Scilit]
  132. Koh, A.; De Vadder, F.; Kovatcheva-Datchary, P.; Bäckhed, F. From Dietary Fiber to Host Physiology: Short-Chain Fatty Acids as Key Bacterial Metabolites. Cell 2016, 165, 1332–1345. [Google Scholar] [CrossRef] [Scilit]
  133. Lynch, S.V.; Pedersen, O. The Human Intestinal Microbiome in Health and Disease. N. Engl. J. Med. 2016, 375, 2369–2379. [Google Scholar] [CrossRef] [Scilit]
  134. Richardson, D.J.; Sawers, G.; Van Spanning, R.J.M. Periplasmic Electron-Transport Systems in Bacteria. In Encyclopedia of Biological Chemistry; Elsevier: Amsterdam, The Netherlands, 2013; pp. 400–406. ISBN 978-0-12-378631-9. [Google Scholar]
  135. Donnenberg, M.S. Enterobacteriaceae. In Mandell, Douglas, and Bennett’s Principles and Practice of Infectious Diseases; Elsevier: Amsterdam, The Netherlands, 2015; pp. 2503–2517.e5. ISBN 978-1-4557-4801-3. [Google Scholar]
  136. Du, T.-T.; Liu, X.-C.; He, Y.; Gao, X.; Liu, Z.-Z.; Wang, Z.-L.; Li, L.-Q. Changes of Gut Microbiota and Tricarboxylic Acid Metabolites May Be Helpful in Early Diagnosis of Necrotizing Enterocolitis: A Pilot Study. Front. Microbiol. 2023, 14, 1119981. [Google Scholar] [CrossRef] [Scilit] [PubMed]
  137. Wan, Y.; Yuan, J.; Li, J.; Li, H.; Yin, K.; Wang, F.; Li, D. Overweight and Underweight Status Are Linked to Specific Gut Microbiota and Intestinal Tricarboxylic Acid Cycle Intermediates. Clin. Nutr. 2020, 39, 3189–3198. [Google Scholar] [CrossRef] [Scilit] [PubMed]
  138. Bernut, A.; Dupont, C.; Ogryzko, N.V.; Neyret, A.; Herrmann, J.-L.; Floto, R.A.; Renshaw, S.A.; Kremer, L. CFTR Protects against Mycobacterium Abscessus Infection by Fine-Tuning Host Oxidative Defenses. Cell Rep. 2019, 26, 1828–1840.e4. [Google Scholar] [CrossRef] [Scilit] [PubMed]
  139. Yilmaz, B.; Li, H. Gut Microbiota and Iron: The Crucial Actors in Health and Disease. Pharmaceuticals 2018, 11, 98. [Google Scholar] [CrossRef] [Scilit] [PubMed]
  140. Ijssennagger, N.; Belzer, C.; Hooiveld, G.J.; Dekker, J.; Van Mil, S.W.C.; Müller, M.; Kleerebezem, M.; Van Der Meer, R. Gut Microbiota Facilitates Dietary Heme-Induced Epithelial Hyperproliferation by Opening the Mucus Barrier in Colon. Proc. Natl. Acad. Sci. USA 2015, 112, 10038–10043. [Google Scholar] [CrossRef] [Scilit]
  141. Constante, M.; Fragoso, G.; Calvé, A.; Samba-Mondonga, M.; Santos, M.M. Dietary Heme Induces Gut Dysbiosis, Aggravates Colitis, and Potentiates the Development of Adenomas in Mice. Front. Microbiol. 2017, 8, 1809. [Google Scholar] [CrossRef] [Scilit]
  142. Little, A.S.; Younker, I.T.; Schechter, M.S.; Bernardino, P.N.; Méheust, R.; Stemczynski, J.; Scorza, K.; Mullowney, M.W.; Sharan, D.; Waligurski, E.; et al. Dietary- and Host-Derived Metabolites Are Used by Diverse Gut Bacteria for Anaerobic Respiration. Nat. Microbiol. 2024, 9, 55–69. [Google Scholar] [CrossRef] [Scilit]
  143. Mardinoglu, A.; Shoaie, S.; Bergentall, M.; Ghaffari, P.; Zhang, C.; Larsson, E.; Bäckhed, F.; Nielsen, J. The Gut Microbiota Modulates Host Amino Acid and Glutathione Metabolism in Mice. Mol. Syst. Biol. 2015, 11, 834. [Google Scholar] [CrossRef] [Scilit]
  144. Brown, C.T.; Olm, M.R.; Thomas, B.C.; Banfield, J.F. Measurement of Bacterial Replication Rates in Microbial Communities. Nat. Biotechnol. 2016, 34, 1256–1263. [Google Scholar] [CrossRef] [Scilit]
  145. Ma, Z.; Zuo, T.; Frey, N.; Rangrez, A.Y. A Systematic Framework for Understanding the Microbiome in Human Health and Disease: From Basic Principles to Clinical Translation. Signal Transduct. Target. Ther. 2024, 9, 237. [Google Scholar] [CrossRef] [Scilit] [PubMed]
  146. Cani, P.D.; Moens De Hase, E.; Van Hul, M. Gut Microbiota and Host Metabolism: From Proof of Concept to Therapeutic Intervention. Microorganisms 2021, 9, 1302. [Google Scholar] [CrossRef] [Scilit] [PubMed]
  147. Ueland, P.M.; McCann, A.; Midttun, Ø.; Ulvik, A. Inflammation, Vitamin B6 and Related Pathways. Mol. Asp. Med. 2017, 53, 10–27. [Google Scholar] [CrossRef] [Scilit]
  148. Natividad, J.M.; Lamas, B.; Pham, H.P.; Michel, M.-L.; Rainteau, D.; Bridonneau, C.; Da Costa, G.; Van Hylckama Vlieg, J.; Sovran, B.; Chamignon, C.; et al. Bilophila Wadsworthia Aggravates High Fat Diet Induced Metabolic Dysfunctions in Mice. Nat. Commun. 2018, 9, 2802. [Google Scholar] [CrossRef] [Scilit]
  149. Rohr, M.W.; Narasimhulu, C.A.; Rudeski-Rohr, T.A.; Parthasarathy, S. Negative Effects of a High-Fat Diet on Intestinal Permeability: A Review. Adv. Nutr. 2020, 11, 77–91. [Google Scholar] [CrossRef] [Scilit] [PubMed]
  150. Manghi, P.; Blanco-Míguez, A.; Manara, S.; NabiNejad, A.; Cumbo, F.; Beghini, F.; Armanini, F.; Golzato, D.; Huang, K.D.; Thomas, A.M.; et al. MetaPhlAn 4 Profiling of Unknown Species-Level Genome Bins Improves the Characterization of Diet-Associated Microbiome Changes in Mice. Cell Rep. 2023, 42, 112464. [Google Scholar] [CrossRef] [Scilit]
  151. Durazzi, F.; Sala, C.; Castellani, G.; Manfreda, G.; Remondini, D.; De Cesare, A. Comparison between 16S rRNA and Shotgun Sequencing Data for the Taxonomic Characterization of the Gut Microbiota. Sci. Rep. 2021, 11, 3030. [Google Scholar] [CrossRef] [Scilit]
  152. Velloso, L.A.; Folli, F.; Saad, M.J. TLR4 at the Crossroads of Nutrients, Gut Microbiota, and Metabolic Inflammation. Endocr. Rev. 2015, 36, 245–271. [Google Scholar] [CrossRef] [Scilit]
Figure 1. Trends in weekly total mass within each dietary group using LOESS. Colors green, red, yellow, and blue represent CCN, CC, HFCN, and HFC diets, respectively. (A) females and (B) males. The dashed line indicates the location of the fecal sampling point.
Dietetics 05 00013 g001
Figure 2. Kaplan–Meier survival assessment over 72 weeks (18 months) and sex-specific comparison of each diet ((A): females; (B): males). The black lines indicate the initiation of fecal sampling at week 64 (16 months). The curves are compared using the log-rank test, with α = 0.05 and df = 3. Green, red, blue, and yellow indicate the CCN, CC, HFCN, and HFC diets, respectively.
Dietetics 05 00013 g002
Figure 3. Relative abundance (%) of bacterial phyla identified in mouse fecal microbiomes across eight experimental groups, stratified by sex and diet. Groups include (CCN-F), (CCN-M), (CC-F), (CC-M), (HFCN-F), (HFCN-M), (HFC-F), and (HFC-M). Colors represent different bacterial phyla: Verrucomicrobiota (orange), Bacillota (blue), Bacteroidota (red), Pseudomonadota (purple), and Actinomycetota (yellow).
Dietetics 05 00013 g003
Figure 4. Krona pie charts showing the taxonomic profiles of females in Bacillota metagenomes, expressed as relative abundance (%). Each plot illustrates the relative abundances of bacterial taxa from the phylum, progressing outward from the center. Different groups presented as follows: (A) CCN-F, (B) CC-F, (C) HFCN-F and (D) HFC-F.
Dietetics 05 00013 g004aDietetics 05 00013 g004b
Figure 5. Krona pie charts showing taxonomic profiles of males for Bacillota, based on binned quality metagenomes, expressed as relative abundance (%). Each plot illustrates the relative abundances of bacterial taxa from the phylum, progressing outward from the center. Different groups presented as follows: (A) CCN-M, (B) CC-M, (C) HFCN-M and (D) HFC-M.
Dietetics 05 00013 g005aDietetics 05 00013 g005b
Figure 6. Krona pie charts showing taxonomic profiles of females for Pseudomonata, based on binned quality metagenomes, expressed as relative abundance (%). Each plot illustrates the relative abundances of bacterial taxa from the phylum, progressing outward from the center. Different groups presented as follows: (A) CCN-F, (B) CC-F, (C) HFCN-F and (D) HFC-F.
Dietetics 05 00013 g006aDietetics 05 00013 g006b
Figure 7. Krona pie charts showing taxonomic profiles of males for Pseudomonata, based on binned quality metagenomes, expressed as relative abundance (%). Each plot illustrates the relative abundances of bacterial taxa from the phylum, progressing outward from the center. Different groups presented as follows: (A) CCN-M, (B) CC-M, (C) HFCN-M and (D) HFC-M.
Dietetics 05 00013 g007aDietetics 05 00013 g007b
Figure 8. Krona pie charts showing taxonomic profiles of females for Actinomycetota based on binned quality metagenomes expressed in relative abundance (%). Each plot illustrates the relative abundances of bacterial taxa from the phylum, progressing outward from the center. Different groups presented as follows: (A) CCN-F, (B) CC-F, (C) HFCN-F and (D) HFC-F.
Dietetics 05 00013 g008aDietetics 05 00013 g008b
Figure 9. Krona pie charts showing taxonomic profiles of males for Actinomycetota, based on binned quality metagenomes, expressed as relative abundance (%). Each plot illustrates the relative abundances of bacterial taxa from the phylum, progressing outward from the center. Different groups presented as follows: (A) CCN-M, (B) CC-M, (C) HFCN-M and (D) HFC-M.
Dietetics 05 00013 g009aDietetics 05 00013 g009b
Figure 10. Krona pie charts showing taxonomic profiles of females for Bacteriodota based on binned quality metagenomes expressed in relative abundance (%). Each plot illustrates the relative abundances of bacterial taxa from the phylum, progressing outward from the center. Different groups presented as follows: (A) CCN-F, (B) CC-F, (C) HFCN-F, and (D) HFC-F.
Dietetics 05 00013 g010aDietetics 05 00013 g010b
Figure 11. Krona pie charts showing taxonomic profiles of males for Bacteriodota based on binned quality metagenomes expressed in relative abundance (%). Each plot illustrates the relative abundances of bacterial taxa from the phylum, progressing outward from the center. Different groups presented as follows: (A) CCN-M, (B) CC-M, (C) HFCN-M and (D) HFC-M.
Dietetics 05 00013 g011aDietetics 05 00013 g011b
Figure 12. Comparison of pangenomes for orthologous gene clusters across experimental groups. Venn diagrams illustrate the distribution of orthologous gene clusters among samples from: (A) the control diet (CCN-F, CCN-M, CC-F, and CC-M) and (B) the high-fat diet (HFCN-F, HFCN-M, HFC-F, and HFC-M), both with or without ammonium supplementation (N’ indicates ammonium supplementation). Numbers within each section represent unique or shared gene clusters between groups. Central overlaps indicate the core genome (clusters common to all samples within each panel), while peripheral numbers denote accessory or unique gene clusters specific to individual samples.
Dietetics 05 00013 g012
Figure 13. Comparison of pangenomes for orthologous gene clusters across diet groups. Venn diagrams illustrate the distribution of orthologous gene clusters among samples from: (A) the control diet (CCN-F, CCN-M, CC-F, and CC-M) and (B) the high-fat diet (HFCN-F, HFCN-M, HFC-F, and HFC-M), both with or without ammonium supplementation (N’ indicates ammonium supplementation). Numbers within each section represent unique or shared gene clusters between groups. Central overlaps indicate the core genome (clusters common to all samples within each panel), while peripheral numbers denote accessory or unique gene clusters specific to individual samples.
Dietetics 05 00013 g013
Figure 14. Family-level gut microbiota composition across dietary treatments. Heatmaps depict the relative abundance of bacterial families (log10 scale) across experimental diet groups, with hierarchical clustering based on Bray–Curtis dissimilarity. Panel (A) shows family-level profiles for mice fed high-fat diets (HFC-F, HFCN-F, HFC-M, HFCN-M), while Panel (B) shows profiles for mice fed control-fat diets (CC-F, CCN-F, CC-M, CCN-M). Rows represent bacterial families, and columns represent individual experimental groups. Colors indicate relative abundance, ranging from low abundance (dark blue/black) to high abundance (yellow/red), as indicated by the color key. The diagrams illustrate clustering of bacterial families with similar abundance patterns across diets.
Dietetics 05 00013 g014
Figure 15. Species-level gut microbiota composition across dietary treatments. Heatmaps show the relative abundance of bacterial species (log10 scale) across experimental diet groups with hierarchical clustering based on Bray–Curtis dissimilarity. Panel (A) depicts species-level profiles from mice fed high-fat diets (HFC-F, HFCN-F, HFC-M, HFCN-M), while Panel (B) shows profiles from mice fed control-fat diets (CC-F, CCN-F, CC-M, CCN-M). Rows represent individual bacterial species, and columns represent experimental groups. Color intensity indicates relative abundance, ranging from low abundance (dark blue/black) to high abundance (yellow/red), as shown in the color key. Dendrograms illustrate clustering of species with similar abundance patterns across diet groups, highlighting diet-associated restructuring of the gut microbial community.
Dietetics 05 00013 g015
Table 1. Compositions of the CCN, CC, HFCN, and HFC diets.
IngredientCC/CCN Dietary Components 4HFC/HFCN Dietary Components 5
Unsupplemented Casein (prepared, freeze-dried)/AHE 1 Casein (prepared, freeze-dried)200/200 g200/200 g
L-Cystine3 g3 g
Corn Starch452.2 g72.8 g
Maltodextrin 1075 g100 g
Sucrose175.21 g175.21 g
Cellulose50 g50 g
Soybean Oil25 g25 g
Beef Fat, Bunge20 g177.5 g
Mineral Mix S10026A (No Ca, P, K, Na, Cl 2) 5 g5 g
Dicalcium Phosphate13 g13 g
Calcium Carbonate5.5 g5.5 g
Potassium Citrate, 1 H2O 316.5 g16.5 g
Sodium Chloride2.546 g2.546 g
Vitamin Mix V1000110 g10 g
Choline Bitartrate 2 g2 g
Cholesterol 0.6 g0.49 g
TOTAL MASS1055.606 g858.596 g
Protein18% of Kcal18% of Kcal
Carbohydrates71% of Kcal36% of Kcal
Fats11% of Kcal46% of Kcal
TOTAL Kcal%100% of Kcal100% of Kcal
1 Ammonium hydroxide enhancement; 2 does not contain calcium, phosphorus, potassium, sodium, or chloride; 3 water; 4 control casein/ammoniated casein diet; and 5 high-fat casein/ammoniated high-fat casein diet.
Table 2. Average total mass and food consumed for each diet and sex at 1 week prior (week 63) to the time of fecal sampling. SE is the standard error within the group.
DietFemalesMales
Average
Total Mass (g)
Average Food
Consumed (g)
Average
Total Mass (g)
Average Food
Consumed (g)
MeanSE 1MeanSE 1MeanSE 1MeanSE 1
CCN 226.9±0.87717.9±0.4332.6±0.93419.5±0.44
CC 323.7±0.43318.0±0.4032.1±0.87920.4±0.40
HFCN 437.6±2.0817.5±0.3041.6±1.3824.5±0.42
HFC 533.3±2.5416.6±0.3637.5±1.4521.1±0.36
1 Standard error of the mean; 2 ammoniated casein diet; 3 control casein diet; 4 ammoniated high-fat casein diet; 5 high-fat casein diet. Mass and food consumed were measured in grams.
Table 3. Shotgun metagenomic sequencing, assembly, and annotation results for fecal microbiomes of male (M) and female (F) mice for control (CC) and high-fat diets (HFC) without and with ammonium (N) supplementation.
Diet GroupsRaw Reads
(Millions)
#ContigsMaximum Contig LengthTotal Contig Length (Mbp)Assembly N50Number of Genes
Annotated
CCN-F34.21113,578913,209152.654899165,463
CCN-M35422,369516,201311.392071276,246
CC-F33.35297,831857,234282.952516312,249
CC-M33.09286,809439,148297.353208293,869
HFCN-F34.05263,657640,732270.632820273,135
HFCN-M32.24279,753607,208304.073574286,716
HFC-F32.57293,375916,537323.522819334,689
HFC-M33.57221,758913,208293.085742279,559
Table 4. Gene ontology (GO) terms enriched significantly (p < 0.05) in the fecal microbiome metagenomes of ammoniated control (CCN) compared to unsupplemented control (CC) and high-fat control (HFC) compared to high-fat ammoniated (HFCN).
Ammoniated Control (CCN)p-ValueUnsupplemented Control (CC)p-Value
GO Biological Process:
Tricarboxylic acid cycle0.021Respiratory electron transport chain0.013
Defense response to the bacterium0.038Glutathione metabolic process0.022
Regulation of cell shape0.036
DNA replication0.046
GO Cellular Component:
Outer membrane-bounded periplasmic space0.046Integral component of plasma membrane0.017
GO Molecular Function:
Iron ion binding0.0061
High-Fat Ammoniated Diet (HFCN)p-ValueHigh-Fat Control Diet (HFC)p-Value
GO Biological Process:
Protein transport0.023
GO Cellular Component:
Outer membrane-bounded periplasmic space0.029
GO Molecular Function:
Glycosyltransferase activity0.033Heme binding0.025
Nucleotidyltransferase activity0.045
Table 5. Gene ontology (GO) terms enriched significantly (p < 0.05) in mice fecal microbiome metagenomes of control females (CCN-F and CC-F) compared to high-fat females (HFCN-F and HFC-F) and control males (CCN-M and CC-M) compared to high-fat males (HFCN-M and HFC-M).
Control Females (CCN-F and CC-F)p-ValueHigh-Fat Females (HFCN-F and HFC-F)p-Value
GO Biological Process:
DNA replication0.046
GO Molecular Function:
Flavin adenine dinucleotide binding0.0194 iron, 4 sulfur cluster binding0.028
Identical protein binding0.034
Control Males (CCN-F and CC-F)p-ValueHigh-Fat Males (HFCN-F and HFC-F)p-Value
GO Biological Process:
Respiratory electron transport chain0.038
GO Cellular Component:
Plasma membrane0.024
GO Molecular Function:
NADH dehydrogenase (ubiquinone) activity0.037Pyridoxal phosphate binding0.015
Lyase activity0.037
Disclaimer/Publisher’s Note: The statements, opinions and data contained in all publications are solely those of the individual author(s) and contributor(s) and not of MDPI and/or the editor(s). MDPI and/or the editor(s) disclaim responsibility for any injury to people or property resulting from any ideas, methods, instructions or products referred to in the content.