Article

Assessment of the Nutritional Composition and Environmental Impact of Menus Served in a University Cafeteria During an Academic Year

Nutrition and Food Science, Department of Preventive Medicine and Public Health, Food Sciences, Toxicology and Legal Medicine, Faculty of Pharmacy and Food Science, University of València, Avda Vicent Andrés Estellés, s/n, Burjassot, 46100 Valencia, Spain
*
Author to whom correspondence should be addressed.
Dietetics 2025, 4(1), 2; https://doi.org/10.3390/dietetics4010002
Submission received: 2 October 2024 / Revised: 28 November 2024 / Accepted: 2 January 2025 / Published: 13 January 2025

Abstract

:
Diets will likely play a crucial role in the Anthropocene to support the population’s health and safeguard environmental sustainability for future generations. Based on a cross-sectional–observational–descriptive design for evaluating an entire menu proposal, data on the type and composition of the menus offered by a university catering service during an academic year were collected. Each day during the meal service, 10 plates of the same option offered were weighed, and 10 photographs were taken. With these data, the nutritional value and carbon footprint were evaluated for all possible combinations of first and second courses, while including the average values of other components of the menu (garnishes, bread, desserts, and beverages). The annual menu proposal resulted in 6478 combinations of first and second courses plus the other components. The average caloric intake was 1194 kcal/menu with high consumption of proteins and lipids, and the average carbon footprint was 1.86 kg carbon dioxide equivalent (CO2eq)/menu, with the second course being the major contributor. Creating menus that consider these two essential parameters is the task of specialists. Achieving food consumption that balances nutrition and environmental sustainability is another issue of education and communication.

1. Introduction

Diets will likely play a crucial role in the Anthropocene to support the population’s health and safeguard environmental sustainability for future generations. Current diets are associated with a high burden of disease. Globally, ~1900 million adults are overweight or obese, and 462 million are underweight. Food systems must be able to respond to this, however, currently, this is not the case [1]. Food’s environmental sustainability and nutritional quality have traditionally been treated separately [2]. Recently, however, combined nutritional and environmental assessments of dietary patterns have been conducted [3].
If nutritional and environmental assessments are carried out in combination, the results can be compared with a healthy and environmentally friendly food reference. Methods for estimating the nutritional quality of foods are often based on dietary recommendations, such as those of Crokett et al. [4]. However, for the environmental impact of food, there are no reference recommendations [5,6] apart from the evaluation of the percentage representing the consumption of food in comparison with the total daily environmental footprint generated by all human activities [7]. Food consumption makes up 30% of an EU (European Union) citizen’s total resource consumption [8]. In addition, food accounts for 20% of greenhouse gas (GHG) emissions globally [9]. Achieving the goal of sustainable food requires the efficient use of resources by all links in the food chain [10,11].
Unsurprisingly, since they are a factor affecting the environment, diets based on plant products emit fewer GHGs than diets based on animal products [5] while providing greater health benefits, as they are a great source of fiber, vitamins, and minerals, in addition to being low in calories and fats [10], making them an interesting option. Guaranteeing food security for the population in the future will depend largely on the promotion of healthier diets that also consume few resources, which are sustainable [12].
Customs related to food undergo changes, and an increasing amount of meals are consumed outside the home in restaurants or canteens. Food consumption away from home is frequently associated with an increased risk of overweight or obesity [13].
The present study focused on meals consumed outside of the home—specifically, in a university cafeteria, where most users are young adults [14]. The main objective was to evaluate the nutritional contributions of the menus that were served, as well as their carbon footprint. Studying at a university involves greater independence and the development of one’s own identity, which also include one’s eating patterns. Thus, the choice of food and dishes that a university cafeteria offers can lead to a poor dietary pattern [15] and a high environmental impact depending on the type of food included and its intake [16].

2. Materials and Methods

Based on a cross-sectional–observational–descriptive design for evaluating an entire menu proposal, data on the type and composition of the menus offered in a university catering service in the academic year of 2019–2020 were collected. This service offered a daily lunch menu consisting of a first course, a second course, dessert, bread, and a beverage. Each user was able to compose their meal by choosing between four first courses and three second courses. Regarding the main ingredients, salads, vegetables, rice, pasta, potatoes, and legumes were served as the first course, and meat, fish and seafood, eggs, precooked components (rolls, croquettes, dumplings, and crab sticks), and others (cakes, crepes, skewers, and paninis) were offered as the second course. Vegetables, vegetables, and chips, or chips only were offered as side dishes, depending on the diner’s choice. The dessert could be in-season fresh fruit or a dairy product (yogurt, cake, or pudding); the bread was either white or wholemeal; the drink was a soft drink, a beer with or without alcohol, a glass of wine, or a small bottle of water. For the dressing, sachets of olive oil (10 g), vinegar (10 mL), and salt (1 g) were offered for individual use.
Each day, during the meal service, 10 weights were performed, and 10 photographs were taken of each option that was proposed in the first and second courses. Ten units of the garnishes, bread, and desserts were weighed daily, as the weight did not vary substantially, and the average value obtained for each of them was used for nutritional assessment. The weights were performed using a precision scale of 5000 ± 1 g (Beurer Living KS19 Kitchen Scale (Ulm, Germany)), which allowed the calculation of the net weight of the food ration, and the photographs were taken with a tablet (Samsung Galaxy Tab A 10.1 Wi-Fi SM-T580 32G tablet (2016) (Samsung, Suwon-si, Republic of Korea)), which allowed subjective verification that the ingredients of the dish and their proportions were those stipulated in the recipe.
Participants were informed about the objectives of the study, and they signed a consent form to participate. The study was accepted by the Universitat de Valencia (UV) ethics committee (registration number 1237700).
Once the data of the weights and photographs were collected, a database was structured with a list of first courses, second courses, their respective garnishes, bread, desserts, beverages, and dressings for the menu offered during the academic year of 2019–2020. All the components of the menu underwent separate nutritional evaluations, and then all of the possible combinations of first and second courses were formed. Next, the average values of the rest of the constituents of the menu (dessert, bread, beverage, and dressings) were added, and a mix of vegetables and chips as a garnish in the second course was included. The recipe technical sheets were provided by the kitchen service and were used to evaluate the nutrient composition. The DIAL program version 3.10.8 was used for caloric assessment [17]. To calculate the percentages of the nutritional requirements that were covered, the data on micronutrients and macronutrients from the Spanish Agency for Food Safety and Nutrition (AESAN), according to the European Food Safety Authority, (EFSA) [18,19] were taken as the reference intake for the Spanish population. The requirements covered were classified by quartile: quartile 1 (Q1) ranged from 0 to 25%, quartile 2 (Q2) ranged from 26 to 50%, quartile 3 (Q3) ranged from 51 to 75%, and quartile 4 (Q4) ranged from 76 to 100% for both men and women.
For the calculation of the carbon footprint (CFP), the GHG data—expressed as kg CO2eq/kg of food—as reported by González-Garcia [20] were used. If necessary, these data were completed with those provided by Clune [21] for to the ingredients that constitute each menu item. For foods that were not found in these articles, the most recently published data on their GHG emissions geographically closest to Spain were used. If no published data were found, the GHG data of the most similar food in terms of species, type, cultivation, processing, or industrial processing were used. When applicable, the data for conventional cultivation were chosen over those for organic farming.
Finally, to observe the environmental impact of the nutritional assessment, the average GHG emissions were calculated for the different components of the menu.

3. Results

3.1. Nutritional Assessment

In the study period, data were collected from 79 first courses and 82 second courses, which gave rise to a total of 6478 possible combinations that made up the annual menu offering of the university catering service and covered possible seasonal variations in the dishes and ingredients, as well as the types of culinary preparations. The relative supply of the first and second courses—grouped by main ingredient, except convenience food that is considered a different group—concerning the total offered was established as a percentage, as shown in Figure 1.

3.1.1. Energy Supply

In the sample that was studied, the average serving size of the menu is 609 ± 69 g. The caloric intake range of the complete menu was between 1599 kcal as the most caloric and 769 kcal as the least caloric, with an average value of 1194 kcal. For men, this would cover between 42% and 26%, and for women, it would cover between 55% and 32% of the daily requirements. Thus, the average caloric intake of all combinations of first and second courses was 668 ± 191 kcal. This would cover 22.3 ± 6.4% of the recommended daily calorie intake for men and 27.8 ± 7.9% for women (Table 1). These percentages may vary according to the combinations chosen by the user depending on the ingredients and the type of preparation of the dishes consumed, which was determined by their choice.
Of all of the possible combinations of first and second courses, 2.8% (n = 187) and 20% (n = 1295) were in the appropriate caloric intake range for the midday meal (35–40%), 97% (n = 6276) and 67% (n = 4435) were below, and 0.2% (n = 15) and 13% (n = 748) were above the appropriate caloric intake range for the midday meal, which is 3000 kcal for men and 2400 kcal for women according to the EFSA [19].
We added the average caloric contributions of the rest of the components of the menu to the caloric intake from the main components of the menu (the first and second courses) (Table 1).

3.1.2. Macronutrients and Fiber

The National Academy of Sciences (NAS) of the United States defined the recommended daily allowance (RDA) for carbohydrates (CH) as 130 g/day, considering that this is sufficient to cover the requirements of the brain in more than 98% of individuals in the healthy population. In the present study, the caloric percentage covered by CH according to the evaluation of all the possible combinations of the first and second courses was 24 ± 16% (39.0 ± 26.1 g), which would cover approximately 30% of the recommended daily value [22].
Fiber also has a caloric value (1–2.5 kcal/g), and according to the EFSA, its intake should be 25 g/day [19]. According to the result obtained from the studied combination of all the constituents of the menu, the percentage of the recommended fiber consumption that was covered was 30 ± 16% (7.4 ± 3.9 g).

3.1.3. Protein Requirements

In this study, the caloric percentage contributed by proteins according to the evaluation of all the possible combinations of the first and second courses, was 23 ± 12% (37.7 ± 12.9 g). Most of the organizations that make recommendations for the general population suggest a protein intake target of less than 15% of the total caloric intake [18,19]. However, the NAS extends this range to 35%, as there is not enough evidence that intakes up to this value lead to health problems, as long as energy needs are met through a balanced protein intake from a range of dietary sources [22].

3.1.4. Fat Requirements

The nutritional recommendations proposed by the Spanish Society of Community Nutrition indicate a dietary intake in terms of the percentage of total fats of between 30% and 35% of the caloric value of the diet, with <10% saturated fatty acids (SFAs), 5% polyunsaturated fatty acids (PUFAs), and 20% monounsaturated fatty acids (MUFAs), as well as <300 mg of cholesterol per day [23].
According to the evaluation of all of the results of the possible combinations of the first and second courses, the caloric percentage covered by lipids was 53 ± 22% (38.7 ± 16.2 g), with 29.7 ± 10.0% (11.4 ± 5.5 g), 46.5 ± 21.4% (17.8 ± 8.2 g), and 23.3 ± 20.3% (8.9 ± 5.5 g) for SFAs, MUFAs, and PUFAs, respectively. The average percentage covered the recommended intake for cholesterol, which was 65 ± 48% (196 ± 145 mg).

3.1.5. Micronutrient Requirements

We require both water-soluble and fat-soluble vitamins, as well as minerals and trace elements.
Based on all combinations of first and second courses, the average values of the contributions of water-soluble and fat-soluble vitamins, minerals, and trace elements for the recommended intake [19] are shown in Table 2.

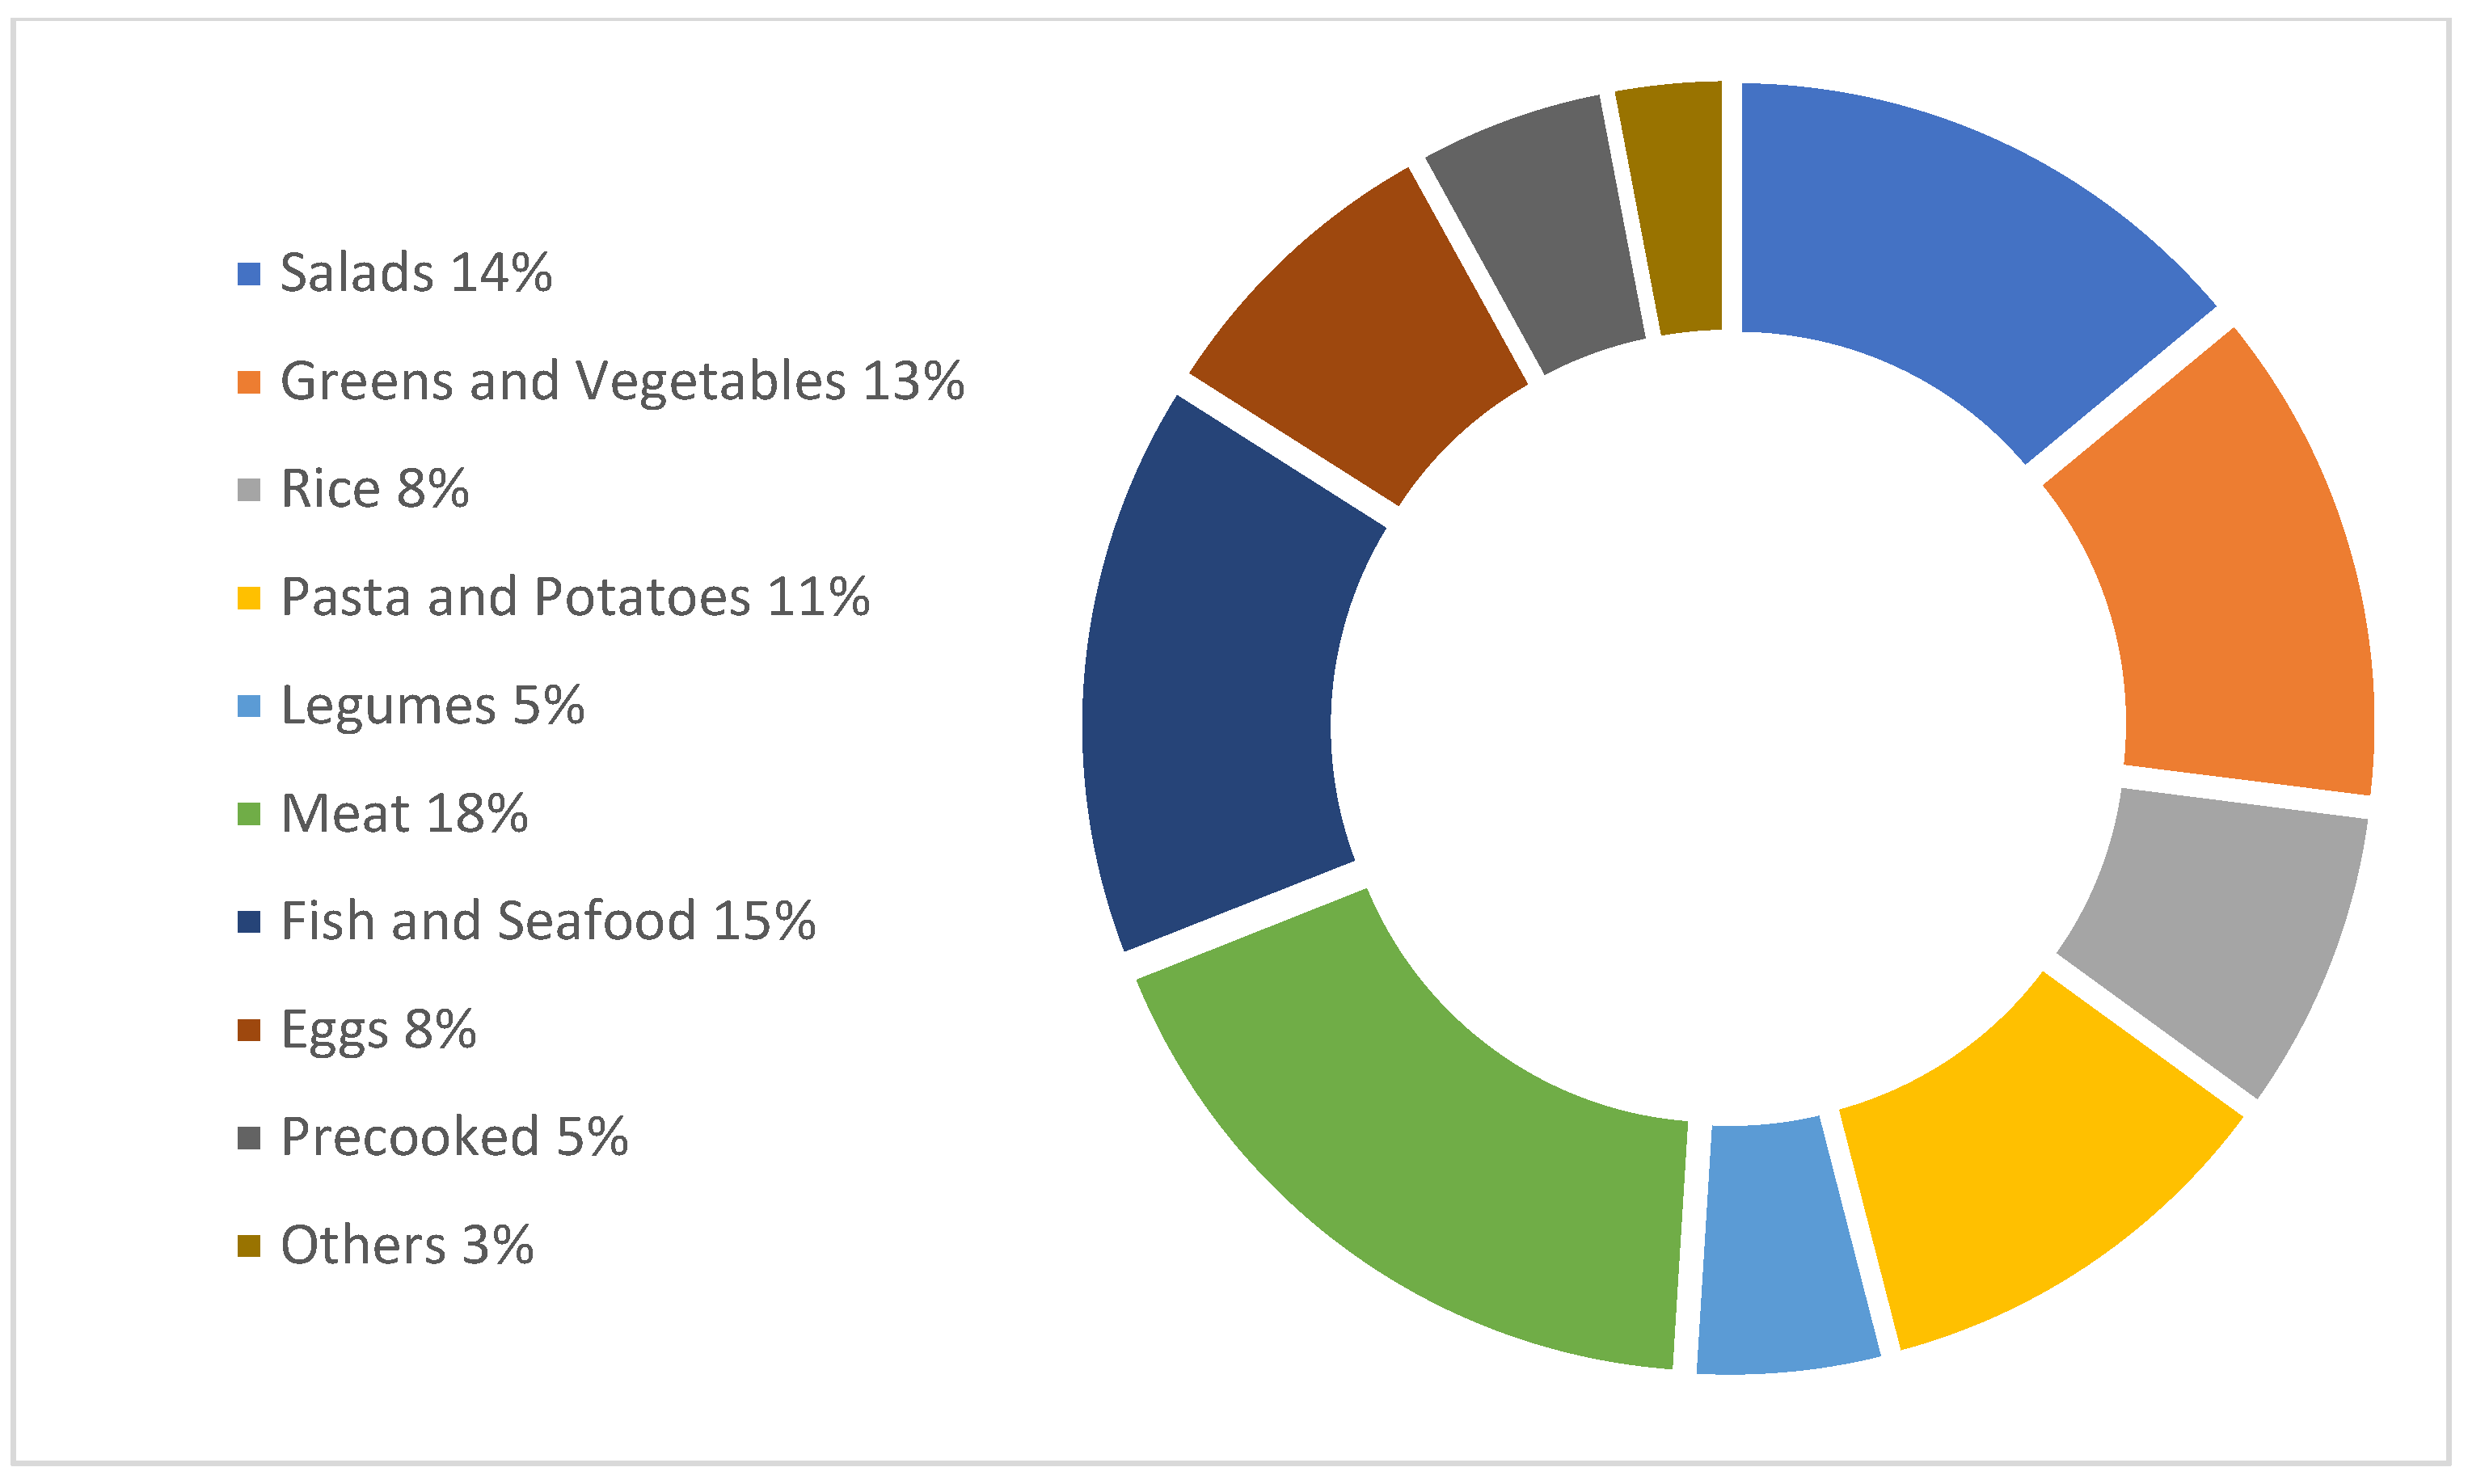
3.1.6. Tables Based on Food Groups

If the first and second courses are grouped according to their principal ingredient, the mean caloric contributions observed in Table 3 and Table 4 represent the evaluation of the energy contribution of each macronutrient in the first and second courses when grouped according to their principal ingredient.

3.2. Environmental Impact Assessment

Dietary intake should now be assessed in terms of not only sufficiency, balance, variation, and adequacy, but also sustainability.
The quantification of the CFP for the first and second courses (kg CO2eq/dish), as well as for the portions of garnish, dessert, and bread (kg CO2eq/serving), is reflected in Table 5.
The CFP of the 6478 combinations of first and second courses was calculated and the overall average was 1.40 ± 1.37 kg CO2eq/combination. From a nutritional point of view, the values obtained per gram of protein or 100 kcal, as well as per dish served, were higher for the second course. The highest values of CFP were obtained for combinations of first courses with products of animal origin among their ingredients with second courses based on only beef or a combination of several products of animal origin.

4. Discussion

The results obtained here provide data and information on the nutritional contribution and CFP of the different dishes and products that are commonly found on the menus of university catering establishments in Spain.
The users of university canteens are mostly young adults who are developing their independence and identity. For most of them, it is the first time that they have to decide on their diet and food choices. Some combinations of dishes can result in reduced daily intake of micronutrients such as vitamin D, calcium, and vitamin B9 for both sexes or Fe for women and Zn for men. In terms of energy intake, there were average differences of more than 100 kcal between the most and least caloric options for the first and second courses, so a combination of both could mean differences of more than 250 kcal in a single intake. The second course options with the highest lipid content were those comprising meat and eggs, which also had the highest caloric value. Meanwhile, the first courses with the highest carbohydrate content, including rice, pasta, and legumes, had the highest caloric value. The secondary ingredients of these first dishes were of great importance. In general, for energy and nutrient intake, the combination of dishes chosen by users of a canteen is crucial, and these contributions can be modified with the choice of the type of garnish, the choice to consume bread, the choice of fruit or a dairy product for dessert, and the type of drink chosen. The food choices made under these different conditions could result in an inadequate dietary pattern [13,14].
For the combinations that were studied, it was found that the intake of CH (24 ± 16%) was 39.0 ± 26.1 g and covered around 30% of the 130 g/day advised amount. The fiber consumption covered 30%, which is considered slightly lower than the proposed recommendation of 35 g by the FAO [24]. These results are similar to those reported by Vargas-Zárate in Colombia [25]. The protein intake in the different combinations of dishes represented an energy contribution of 23 ± 12%, and the value for lipids was 53 ± 22%, but when compared with the recommended percentages for both proteins and fats, according to the nutritional guidelines for the main meal, these figures are somewhat high [26,27], indicating values above what was advised [24].
Studies such as that by Chai et al. [28] claim that plant-based diets have a positive impact on both the environment and health, presenting numerous benefits, such as a reduction in CFP compared with that of diets based on animal products. The results of the present study and the studies of Nelson et al. and González-García et al. [15,20] are in agreement, which indicates that animal products generate a greater environmental impact than products of plant origin. On the other hand, dietary guidelines promote an increase in the consumption of vegetables and the diversity and quality of protein sources in food choices [29].
The highest CFP of the first courses was not due to the main ingredient—pasta or potatoes and vegetables themselves—but due to the secondary components of the dish that were of animal origin, such as minced meat, bacon, prawns, squid, cream, or dairy products. In general, these secondary ingredients do not provide major nutritional benefits and healthier alternatives with less environmental impact should be sought after [30].
The information about the second courses showed that the groups with the highest CFP contained beef as the main ingredient. This result was supported by several reports, such as those of Nelson et al. [15] and Hallström [31], in which it was stated that red meat has a decisive impact on the climate and that just by exchanging the consumption of ruminant meat for pork or chicken, GHG emissions can be reduced by up to 35%.
The fish and seafood group had the second-highest CFP. As Tilman and Clarck reported [32], in this case, the environmental impact is increased since the type of fishing used is trawling. As an example, in the present study, various fish dishes presented higher CFP than dishes with chicken and pork. Thus, in the face of the consumption of mostly meat, alternating fish species with less of an environmental impact with chicken or pork while also including eggs and legumes as an alternative would be beneficial from an environmental and nutritional point of view [33,34].
As this study shows, the GHG emissions per gram of protein or caloric content from dishes based on animal products were much higher than those of dishes of plant origin. According to González-García et al. [5], replacing animal protein with plant products, such as legumes and products derived from them, would have great environmental benefits. Schmidt and Azapagi [35] studied the environmental effects that occurred when replacing meat in certain prepared foods with meat substitutes and determined that, in some cases, there were reductions in the CFP, and in others, there was an increase. Therefore, it is necessary to consider the substitute used and the meat product that is meant to be replaced to evaluate if it would provide an effective change in terms of the environmental impact. Nutritionally, a partial switch from animal products to legumes can allow one to maintain an adequate protein intake while having the nutritional benefits of an increased intake of pulses [36].
Between the two garnishes—chips and vegetables, which could accompany the second course—there were no major differences, as both preparations were of complete vegetable origin, and their preparation was similar. According to the dietary recommendations of the Spanish Society of Community Nutrition [37], one ought to consume at least two servings of vegetables per day. However, it would be preferable to choose cooked or sautéed vegetables rather than fried potatoes. As for the dessert options, fruits, of which a minimum recommended consumption is three pieces per day, have lower emissions than those of yogurt and dairy desserts, making them the more sustainable dessert option while helping to meet recommended intakes; therefore, they should be the usual dessert option. Finally, as the beverage of choice, the preferred is always water, which, while having the lowest CO2 emissions among the different beverages, is the best option for hydration.
Sustainability is an important factor that always ought to be linked to health. Thus, the best combinations are those that bring together factors that generate both healthy and sustainable meals. Many of the principles of a healthy diet, such as a high consumption of fruits, vegetables, and legumes or a reduced consumption of red meat, coincide with those of a sustainable diet, as Ruini et al. stated [38]. These characteristics, among others, are included in the Mediterranean Diet, which has more than favorable scientific evidence, according to Berry [12]. The offering of dishes from the studied menu enables the composition of meals according to the Mediterranean Diet. However, Tilman and Clark [32] commented that a food that is considered for its environmental impact has to be beneficial to health. For example, in the present work, this was reflected in the group of second courses called “others”, which had the lowest CFP but, at the same time, including a large number of processed dishes that would not be the healthiest options for habitual consumption.
On the other hand, the results obtained by combining the different groups of the first and second courses showed that the combinations with a higher CFP and with the greatest impact on the environment were those that had meat as the main ingredient of the second course. The combination that resulted in the largest CFP of all was the one that had a first course from the rice and pasta group and a second course from the meat group. For example, fideuà (Spanish seafood noodle paella) with meatballs, baked rice with beef stew, and seafood paella with a hamburger were some of the combinations that produced many emissions.
Moreover, the combinations that topped the list for lower GHG emissions were those with a first course based on vegetables, except when combined with a second course of meat. Therefore, the combination of vegetables with fish or eggs means a lower CFP and a smaller impact on the environment. In this sense, food education and the recommendation to follow a healthy diet could achieve a reduction in environmental impact and even the nutritional improvement of one’s food intake [39]. To further reduce the CFP of the menu studied, choices of two first courses could be contemplated, as these, in general, have smaller quantities of animal products and, therefore, smaller CFPs. For example, chickpea and spinach stew with zucchini cream or Valencian paella with salad could be sustainable combinations that are also healthy.
Another way to reduce the CFP of a menu is to offer vegetarian and vegan alternatives to the whole menu so that both the first and second courses are nutritionally designed to be combined, have adequate contributions of all nutrients, and, at the same time, have a low production of GHGs, making them a healthy option while being sustainable.
Possible future studies should assess the knowledge of diners concerning the choice of foods that make up their diets and the resulting environmental impact.

5. Conclusions

The results of this research reveal that, while it is true that there are predetermined menu offerings in university catering, the final combinations that make up this menu are the students’ choices. In these choices, determining factors such as nutrition and environmental impact are not always considered, and when it comes to composing an individual menu, one’s eating habits may prevail. We, therefore, recommend studies that compare the environmental impacts of actual diets consumed over a long period by individuals or groups with distinct consumption behaviors. Possible future studies should assess the knowledge of diners concerning the impact of the choice of foods that make up a diet and the environmental impacts that occur. Creating menus that contemplate these two essential parameters is the task of specialists. Achieving food consumption that balances nutrition and the environment is another issue of education and communication. We must strike a balance between nutrition and sustainability in dietary guidelines. It would be desirable if governments were at the forefront of such an initiative, promoting awareness-raising campaigns that provide information on healthy and sustainable dietary choices to the public.

Author Contributions

Conceptualization, J.B., A.F. and M.J.E.; methodology, C.C. and R.A.G.-S.; software, C.G.-U.; validation, R.A.G.-S., C.C. and J.B.; formal analysis, R.A.G.-S., C.G.-U. and C.C.; investigation, R.A.G.-S.; resources, A.F.; data curation, J.B. and C.G.-U.; writing-review and editing, R.A.G.-S. and C.C.; visualization, M.J.E.; supervision, A.F.; Project administration, M.J.E.; funding acquisition, M.J.E. All authors have read and agreed to the published version of the manuscript.

Funding

This research was supported by the Universitat de València (UV-18-INV_AE18).

Institutional Review Board Statement

The study was conducted in accordance with the Declaration of Helsinki, and approved by the Institutional Ethics Committee of Universitat de València (H20190401153513, 4 April 2019).

Informed Consent Statement

Informed consent was obtained from all subjects involved in the study.

Data Availability Statement

Data are available upon request from the authors.

Acknowledgments

We would like to acknowledge the efforts of all of the cafeteria personnel of the Faculty of Pharmacy and Food Science and the volunteers who participated.

Conflicts of Interest

The authors declare no conflicts of interest. The supporters had no role in the design of the study, in the collection, analyses, or interpretation of data, in the writing of the manuscript, or in the decision to publish the results.

References

  1. Willett, W.; Rockström, J.; Loken, B.; Springmann, M.; Lang, T.; Vermeulen, S.; Murray, C.J. Food in the Anthropocene: The EAT-Lancet Commission on healthy diets from sustainable food systems. Lancet 2019, 393, 447–492. [Google Scholar] [CrossRef]
  2. Nemecek, T.; Hayer, F.; Bonnin, E.; Carrouée, B.; Schneider, A.; Vivier, C. Designing eco-efficient crop rotations using life cycle assessment of crop combinations. Eur. J. Agron. 2015, 65, 40–51. [Google Scholar] [CrossRef]
  3. Van Dooren, C.; Marinussen, M.; Blonk, H.; Aiking, H.; Vellinga, P. Exploring dietary guidelines based on ecological and nutritional values: A comparison of six dietary patterns. Food Policy 2014, 44, 36–46. [Google Scholar] [CrossRef]
  4. Crockett, R.A.; King, S.E.; Marteau, T.M.; Prevost, A.T.; Bignardi, G.; Roberts, N.; Jebb, S.A. Nutritional labelling for healthier food or non-alcoholic drink purchasing and consumption. Cochrane Database Syst. Rev. 2018, 2021, CD009315. [Google Scholar]
  5. González-García, S.; Esteve-Llorens, X.; Moreira, M.T.; Feijoo, G. Carbon footprint and nutritional quality of different human dietary choices. Sci. Total Environ. 2018, 644, 77–94. [Google Scholar] [CrossRef] [PubMed]
  6. Sturtewagen, L.; De Soete, W.; Dewulf, J.; Lachat, C.; Lauryssen, S.; Heirman, B.; Schaubroeck, T. Resource use profile and nutritional value assessment of a typical Belgian meal catered or home cooked, with pork or Quorn™ as protein source. J. Clean. 2016, 112, 196–204. [Google Scholar] [CrossRef]
  7. Davis, K.F.; Gephart, J.A.; Emery, K.A.; Leach, A.M.; Galloway, J.N.; D’Odorico, P. Meeting future food demand with current agricultural resources. Glob. Environ. Chang. 2016, 39, 125–132. [Google Scholar] [CrossRef]
  8. Huysman, S.; Schaubroeck, T.; Goralczyk, M.; Schmidt, J.; Dewulf, J. Quantifying the environmental impacts of a European citizen through a macro-economic approach, a focus on climate change and resource consumption. J. Clean. Prod. 2016, 124, 217–225. [Google Scholar] [CrossRef]
  9. Hertwich, E.G.; Peters, G.P. Carbon footprint of nations: A global, trade-linked analysis. Environ. Sci. Technol. 2009, 4, 6414–6420. [Google Scholar] [CrossRef] [PubMed]
  10. Chen, C.; Chaudhary, A.; Mathys, A. Dietary Change Scenarios and Implications for Environmental, Nutrition, Human Health and Economic Dimensions of Food Sustainability. Nutrients 2019, 11, 856. [Google Scholar] [CrossRef] [PubMed]
  11. Knorr, D.; Augustin, M.A. From value chains to food webs: The quest for lasting food systems. Trends Food Sci. Technol. 2021, 110, 812–821. [Google Scholar] [CrossRef]
  12. Berry, E.M. Sustainable Food Systems and the Mediterranean Diet. Nutrients 2019, 11, 2229. [Google Scholar] [CrossRef] [PubMed]
  13. Nago, E.S.; Lachat, C.K.; Dossa, R.A.; Kolsteren, P.W. Association of out-of-home eating with anthropometric changes: A systematic review of prospective studies. Crit. Rev. Food Sci. Nutr. 2014, 54, 1103–1116. [Google Scholar] [CrossRef] [PubMed]
  14. Lachat, C.; Nago, E.; Verstraeten, R.; Roberfroid, D.; Van Camp, J.; Kolsteren, P. Eating out of home and its association with dietary intake: A systematic review of the evidence. Obes. Rev. 2012, 13, 329–346. [Google Scholar] [CrossRef] [PubMed]
  15. Nelson, M.E.; Hamm, M.W.; Hu, F.B.; Abrams, S.A.; Griffin, T.S. Alignment of Healthy Dietary Patterns and Environmental Sustainability: A Systematic Review. Adv. Nutr. 2016, 7, 1005–1025. [Google Scholar] [CrossRef]
  16. Morán, N.; Simón, M. Healthy and Sustainable Food Strategy of the Madrid City Council for the Period 2018–2020. Institutional Coordination: Government Area of Territorial Governance and Public-Social Cooperation, Madrid City Council. Available online: https://diario.madrid.es/madridalimenta/wp-content/uploads/sites/36/2022/10/EASS_22-25_MemoriaEstrategia_EN-1.pdf (accessed on 9 March 2024).
  17. Ortega, R.M.; López-Sobaler, A.M.; Andrés, P.; Requejo, A.M.; Aparicio, A.; Molinero, L.M. DIAL Software for Assessing Diets and Food Calculations, for Windows, Version 3.15; Department of Nutrition and Food Science (UCM) & Alceingeniería, S.A.: Madrid, Spain, 2021; Available online: http://www.alceingenieria.net/nutricion/descarga.htm (accessed on 22 March 2023).
  18. Calleja, C.A.; Hurtado, M.M.C.; Daschner, Á.; Escámez, P.S.F.; Abuín, C.M.F.; Pons, R.M.G.; Oliag, P.T. Informe del Comité Científico de la Agencia Española de Seguridad Alimentaria y Nutrición sobre Ingestas Nutricionales de Referencia para la población española. Rev. Com. Científico Span. Agency Food Saf. Nutr. (AESAN) 2019, 2019, 43–68. [Google Scholar]
  19. European Food Safety Authority (EFSA). Dietary Reference Values for Nutrients Summary Report. EFSA J. 2017, 14, e15121E. [Google Scholar] [CrossRef]
  20. González-García, S.; Green, R.F.; Scheelbeek, P.F.; Harris, F.; Dangour, A.D. Dietary recommendations in Spain—Affordability and environmental sustainability? J. Clean. Prod. 2020, 254, 120125. [Google Scholar] [CrossRef]
  21. Clune, S.; Crossin, E.; Verghese, K. Systematic review of greenhouse gas emissions for different fresh food categories. J. Clean. Prod. 2017, 140, 766–783. [Google Scholar] [CrossRef]
  22. National Academies of Sciences, Engineering and Medicine. Summary Report of the Dietary Reference Intakes. Recommended Dietary Allowance and Adequate Intake Values, Total Water, and Macronutrients. Available online: https://www.nationalacademies.org/our-work/summary-report-of-the-dietary-reference-intakes (accessed on 23 May 2024).
  23. Spanish Society of Community Nutrition. Objetivos Nutricionales Para La Población Española. Consenso de La Sociedad Española de Nutrición Comunitaria 2011. Rev. Esp. Nutr. Comunitaria 2011, 17, 178–199. [Google Scholar]
  24. Leser, S. The 2013 FAO report on dietary protein quality evaluation in human nutrition: Recommendations and implications. Nutr. Bull. 2013, 38, 421–428. [Google Scholar] [CrossRef]
  25. Vargas-Zárate, M.; Becerra-Bulla, F.; Prieto-Suárez, E. Evaluating university students’ dietary intake in Bogotá, Colombia. Rev. Esp. Salud Pública 2010, 12, 116–125. [Google Scholar]
  26. Hoge Gezondheidsraad. Food Recommendations for Belgium. Voedingsaanbevelingen Voor België-2016. Brussel: HGR NR. 9285. Voedingsaanbevelingen Voor België (belgium.be). Available online: https://www.health.belgium.be/en/report-9285-dietary-recommendations-belgium-2016 (accessed on 12 February 2024).
  27. VIGeZ. The Active Food Triangle: Practical Guide to Nutrition and Exercise. In De Actieve Voedingsdriehoek: Praktische Gids over Voeding en Beweging; Praktische_Voedings_en_Beweeggids VIGEZ.pdf (mijnvclb.be); Vlaams Instituut Voor Gezondheidspromotie en Ziektepreventie Vzw (VIGeZ): Brussel, Belgium, 2012; pp. 84–85. Available online: https://www.gezondleven.be/files/voeding/Healthy-Living-2017-Food-Triangle-en-PA-Triangle-how-and-why.pdf (accessed on 12 February 2024).
  28. Chai, B.C.; van der Voort, J.R.; Grofelnik, K.; Eliasdottir, H.G.; Klöss, I.; Pérez-Cuet, F.J.A. Wich Diet Has the Last Environmental Impact in Our Planet? A Systematic Review of Vegan, Vegetarian and Omnivorous Diets. Sustainability 2019, 11, 4110. [Google Scholar] [CrossRef]
  29. U.S. Department of Agriculture; U.S. Department of Health and Human Services. Dietary Guidelines for Americans, 2020–2025, 9th ed.; Department of Agriculture: Washington, DC, USA; U.S. Department of Health and Human Services: Washington, DC, USA, 2020. Available online: https://www.dietaryguidelines.gov/resources/2020-2025-dietary-guidelines-online-materials (accessed on 20 May 2024).
  30. Bryant, C.J. Plant-bases animal product alternatives are healthier and more environmentally sustainable than animal products. Future Foods 2022, 6, 100174. [Google Scholar] [CrossRef]
  31. Hallstrom, E.; Carlsson-Kanyama, A.; Borjesson, P. Environmental impact of dietary change: A systematic review. J. Clean. Prod. 2015, 91, 1–11. [Google Scholar] [CrossRef]
  32. Tilman, D.; Clark, M. Global diets link environmental sustainability and human health. Nature 2014, 515, 518–522. [Google Scholar] [CrossRef]
  33. Smith, N.W.; Fletcher, A.J.; Hill, J.P.; McNabb, W.C. Animal and plant-sourced nutrition: Complementary not competitive. Anim. Prod. Sci. 2022, 62, 701–711. [Google Scholar] [CrossRef]
  34. Scarborough, P.; Appleby, P.N.; Mizdrak, A.; Briggs, A.D.M.; Travis, R.C.; Bradbury, K.E.; Key, T.J. Dietary greenhouse gas emissions of meateaters, fish-eaters, vegetarians, and vegans in the UK. Clim. Chang. 2014, 125, 179–192. [Google Scholar] [CrossRef] [PubMed]
  35. Schmidt, X.C.; Azapagic, A. Life cycle environmental impacts of ready-made meals considering different cuisines and recipes. Sci. Total Environ. 2019, 660, 1168–1181. [Google Scholar] [CrossRef] [PubMed]
  36. Henn, K.; Olsen, S.B.; Goddyn, H.; Bredie, W.L. Willingness to replace animal-based products with pulses among consumers in different European countries. Food Res. Int. 2022, 157, 111403. [Google Scholar] [CrossRef] [PubMed]
  37. Spanish Society of Community Nutrition. Guías alimentarias para la población española: La nueva pirámide de la alimentación saludable. Grupo Colaborativo de la Sociedad Española de Nutrición Comunitaria (SENC): Javier Aranceta Bartrina (coordinador). Nutr. Hosp. 2016, 33 (Suppl. S8), 1–48. [Google Scholar]
  38. Ruini, L.F.; Ciati, R.; Pratesi, C.A.; Marino, M.; Principato, L.; Vannuzzi, E. Working toward healthy and sustainable diets: The “Double Pyramid Model” developed by the Barilla Center for Food and Nutrition to raise awareness about the environmental and nutritional impact of foods. Front. Nutr. 2015, 2, 9. [Google Scholar] [CrossRef] [PubMed]
  39. Jia, S.S.; Liu, Q.; Allman-Farinelli, M.; Partridge, S.R.; Pratten, A.; Yates, L.; Stevens, M.; McGill, B. The Use of Portion Control Plates to Promote Healthy Eating and Diet-Related Outcomes: A Scoping Review. Nutrients 2022, 14, 892. [Google Scholar] [CrossRef] [PubMed]
Figure 1. Distribution of dishes in terms of the percentage of supply classified by the main ingredient or pre-cooked food. First course: salads, greens and vegetables, rice, pasta, and potatoes or legumes. Second course: meat, fish and seafood, eggs, precooked foods, and others.
Dietetics 04 00002 g001
Table 1. Average energy contributions of all possible combinations of first and second courses, the percentage of the energy intake covered for each sex and for each macronutrient, and the average caloric intake of the menu components.
Average and SD
Energy (kcal) (1° + 2°)668 ± 191
Men % (a) (1° + 2°)22.3 ± 6.4
Women % (b) (1° + 2°)27.8 ± 7.9
% Carbohydrates (1° + 2°)24 ± 16
% Proteins (1° + 2°)23 ± 12
% Lipids (1° + 2°)53 ± 22
First course (kcal)342 ± 149
Second course (kcal)325 ± 121
Garnishes (kcal)105 ± 77
Dressing (kcal)7.40 ± 10.5
Bread (kcal)165 ± 61.5
Beverages (kcal)63.6 ± 49.6
Desserts (kcal)123 ± 76.9
(a) Percentage over the recommendation of 3000 kcal daily. (b) Percentage over the recommendation of 2400 kcal daily. 1°, first course. 2°, second course.
Table 2. Average contributions for water-soluble and fat-soluble vitamins, minerals, and trace elements for all combinations of dishes as a percentage of the recommended daily intake covered for each sex.
Quartile%Water SolubleFat SolubleMineral
Q10–25%-D *Calcium */Fluoride *
Q226–50%B1 M/B2 */B9 */
B5 */B8 *
E *Chlorine */Chromium M/Copper M/Iron W
Iodine */Magnesium */Manganese */Potassium */Zinc M
Q351–75%B1 W/B6 */C *-Chromium W/Iron M/Copper W/Selenium M/Sodium */Zinc W
Q476–100%B3 */B12 *A */K *Phosphorus */Selenium W
Q: Values covered by each quartile. %: Percentage over the recommendation of micronutrients for women (W) and men (M) [22]. * The asterisk means the value is in the same quartile for both sexes.
Table 3. Mean caloric intake and standard deviation of the dishes when grouped by main ingredient and percentage covered according to the recommendation for the daily caloric intake for each sex.
Food GroupEnergy (kcal)% M Energy% W Energy
Salads267 ± 1008.9 ± 3.412 ± 4.4
Greens and vegetables233 ± 1217.8 ± 4.110 ± 5.3
Rice396 ± 66.213 ± 2.217 ± 2.9
Pasta353 ± 42.312 ± 1.415 ± 1.8
Legumes324 ± 12011 ± 4.014 ± 5.2
Meat361 ± 12112 ± 4.016 ± 5.3
Fish and seafood249 ± 86.68.3 ± 2.911 ± 3.8
Eggs360 ± 15212 ± 5.116 ± 6.6
Precooked324 ± 10411 ± 3.514 ± 4.5
Others325 ± 10411 ± 3.514 ± 4.5
%: Percentage over the recommendations of 2400 and 3000 kcal daily for women (W) and men (M), respectively.
Table 4. Energy distribution by the macronutrient for the dishes when grouped by main ingredient.
Food GroupProteins %Carbohydrates %Lipids %
Salads21 ± 1022 ± 1549 ± 18
Greens and vegetables18 ± 9.329 ± 1844 ± 17
Rice24 ± 8.2 *50 ± 7.5 *22 ± 8.0
Pasta19 ± 4.446 ± 17 *30 ± 15
Legumes23 ± 4.135 ± 5.3 *32 ± 8.1
Meat29 ± 9.5 *6.5 ± 6.758 ± 12 *
Fish and seafood37 ± 16 *11 ± 1046 ± 15
Eggs21 ± 3.36.2 ± 2.763 ± 5.2 *
Precooked14 ± 4.723 ± 7.057 ± 8.7 *
Others21 ± 7.732 ± 1340 ± 8.5
The bold font indicates the macronutrient with the highest energy input for each food group. * An asterisk indicates the three food groups with the highest inputs of each macronutrient.
Table 5. Value of the carbon footprint per dish, per 100 kilocalories and gram of protein, for the first and second courses, as well as per serving for the main menu components.
kg CO2eq/Dish-Servingg CO2eq/100 kcalgCO2eq/g Protein
First course 0.46 ± 0.440.164 ± 0.1340.035 ± 0.022
Second course0.94 ± 1.050.331 ± 0.4930.059 ± 0.107
Garnishes0.10 ± 0.02 0.150 ± 0.1490.098 ± 0.070
Bread0.08 ± 0.010.049 ± 0.0150.015 ± 0.005
Desserts 0.20 ± 0.270.228 ± 0.384 0.117 ± 0.177
The data represent the average and standard deviation.
Disclaimer/Publisher’s Note: The statements, opinions and data contained in all publications are solely those of the individual author(s) and contributor(s) and not of MDPI and/or the editor(s). MDPI and/or the editor(s) disclaim responsibility for any injury to people or property resulting from any ideas, methods, instructions or products referred to in the content.

