Abstract
The aim of this work was to assess the brain responses of expert cellists during a real (real-INT) or imagined (imag-INT) interpretation of two musical styles with different learning/training cognitive roots. EEGs of 12 cellists were recorded while they interpreted previously memorized excerpts of tonal-baroque (T) and atonal-contemporary (A) music and at rest (R). Phase synchronization functional connectivity measurements among different cortical regions were computed from the EEG data and at different frequency bands (FB). These were then thresholded using surrogate data tests. Brain network construction and graph-metric analysis were performed for each FB and condition/interpretation. Global graph-indices statistical results showed that regardless of FB: (a) the node degree and density presented significant differences among conditions T, A, and R during imag-INT and between interpretations with real greater than imag-INT only for A; (b) global (NGE) and local (NLE) normalized efficiency (vs. random network), indices measuring network information exchanges, exhibited a similar small-world network structure (SW) in T, A, and R during real-INT; however, during imag-INT, SW changed in T and A but due to a significant NLE increase with NLE(A) greater than NLE(T) and the latter greater than NLE(R). Statistical node topographic maps results showed significant differences for graph degree (real-INT greater than imag-INT) and for NLE (imag-INT greater than real-INT) in A for certain nodes of delta and theta EEG FB networks. Style differences appearing only during imag-INT (e.g., the SW) indicate that imag-INT requires/involves different cognitive functions/processes than those in real-INT. The analysis and previous results allowed the discrimination of representative musical styles from different periods, which receive different cognitive learning in the musicians’ lives.
1. Introduction
Professional musicians interpret different musical styles throughout their careers and also use musical imagination as a tool for training and studying music. This way of working makes the musician an excellent model for the study of different perceptual, cognitive, and emotional functions in processes of imagination. Indeed, it is known that in the process of musical imagination, the musical images formed are a mental representation of the music in which underlying mechanisms of perception are active and committed []. It is also known that, in the absence of sound, specific musical imagination tasks consistently recruit belt and peri-belt regions of the auditory cortex [,] and also enhance functional interactions between the temporal cortex and auditory cortex []. In an analysis of electroencephalographic EEG activity in violinists during both real and imagined interpretation, bilateral activations of the opercular regions were found []. In addition to using EEG analysis, the process of musical imagination induced an increase in the power of the alpha EEG band that was significantly stronger than during musical perception []. In general, the networks involved in musical imagination seem to be associated with auditory processing, sensorimotor coordination, memory retrieval, and cognitive and emotional control [,]. In one of the few studies on brain connectivity during musical performance using fMRI [], it was reported that both real performance and musical imagination involve the supplementary motor area (SMA): musical imagination increased (compared to rest) the connectivity of the SMA with extended brain regions related to cognitive control, motor planning, and syntactic processing. These authors also propose that the SMA network builds “the internal representation of musical performance” by integrating the multimodal information required for representation. Recently, these authors [] also found, during musical imagination, a greater functional connectivity (CF) of the parietal angular gyrus with other brain areas such as the precuneus, hippocampus, and amygdala. With the exception of these works, we do not find in the literature works on brain connectivity during imagined performance compared to the real one, and none that address this comparison in the performance of different musical styles by musicians with different performance/cognitive backgrounds in these styles. We consider this issue to be of interest because of the opportunity/need to teach different musical styles in conservatories. With this purpose, our work addresses the real and imagined interpretation of two musical styles of different musical structure (tonal and atonal) related to different cognitive levels in the learning and professional lives of expert musicians. For this, we use several indices of graph theory applied to the EEG functional connectivity networks computed during the real and imagined interpretation tasks in those styles.
2. Materials and Methods
Participants were 12 right-handed healthy professional cellists, with a mean age of 39.25 ± 6.56 (SD) (7 males and 5 females), more than 20 years of training and experience in musical practice, and active professional practice. They received verbal and written information about the type of study and were previously provided with a document to sign their consent. The two excerpts to be interpreted were: the first (T) consisted of the first 26 s of a tonal excerpt (T) of Sarabande (II Suite for solo cello, J.S. Bach); the second (A) was a transformation of Sarabande composed by one of the authors (A. González, see characteristics at []) with contemporary atonal (A) music characteristics (same duration as T). A month beforehand, each participant received by mail the two musical excerpts that they had to perform in order to train and memorize them. Acquisition of EEG Signals: during the interpretation, inside an electrically isolated room, the participants with the EEG electrode cap on remained seated with their eyes closed and covered by a mask and could hear the start instructions for each task through nearby speakers. A blocked experimental design was used in the EEG study. The whole experiment was conducted in a single session, where the cellist had to start the real (or imagined) interpretation of the extract (T or A) when they received a key word instruction through the speakers and go to resting (R) after 26 s when they received the corresponding order. The process was repeated six times, and the order of the extracts to be performed was altered to avoid habituation according to the block (resting–task) sequence as follows: (R-A-R-T-R-T-R-A-R-T-R-A-R-A-R-T-R-A-R-T-R-T-R-A). Monopolar EEG records were carried out using a 19-electrode cap (frontals Fp1-2, frontals dorsal F3-3 and ventral F7-8, interhemispheric Fz, Cz, temporal T3-4, posterior T5-6, parietal C3, C4, P3, P4, Pz, and occipitals O1-2). The EEG recording procedure, the pre-processing procedure for selecting non-artefactual EEG episodes in each condition, the calculus of the phase synchronization index to estimate the functional connectivity (FC) between the 19 electrode pairs, and the data surrogate test to threshold functional connectivity indices previously to the graph index computations were similar to those used in our recent work []. As in this work, from each 19x19 connectivity matrix, the central topological indices of each EEG-FC network—at each EEG frequency band: delta (0.5–4 Hz), theta (4–8 Hz), alpha (8–13 Hz), beta (13–30 Hz), and gamma (30–48 Hz)—were obtained for each node, and then averaged for all nodes: average node degree and graph density were computed for connectivity global network alteration. Additionally, normalized versus random networks of local (NLE) and global efficiency (NGE)—indices representing how efficiently a network exchanges information at the local and global level (vs. a random network)—were computed to study small-world (NLE > 1; NGE ~1) structure alterations in the different musical conditions considered. Finally, as in [], a MANOVA for repeated measurements test to check the existence—in the global indices of each graph—of statistical differences among repeated factors or significant interactions between them was carried out (here the repeated factors were: real and imagined interpretations; tonal, atonal, and resting conditions; and 5 EEG frequency bands). Moreover, permutation tests—a method that adjusts the p-values in a way that controls for the family-wise error rate—for comparisons between the nodal indices (here the node degree and NLE) of two graphs was performed; from these results, topographic maps of the statistical significance of the graph indices between different contrasts were plotted.
3. Results
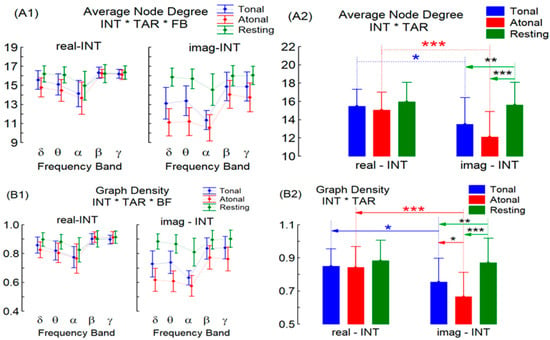
The MANOVA test for the interpretation INT factor was significant for the average node degree (F = 23.76, Degree of Freedom = 1–11 and Probability = 0.000) and graph density (F = 24.26, DF = 1–11 and p = 0.000) with real-INT > imag-INT regardless of repeated factors TAR (tonal T, atonal A, and resting R) and FBs (delta…gamma EEG frequencies). Additionally, the INT * TAR interaction shows significant alteration for degree (F = 8.72, DF = 2–10, and p = 0.006) and density (F = 12.75, DF = 2–10, p = 0.001). Paired post-hoc tests for this interaction (see Figure 1, A2 and B2 for significant p values) show that: (a) the 2 indices were significantly greater during real-INT in T and in A music than during its imag-INT performance; (b) when comparing separately T, A and R conditions during real-INT or imag-INT, only significant results among conditions during imag-INT were found: the 2 graph indices magnitudes were greater at R than during T or A conditions; moreover, T-A differences were significant only for the graph density index (with T > A). Although the INT * TAR * FB interaction does not show statistical significance, their mean values and confidence intervals obtained during real-INT or imag-INT in the 3 performance conditions TAR and in the 5 FBs are shown in Figure 1 (left column) for comparative purposes with the topographic results shown below.

Figure 1.
Mean values (95% confidence interval) for the average node degree (A1,A2) and graph density (B1,B2) of the EEG graph/network. On the left side (A1,B1), the cross interactions (INT * TAR * FB) between the two INT performance modes (real-INT and imag-INT), the 5 frequency bands FB (delta-δ, theta-δ, alpha-δ, beta-δ, and gamma-γ) and the 3 musical conditions (tonal, atonal music, and rest) can be visualized. In the right column (A2,B2) the INT * TAR cross-interactions (irrespective of FB) between real-INT/imag-INT and the 3 musical conditions are shown. Asterisks * are for the significance levels of the posteriori comparisons between pairs of repeated factors (* for p < 0.05, ** for p < 0.01, and *** for p < 0.001).
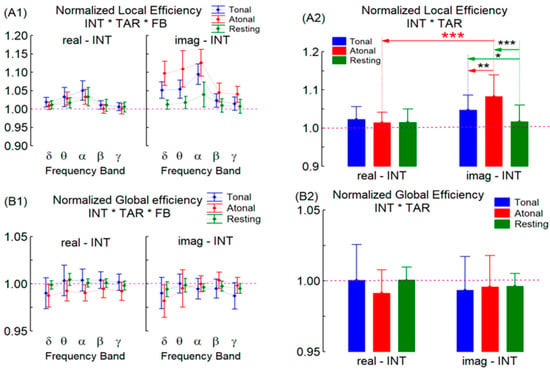
The results of the MANOVA test corresponding to the normalized (vs. random network) local (NLE) and global (NGE) efficiencies show only significant results for NLE. Indeed, NLE showed significant results for the INT factor (F = 26.12, DF = 1–11 and p = 0.000), resulting in greater imag-INT than real-INT. Figure 2 shows that the NLE and NGE magnitudes were closest to those expected for a small-world type network (NGE ~ 1 and NLE > 1), mainly during real-INT for all TAR conditions and FBs. During imag-INT, the small-world network structure alters—in relation to the real-INT performance—because NLE increase (irrespective of TAR and FB) but NGE does not change. Furthermore, it was found that the IN * TAR factor shows significant interactions (F = 12.60, DF = 2–10 and p = 0.001): while in real-INT there were no NLE changes with TAR conditions, during imag-INT the NLE was greater during T and A than in R and also was greater in A than in T (see statistical levels at Figure 2(A2)). Therefore, small-world deviation (due to NLE alterations) appears only during imag-INT, and it is because NLE moved away from 1 (i.e., the network increases its local information transfer relative to that of a random network) while NGE (the global information transfer indices) does not change. In addition, during imag-INT, this effect appears more prominent during A than during T music, which is near the R condition. This result did not manifest during real-INT.

Figure 2.
As in Figure 1, but for the normalized local (A1,A2) and global (B1,B2) efficiencies of the EEG graph/network. The red line indicates the limit value for a random network according to the selected normalization process. (* for p < 0.05, ** for p < 0.01, and *** for p < 0.001).
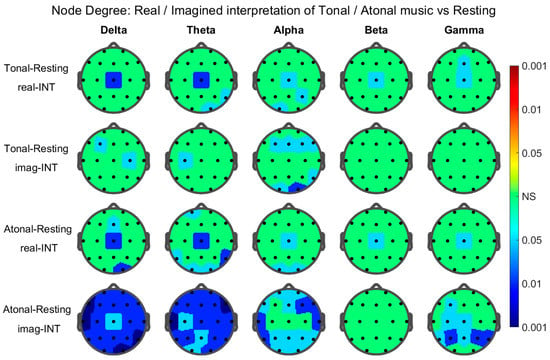
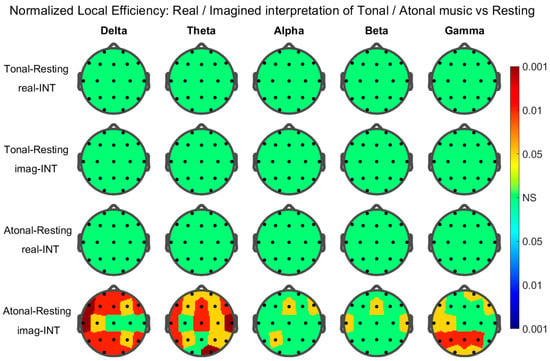
Results of the graph metric at the node level: topographic maps. Only the head-maps and nodes that presented statistical significance through the corresponding permutations test were plotted and/or pointed out below. The results for the average node degree were as follows (Figure 3): Significant nodes during real-INT in the tonal–resting contrast: Delta Band: Cz. Theta Band: T6, O2, and Cz. Alpha Band: O1, P4, and Cz. Beta Band: Cz. Gamma Band: Fz and Cz. During imag-INT (IMG) tonal–resting contrast: Delta Band: F3 and C4. Theta Band: C3. Alpha Band: F3, O1, F4, F8, T6, O2, and Fz. During real-INT for atonal–resting contrast: Delta Band: O2, Fz, and Cz. Theta Band: Fp1, T5, O1, T6, O2, and Cz. Alpha Band: O1, O2, and Cz. Beta Band: Cz. Gamma Band: Cz. During imag-INT atonal–resting contrast: Delta Band: all nodes. Theta Band: all nodes. Alpha Band: all nodes except F3, C3, Cz, and C4. Gamma Band: F3, C3, P3, T5, P4, T6, Cz, and Pz. The results for the normalized local efficiency were as follows (Figure 4): Significant nodes existed only in atonal–resting contrast, they were: Delta Band: all nodes except Cz, C4, and T4. Theta Band: all nodes except C3, Pz, and O. Alpha Band: P3, F8, and Fz. Beta Band: T3, T4, and Fz. Gamma Band: F7, C3, T3, P3, T5, O1, Fp2, F8, P4, O2, and Pz.

Figure 3.
Statistical significance values of the node degree Tonal-Resting or Atonal-Resting difference during real (real-INT) and imagined (imag-INT) interpretations (left column) for the five graphs/head nodes of each EEG frequency band indicated. The color area around each node corresponds to the significance level P in the color bar on the right (valid to all heads); the colors were associated with the three levels of significance (p < 0.001, p < 0.01, and p < 0.05) by using three ranges of reds when the difference was positive or three ranges of blues when it was negative. NS in green for nodes without statistical significance.

Figure 4.
As in Figure 3 but for the normalized local efficiency.
4. Discussion
The real interpretation (real-INT) of the tonal (T) and atonal (A) music extracts similarly alters the cortical connectivity by decreasing the nodal degree (versus resting (R)) of the interhemispheric central frontal cortical area Cz, which underlies the supplementary and primary motor areas (MA). This effect occurs mainly in the networks/graphs of the delta and theta frequency bands (FB) (see Figure 4). The imagined interpretation (imag-INT) of T music does not produce this effect nor significantly alter the global connectivity in any of the networks of the different FBs. On the contrary, the imag-INT of extract A prominently modifies cortical connectivity, decreasing the nodal degree vs. R of most of the cortical zones in the delta and theta networks, of the temporal zones (mainly T3, T4) in the alpha network, and of the parietal nodes in the gamma network. Therefore, the responses to the real-INT of both styles T and A are similar, involving in both styles the cortical motor zone close to the MA, and do not differ in any of the FB networks. However, the response to the imag-INT of both styles is totally different, inappreciable in T music and very prominent in the case of A music. From these results, it seems that the real-INT in the selected EEG paradigm is not able to discriminate musical styles; only the motor activity of the musician related to body postural stabilization and coordination of both sides during bimanual action, that is, the control of movements that are internally generated rather than triggered by sensory events, seems to be reflected. In fact, in our paradigm, only alterations in the connectivity of MA appear without differences between T and A styles. On the contrary, imag-INT clearly discriminates between both music styles; it seems that in this kind of interpretation, cognitive, and emotional requirements predominate, whereas in our EEG paradigm, no motor areas except during A are reflected. At this respect, it must be argued that T music is a form whose structure and syntax are rooted in the brain development of the musician from the beginning of his professional learning. On the other hand, the A music does not have the same cognitive and emotional root as the T one, which would explain the results of the imag-INT of A music. The only work with which we can compare our results is one in which it is reported that during the imagined interpretation of tonal music in an fMRI analysis [], the connectivity of the SMA area with other brain centers is altered. Our results do not coincide with those of these authors; we found alterations in EEG connectivity near the MA area in the real interpretation of music T and A. Only in the imagined interpretation of music A did we find cortical motor areas involved in some of the FC-EEG networks (delta, theta, and gamma). Probably the different paradigms used are the causes of the discrepancies. Finally, the results of the indices measuring the transmission efficiency of local and global information in each EEG network analyzed here are conclusive: only the imagined interpretation of atonal music produces important alterations of the small-world structure by increase (in relation to a random network) the local efficiency, mainly in the delta, theta, and gamma networks, and the different cortical zones depending on the network. Therefore, the imagined interpretation of the style of music that has a lesser cognitive root in the musician is the one that seems to produce a cortical response (in our paradigm), which is clearly different from music styles that are more rooted in the brain of the musician.
Author Contributions
A.G.: conceptualization; methodology; writing—review and editing; C.M.: methodology, formal analysis; M.S.: original draft preparation, data curation, visualization; J.J.G.: investigation, resources, writing, supervision. All authors have read and agreed to the published version of the manuscript.
Funding
This research received no external funding.
Institutional Review Board Statement
The study was conducted according to the guidelines of the Declaration of Helsinki and approved by the Ethics Committee of Universidad de La Laguna (CEIBA2014-0098).
Informed Consent Statement
Informed consent was obtained from all subjects involved in the study.
Data Availability Statement
The data presented in this study are available upon request to the corresponding author. The data are not publicly available because they are being expanded for a more extensive and complete study.
Acknowledgments
The authors would like to thank the University of La Laguna for providing the means to carry out this research.
Conflicts of Interest
The authors declare no conflict of interest.
References
- Schaefer, R.S.; Morcom, A.M.; Roberts, N.; Overy, K. Moving to music: Effects of heard and imagined musical cues on movement-related brain activity. Front. Hum. Neurosci. 2014, 8, 774. [Google Scholar] [CrossRef] [PubMed]
- Zatorre, R.J.; Halpern, A.R. Mental Concerts: Musical Imagery and Auditory Cortex. Neuron 2005, 47, 9–12. [Google Scholar] [CrossRef] [PubMed]
- Herholz, S.C.; Lappe, C.; Knief, A.; Pantev, C. Neural basis of music imagery and the effect of musical expertise. Eur. J. Neurosci. 2008, 28, 2352–2360. [Google Scholar] [CrossRef] [PubMed]
- Herholz, S.C.; Zatorre, R.J. Musical training as a framework for brain plasticity: Behavior, function, and structure. Neuron 2012, 76, 486–502. [Google Scholar] [CrossRef] [PubMed]
- Kristeva, R.; Chakarov, V.; Schulte-Mönting, J.; Spreer, J. Activation of cortical areas in music execution and imagining: A high-resolution EEG study. Neuroimage 2003, 20, 1872–1883. [Google Scholar] [CrossRef] [PubMed]
- Schaefer, R.S.; Vlek, R.J.; Desain, P. Music perception and imagery in EEG: Alpha band effects of task and stimulus. Int. J. Psychophysiol. 2011, 82, 254–259. [Google Scholar] [CrossRef] [PubMed]
- Herholz, S.C.; Halpern, A.R.; Zatorre, R.J. Neuronal correlates of perception, imagery, and memory for familiar tunes. J. Cogn. Neurosci. 2012, 24, 1382–1397. [Google Scholar] [CrossRef] [PubMed]
- Kraemer, D.J.; Macrae, C.N.; Green, A.E.; Kelley, W.M. Sound of silence activates auditory cortex. Nature 2005, 434, 158. [Google Scholar] [CrossRef] [PubMed]
- Tanaka, S.; Kirino, E. Dynamic reconfiguration of the supplementary motor area network during imagined music performance. Front. Hum. Neurosci. 2017, 11, 606. [Google Scholar] [CrossRef] [PubMed]
- Tanaka, S.; Kirino, E. Increased functional connectivity of the angular gyrus during imagined music performance. Front. Hum. Neurosci. 2019, 13, 92. [Google Scholar] [CrossRef] [PubMed]
- González, A.; Manuel Santapau, M.; Gamundí, A.; Pereda, E.; González, J.J. Modifications in the Topological Structure of EEG Functional Connectivity Networks during Listening Tonal and AtonalConcert Music in Musicians and Non-Musicians. Brain Sci. 2021, 11, 159. [Google Scholar] [CrossRef] [PubMed]
Disclaimer/Publisher’s Note: The statements, opinions and data contained in all publications are solely those of the individual author(s) and contributor(s) and not of MDPI and/or the editor(s). MDPI and/or the editor(s) disclaim responsibility for any injury to people or property resulting from any ideas, methods, instructions or products referred to in the content. |
© 2021 by the authors. Licensee MDPI, Basel, Switzerland. This article is an open access article distributed under the terms and conditions of the Creative Commons Attribution (CC BY) license (https://creativecommons.org/licenses/by/4.0/).